Embed Size (px)
Citation preview
Evidence for different gas/particle partitioning of water-soluble organic compounds
in two urban atmospheres with contrasting emissions
X. Zhang, J. Liu, E. T. Parker and R. J. Weber
Georgia Institute of Technology
CalNex Data Analysis Workshop
May 16-19, 2011
Sacramento, CA

Gas and Particle Water-Soluble Organic Carbonmeasurements during CalNex
WSOCg:
Mist Chamber – TOC(H > 103M/atm)
TOC
WSOCp:
PILS – TOC (PM2.5)
One 5-min sample every 10 mins

Determine WSOC partitioning
Fp = WSOCp
WSOCp + WSOCg
(Hennigan et al., GRL, 2008)
Fp - the fraction of total WSOC in the particle phase
Investigate Fp as a function of:
BVOC & AVOC
SVOC Water (haze, cloud)
stableOH, O3 NO3
KH
1) Relative humidity (LWC) 2) Organic carbon mass
CalNex (May-Jun, 2010)
Atlanta (Aug-Sep, 2010)
SVOC Organic Aerosol
BVOC & AVOC
OH, O3 NO3
Two data sets:
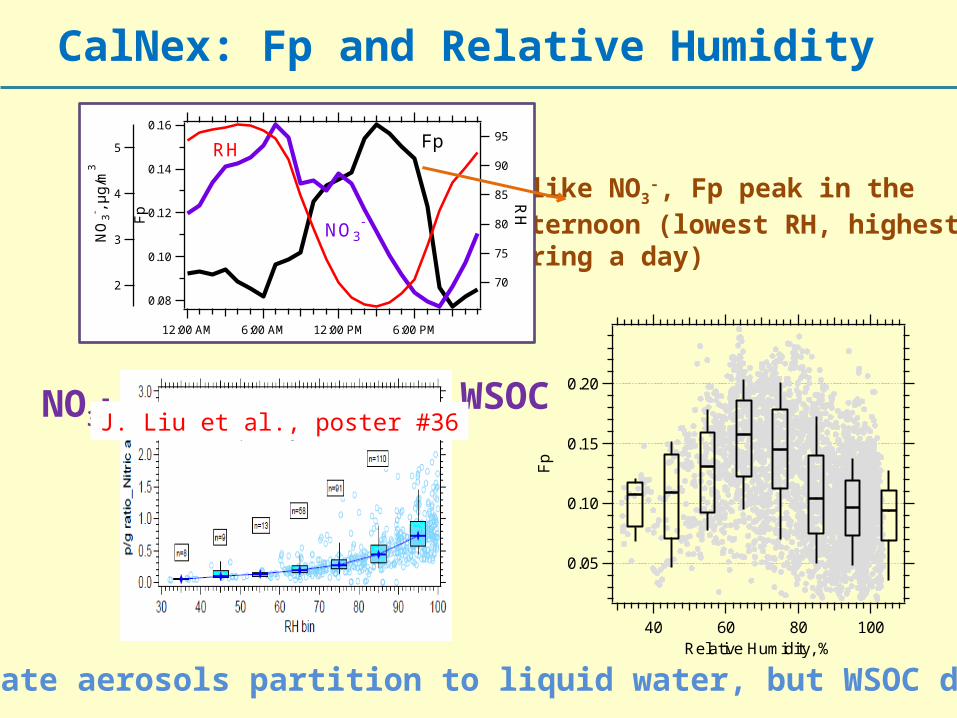
CalNex: Fp and Relative Humidity
Nitrate aerosols partition to liquid water, but WSOC don’t..
Unlike NO3-, Fp peak in the
afternoon (lowest RH, highest T during a day)
NO3- WSOC
0.16
0.14
0.12
0.10
0.08
Fp
12:00 AM 6:00 AM 12:00 PM 6:00 PM
5
4
3
2
NO
3- ,
µg
/m3
95
90
85
80
75
70
RH
RH Fp
NO3-
0.20
0.15
0.10
0.05F
p
100806040Relative Humidity, %
J. Liu et al., poster #36
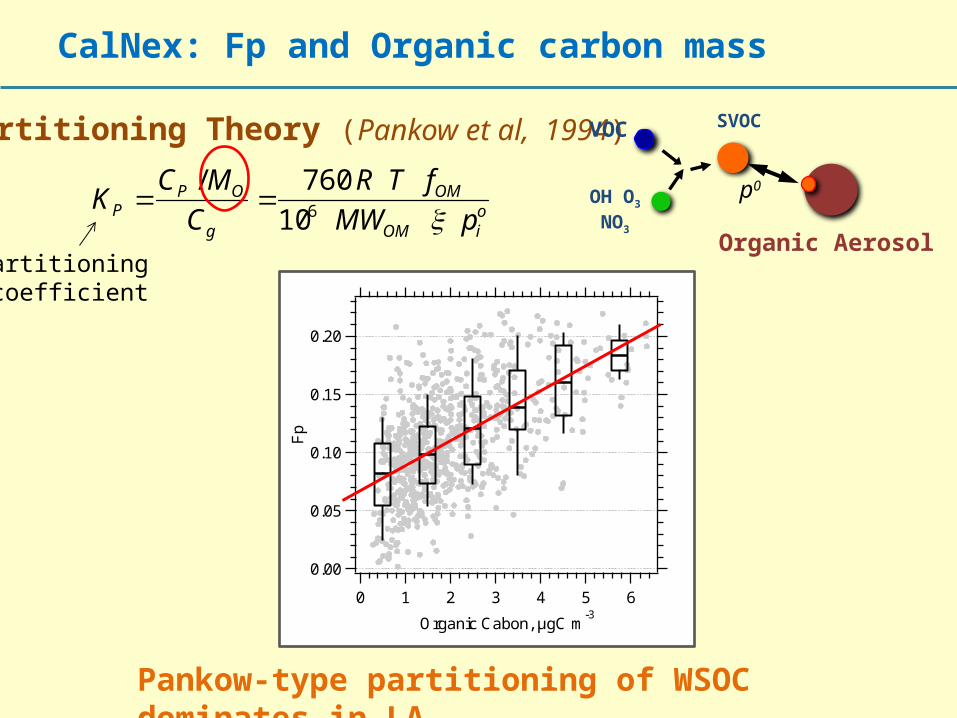
CalNex: Fp and Organic carbon mass
Partitioning Theory (Pankow et al, 1994)
KP CP /MO
Cg
760 R T fOM106 MWOM pi
oOH O3 NO3
SVOC
Organic Aerosol
VOC
p0
Partitioning coefficient
Pankow-type partitioning of WSOC dominates in LA
0.20
0.15
0.10
0.05
0.00
Fp
6543210
Organic Cabon, µgC m-3

Estimated VOC Emissions in LA and Atlanta
4x10¹²
3
2
1
0
Iso
pre
ne
Em
issi
on
(mo
lecu
leC
cm
-2 s-1
)
LA bio ATL bio
30x1012
20
10
0
AV
OC
Em
ission
(mo
lecu
leC
cm-2
s-1)
LA anthro ATL anthro
4.8 times 1.7 times
Isoprene Anthrop. VOCs
(Müller et al., ACP, 2008)
LA: Anthrop. VOCs dominant
ATL: Biogenic VOCs dominant

SOA formation in Atlanta very different from LA
In Atlanta (and other sites in eastern US) no clear diurnal trend to SOA
WSOCp
5
4
3
2
1
Fin
e p
art
icle
WS
OC
, µ
gC
/m3
8/6/2010 8/11/2010 8/16/2010 8/21/2010 8/26/2010 8/31/2010 9/5/2010 9/10/2010
Eastern Standard Time
AtlantaSummer 2010: WSOC(SOA) with no diurnal trendWSOCp
Rain
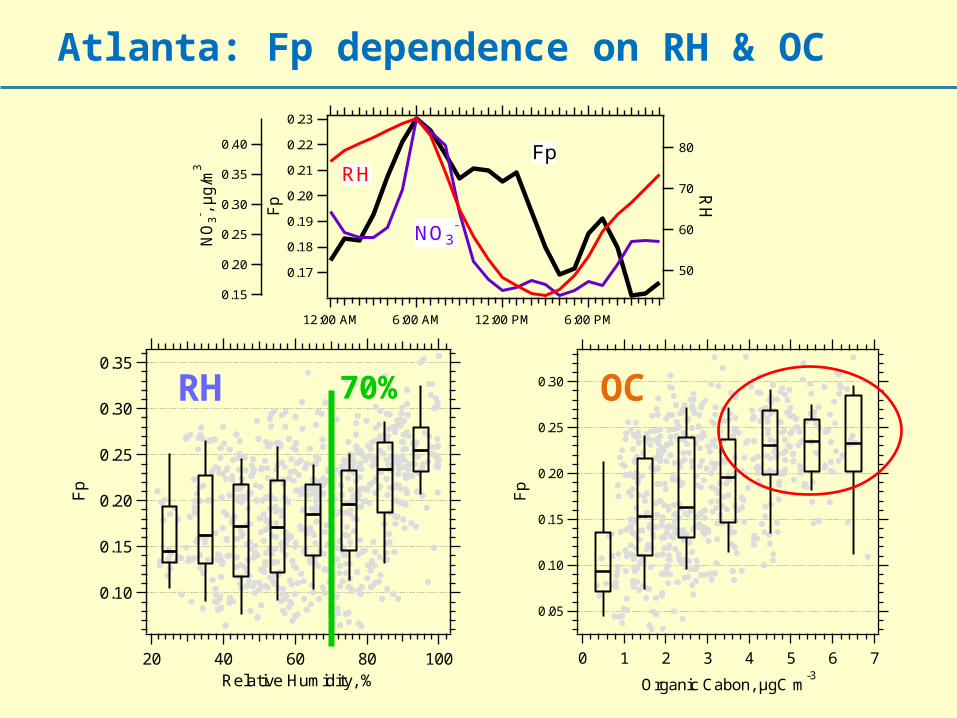
Atlanta: Fp dependence on RH & OC0.23
0.22
0.21
0.20
0.19
0.18
0.17F
p
12:00 AM 6:00 AM 12:00 PM 6:00 PM
0.40
0.35
0.30
0.25
0.20
0.15
NO
3- ,
µg/m
3
80
70
60
50R
H
RHFp
NO3-
0.30
0.25
0.20
0.15
0.10
0.05
Fp
76543210
Organic Cabon, µgC m-3
OCRH0.35
0.30
0.25
0.20
0.15
0.10
Fp
10080604020Relative Humidity, %
70%
0.30
0.25
0.20
0.15
0.10
0.05
Fp
76543210
Organic Cabon, µgC m-3
Atlanta
RH < 70 RH > 70
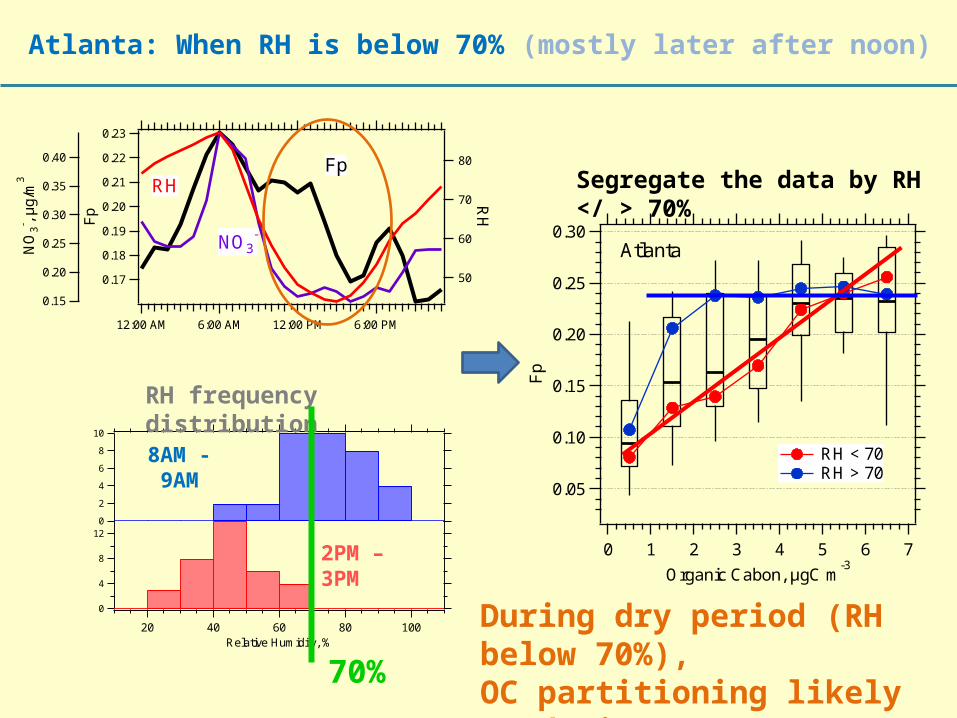
Atlanta: When RH is below 70% (mostly later after noon)
12
8
4
0
10080604020Relative Humidity, %
10
8
6
4
2
0
ATL 8AM-9AM ATL 2PM-3PM
RH frequency distribution
8AM -9AM
2PM –3PM
Segregate the data by RH </ > 70%
0.23
0.22
0.21
0.20
0.19
0.18
0.17
Fp
12:00 AM 6:00 AM 12:00 PM 6:00 PM
0.40
0.35
0.30
0.25
0.20
0.15
NO
3- ,
µg/
m3
80
70
60
50
RH
RHFp
NO3-
70%
During dry period (RH below 70%), OC partitioning likely to dominate;

0.23
0.22
0.21
0.20
0.19
0.18
0.17
Fp
12:00 AM 6:00 AM 12:00 PM 6:00 PM
0.40
0.35
0.30
0.25
0.20
0.15
NO
3- ,
µg
/m3
80
70
60
50
RH
RHFp
NO3-
Atlanta: Examine Fp dependence during daily transition from wet to dry periods
12
8
4
0
10080604020Relative Humidity, %
10
8
6
4
2
0
ATL 8AM-9AM ATL 2PM-3PM
8AM -9AM
2PM –3PM
“wetter period” [5AM, 11AM]
“drier period” [12PM, 6PM]
0.30
0.25
0.20
0.15
0.10
0.05F
p
76543210
Organic Cabon, µgC m-3
0.30
0.25
0.20
0.15
0.10
0.05
Fp
76543210
Organic Cabon, µgC m-3
0.35
0.30
0.25
0.20
0.15
0.10
Fp
10080604020Relative Humidity, %
0.35
0.30
0.25
0.20
0.15
0.10
Fp
10080604020Relative Humidity, %
RH OC
RH OC

Evidence from other species and studiesCalNex vs. Atlanta formic acid partitioning (J. Liu et al., poster#36)
0.35
0.30
0.25
0.20
0.15
0.10
Fp
12108642Organic carbon
9am to 1pm 12pm to 6pm
0.40
0.35
0.30
0.25
0.20
0.15
Fp
10080604020
Relative Humidity
9am to 1pm 12pm to 6pm
5-month (May – Sep, 2007) in Atlanta by Hennigan et al.
RH OC

Summary In LA, WSOC partitioning consistent with absorption to organic mass
(Pankow’s theory) with no clear dependence on particle water (RH); August In Atlanta, WSOC partitioning has a transition from evidence
for partitioning to particle water at night into late morning to some evidence for partitioning to organic mass in afternoon when particle is dry; Also, Formic acid partitioning in Atlanta related to LWC, not so much in LA (J. Liu et al., poster#36) Overall, during a longer time period (May-Sept), WSOC partitioning
most obvious to LWC (Hennigan et al., 2009) Why the difference?
Different VOC mixture in the two urban atmospheres; Different dispersion/dilution patterns.
Implication: is it appropriate to apply one mechanism to predict SOA in all types of environments?

Characteristics of WSOCp in the SoutheastUrban/Rural Diurnal Tends-AMIGAS
Average over more than 1 month
Time of day
~ 70 km apart
Atlanta
Yorkville (NW of Atl)
Atlanta signal riding on large regional signal some evidence for a daytime increase (urban photochemical SOA?), 20%
WSOCp
Small, but measurable, primary WSOCp at urban site
Summer 2008
Zhang et al. 2011
urban
rural
13