Embed Size (px)
Citation preview

Climate Dynamics (1992) 6:169-177
Holocene change
Climate Uynumiu
© Springer-Verlag 1992
Evidence for an early Holocene climatic optimum in the Antarctic deep ice-core record* P Ciais I , JR Petit 2' 1, j Jouzel 1,2, C Lorius 2, NI Barkov 3, V Lipenkov 4, and V Nicola'iev 4
1 Laboratoire de G~ochimie Isotopique, CEA/CEN Saclay, DSM, F-91 191 Gif sur Yvette cedex, France 2 Laboratoire de Glaciologie et de G~ophysique de l'Environnement, BP 96, F-38402 Saint Martin d'H~res cedex, France 3 Arctic and Antarctic Research Institute, Beringa Street 38, Leningrad 199226, USSR 4 Institute of Geography, Academy of Science of the USSR, Staromonetny 29, Moscow 109107, USSR
Received August 26, Accepted September 10, 1991
Abstract. In the interpretation of the Antarctic deep ice-core data, little attention has been given to the Ho- locene part of the records. As far as translation of the stable isotope content in terms of temperature is con- cerned, this can be understood because expected tem- perature changes may be obscured by isotopic noise of various origins and because no 14C dating has yet been available for this type of sequence. In this article, we focus on the Dome C and Vostok cores and on a new 850-m long ice core drilled out at Komsomolska'ia by the Soviet Antarctic Expeditions. These three sites are located in East Antarctica, on the Antarctic plateau, in a region essentially undisturbed by ice-flow conditions, so that their detailed intercomparison may allow us to identify the climatically significant isotopic signal. Our results compare well with the proximal records of Southern Hemisphere high latitudes and support the existence of a warmer "climatic opt imum" between 10 and 6 k a y BP. Maximum temperatures are reached just at the end of the last deglaciation, which confirms pre- vious observations at high latitudes, in contrast with later dates for the Atlantic and hypsithermal optima in Europe and North America.
Introduction
The period since the last deglaciation has been charac- terized by relatively stable climatic conditions with fluctuations in the global average temperature that never exceeded 2 ° C. It is not clear, however, whether those fluctuations were global or not. Central and west- ern Europe, China, eastern North America and Japan have experienced higher temperatures (at least in sum- mer) during the mid-Holocene approximatively around
* Contribution to Clima Locarno - Past and Present Climate Dy- namics; Conference September 1990, Swiss Academy of Sciences - National Climate Program
Offprint requests to. P Ciais
6 ka BP (Huntley and Prentice 1988; Webb 1985; Yo- shino and Uruchibara 1978; Zhang and Wang, submit- ted). The curve presented in Fig. 1 displays the general trends in global temperature over the last 10 4 years. Re- versely, if we consider high latitudes in the Canadian Arctic, as well as in southern Patagonia, Tasmania and New Zealand, there is no convincing evidence for an Holocene thermal optimum centered around 5-6 k a y BP (Macphail 1979; Markgraf 1989; Newnham, per- sonal communication; Ritchie et al. 1983), but instead during the early Holocene simultaneously with the maximum summer solar radiation in the Northern Hemisphere. Lastly, there is no very clear indication of a climatic optimum in the two Greenland deep ice cores (Camp Century and Dye 3), but this may be due to the change in the origin of the ice owing to the fact that these two cores are not drilled on a summit (S. Johnsen, personal communication).
Antarctic ice cores offer us the opportunity to study Holocene climatic variations on the basis of contin- uous, high-resolution records. The isotopic content of ice layers (deuterium or 180) allows access to important climatic parameters such as temperature and, more in- directly, precipitation rates or moisture conditions in the water vapor source regions (Dansgaard 1964; Jou- zel et al. 1982, 1989a, b; Petit et al. 1991). Nevertheless, because of various sources of noise in the isotopic sig-
?
=S o
a) {3. E ¢p
I - -
Holocene maximum Little ice age
i i 1 I I I 1 I 10,000 8,000 6 ,000 4 ,000 2 ,000 0
Years before present
Fig. 1. Global average temperature variations during the Holo- cene (Folland et al. 1990)
170 Ciais et al.: Evidence for an early
nals (Fisher et al. 1985; Robin 1983), a detailed study of the Holocene period must be undertaken cautiously. In this paper we present and discuss principally deep ice- core data from central East Antarctica (Fig. 2) for
~o 6o~/
-90w 9OK"
Fig. 2. Map of Antarctica showing location of the drilling sites
Holocene climatic optimum in the Antarctic deep ice-core record
which, at least over the last 10 ka y, neither ice flow conditions nor changes in the ice thickness are likely to bias the structure of the climatic records. On the other hand, the very low accumulation rates in this region (a few centimeters per year) has the effect of enhancing the isotopic noise, such as that linked with the relative distribution of winter and summer snow, and prevents dating by counting well-defined year-to-year varia- tions.
We will therefore need to consider the translation of isotopic contents in terms of temperature and the choice of an adequate chronology for our records; the approach proposed here is based on glaciological mod- els, which are unfortunately highly dependent on the poorly known local accumulation data. The aim of the discussion itself is to provide a coherent picture of the Antarctic Holocene climate, to compare our results with those available from pollen palaeodata in the nearest terrestrial areas, and to discuss them in a more global perspective.
The isotopic profiles
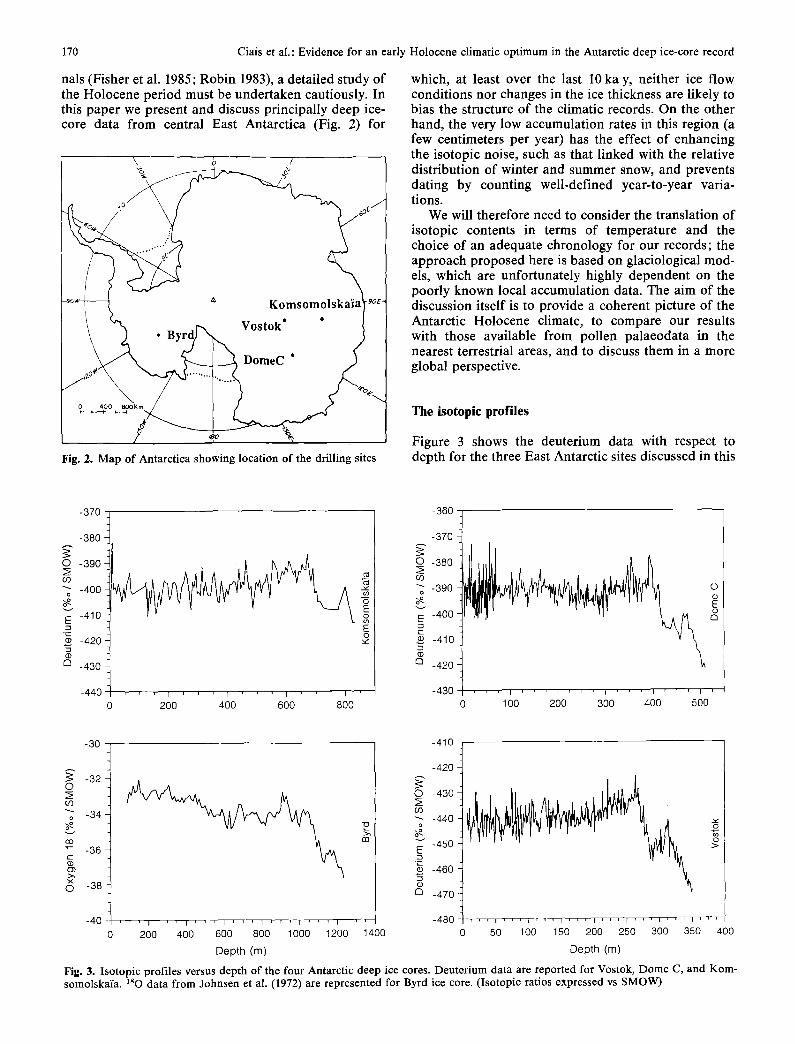
Figure 3 shows the deuterium data with respect to depth for the three East Antarctic sites discussed in this
O
09
o
o~ v
E
(D tm
-370
-380
-390
-400
-410
-420
-430
-440
E o , ¢
' I ' I ' I ' I
200 400 600 800
-360
- 3 7 0
O -380
"" -390 o
E -400
-410
o
0 -420
-430
E 8
' l ' ' ' l ' ' ' f ' ' I ' r r '
0 100 200 300 400 500
-30 -410
-32 0
( ,9
"" -34 o
g
~ -36 g
O -38
-40 , T , I i , , I ' '
0 200 400 , I ' ' ' I ~ ' ' I ' ' , I
600 800 1000 1200
Depth (m)
" o
-420
O -430
09
"- -440 o
-450 E 'F-_
-460 "5
~ -470
-480
>
1400 0 50 100 150 200 250 300 350 400
Depth (m)
Fig. 3. Isotopic profiles versus depth of the four Antarctic deep ice cores. Deuterium data are reported for Vostok, Dome C, and Kom- somolskaia. 1sO data from Johnsen et al. (1972) are represented for Byrd ice core. (Isotopic ratios expressed vs SMOW)
Ciais et al.: Evidence for an early Holocene climatic optimum in the Antarctic deep ice-core record 171
article long with the oxygen 18 profile measured along the Byrd ice core in West Antarctica (Johnsen et al. 1972) for the period covering the Holocene and part of the last deglaciation.
The 905-m-long ice core obtained at Dome C, an ice divide region (elevation: 3240 m; annual temperature; - 53.5 ° C and mean accumulation: 3.4 g cm -2 y-a) has previously been studied both concerning the full record (Jouzel et al. 1982; Lorius et al. 1979) and over the last two millenium (Benoist et al. 1982). The excellent core recovery has made possible isotopic measurements on a quasi-continuous basis. The Holocene period covers the top 400 m.
At Vostok station, located at 72 ° 28'S, 106 ° 48'E, the present mean temperature is -55.5° C with a snow ac- cumulation rate of about 2.3 g cm -2 y-1. A drilling program initiated two decades ago permitted a depth of 2546 m to be reached in 1989. The climatic record for the top 2083 m, which spanned a whole climatic cycle over the last 160000 years, has been presented else- where (Lorius et al. 1985, 1987, 1989a, b). Four cores cover at least the Holocene period, corresponding to depths from the surface to 300 m. We will now focus our attention on the deuterium data from core 3 F, only available below 138 m, with some 8 m of ice missing during the transition, and on the new adjacent core 4F. The latter has been sampled continuously on a 1-m ba- sis thin strip parallel to the core, from the surface down to 281 m, and every 50 cm in the interval 281-400, cor- responding to the last deglaciation. The profile shown in Fig. 3 results from a combination of those two data sets. An intercomparison between those records is pro- posed (see section 'isotopic temperature noise') in order to estimate the noise in the temperature-isotope rela- tionship that affects our sequences at a given site.
The new deep ice core presented here has been ex- tracted using the thermal drilling technique by the So- viet Antarctic Expeditions at the summer camp of Komsomolskaia in 1983, and it extends to 850 m. The site location is 74 ° 05'S, 97 ° 29'E with an annual tem- perature of - 52.6 ° C and an average accumulation rate at least twice higher than at Vostok station (about 5 g cm -2 y-1 according to Young et al. 1982). We car- ried out deuterium measurements in 2-m-long sections, selected every 5 m along the core. Ice is missing be- tween 77 and 120 m and the resolution is reduced to 1 sample every 25 m below 725 m. Note that an 180 pro- file was obtained in parallel at the Institute of Geogra- phy in Moscow (Nikolaiev et al. 1988); a detailed inter- comparison of the two isotopic profiles (riD and fi180) and of the variation in deuterium-excess (d = r D - r 1 8 0 ) will be done elsewhere.
l e e c o r e c h r o n o l o g y
Although various methods may be used to provide dat- ing for ice cores, no absolute dating is available in the case of our records. Owing to the very low accumula- tion values in high elevation regions of the ice sheet, both the removal process at the surface and the diffu-
sion of isotopic species in firn may smooth out the sea- sonal variations of the isotopic signal (Johnson 1977, 1983; Whillans and Grootes 1985). The method that is employed here is thus based on specific ice flow mod- els. In central East Antarctica where the three cores ori- ginate, the ice sheet velocities do not exceed a few me- ters per year (Budd et al. 1971), and the Holocene pe- riod covers depths sufficiently distant from the bedrock so that the sequences are quasiundisturbed by ice-flow conditions. We will first recall here how the Dome C and Vostok time scales were established.
For the Dome C core, located in an ice dome region, a simple unidimensionnal vertical thinning model as- suming constant vertical strain rate was used (Lorius et al. 1979). An attempt was made to account for the fact that accumulation was lower during the glacial than during the Holocene period because the amount of pre- cipitation over the Antarctic plateau is essentially con- trolled by the mass of water vapor available in the in- version layer and thus by the temperature of this layer (Robin 1977). Lorius et al. (1979) simply assumed that the accumulation during the glacial part of the record was 75% of that during the Holocene, with a linear in- crease toward the Holocene value during the climatic transition. This variable accumulation approach was further refined by Benoist (1986) in assuming that the accumulation rate is directly proportional to the deriva- tive of the saturation vapour pressure is formulated by Eq. (1.1), in which a (z) is the accumulation (z being the depth), a (0) its present value and Ty the temperature of formation of the precipitation.
a (z) = a (0) (tiPs~fiT)To(z) (1.1) ( rPs / rT )Ts (o )
This improvement had the noticeable result of ex- tending the Dome C chronology at the bottom of the core from 32 to 39 kay BP (Benoist 1986; Jouzel et al. 1989a, b). For the upper part of the record we are dis- cussing here, the difference between the two chronolog- ies never exceeds a few hundreds of years. For exam- ple, for z=450 m, the ages are respectively 12.1 kay BP (Lorius et al. 1979) and 12.5 kay BP (Benoist 1986).
The chronology of' Vostok is based on a two-dimen- sional steady-state glaciological model, in which the known bedrock and surface elevations along the flow line are introduced (Lorius et al. 1985; see Ritz, to be published, for a full description). In this dating method, the saturation vapor pressure approach was used based on the discontinuous oxygen 18 profile then available. This dating was further slightly modified using the con- tinuous deuterium profile (Jouzel et al. 1989) with no noticeable change in the Holocene part of the record. Remarkably, these Dome C and Vostok datings with common use of the saturation vapor pressure approach put the a°Be peaks discovered at Vostok around 600 m and that at Dome C around 820 m (Raisbeck et al. 1985) practically in phase, so that those datings with a further minor adjustment (3% for Dome C) were ad- opted by Jouzel et al. (1989).
We have reported in Fig. 4 the upper part of the Dome C and Vostok smoothed deuterium records

172 Ciais et al.: Evidence for an early Holocene climatic optimum in the Antarctic deep ice-core record
~" -370
o -380 03
-390
~'~ -4OO
~ -410
£3
-420
- 440 O
O co
° - 460 CO - - 4 3 0 ~
- - 4 4 0 ~ E
--460 ~ ~ -480
-460 ~-
-470 , , , I , , , i ' , , i ' ' ' i , , , i , , , 112 , , , i , ' '
2 4 6 8 10 14 16
A g e (Kyr BP)
Fig. 4. Dome C and Vostok isotopic profiles with respect to depth over the last 15 000 y. Deuterium data are reported with the time scales as dicussed in Jouzel et al. (1989a)
?
• O
ID_ E ~- -2
0 2 4 6 8 10 12 14
A g e (Kyr BP)
-3
o ° -1
-2 Vostok °
E -3
~- o -4 Komsomolskaia
"" - ' , t" - -260 oo -5 Byrd v
".,, . . . . . !.x.._. . " J \ . " ' " 270 r~
\ x ~ - - 2 8 0 co
~." -290 x ~
, , i , , , i , , , i , , , i , , , [ , , , i , ~ , / -300 O
0 2 4 6 8 10 I 2 14
A g e (Kyr BP)
Fig. 5. H o l o c e n e c l imat ic ice cores records o f D o m e C, Vostok, a n d Komsomolska ' / a . T e m p e r a t u r e scales are exp re s sed as a dis- t ance to m e a n va lues at each site over the las t 5000 y. (Vos tok translated 1.5°C and Komsomolskaia of 3 ° C.) Byrd: right scale in ~sO x 7.9 for the sake of comparison with &D. The upper figure shows the average temperature curve obtained from the three East Antarctic ice cores
-500
120 140 160 180 200 220 240 260 280 300 320 340 360
Depth (m)
Fig. 6. I so top ic prof i les ve r sus dep th f rom ad jacen t cores 3 F a n d 4F at vostok station. The common part of the two bore holes un- der study extends between 138 and 280 m. (Core 4Fvertical scale translated 23%0)
(down to 15 k a y BP) using these time scales. These two isotopic profiles show a typical cool oscillation that oc- curred during the second half of the last climatic transi- tion, starting apparently 1 ka y earlier at Dome C than at Vostok. Jouzel et al. (1991, in press) fully discussed this part of the Antarctic records and the possible link between this cold revearsal and the well-documented Northern Hemisphere Younger Dryas event. We give here only their conclusions as far as dating is con- cerned. First, the non-synchronousness between the Dome C and Vostok cold revearsal is not real but due to dating uncertainties. This is supported by the dust records and may indeed be accounted for by uncertain- ties in the assumptions used for estimating the accumu- lation rate. As noted in Jouzel et al. (1989a, b), the ac- cumulation at Dome C is about 10% less from 1815 to the present than over the last 30 years. Note that com- pared to that, the uncertainty about the accumulation associated with the glaciological models themselves is quite negligible. Secondly, there is no firm argument that would permit us to know accurately the absolute age of this Antarctic cold reversal.
In view of these results, we have chosen to put the Dome C and Vostok cold reversals in phase by simply decreasing the Vostok modern accumulation rate by 12% and keeping the Dome C chronology unchanged (see Fig. 5). This choice is quite arbitrary but is provi- sionally adopted because it has the advantage of put- ting the beginning of the cold reversal in phase with that seen in the 1sO record of the Byrd ice core in West Antarctica (also reported in Fig. 5) and dated indepen- dently by H. B. Clausen and C. U. Hammer (personal communication, 1988). Still, we have to keep in mind that in terms of absolute chronology, the accuracy is probably no better than ~ 10% (i.e., 1 k a y at the begin- ning of the Holocene) both for the Dome C and Vostok c o r e s .
F o r Komsomolska~a, the glaciological model ap- plied to Dome C may be used in first approximation, but we face the problem of having a very poor estimate

Ciais et al. : Evidence for an early Holocene climatic optimum in the Antarctic deep ice-core record 173
of the modern accumulation, the representativeness of available data, 4.6 to 5.3 g cm -2 y-a, being limited to 4 years of accumulation (Young et al. 1982). Using 5 g cm -2 y - I as modern accumulation leads to an age of 18 ka y BP at the bottom of the core, which is quite unrealistic given that the isotopic profile indicates that this bottom ice was deposited during the climatic tran- sition. Indeed, this profile suggests that the ice between 700 m and 765 m corresponds to the cold reversal, and we have assumed that this event is in phase with that recorded at Vostok and Dome C to obtain the time scale of Fig. 5. This corresponds to take a value of 6.6 g cm -2 y-1 for the present accumulation rate.
Temperature reconstruction
The ~ value-temperature relationship
Isotopic fractionation, whose effect is to impoverish the vapor relative to the condensed phases, occurs at each phase transition during the atmospheric cycle of the three molecules, H20, HDO and H2aao (in the follow- ing sections, their isotopic ratios will be expressed in the 6 scale versus the SMOW standard). This phenome- non is due to the slight differences in their saturation vapor pressures and molecular diffusions, the latter leading to an additional kinetic fractionation. Because the relative importance of this last effect is weaker for deuterium than for oxygen, 6D will be preferred to 8lsO for estimating temperatures values. The expected consequence of successive fractionations is a general decrease of the isotopic ratios with the inversion layer temperature: Ty, which corresponds to the formation of precipitations over the ice sheet. In the real world, Tf is linearly related to the surface snow temperature, T~, and modern polar precipitations isotopic ratios obey ef- fectively well the linear relationship:
6=aTs+b (2.1)
Both temperature gradient a and intercept b have been defined by observations in central East Antarctica where climatological conditions are relatively simple and used to reconstruct temperatures quantitatively (Lorius and Merlivat 1977). Our confidence in this type of reconstruction is strenghtened by the fact that the measured gradients (6%0 for 6D and 0.75%0 for 6asO) agree correctly with those inferred from one-dimen- sional models, including a physically detailed descrip- tion of fractionation during the history of moist air masses (Jouzel and Merlivat 1984; Merlivat and Jouzel 1979; Petit et al. 1991). However, a straightforward translation of our isotopic profiles in terms of palaeo- temperatures must be made with caution because: 1. Ice-flow dynamics, implying an upslope origin of depth layers or the occurrence of possible changes in ice thickness, may systematically bias the structure of the isotopic profiles. 2. There is no strong climatic argument for using the modern relationship (2.1) in order to interpret temporal variations of the isotope content as past temperature changes.
In the present study concerning the Holocene parts (i.e., the few first hundred meters) of cores located in the high East Antarctic plateau, point 1 may not be taken into account. Note that the situation may be sligthly different for Byrd and the generally increasing trend in the isotopic content during the Holocene (Fig. 3) may be linked with a concurrent decrease of the ice- cap thickness over this part of west Antarctica. More- over, incorporating stable water isotopes into atmos- pheric general circulation models suggests that the iso- tope-temperature gradient may be conservative for cli- mates as different as full glacial conditions (Joussaume 1987; Joussaume and Jouzel, submitted). Nevertheless, the intercept b has to be corrected for past changes in the isotopic composition of sea water. For this purpose, we used the marine 6180 series obtained by Labeyrie et al. (1987), multiplied by 8 for the sake of comparison with 6Ds.
Isotopic temperature noise
At Vostok station, the recovery of the two adjacent cores 3F and 4 F gives us the possibility of evaluating the 'noise' on the isotopic series, which is defined by the uncorrelated part of the two signals. In central high-elevation regions of Antarctica, the climatic condi- tions governing the precipitation process are relatively stable, and no surface melting is likely to occur throughout the year. 'The predominant source of iso- topic noise can therefore be attributed to the irregulari- ties of the snow deposition, a process which is magnif- ied by the very low accumulation rates encountered in the region. The method proposed by Fisher et al. (1985) consists of separating each Si sequence between a com- mon part and random noise, so that:
5i(t) =5i c(t)+N~(t)
In the case of two adjacent holes, where the snow dep- osition conditions are equivalent, it appears reasonable to make the hypothesis that the variance of noise is un- changed, which reads: Var (Ni (t)) = Var (Nj (t)). One can hereafter show that the variance of the noise is given by formula (3.1), where r~j designs the correlation coeffi- cient between the two series.
Var (N (t)) = (1 - rij) × Var (6 (t)) (3.1)
If we use (3.1) for the Holocene period (0-260 m), with the original data of 3 F and 4F, for which one deu- terium measurement represents an approximately 50 years on average, the correlation coefficient is 0.72. The resulting noise variance represents 20%o. On the other hand, when we consider 3F and 4F smoothed profiles, in which the high-frequency component has been par- tially removed so that only variations on time scales longer than 0.5 kay remain, it is also possible to calcu- late the variance of the decorrelated parts of the two signals. This represents the true 'noise' that should be taken into consideration when we present and discuss such isotopic curves. We applied the method described above to 3 F and 4F smoothed profiles using the same

174 Ciais et al.: Evidence for an early Holocene climatic optimum in the Antarctic deep ice-core record
spline function presented in Fig. 5. We focused our at- tention on the common parts of the two bore holes, ac- cording to the fact that 4 F is quasi-continuous over the Holocene, while the 3 F available data start from 138 m and present some gaps. The correlation coefficient is 0.95 and we obtain the noise variance for the smoothed data (designed by a prime symbol):
(a~vs) 2 = 3.2%0 (3.2)
In the empirical relationship (2.1), 6 = a T+ b, the inter- cept b can be expressed by b = b ' + 6 °, where 6 ° repre- sents the eventual deviation from the present days SMOW standard of the oceanic moisture source ratio. The variance of the random part of the 60 record in 180 is mainly due to sampling and measurement errors (La- beyrie, personal communication) and may be estimated as
(o-~o) 2 --- 0.1%0 (3.3)
For D /H ratio, this is equivalent to a value of 0.8%o. This latter 6 ° noise being independent of the 6 noise on our records, we can therefore evaluate from (2.1), the variance of the random part of our reconstructed tem- perature curve called aNT:
a~8 + credo (3.4) O'2T ~ a2
At Vostok station, using (3.2) and (3.3), we find aNT = 0-32 ° C. This value can be understood as the min- imum temperature variation significant from a climatic point of view, when using curves smoothed exactly like those of Figs. 3, 4 and 6 in this work. It should be pointed out that this estimation concerns the site with the lowest accumulation rates or, in other words, the strongest deposition noise. It then appears reasonable to believe that the value of 0.32 ° C constitutes an upper limit of the noise variance in the case of Dome C and Komsomolskaia smoothed temperature profiles pre- sented hereafter.
Holocene climate
Average temperature trends
Temperature series derived from isotopic profiles of Dome C, Vostok and Komsomolskaia ice cores are pre- sented in Fig. 5. The three curves have been smoothed in order to avoid the high-frequency component of the records. The surface-temperature variations are given with respect to the modern values, defined as averages over the past 5 kay. For the sake of comparison, the West Antarctic Byrd ice-core oxygen profile is also shown on the same figure. During at least the first half of the Holocene, the three temperature sequences dis- play similar trends and, despite originating from a dis- tinct geographical area where the glaciological regime is very different, the Byrd profile also presents some common characteristics, which probably reflect the same climatic events. Owing to the fact that the Byrd core originates from a region with a different glaciolog-
ical regime, however, we prefer to focus the discussion on the three East Antarctic cores. For the sake of this discussion, we have derived a mean surface tempera- ture profile from the three East Antarctic records re- ported in the upper part of Fig. 5.
The average temperature exhibits a rapid and impor- tant positive shift from cool to warm conditions during the interval 12.5-11 kay BP. This warming represents approximately 3.5 ° C, which is about one-third of the total deglaciation amplitude. The surface temperatures registered during the 9-11 kay BP interval, I°C above present days values, are the warmest in the whole Holo- cene, although a short cool oscillation occurred around 10.5 kay BP. After 10 ka y BP, a progressive general temperature decrease occurred, marked by less defined oscillations and lasted up to 6-7 kay BP. During that interval, minimum temperatures are respectively en- countered around 8 kay BP at Dome C (absolute Holo- cene minimum) and Komsomolskaia, and around 7 kay BP at Vostok. The second half of the Holocene, since 6 kay BP, reveals a succession of warmer spikes of weaker amplitude, lasting about 1 kay. The events that do not appear to be clearly correlated and lead to nearly unchanged average temperature, are discussed elsewhere in the framework of late Holocene climate, together with better resolution results obtained from coastal sites.
Comparison with Southern Hemisphere records
As far as comparison with Southern Hemisphere paleo- climatic data is concerned, we will briefly review here the general trends of the Holocene, limiting ourselves to regions in proximal relationship with the Antarctic continent. According to Markgraf (1989), pollen data from South America appear strongly marked by latitu- dinal differences and may exhibit different and even opposite vegetational history (Heusser 1983). However, if we only consider sequences obtained from Tierra del Fuego (51 to 54 ° S), the semi-quantitative patterns of temperature trends, based on pollinic diagrams, indi- cate warmer climates for the early Holocene, between 10 k a y BP and 7 ka y BP. A colder and dryer interval replaced those conditions by 6 kay BP, while since 5 ka y BP, no significant changes from modern environ- mental conditions have occurred (Markgraf 1983). In the vicinity of Tierra del Fuego, the hydroclimatic con- ditions of lake Cardiel in Chile recently studied by Stine (1990) also suggest a wetter period (and probably warmer according to the authors), lasting from 10 kay BP to 8 k a y BP, in fair agreement with our temperature curve.
In southern Tasmania (42 ° S-43 ° 30'E), Macphail (1979) indicates that rapid warming has occurred since 11.5 kay BP, progressively succeeded by minor in- creases in temperature and precipitation, and con- cludes that a warmer than present episode extended from 8 kay BP to around 5 kay BP. However, it should be pointed out that different authors seem to favor ear- lier dates (Goede and Hitchman 1983). As regards New

Ciais et al.: Evidence for an early Holocene climatic optimum in the Antarctic deep ice-core record 175
Zealand, a review proposed by Salinger (1983) shows off a reduction of the westerly circulation between 18 kay BP and 9 ka y BP, accompanied by milder and more equable climates around 9 kay BP. This latter point appears corroborated by three pollen series lo- cated in Northern Iceland and recently studied by Newnham (to be published) using principal component analysis to reconstruct temperature. By 10 kay BP, for instance, the area was experiencing I°C warmer tem- peratures than present.
Turning now to the regions closer to Antarctica, in Kerguelen subantarctic islands (49 ° S, 69 ° E), Young and Schofield (1973) say that a warming trend began by about 12 ka y BP and culminated by 10 ka y BP, asso- ciated with maximum glacial retreat. However, they speak in favor of a wanner optimum in the area extend- ing around 8 kay BP, characterized by temperatures considerably warmer than the present, only followed by a return to cooler conditions after 5 ka y BP. Glacier fluctuations and paleoecological changes in south Georgia (54 ° S, 37 ° E) are found to be globally in agree- ment with Antarctic data on the Holocene, but the max- imum warmth seemed instead to have occurred at 6 kay BP (Clapperton et al. 1989). In the Antarctic pen- insula, geomorphological evidence accounted for a gla- cial retreat 8 ka y ago (Sugden and Clapperton 1980). Few data allow us to document precisely the tempera- ture changes of subantarctic surface waters during the Holocene, but core RC 11-120 (41 ° 31'S, 79 ° 52'E), sit- uated between the subtropical convergence and the Antarctic polar front, indicates maximum temperatures around 10-9 kay BP (Hays et al. 1976), a feature also observed in two cores located in the Indian sector of the southern ocean: MD 73-025 and MD 84-527 (43 ° 49'S, 51 ° 19'E) (Labracherie et al. 1989).
One may see in Fig. 5 that the Antarctic temperature trends agree well with palaeoclimatic evidence from the surrounding regions. As previously mentioned in the case of long-term climatic changes (Jouzel et al. 1989a, b), this suggests large spatial representativeness of Ant- arctic ice cores climatic archives. Despite the discre- pancies between the chronologies, as well as the in- fluence of regional conditions, this rapid overview strongly suggests the existence of a well-defined ther- mal maximum in Antarctica during the first millenia of the Holocene, lasting from 11.5 ka y BP to 9 k ay BP and substantially preceding the Northern Hemisphere hypsithermal period centered around 6 kay BP. It should be stressed that with respect to our ice-core common chronology, the beginning of the Holocene marked by a maximum, after which the temperatures remain close to the present values, is positioned at 11 kay BP.
Discussion and comparison with model predictions
If we try to place the Antarctic early Holocene warm- ing, confirmed by high southern latitudes records into a more general context, one may clearly see that the tem- perature rise associated with deglaciation is considera-
bly delayed in the continental areas in the Northern Hemisphere, owing to the presence of the extensive re- maining ice sheets. The Fennoscandian ice sheet, for in- stance, disappeared around 7 kay BP, while in the Northwest United States, the Laurentide ice sheet re- mained until 6 kay BP (Lamb 1977). This is probably the reason why maximum Holocene warming is reached at about 6 kay BP, corresponding to the Hyp- sithermal in America and Atlantic period in Europe (Flint 1965; Lamb 1977; Huntley and Prentice 1988). In contrast, recent data concerning the high northern lati- tudes (Queen Elizabeth islands and Canadian Arctic, as well as northwestern Canada) speak in favor of the warmest conditions, at least in summer,during the be- ginning of the Holocene (Bradley 1990; Koerner and Fisher 1990; Ritchie et al. 1983). In tropical regions, the situation is less clearly defined, as possible temperature changes fall within the limits of paleoclimatic data (Crowley 1990).
Palaeoclimatic records of high latitudes in both hemispheres do not confirm the existence of a wide- spread mid-Holocene 'climatic optimum', which sug- gests that the general picture of the Holocene proposed in Fig. 1 should therefore be considered cautiously and apparently better reflects European and North Ameri- can conditions.
The apparently similar behavior between the high la- titudes in the south and north may illustrate the fact that the southernmost areas have responded synchron- ously with maximum summer solar radiation in the Northern Hemisphere. Short and Mengel (1986), and more recently Short (1990), approached this problem, using a two dimensional energy balance model and pre- dicted no phase lag between the occurrence of the war- mest Antarctic summer temperatures and the Northern maximum solar radiation. Of the plausible explana- tions, one may keep in mind that the continental re- sponse of the Boreal Hemisphere plays an important role in determining the main component of global cli- matic changes. In addition, in contrast to the preceding forcing (20 kay period), during low-excentricity peri- ods, the obliquity forcing (41 kay period) remains in phase between the two hemispheres and may also ac- count for the synchronism observed (Crowley 1990). It is therefore interesting to note that the EBM tempera- ture shift, due only to orbital insolation forcing be- tween 9-10 ka y BP and the present (+0.3 ° C), is con- sistent with the Antarctic data of the present work. On the other hand, orbital forcing variations cannot ac- count for the occurrence of minimum temperatures ob- served at 6-7 kay BP in our records.
Comparison of the Antarctic Holocene climate with predictions of more sophisticated models like GCMs should bring more detailed information (Kutzbach and Gallimore 1988; Kutzbach and Guetter 1986; Mitchell 1990; Mitchell et al. 1988). At 9 kay BP, for instance, Kutzbach and Guetter (1986), although predicting a global increase over land in the Southern Hemisphere (+ 0.8°C above present), point out 2.5°C cooler condi- tions over Antarctica in January and July.
Ice cores have demonstrated their potential for pro-

176 Ciais et al.: Evidence for an early Holocene climatic optimum in the Antarctic deep ice-core record
viding access to trace gases, in particular CO2, t rapped in air bubbles in the ice. The continuous CO2 record of Vostok station (Barnola et al. 1987) has clearly shown the close similarity between CO2 levels and long-term climatic variations. In the Holocene, it is not easy to tell whether CO2 is also linked with shorter tempera ture variations that do not exceed one-tenth of the deglacia- tion ampli tude, because very few accurate data are available. At Byrd station, Neftel et al. (1988) recorded a CO2 minimum, dated at 8 k a y BP, and preceded by higher early Holocene levels. At Vostok, the Holocene is not sufficiently documented, so that the two values 10 p p m v beyond early Holocene levels observed at 6.8 and 7.5 ka y BP, in phase with a cooler interval (see Fig. 5), may not allow us to draw precise conclusions. It should be noted, however, that CH4 data also displayed a marked negative shift at that t ime (Chappelaz et al. 1990). Although an apparent correlation of CO2 and CH4 concentrat ions and temperature changes must yet be conf i rmed during the Holocene, it should constitute an interesting element for understanding the CO2 cycle behavior in the face of short-durat ion climatic shifts.
Conclusions
The present study concerns a period during which cli- matic f luctuations are far weaker and never exceed - 2 ° C. The ' isotopic thermometer ' allows us to detect such variations, so that reconstructing past tempera ture changes on the basis o f three distinct isotopic profiles offers us the possibility of picturing the climatic condi- tions prevail ing over Antarctica. As previously outlined for glacial t imes (Jouzel et al. 1989a, b), a close similar- ity is observed between the records of distant sites: Byrd, on the one hand, and Vostok, Dome C and Kom- somolska'ia on the other. The general good concor- dance of our results with terrestrial paleoclimatic data f rom the Southern high latitudes also favors the wide geographical significance of the Antarctic climate re- cord.
Our data show that the warmest conditions of the Holocene occurred during the period 10-7.5 k a y BP. At that time, temperatures were higher by about 1 ° above the present values, a trend that seems conf i rmed over surrounding areas. By 6 ka y BP, the progressive return to cooler climates had been achieved. Although the reasons for this op t imum are still unclear, analysis o f chemical impurities of trace gases contained in the ice may prove to be very helpful in reconstructing other climate-related parameters (Barnola et al. 1987; De An- gelis et al. 1987; Legrand and Delmas 1987; Petit et al. 1981). In order to document the Holocene per iod bet- ter, bore holes in coastal regions where accumulat ion rates are much more higher than on the Antarctic pla- teau, constitute an appropr ia te solution for obtaining more detailed climatic records, even if in the latter case other factors like ice flow or sheet ice thinning must be taken into account.
Acknowledgements. We thank all Soviet and French participants for doing the drilling, field work and ice sampling. We acknowl- edge the Soviet Antarctic Expeditions and the US division of Po- lar Programs for logistic support. We thank G. Mondet, P. Doira and R. Chiron for isotopic determinations. This work was sup- ported in France by the EPF (Expeditions Polaires frangaises), PNEDC (Programe National d'&udes de la Dynamique du Cli- mat) and TAAF (Terres Australes et Antarctiques Fran~aises) and in the USSR and Vostok and Komsolmoskaia by Soviet Antarctic Expeditions.
References
Barnola JM, Raynaud D, Korotkevitch YS, Lorius C (1987) Vos- tok ice core provides 160000 year record of atmospheric CO2. Nature 329: 408-414
Benoist JP (1986) Analyse spectrale de signaux glaciologiques: &ude des glaces srdimentaires drposres ~ DomeC, morpho- logic du lit d'un glacier. USMT, Grenoble, pp 151-156
Benoist JP, Jouzel J, Lorius C, Merlivat L, Pourchet M (1982) Iso- tope climatic record over the last 2.5 Ka from Dome C, Ant- arctica, ice cores. Ann Glaciol 3:17-21
Bradley RS (1990) Holocene palaeoclimatology of the Queen Elizabeth islands, Canadian Arctic. Quat Sci Rev 9:365-384
Budd WF, Jenssen D, Radock U (1971) Derived physical charac- teristics of the Antarctic ice sheet. University of Melbourne publication 18, p 32
Chappelaz J, Barnola JM, Raynaud D, Korotkevitch YS, Lorius C (1990) Atmospheric CH4 record over the last climatic cycle re- vealed by the Vostok ice core. Nature 345:127-131
Clapperton CM, Sugden DE, Birnie J, Wilson MJ (1989) Late- glacial and Holocene glacier fluctuations and environmental change on south Georgia, southern Ocean. Q Res 31:210- 228
Crowley TJ (1990) Are there any satisfactory geologic analogs for a future greenhouse warming? J Clim 3:1282-1292
Dansgaard W (1964) Stable isotopes in precipitations. Tellus 16: 436-468
De Angelis M, Barkov NI, Petrov VN (1987) Aerosol content over the last climatic cycle (160 Kyr) from an Antarctic ice core. Nature 325:318-321
Fisher DA, Reeh N, Clausen HB (1985) Stratigraphic noise in time series derived from ice cores. Ann Glaciol 7:76-83
Folland CK, Karl TR, Vinnikov KY (1990) Observed climate var- iations and change. Climate Change, the IPCC scientific as- sessment. WMO/UNEP. Cambridge University Press, Cam- bridge, pp 201-238
Gallimore RG, Kutzbach JE (1989) Effects of soil moisture on the sensitivity of a climate moded to earth orbital fotcing at 9000 yr BP. Clim Change 14:175-205
Goede A, Hitchman MA (1983) Late Quaternary climatic change evidence from a Tasmanian speleothem. Late Cenozoic Pal- aeoclimates of the Southern Hemisphere. Balkema, Boston, pp 221-232
Hays J, Imbrie J, Shackleton NJ (1976) Variations in the Earth's orbit: pacemaker of the ice ages. Science 194:1121-1132
Heusser C (1983) Late Quaternary climates of Chile. Late Ceno- zoic Palaeoclimates of the Southern Hemisphere. Balkema, Boston, pp 59-83
Huntley B, Prentice CP (1988) July temperatures in Europe from pollen data, 6000 years Before Present. Science 241:687-690
Johnsen SJ (1977) Stable isotope homogenisation of polar snow and ice. Isotopes and impurities in snow and ice. IAHS publi- cation 118:210-219
Johnsen SJ (1983) Diffusion of stable isotopes. The Climatic re- cord in polar ice sheets. Cambridge University Press, Cam- bridge, pp 58-63
Johnsen SJ, Dansgaard W, Clausen HB, Langway CC (1972) Oxy- gen isotope profiles through the Antarctic and Greenland ice sheets. Nature 235:429-434

Ciais et al.: Evidence for an early Holocene climatic optimum in
Joussaume S (1987) Simulations du climat du dernier maximum glaciaire a l'aide d'un modrle de circulation grnrrale de l'at- mosphrre incluant une modrlisation du cycle des isotopes de l'eau et des poussieres d'origine drsertique. Universit6 Pierre et Marie Curie, pp 375-460
Jouzel J, Merlivat L (1984) Deuterium and oxygen 18 in precipita- tion: modeling of the isotopic effect during snow formation. J Geophys Res 89:749-757
Jouzel J, Merlivat L, Lorius C (1982) Deuterium excess in an East Antarctic ice core suggests higher relative humidity at the oceanic surface during the glacial maximum. Nature 299:688- 691
Jouzel J, Lorius C, Petit JR, Genthon C, Barkov NI, Kotlyakov VM, Petrov VM (1987) Vostok ice core: a continuous isotope temperature record over the last climatic cycle (160000 yr). Nature 329:403-408
Jouzel J, Barkov NI, Barnola JM, Genthon C, Korotkevitch YS, Kotlyakov VM, Legrand M, Lorius C, Petit JR, Petrov VN, Raisbeck G, Raynaud D, Ritz C, Yiou F (1989a) Q Int 2:15- 24
Jouzel J, Raisbeck G, Benoist JP, Yiou F, Lorius C, Raynaud D, Petit JR, Barkov NI, Korotkevitch YS, Kotlyakov VM (1989b) A comparison of deep Antarctic ice cores and their implica- tions for climate between 65000 and 15000 years ago. Quat Res 31:135-150
Jouzel J, Petit J-R, Barkov NI, Barnola JM, Chappelaz J, Ciais P, Kotlyakov VM, Lorius C, Petrov VM, Raynaud D, Ritz C (1991) The last deglaciation in Antarctica: further evidence of "younger Dryas" type event. In: Bard E, Broecker WS (eds) The last deglaciation: absolute and radiocarbon chronologies. ASI series (in press)
Koerner RM, Fisher DA (1990) A record of Holocene summer climate from a Canadian high-Arctic ice core. Nature 343:630-631
Kutzbach JE, Guetter PJ (1986) The influence of changing orbital parameters and surface boundary conditions on climate simu- lations for the past 18000 years. J Atmos Sci 43:1726-1759
Kutzbach JE, Gallimore RG (1988) Sensitivity of acoupled atmo- sphere-mixed layer ocean model to changes in orbital forcing at 9000 years BP. J Geophys Res 93:803-821
Labeyrie LD, Duplessy JC, Blanc PL (1987) Variations of mode of formation and temperature of oceanic deep waters over the past 125000 years. Nature 327:477-482
Labracherie M, Labeyrie LD, Duprat J, Bard E, Arnold M, Pi- chon J J, Duplessy JC (1989) The last deglaciation in the south- ern Ocean. Paleoceanography 4:629-638
Lamb HH (1977) Climate, present, past and future, vol 2. Climatic history and the future. Methuen, London, pp 363-422
Legrand M, Delmas RJ (1987) A 220-yr continuous record of vol- canic H2SO4 in the Antarctic ice sheet. Nature 327:671-676
Lorius C, Medivat L (1977) Distribution of mean surface isotope values in East Antarctica: observed changes with depth in coastal areas. Isotopes and impurities in snow and ice. IAHS publication 118:125-137
Lorius C, Merlivat L, Jouzel J, Pourchet M (1979) A 30000-yr iso- tope climatic record from Antarctic ice. Nature 280:644-648
Lorius C, Jouzel J, Ritz C, Merlivat L, Barkov NI, Korotkevitch YS, Kotlyakov VM (1985) A 150000 year climatic record from Antarctic ice. Nature 316:591-596
Macphail MK (1979) Vegetation and climates in southern Tas- mania since the last glaciation. Quat Res 11:306-341
the Antarctic deep ice-core record 177
Markgraf V (1983) Late and postglacial vegetational and paleocli- matic changes in Subantarctic temperate, and arid environ- ments in Argentina. Palynology 7:43-70
Markgraf V (1989) Palaeoclimates in Central and South America since 18 000 BP based on pollen and lake-level records. Quat Sci Rev 8:1-24
Merlivat L, Jouzel J (1979) Global climatic interpretation of the deuterium-oxygen 18 relationship for precipitation. J Geophys Res 84:5029-5033
Mitchell JFB (1990) Greenhouse warming: is the mid-Holocene a good analogue? J Clim 3:1177-1192
Mitchell JFB, Grahame NS, Needham KJ (1988) Climate simula- tions for 9000 years before present: seasonal variations and the effect of the Laurentide ice sheet. J Geophys Res 93:8283- 8303
Neftel A, Oeshger H, Staffelbach T, Stauffer B (1988) CO2 record in the Byrd ice core :50000-5000 years BP. Nature 331:609- 611
Nicola'iev VI, Koltyakov VM, Smirnov KE (1988) Isotope studies of the ice core from the Komsomolska~a station, Antarctica. Data of glaciological studies. USSR Acad Sci 63:97-102
Petit JR, White JWC, Young NW, Jouzel J, Korotkevich YS (1991) Deuterium excess in recent Antarctic snow. J Geophys Res 96:5113-5122
Raisbeck GM, Yiou F, Bourles D, Lorius C, Jouzel J, Barkov NI (1987) Evidence for two intervals of enhanced a°Be deposition in Antarctic ice during the last glacial period. Nature 326:273- 277
Ritchie JC, Cwynar LC, Spear RW (1983) Evidence from North- West Canada for an early Holocene Milankovitch thermal maximum. Nature 305:126-128
Robin G Q de (1977) Ice cores and climatic changes. Phil Trans R Soc London 280:143-168
Robin G Q de (1983) Isotopic temperature noise. The climatic re- cord in polar ice sheets. Cambridge University Press, Cam- bridge, pp 184-189
Salinger (1983) New Zealand climate: the last 5 million years. Late Cenozoic palaeoclimates of the Southern Hemisphere. Balkema, Boston, pp 59-83
Short DA, Mengel JG (1986) Tropical climatic phase lags and Earth's precession cycle. Nature 323:48-50
Stine S, Stine M (1990) A record from Lake Cardiel of climate change in southern South America. Nature 345:705-708
Sugden DE, Clapperton CM (1980) West Antarctic ice sheet fluc- tuations in the Antarctic Peninsula area. Nature 286:378-381
Webb T (1985) Holocene palynology and climate. Paleoclimate analyses and modeling. Wiley, Chichester, pp 163-195
Whillans IM, Grootes PM (1985) Isotopic diffusion in cold snow and tim. J Geophys Res 90:3910-3918
Young SB, Schofield EK (1973) Pollen evidence for late quater- nary climate changes on Kerguelen islands. Nature 245:311- 312
Young NW, Pourchet M, Kotlyakov VM, Korolev PA, Dyugerov MB (1982) Accumulation distribution in the IAGP area, Ant- arctica: 90 ° E-150 ° E 333-338
Yoshino MM, Uruchibara K (1978) Paleoclimate in Japan since the last ice age. Climatol Notes 22:1-24
Zhang Y, Wang WC (1990) The surface temperature in China dur- ing the mid-Holocene. Zhu Kezhen Centennial Memorial Col- lections. Science Press, Beijing (in press)


![Holocene Environmental Climatic Changes Based on ...present-day samples in continental deposits [2]-[7], coastal environments [8] [9] and marine deposits [10]-[13]. In Brazil, studies](https://img.dokumen.tips/doc/110x75/5ec50951e9f9bc484151f6b6/holocene-environmental-climatic-changes-based-on-present-day-samples-in-continental.jpg)