Embed Size (px)
Citation preview

4
Department of Veterans Affairs
Health Services Research & Development Service Evidence-based Synthesis Program
Evidence Brief: Update on Prevalence of and Interventions to Reduce Racial and Ethnic Disparities within the VA
Supplemental Materials
May 2015
Prepared for: Department of Veterans Affairs Veterans Health Administration Quality Enhancement Research Initiative Health Services Research & Development Service Washington, DC 20420
Prepared by: Evidence-based Synthesis Program (ESP) Coordinating Center Portland VA Medical Center Portland, OR Mark Helfand, MD, MPH, MS, Director
Investigators: Kim Peterson, MS Ellen McCleery, MPH Kallie Waldrip, MS

Evidence Brief: Racial and Ethnic Disparities within the VA Evidence-based Synthesis Program Supplemental Materials TABLE OF CONTENTS Search Strategies ............................................................................................................................. 1
List of Excluded Studies ................................................................................................................. 3
Evidence Tables .............................................................................................................................. 8
Ongoing Studies .......................................................................................................................... 8
Data Abstraction: Morbidity/Mortality Multisite Studies Addressing KQ1............................. 10
Data Abstraction: Morbidity/Mortality Single Site Studies Addressing KQ1.......................... 21
Data Abstraction: Intervention Studies Addressing KQ2 ......................................................... 23
Quality Assessment: Included Morbidity/Mortality Studies Addressing KQ1 ........................ 25
Quality Assessment: Included Intervention Studies Addressing KQ2 ..................................... 41
Strength of Evidence: Morbidity/Mortality Studies Addressing KQ1 ..................................... 41
Strength of Evidence: Intervention Studies Addressing KQ2 .................................................. 50
Peer Review Disposition Table ..................................................................................................... 51
References ..................................................................................................................................... 65
i

Evidence Brief: Racial and Ethnic Disparities within the VA Evidence-based Synthesis Program Supplemental Materials SEARCH STRATEGIES MEDLINE® searched via PubMed® on February 13, 2015 Concept Search Notes Racial Groups
((("Population Groups"[Mesh]) OR "Race Relations"[Mesh]) OR "Minority Groups"[Mesh]) OR
MeSH N=217784
(ethnic*[Title/Abstract] OR race[Title/Abstract] OR racial[Title/Abstract] OR black[Title/Abstract] OR blacks[Title/Abstract] OR Hispanic*[Title/Abstract] OR minority[Title/Abstract] OR minorities[Title/Abstract] OR "African American"[Title/Abstract])
Keywords in title or abstract N=219558
Keyword OR Mesh N=534596
Disparities (("Health Services Accessibility"[Mesh]) OR "Healthcare Disparities"[Mesh]) OR "Health Status Disparities"[Mesh] OR
MeSH N=95682
(disparity[Title/Abstract] OR disparities[Title/Abstract] OR equity[Title/Abstract] OR difference*[Title/Abstract] OR differ [Title/Abstract] OR differs [title/abstract] OR discrimination[Title/Abstract])
Keywords in title or abstract N=865937
Keywords OR Mesh N=949493
Race and Disparities
Race AND Disparities N=47650
Date limits ("2006/10/09"[Date - Entrez] : "3000"[Date - Entrez])
Entrez refers to the date the citation was added to the database and is preferable to publication date N=7309156 Combined with above search N=28063
VA limits (("Veterans Health"[Mesh])) OR (((VA OR Veteran OR VAMC OR Veterans)) OR ("Veterans"[Mesh] OR "United States Department of Veterans Affairs"[Mesh] OR "Hospitals, Veterans"[Mesh]))
N=179429 Combined with above search N=1481
1

Evidence Brief: Racial and Ethnic Disparities within the VA Evidence-based Synthesis Program Supplemental Materials Cochrane Central Register of Controlled Trials via OVID searched on December 19, 2014 Database: EBM Reviews - Cochrane Central Register of Controlled Trials <November 2014> Search Strategy: 1 exp Population Groups/ (5103) 2 exp Race Relations/ (29) 3 exp Minority Groups/ (203) 4 (ethnic* or race or racial or black or blacks or hispanic* or minority or minorities or "african american").mp. [mp=title, original title, abstract, mesh headings, heading words, keyword] (11359) 5 1 or 2 or 3 or 4 (13362) 6 exp Health Services Accessibility/ (608) 7 exp Healthcare Disparities/ or exp Health Status Disparities/ (121) 8 (disparity or disparities or equity or difference or discrimination).mp. [mp=title, original title, abstract, mesh headings, heading words, keyword] (108768) 9 6 or 7 or 8 (109262) 10 5 and 9 (2547) 11 limit 10 to yr="2006 -Current" (1624) 12 exp "United States Department of Veterans Affairs"/ or exp Veterans Health/ or exp Hospitals, Veterans/ or exp Veterans/ (763) 13 (va or veteran or veterans or VAMC).mp. [mp=title, original title, abstract, mesh headings, heading words, keyword] (3697) 14 12 or 13 (3697) 15 11 and 14 (17) = VA citations On January 6, 2015 ClinicalTrials.gov http://www.clinicaltrials.gov was searched. Search String: Healthcare Disparities OR Health Status Disparities | received on or after 10/09/2006 145 Results On January 6, 2015, HSRProj Database http://wwwcf.nlm.nih.gov/hsr_project/home_proj.cfm was searched Search String: VA disparity OR disparities OR equity gt_initialYear:2006 status:Completed OR status:Ongoing country:"United States" Result: 129 Projects
2

Evidence Brief: Racial and Ethnic Disparities within the VA Evidence-based Synthesis Program Supplemental Materials LIST OF EXCLUDED STUDIES
INELIGIBLE COMPARATOR OR NO COMPARISON Burgess DJ, Grill J, Noorbaloochi S, et al. The effect of perceived racial discrimination on bodily pain among older African American men. Pain Med. 2009;10(8):1341-1352.
Hunt KJ, Gebregziabher M, Lynch CP, Echols C, Mauldin PD, Egede LE. Impact of diabetes control on mortality by race in a national cohort of veterans. Ann Epidemiol. 2013;23(2):74-79.
Nahleh ZA, Srikantiah R, Safa M, Jazieh AR, Muhleman A, Komrokji R. Male breast cancer in the veterans affairs population: a comparative analysis. Cancer. 2007;109(8):1471-1477.
Rabadi MH, Aston C. Complications and urologic risks of neurogenic bladder in veterans with traumatic spinal cord injury. Spinal Cord. 2014.
Villa VM, Harada ND, Huynh-Hohnbaum AL. Health and ambulatory care use among Native American veterans. Home Health Care Serv Q. 2010;29(4):195-215.
DIFFERENTIAL TREATMENT EFFECTS Allott EH, Howard LE, Cooperberg MR, et al. Postoperative statin use and risk of biochemical recurrence following radical prostatectomy: results from the Shared Equal Access Regional Cancer Hospital (SEARCH) database. BJU Int. 2014;114(5):661-666.
Govani SM, Higgins PD, Stidham RW, Montain SJ, Waljee AK. Increased Ultraviolet Light Exposure is Associated With Reduced Risk of Inpatient Surgery Among Patients With Crohn's Disease. J Crohns Colitis. 2015;9(1):77-81.
Vidal AC, Williams CD, Allott EH, et al. Carbohydrate intake, glycemic index and prostate cancer risk. Prostate. 2015;75(4):430-439.
INELIGIBLE INTERVENTION Burgess DJ, Phelan S, Workman M, et al. The effect of cognitive load and patient race on physicians' decisions to prescribe opioids for chronic low back pain: A randomized trial. Pain Medicine (United States). 2014;15(6):965-974.
Jackson GL, Oddone EZ, Olsen MK, et al. Racial differences in the effect of a telephone-delivered hypertension disease management program. J Gen Intern Med. 2012;27(12):1682-1689.
INELIGIBLE OUTCOME Arora P, Rajagopalan S, Patel N, Nainani N, Venuto RC, Lohr JW. The MDRD equation underestimates the prevalence of CKD among blacks and overestimates the prevalence of CKD among whites compared to the CKD-EPI equation: a retrospective cohort study. BMC Nephrol. 2012;13:4.
Axon RN, Gebregziabher M, Echols C, Msph GG, Egede LE. Racial and ethnic differences in longitudinal blood pressure control in veterans with type 2 diabetes mellitus. J Gen Intern Med. 2011;26(11):1278-1283.
Bosworth HB, Dudley T, Olsen MK, et al. Racial differences in blood pressure control: potential explanatory factors. Am J Med. 2006;119(1):70 e79-15.
Burgess DJ, Taylor BC, Phelan S, et al. A brief self-affirmation study to improve the experience of minority patients. Appl Psychol Health Well Being. 2014;6(2):135-150.
3

Evidence Brief: Racial and Ethnic Disparities within the VA Evidence-based Synthesis Program Supplemental Materials Egede LE, Gebregziabher M, Hunt KJ, et al. Regional, geographic, and racial/ethnic variation in glycemic control in a national sample of veterans with diabetes. Diabetes Care. 2011;34(4):938-943.
Egede LE, Mueller M, Echols CL, Gebregziabher M. Longitudinal differences in glycemic control by race/ethnicity among veterans with type 2 diabetes. Med Care. 2010;48(6):527-533.
Goldstein KM, Melnyk SD, Zullig LL, et al. Heart matters: Gender and racial differences cardiovascular disease risk factor control among veterans. Womens Health Issues. 2014;24(5):477-483.
Hamilton NS, Edelman D, Weinberger M, Jackson GL. Concordance between self-reported race/ethnicity and that recorded in a Veteran Affairs electronic medical record. N C Med J. 2009;70(4):296-300.
Hausmann LR, Gao S, Mor MK, Schaefer JH, Jr., Fine MJ. Patterns of sex and racial/ethnic differences in patient health care experiences in US Veterans Affairs hospitals. Med Care. 2014;52(4):328-335.
Hausmann LR, Hannon MJ, Kresevic DM, Hanusa BH, Kwoh CK, Ibrahim SA. Impact of perceived discrimination in healthcare on patient-provider communication. Med Care. 2011;49(7):626-633.
Hausmann LR, Hanusa BH, Kresevic DM, et al. Orthopedic communication about osteoarthritis treatment: Does patient race matter? Arthritis Care Res (Hoboken). 2011;63(5):635-642.
Hausmann LR, Jeong K, Bost JE, Kressin NR, Ibrahim SA. Perceived racial discrimination in health care: a comparison of Veterans Affairs and other patients. Am J Public Health. 2009;99 Suppl 3:S718-724.
Hayes J, Kalantar-Zadeh K, Lu JL, Turban S, Anderson JE, Kovesdy CP. Association of hypo- and hyperkalemia with disease progression and mortality in males with chronic kidney disease: the role of race. Nephron Clin Pract. 2012;120(1):c8-16.
Hebenstreit C, Madden E, Maguen S. Latent classes of PTSD symptoms in Iraq and Afghanistan female veterans. J Affect Disord. 2014;166:132-138.
Humphreys M, Costanzo P, Haynie KL, et al. Racial disparities in diabetes a century ago: evidence from the pension files of US Civil War veterans. Soc Sci Med. 2007;64(8):1766-1775.
Ivins BJ, Lange RT, Cole WR, Kane R, Schwab KA, Iverson GL. Using Base Rates of Low Scores to Interpret the ANAM4 TBI-MIL Battery Following Mild Traumatic Brain Injury. Arch Clin Neuropsychol. 2015;30(1):26-38.
Kramer BJ, Jouldjian S, Wang M, et al. Do correlates of dual use by American Indian and Alaska Native Veterans operate uniformly across the Veterans Health Administration and the Indian Health Service? J Gen Intern Med. 2011;26 Suppl 2:662-668.
Luncheon C, Zack M. Health-related quality of life among US veterans and civilians by race and ethnicity. Prev Chronic Dis. 2012;9:E108.
Noe TD, Kaufman CE, Kaufmann LJ, Brooks E, Shore JH. Providing culturally competent services for American Indian and Alaska Native veterans to reduce health care disparities. Am J Public Health. 2014;104 Suppl 4:S548-554.
Rao SR, Reisman JI, Kressin NR, et al. Explaining Racial Disparities in Anticoagulation Control: Results From a Study of Patients at the Veterans Administration. Am J Med Qual. 2014.
Rose DE, Farmer MM, Yano EM, Washington DL. Racial/ethnic differences in cardiovascular risk factors among women veterans. J Gen Intern Med. 2013;28 Suppl 2:S524-528.
4
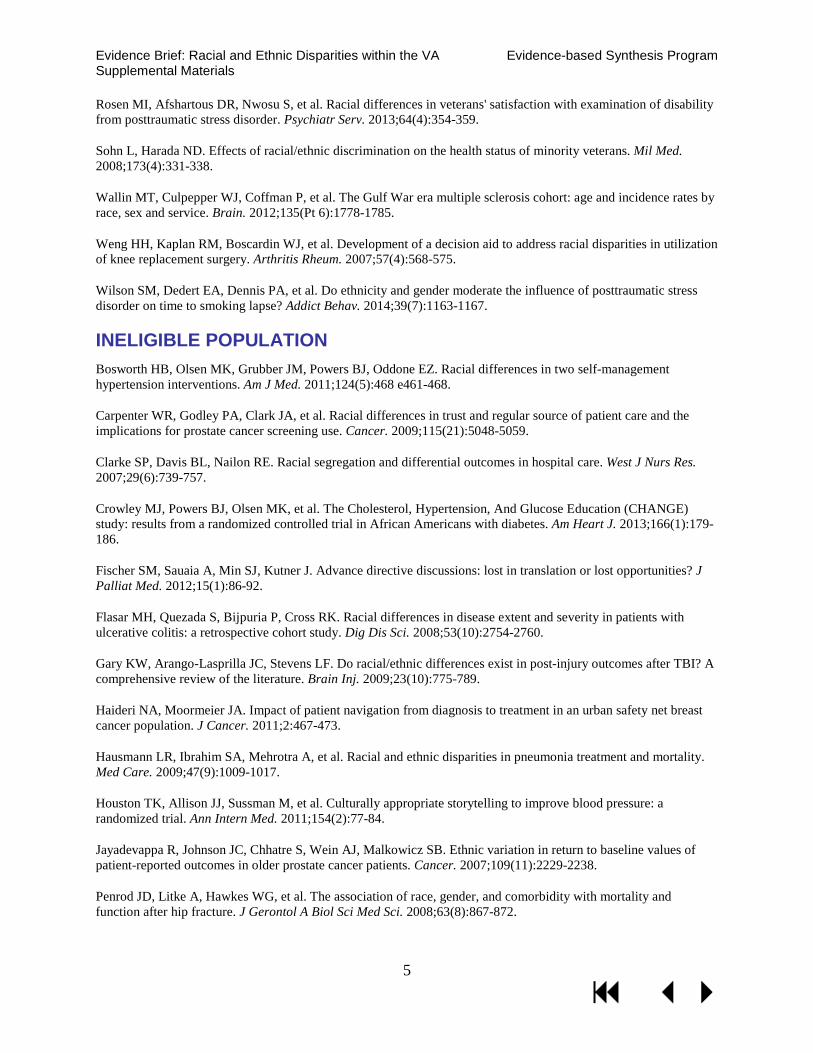
Evidence Brief: Racial and Ethnic Disparities within the VA Evidence-based Synthesis Program Supplemental Materials Rosen MI, Afshartous DR, Nwosu S, et al. Racial differences in veterans' satisfaction with examination of disability from posttraumatic stress disorder. Psychiatr Serv. 2013;64(4):354-359.
Sohn L, Harada ND. Effects of racial/ethnic discrimination on the health status of minority veterans. Mil Med. 2008;173(4):331-338.
Wallin MT, Culpepper WJ, Coffman P, et al. The Gulf War era multiple sclerosis cohort: age and incidence rates by race, sex and service. Brain. 2012;135(Pt 6):1778-1785.
Weng HH, Kaplan RM, Boscardin WJ, et al. Development of a decision aid to address racial disparities in utilization of knee replacement surgery. Arthritis Rheum. 2007;57(4):568-575.
Wilson SM, Dedert EA, Dennis PA, et al. Do ethnicity and gender moderate the influence of posttraumatic stress disorder on time to smoking lapse? Addict Behav. 2014;39(7):1163-1167.
INELIGIBLE POPULATION Bosworth HB, Olsen MK, Grubber JM, Powers BJ, Oddone EZ. Racial differences in two self-management hypertension interventions. Am J Med. 2011;124(5):468 e461-468.
Carpenter WR, Godley PA, Clark JA, et al. Racial differences in trust and regular source of patient care and the implications for prostate cancer screening use. Cancer. 2009;115(21):5048-5059.
Clarke SP, Davis BL, Nailon RE. Racial segregation and differential outcomes in hospital care. West J Nurs Res. 2007;29(6):739-757.
Crowley MJ, Powers BJ, Olsen MK, et al. The Cholesterol, Hypertension, And Glucose Education (CHANGE) study: results from a randomized controlled trial in African Americans with diabetes. Am Heart J. 2013;166(1):179-186.
Fischer SM, Sauaia A, Min SJ, Kutner J. Advance directive discussions: lost in translation or lost opportunities? J Palliat Med. 2012;15(1):86-92.
Flasar MH, Quezada S, Bijpuria P, Cross RK. Racial differences in disease extent and severity in patients with ulcerative colitis: a retrospective cohort study. Dig Dis Sci. 2008;53(10):2754-2760.
Gary KW, Arango-Lasprilla JC, Stevens LF. Do racial/ethnic differences exist in post-injury outcomes after TBI? A comprehensive review of the literature. Brain Inj. 2009;23(10):775-789.
Haideri NA, Moormeier JA. Impact of patient navigation from diagnosis to treatment in an urban safety net breast cancer population. J Cancer. 2011;2:467-473.
Hausmann LR, Ibrahim SA, Mehrotra A, et al. Racial and ethnic disparities in pneumonia treatment and mortality. Med Care. 2009;47(9):1009-1017.
Houston TK, Allison JJ, Sussman M, et al. Culturally appropriate storytelling to improve blood pressure: a randomized trial. Ann Intern Med. 2011;154(2):77-84.
Jayadevappa R, Johnson JC, Chhatre S, Wein AJ, Malkowicz SB. Ethnic variation in return to baseline values of patient-reported outcomes in older prostate cancer patients. Cancer. 2007;109(11):2229-2238.
Penrod JD, Litke A, Hawkes WG, et al. The association of race, gender, and comorbidity with mortality and function after hip fracture. J Gerontol A Biol Sci Med Sci. 2008;63(8):867-872.
5

Evidence Brief: Racial and Ethnic Disparities within the VA Evidence-based Synthesis Program Supplemental Materials Rafie C, Ayers A, Cadet D, Quillin J, Hackney MH. Reaching Hard to Reach Populations with Hard to Communicate Messages: Efficacy of a Breast Health Research Champion Training Program. J Cancer Educ. 2014.
Thoma MN, Jimenez Cantisano BG, Hernandez AV, Perez A, Castro F. Comparison of adenoma detection rate in Hispanics and whites undergoing first screening colonoscopy: a retrospective chart review. Gastrointest Endosc. 2013;77(3):430-435.
Weisbord SD, Fried LF, Mor MK, et al. Associations of race and ethnicity with anemia management among patients initiating renal replacement therapy. J Natl Med Assoc. 2007;99(11):1218-1226.
Williams AE, Smith WR, Starr AJ, et al. Ethnic differences in posttraumatic stress disorder after musculoskeletal trauma. J Trauma. 2008;65(5):1054-1065.
Wilson DB, McClish D, Tracy K, Quillin J, Jones R, Bodurtha J. Variations in breast cancer screening and health behaviors by age and race among attendees of women's health clinics. J Natl Med Assoc. 2009;101(6):528-535.
Zoellner JM, Connell CC, Madson MB, et al. H.U.B city steps: methods and early findings from a community-based participatory research trial to reduce blood pressure among African Americans. Int J Behav Nutr Phys Act. 2011;8:59.
EXAMINING RACE AS A MEDIATOR Alele JD, Luttrell LM, Hollis BW, Luttrell DK, Hunt KJ. Relationship between vitamin D status and incidence of vascular events in the Veterans Affairs Diabetes Trial. Atherosclerosis. 2013;228(2):502-507.
Kokkinos P, Myers J, Faselis C, Doumas M, Kheirbek R, Nylen E. BMI-mortality paradox and fitness in African American and Caucasian men with type 2 diabetes. Diabetes Care. 2012;35(5):1021-1027.
Williams EC, Bradley KA, Gupta S, Harris AH. Association between alcohol screening scores and mortality in black, Hispanic, and white male veterans. Alcohol Clin Exp Res. 2012;36(12):2132-2140.
INELIGIBLE SETTING Blumberg SN, Warren SM. Disparities in initial presentation and treatment outcomes of diabetic foot ulcers in a public, private, and Veterans Administration hospital. J Diabetes. 2014;6(1):68-75.
Bottonari KA, Stepleman LM. Improving access to mental health services via a clinic-wide mental health intervention in a Southeastern US infectious disease clinic. AIDS Care. 2010;22(2):133-136.
Bromley EG, May FP, Federer L, Spiegel BM, van Oijen MG. Explaining persistent under-use of colonoscopic cancer screening in African Americans: A systematic review. Prev Med. 2014.
INELIGIBLE STUDY DESIGN Alexander DD, Waterbor J, Hughes T, Funkhouser E, Grizzle W, Manne U. African-American and Caucasian disparities in colorectal cancer mortality and survival by data source: an epidemiologic review. Cancer Biomark. 2007;3(6):301-313.
Becerra BJ, Becerra MB. Association between asthma and serious psychological distress among male veterans compared to civilian counterparts. Prev Med. 2014;71C:8-11.
Borzecki AM, Bridgers DK, Liebschutz JM, Kader B, Kazis LE, Berlowitz DR. Racial differences in the prevalence of atrial fibrillation among males. J Natl Med Assoc. 2008;100(2):237-245.
6

Evidence Brief: Racial and Ethnic Disparities within the VA Evidence-based Synthesis Program Supplemental Materials El-Serag H, McGlynn KA, Graham GN, et al. Achieving health equity to eliminate racial, ethnic, and socioeconomic disparities in HBV- and HCV-associated liver disease. J Fam Pract. 2010;59(4 Suppl):S37-42.
Grubaugh AL, Slagle DM, Long M, Frueh BC, Magruder KM. Racial disparities in trauma exposure, psychiatric symptoms, and service use among female patients in Veterans Affairs primary care clinics. Womens Health Issues. 2008;18(6):433-441.
Halanych JH, Wang F, Miller DR, et al. Racial/ethnic differences in diabetes care for older veterans: accounting for dual health system use changes conclusions. Med Care. 2006;44(5):439-445.
Harris GL. Reducing healthcare disparities in the military through cultural competence. J Health Hum Serv Adm. 2011;34(2):145-181.
Ibrahim SA. Racial and ethnic disparities in hip and knee joint replacement: a review of research in the Veterans Affairs Health Care System. J Am Acad Orthop Surg. 2007;15 Suppl 1:S87-94.
Kressin NR, Raymond KL, Manze M. Perceptions of race/ethnicity-based discrimination: a review of measures and evaluation of their usefulness for the health care setting. J Health Care Poor Underserved. 2008;19(3):697-730.
Long JA, Jahnle E, Richardson D, Volpp K. A randomized controlled trial of peer mentoring and financial incentive to improve glucose control in African American Veterans. Journal of general internal medicine. 2011;26(4).
Loo CM, Ueda SS, Morton RK. Group treatment for race-related stresses among minority Vietnam veterans. Transcult Psychiatry. 2007;44(1):115-135.
Nayback AM. Health disparities in military veterans with PTSD: influential sociocultural factors. J Psychosoc Nurs Ment Health Serv. 2008;46(6):41-51.
Nguyen TH, Thrift AP, Ramsey D, et al. Risk Factors for Barrett's Esophagus Compared Between African Americans and Non-Hispanic Whites. Am J Gastroenterol. 2014;109(12):1870-1880.
Nonzee NJ, McKoy JM, Rademaker AW, et al. Design of a prostate cancer patient navigation intervention for a Veterans Affairs hospital. BMC Health Serv Res. 2012;12:340.
Rowley DL, Jenkins BC, Frazier E. Utilization of joint arthroplasty: racial and ethnic disparities in the Veterans Affairs Health Care System. J Am Acad Orthop Surg. 2007;15 Suppl 1:S43-48.
Singh JA. Can racial disparities in optimal gout treatment be reduced? Evidence from a randomized trial. BMC Med. 2012;10:15.
7
Evidence Brief: Racial and Ethnic Disparities within the VA Evidence-based Synthesis Program Supplemental Materials
EVIDENCE TABLES
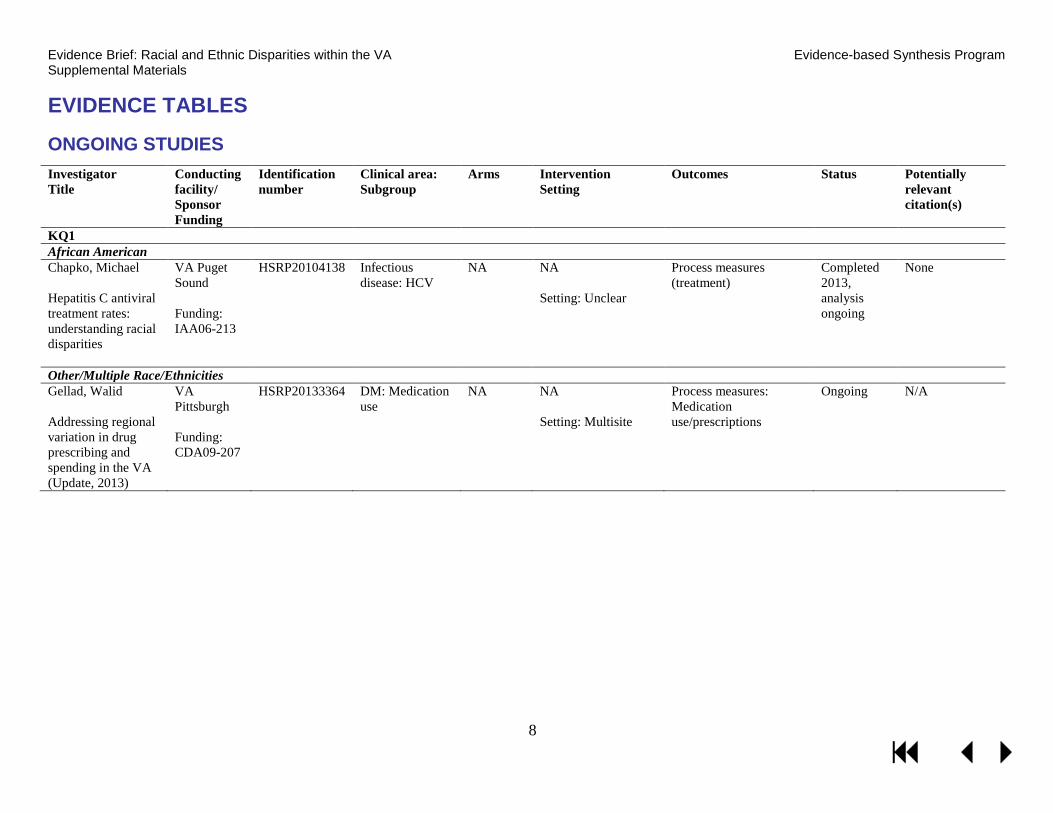
ONGOING STUDIES Investigator Title
Conducting facility/ Sponsor Funding
Identification number
Clinical area: Subgroup
Arms Intervention Setting
Outcomes Status Potentially relevant citation(s)
KQ1 African American Chapko, Michael Hepatitis C antiviral treatment rates: understanding racial disparities
VA Puget Sound Funding: IAA06-213
HSRP20104138
Infectious disease: HCV
NA NA Setting: Unclear
Process measures (treatment)
Completed 2013, analysis ongoing
None
Other/Multiple Race/Ethnicities Gellad, Walid Addressing regional variation in drug prescribing and spending in the VA (Update, 2013)
VA Pittsburgh Funding: CDA09-207
HSRP20133364
DM: Medication use
NA NA Setting: Multisite
Process measures: Medication use/prescriptions
Ongoing N/A
8

Evidence Brief: Racial and Ethnic Disparities within the VA Evidence-based Synthesis Program Supplemental Materials KQ2 African American Hausmann, Leslie R M Staying Positive: An Intervention to Reduce Osteoarthritis Pain Disparities
Sponsor: Department of Veterans Affairs Funding: Unknown
NCT02223858*
Arthritis and pain management: Knee arthritis
Positive activities (PA) Attention control (AC)
PA program: Completion of 6 at-home activities (1 per week) that have been shown to increase positivity. AC program: Completion of 6 affectively neutral activities. Setting: Multisite
Primary: Change in self-reported pain from baseline to 1, 3, and 6 months post-intervention Change in self-reported physical functioning from baseline to 1, 3, and 6 months post-intervention Other: Change in patient global assessment of pain from baseline to 1, 3, and 6 months post-intervention
Not recruiting yet
N/A
Houston, Thomas Using stories to address disparities in hypertension (Update, 2013)
Edith Nourse Rodgers Memorial VA Center for Quality, Outcomes, and Economic Research Funding: IIR10-132
HSRP20134066 Cardiovascular: HTN
Stories DVD Informational DVD
Stories DVD: HTN stories DVD delivered to African American outpatients with uncontrolled blood pressure versus Informational DVD: Non-narrative blood pressure education DVD Setting: Multisite
Patient behavior and outcomes
Ongoing N/A
Other/Multiple Race/Ethnicities Krieger, James W; Nelson, Karin M Peer support for achieving independence in diabetes (Peer AID)
Seattle and Kind County Department of Public Health Funding: R18DK088072-01
HSRP20113241 DM: DM management
Home visits No home visits
5 home visits by community health worker (CHW) Setting: Multisite
Glycemic control via HbA1c, BP, lipids, health care utilization, QOL, DM self-management
Ongoing N/A
*All studies with the exception of NCT02223858 (ClinicalTrials.gov) were retrieved from the NIH NLM HSRProj database.
9

Evidence Brief: Racial and Ethnic Disparities within the VA Evidence-based Synthesis Program Supplemental Materials DATA ABSTRACTION: MORBIDITY/ MORTALITY MULTISITE STUDIES ADDRESSING KQ1 Author Year
Clinical Area Minority Group(s)
N Relevant Conclusions Adjustment Setting Timeframe
Alvord 2009 1
Postoperative complications
AI/AN 4,419 Postoperative complications: frequency distribution similar between racial groups (p=.51) Specific complications: progressive renal insufficiency: 0.2% (AI/AN) vs 0.7% (white) p=.01; pulmonary edema: 0.5% (AI/AN) vs 1.5% (white) p=.04; prolonged ileus: 0.7% (AI/AN) vs 1.4% (white) p=.03 The numbers of complications during hospitalization compared with after discharge were similar among AI/AN and whites (p=.24)
Age group, clinical and laboratory variables, surgical variables
VA-wide NSQIP data 1991-2002
Alvord 2005 2
Postoperative complications
AI/AN 4,419 Morbidity: AI/AN race not associated with risk of 30-day postop morbidity OR=0.9 (0.8-1.1) Mortality: AI/AN race associated with increased risk of 30-day postop mortality OR=1.6 (1.0-2.4)
None VA-wide NSQIP data 1991-2002
Aujesky 2007 3
VTE AA 168 Overall complication rate (death, recurrent VTE, major bleeding): AA race independently associated with increased 90-day overall complication rate OR=5.2 (1.3-21.6).
Study site, age, sex, history of prior VTE, surgery in past 30 days, pulse, systolic blood pressure, respiratory rate, altered mental status, Charlson Comorbidity Index, hemoglobin, creatine, diagnosis of pulmonary embolism
VA Pittsburgh Healthcare System and Philadelphia VA Medical Center 2000-2002
Ayotte 2012 4
Coronary artery obstruction
AA 793 Proportion with moderate/sever angiographic coronary obstruction: black: 25% (13/52) white: 39% (101/259)
None 5 VA sites Cardiac Decision Making Study data 1999-2001
Choi 2009 5
ESRD AA 420,334 Among Veterans with CKD Stage 3A or 3B followed for a median of 3.7 years, black race is associated with increased mortality risk aHR: 1.32 (1.27-1.36) and 1.21 (p<.05), respectively Among Veterans with CKD Stage 4 or 5 followed for a median of 4.8 years, black race is not associated with mortality risk aHR: 1.07 (p>.05) and 0.97 (p>.05), respectively
Age, sex, baseline comorbidities, SES, stratified by eGFR at baseline, adjusted for VA center fixed effects.
VA-wide VA National Patient Care Database, Medicare 2000-2001
10

Evidence Brief: Racial and Ethnic Disparities within the VA Evidence-based Synthesis Program Supplemental Materials Author Year
Clinical Area Minority Group(s)
N Relevant Conclusions Adjustment Setting Timeframe
Choi 2007 6
HIV AA HIV: 12,955 HIV + diabetes: 2,180
ESRD among HIV-infected individuals black vs white: aHR: 5.97 (3.12-11) ESRD among HIV-infected individuals with diabetes black vs white: aHR: 2.33 (1.02-5.35)
Age, sex, baseline eGFR category, CAD, HTN, heart failure, COPD, PVD, HCV infection, CVD, SES
VA-wide VA National Patient Care Database, Medicare 2000-2001
Daskivich 2015 7
Prostate cancer AA, Hispanic
1,258 Cancer-specific and other-cause mortality: AA did not have a statistically significant difference in hazard of prostate cancer mortality, sub-hazard ratio 0.6 (0.28-1.26) or other-cause mortality, sub-hazard ratio 0.98 (0.78-1.22). Hispanic Veterans did not have a statistically significant difference in hazard of prostate cancer mortality, sub-hazard ratio 0.24 (0.03-1.82) or other-cause mortality, sub-hazard ratio 0.87 (0.57-1.31).
Age, tumor risk, site, year of diagnosis, comorbidity
Greater Los Angeles and Long Beach VA Medical Centers, California Cancer Registry 1998-2004
Egede 2012 8
TBI Hispanic, AA
14,690 Higher mortality (Hispanic): HR 1.61 (1.00-2.58) No difference in mortality (AA) HR 1.25 (0.90-1.73)
Socio-demographics, comorbidities
Nationwide Veterans Health Administration Decision Support System and Vital Status Files 2006
11

Evidence Brief: Racial and Ethnic Disparities within the VA Evidence-based Synthesis Program Supplemental Materials Author Year
Clinical Area Minority Group(s)
N Relevant Conclusions Adjustment Setting Timeframe
El-Serag 2014 9
HCV AA, Hispanic, other
149,407 Incident cirrhosis: AA and Hispanic race associated with incident cirrhosis. AA adjusted hazard ratio=0.576 (0.553-0.601), Hispanic adjusted hazard ratio=1.283 (1.206-1.365), Other adjusted hazard ratio=0.919 (0.807-1.047). Incident HCC: AA and Hispanic race associated with incident HCC. AA adjusted hazard ratio=0.770 (0.713-0.832), Hispanic adjusted hazard ratio=1.610 (1.440-1.801), Other adjusted hazard ratio=1.005 (0.782-1.292). Prevalent cirrhosis: AA, Hispanic and other race associated with prevalent cirrhosis. AA OR=0.393 (0.374-0.413), Hispanic OR=1.224 (1.141-1.313), Other OR=0.826 (0.711-0.960). Prevalent HCC: AA and Hispanic race associated with prevalent HCC. AA OR=0.586 (0.492-0.697), Hispanic OR=2.009 (1.613-2.502), Other OR=0.790 (0.434-1.441).
Age, sex, period of service, year of HCV diagnosis, diabetes, alcohol abuse, HIV, Hep B co-infection, BMI, HCV genotype, antiviral treatment
VA-wide Veterans Administration HCV Clinical Case Registry data 1999-2010
Freeman 2003 10
Prostate cancer AA 864 All-cause mortality: black vs. white HRR 1.50 (0.94-2.38)
Age, Charlson comorbidity score, tumor differentiation, first-course treatment, mean household income per capita by zip code
2 VA hospitals and 2 private university medical centers Medical records data 1986-1990
Frei 2010 11
Community-acquired pneumonia
AA Medical ward: 35,706 ICU: 5,172
Mortality - medical wards: AA race was not associated with 30-day mortality OR=0.98 (0.87-1.10) Mortality - intensive care units: AA race was associated with 30-day mortality OR=0.82 (0.68-0.99)
Age, sex, marital status, priority group, comorbid conditions, organ failure and sepsis, hospital
VA-wide VHA administrative data 2002-2007
12
Evidence Brief: Racial and Ethnic Disparities within the VA Evidence-based Synthesis Program Supplemental Materials Author Year
Clinical Area Minority Group(s)
N Relevant Conclusions Adjustment Setting Timeframe
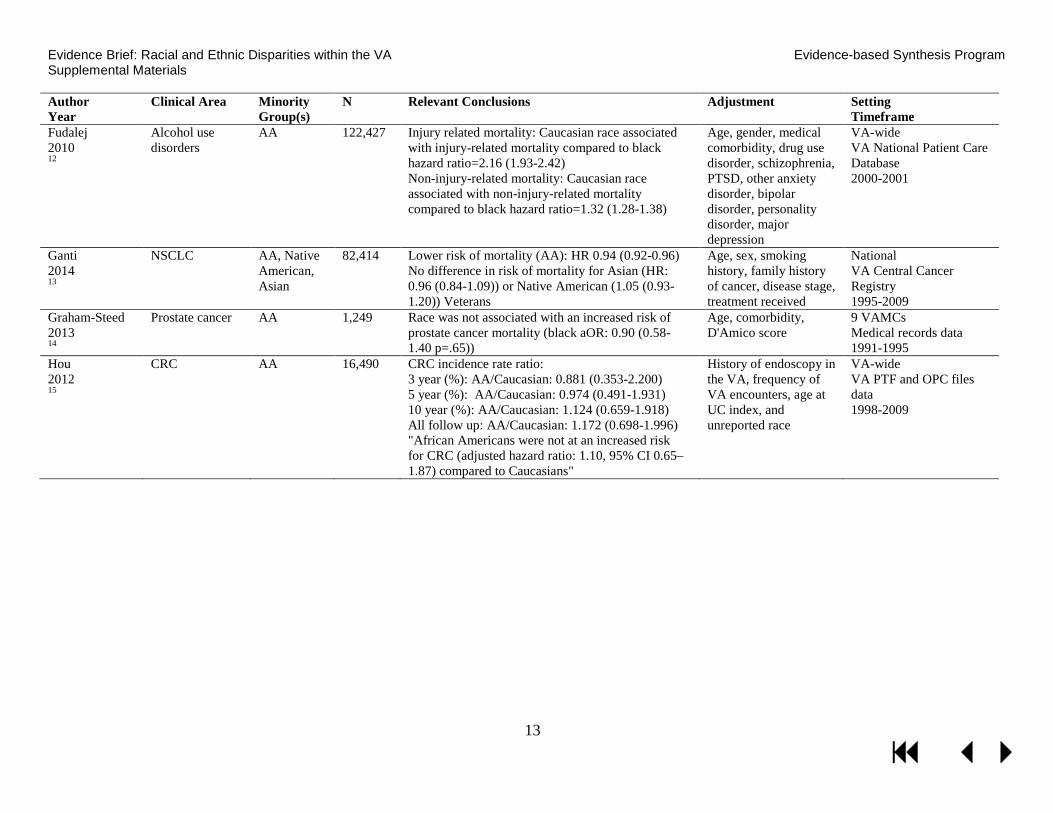
Fudalej 2010 12
Alcohol use disorders
AA 122,427 Injury related mortality: Caucasian race associated with injury-related mortality compared to black hazard ratio=2.16 (1.93-2.42) Non-injury-related mortality: Caucasian race associated with non-injury-related mortality compared to black hazard ratio=1.32 (1.28-1.38)
Age, gender, medical comorbidity, drug use disorder, schizophrenia, PTSD, other anxiety disorder, bipolar disorder, personality disorder, major depression
VA-wide VA National Patient Care Database 2000-2001
Ganti 2014 13
NSCLC AA, Native American, Asian
82,414 Lower risk of mortality (AA): HR 0.94 (0.92-0.96) No difference in risk of mortality for Asian (HR: 0.96 (0.84-1.09)) or Native American (1.05 (0.93-1.20)) Veterans
Age, sex, smoking history, family history of cancer, disease stage, treatment received
National VA Central Cancer Registry 1995-2009
Graham-Steed 2013 14
Prostate cancer AA 1,249 Race was not associated with an increased risk of prostate cancer mortality (black aOR: 0.90 (0.58-1.40 p=.65))
Age, comorbidity, D'Amico score
9 VAMCs Medical records data 1991-1995
Hou 2012 15
CRC AA 16,490 CRC incidence rate ratio: 3 year (%): AA/Caucasian: 0.881 (0.353-2.200) 5 year (%): AA/Caucasian: 0.974 (0.491-1.931) 10 year (%): AA/Caucasian: 1.124 (0.659-1.918) All follow up: AA/Caucasian: 1.172 (0.698-1.996) "African Americans were not at an increased risk for CRC (adjusted hazard ratio: 1.10, 95% CI 0.65–1.87) compared to Caucasians"
History of endoscopy in the VA, frequency of VA encounters, age at UC index, and unreported race
VA-wide VA PTF and OPC files data 1998-2009
13

Evidence Brief: Racial and Ethnic Disparities within the VA Evidence-based Synthesis Program Supplemental Materials Author Year
Clinical Area Minority Group(s)
N Relevant Conclusions Adjustment Setting Timeframe
Jha 2010 16
AMI, hip fracture, stroke, CHF, GI hemorrhage, pneumonia
AA 318,610 aOR of 30-day mortality for black vs white (95% CI) Pneumonia: Under 65: 1.07 (0.96-1.18) 65 and older: 0.89 (0.84-0.94) CHF: Under 65: 0.72 (0.62-0.83) 65 and older: 0.69 (0.65-0.75) GI bleed: Under 65: 0.92 (0.77-1.09) 65 and older: 0.90 (0.80-1.00) Hip fracture: Under 65: 0.60 (0.25-1.45) 65 and older: 0.72 (0.58-0.90) Stroke: Under 65: 1.15 (0.97-1.35) 65 and older: 0.83 (0.75-0.91) AMI: Under 65: 1.16 (0.97-1.40) 65 and older: 0.74 (0.67-0.83) Higher for MI and pneumonia, but comparable for others
Hospital minority-serving status, age, Elixhauser comorbidities
VA-wide VA PTF 1996-2002
Jones 2014 17
Advanced chronic systolic heart failure
AA 898 Black not a predictor of death in VA sample: 2-year all-cause mortality: HR 1.14 (0.86-1.50)
Age, sex, NYHA class, CAD, diabetes, HTN, afib, PVD, CKD, randomization to bucindolol, pulmonary edema, and LVEF/RVEF
VA hospitals participating in BEST trial 1995-1999
Kamalesh 2007 18
Stroke AA 55,094 1-year mortality higher for whites: 13.1% vs 12.2%; absolute difference = 0.9%; HR 1.06 (1.02-1.10)
Age, sex, comorbid conditions and prior hospitalizations
VA-wide VA PTF 1990-1997
Kokkinos 2009 19
DM AA 3,148 The risk of all-cause mortality is higher in black compared to white Veterans aHR: 1.23 (1.02-1.47)
Age, CVD, BP, cardiovascular meds, insulin and oral glycemic agents, and peak exercise capacity
2 VAMCs Medical records data 1986-2007
14

Evidence Brief: Racial and Ethnic Disparities within the VA Evidence-based Synthesis Program Supplemental Materials Author Year
Clinical Area Minority Group(s)
N Relevant Conclusions Adjustment Setting Timeframe
Kovesdy 2013 20
CKD AA 570,808 Among Veterans with CKD Stage 3A or 3B followed for a median of 4.7 years, black race is associated with decreased 5-year mortality aHR: 0.88 (0.81-0.97) and 0.81 (0.71-0.92), respectively Among Veterans with CKD Stage 4 or 5 followed for a median of 4.7 years, black race is not associated with 5-year mortality aHR: 1.01 (0.81-1.27) and 0.83 (0.48-1.44), respectively
Age, sex, marital and insurance status, region, DM, CVD, vascular disease, cerebrovascular disease, CHF, comorbidity score, glomerular filtration rate, serum albumin, cholesterol, hemoglobin, WBC, serum alkaline phosphatase values
VA-wide VA Inpatient and Outpatient SAS datasets, Medicare 2004-2006
Kressin 2007 21
CVD AA 1,022 Change in functional status outcomes (whites relative to AA): Models excluding Negative Affectivity, experiences of discrimination, optimism, and magnitude of ischemia: mean (95% posterior intervals) Baseline-6 month: PCS: -2.31 (-4.03, -0.60) MCS: 0.44 (-1.68, 2.62) PL: 0.18 (-4.49, 4.84) TS: -1.33 (-4.62, 2.05) AF: 1.39 (-2.17, 5.01) AS: -1.32 (-6.25, 3.42) DP: 0.43 (-3.79, 4.81) "The baseline Bayesian regression analysis indicated that there were no significant effects of race, after adjusting for the covariates"
Sociodemographics, comorbid conditions, maximal medical therapy, severity of ischemia on nuclear imaging study, personal attitudes, and beliefs
5 VA hospitals Seattle Angina Questionnaire for functional status data 1999-2001
Lynch 2014 22
DM AA, Hispanic
625,903 Adjusted for race/ethnicity in the association between comorbidities and mortality in diabetes, but did not report measure of association.
Age, sex, marital status, area of residence, service connection, geographic region.
VA-wide VA patient and administrative files data 2002-2006
15

Evidence Brief: Racial and Ethnic Disparities within the VA Evidence-based Synthesis Program Supplemental Materials Author Year
Clinical Area Minority Group(s)
N Relevant Conclusions Adjustment Setting Timeframe
Meyers 2008 23
Angina, CHF, acute myocardial infarction, GI hemorrhage, stroke, diabetes
AA, other 14,122 No association between African American race and risk of hospital death aOR=0.95 (0.72-1.26) No association between Other race and risk of hospital death aOR=1.01 (0.73-1.40)
Patient-level: Age, fiscal year, military rank, marital status, comorbidities, length of stay, primary admission diagnosis Hospital-level: # of patients treated annually, availability of coronary artery bypass surgery, proportion of non-Caucasian patients with diagnoses of interest, and region
54 hospitals in the DCS of the MHS 2000-2004
Optenberg 1995 24
Prostate cancer AA 1,606 5-yr survival: blacks=76.7% vs whites=76.5%, NSD for stage groups A/B and C/D1, but blacks with distant metastases (stage D2) had statistically significant survival improvement compared to whites, 48.3% and 36.2%, respectively (P=.04, likelihood ratio)
Stratified by stage and then adjusted for age and date of entry
National, DEERS ACTUR database 1973-1994
16
Evidence Brief: Racial and Ethnic Disparities within the VA Evidence-based Synthesis Program Supplemental Materials Author Year
Clinical Area Minority Group(s)
N Relevant Conclusions Adjustment Setting Timeframe
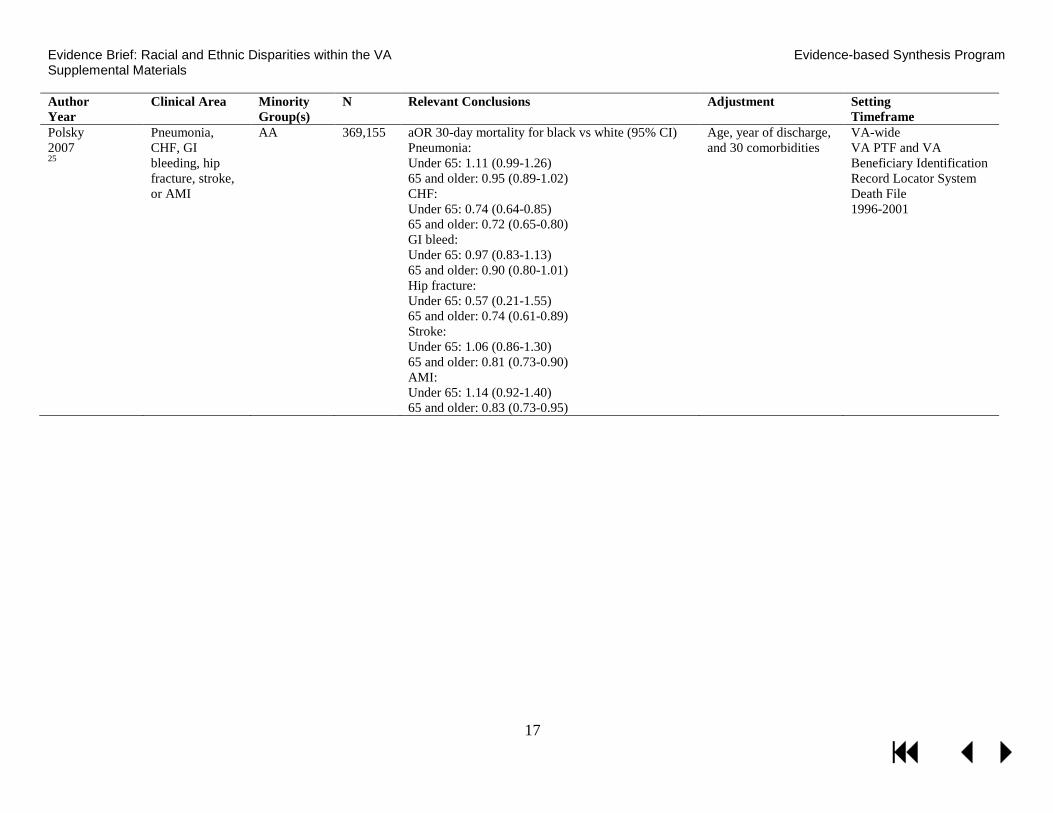
Polsky 2007 25
Pneumonia, CHF, GI bleeding, hip fracture, stroke, or AMI
AA 369,155 aOR 30-day mortality for black vs white (95% CI) Pneumonia: Under 65: 1.11 (0.99-1.26) 65 and older: 0.95 (0.89-1.02) CHF: Under 65: 0.74 (0.64-0.85) 65 and older: 0.72 (0.65-0.80) GI bleed: Under 65: 0.97 (0.83-1.13) 65 and older: 0.90 (0.80-1.01) Hip fracture: Under 65: 0.57 (0.21-1.55) 65 and older: 0.74 (0.61-0.89) Stroke: Under 65: 1.06 (0.86-1.30) 65 and older: 0.81 (0.73-0.90) AMI: Under 65: 1.14 (0.92-1.40) 65 and older: 0.83 (0.73-0.95)
Age, year of discharge, and 30 comorbidities
VA-wide VA PTF and VA Beneficiary Identification Record Locator System Death File 1996-2001
17

Evidence Brief: Racial and Ethnic Disparities within the VA Evidence-based Synthesis Program Supplemental Materials Author Year
Clinical Area Minority Group(s)
N Relevant Conclusions Adjustment Setting Timeframe
Polsky 2008 26
Pneumonia, CHF, GI bleeding, hip fracture, stroke, or AMI
AA 155,529 Difference in mortality rate between black and white (%) Pneumonia: 30-day: -1.3 (p<.05) 2-year: 0.3 CHF: 30-day: -1.3 (p<.05) 2-year: -2.8 (p<.05) GI bleed: 30-day: -0.5 (p<.05) 2-year: 0.4 Hip fracture: 30-day: -2.9 (p<.05) 2-year: 2.3 Stroke: 30-day: -2.1 (p<.05) 2-year: 2.5 (p<.05) AMI: 30-day: -2.7 (p<.05) 2-year: -1.0
Health risk (age, sex, year of discharge, comorbid conditions), SES (median household income, percentage of population with college degrees, and urbanicity of patient’s zipcode of residence), and hospital fixed effects.
VA-wide VA PTF 1998-2002
Samuel 2014 27
Cancer (colorectal, prostate, lung)
AA Colorectal N=12,897Lung N=25,608Prostate N=38,202
Lower 3-year survival for colon cancer aOR 0.75 (0.62-0.89) and rectal cancer=aOR 0.61 (0.42-0.87)
Age, gender, marital status, cancer history, Charlson comorbidity score, year of diagnosis, tumor grade, stage and size; hospital fixed effects
Nationwide, VA cancer registry data and Medicare administrative data 2001-2004
18

Evidence Brief: Racial and Ethnic Disparities within the VA Evidence-based Synthesis Program Supplemental Materials Author Year
Clinical Area Minority Group(s)
N Relevant Conclusions Adjustment Setting Timeframe
Sarrazin 2009 28
COPD AA 50,979 Risk adjusted odds of death were lower in AA relative to white patients (aOR: 0.69; p<.001) Mortality rate: 7.1% AA vs. 9.2% white, p<.001
Clinical-demographic factors (admission source, principle diagnosis, year of admission, prior hospital and COPD-related admissions, comorbidities), ICU admission and mechanical ventilation or noninvasive ventilation use
Nationwide VA PTF and OCF 2002-2006
Shaw 2014 29
PTSD and spontaneous preterm delivery
AA, AI/AN 16,334 Black (aOR: 1.49 (1.29-1.71), p<.001) and AI/AN (aOR: 1.99 (1.15-3.45), p=.01) were associated with PTSD and spontaneous preterm birth.
Model 1: PTSD status, age, twins or higher order, deployed Model 2: Model 1 + chronic disease indicators Model 3: Model 1 + substance abuse Model 4: Model 1 + other psychiatric diagnoses
VA-wide National clinical and administrative databases for VHA and outsourced care 2000-2012
Shimada 2008 30
Postoperative and surgical complications
AA, Latino, API, AI/AN
black: 294,381 Latino: 244,397 API: 236,845 AI/AN: 236,369
Death in low mortality DRGs: black vs white: aOR=1.18 (p>.05) Latino vs white: aOR=1.32 (p>.05) Asian American/PI vs white: OR=0.44 (p>.05) American Indian vs white: OR=0.94 (p>.05)
Age, sex, and 27 comorbidities
VA-wide VA PTF and OCF 2001-2005
19

Evidence Brief: Racial and Ethnic Disparities within the VA Evidence-based Synthesis Program Supplemental Materials Author Year
Clinical Area Minority Group(s)
N Relevant Conclusions Adjustment Setting Timeframe
Tseng 2011 31
DM AA 405,580 - 739,377
Rate of decline in initial lower extremity amputation (ILEA) is not different between black and white Veterans (p=.37) and Hispanic and white Veterans (p=.91).
Age, sex, marital status, census region, rural/urban, disability, microvascular, macrovascular, and metabolic complications, diabetes medications
VA-wide VA Diabetes Epidemiology Cohorts data 2000-2004
Volpp 2007 32
pneumonia, CHF, GI bleeding, hip fracture, stroke, or AMI
AA 283,912 aOR 30-day mortality for black vs white (95% CI) Pneumonia: Under 65: 1.09 (0.98-1.21) 65 and older: 0.90 (0.85-0.95) CHF: Under 65: 0.71 (0.62-0.82) 65 and older: 0.70 (0.65-0.76) GI bleed: Under 65: 0.93 (0.78-1.10) 65 and older: 0.88 (0.79-0.99) Hip fracture: Under 65: 0.66 (0.28-1.55) 65 and older: 0.73 (0.58-0.90) Stroke: Under 65: 1.12 (0.95-1.32) 65 and older: 0.81 (0.74-0.89) AMI: Under 65: 1.19 (0.99-1.43) 65 and older: 0.75 (0.67-0.84)
Age, discharge year, comorbidities, SES, hospital site, national death index deaths added
VA-wide VA PTF 1996-2002
Zullig 2013 33
NSCLC 2,200 AA Longer survival for AA patients than for Caucasian patients (133 days vs 117 days, hazard ratio 0.31, P<0.01)
Stage at diagnosis, performance stage, age
National External Peer Review Program data 2006-2007
20

Evidence Brief: Racial and Ethnic Disparities within the VA Evidence-based Synthesis Program Supplemental Materials DATA ABSTRACTION: MORBIDITY/MORTALITY SINGLE SITE STUDIES ADDRESSING KQ1
Author Year
Clinical Area Minority Group(s)
N Relevant Conclusions Adjustment Setting Data Source Timeframe
Agarwal 2008 34
ESRD AA 220 Black race was a predictor of ESRD (HR: 2.75). Age, log eGFR, log protein/creatinine ratio, systolic blood pressure and CAD
Richard L. Roudebush VAMC VA electronic medical record system Timeframe NR
Dahodwala 2011 35
Parkinson's disease/ dementia
AA 74 After controlling for age and education, AA race was strongly associated with later PD stage at diagnosis, with an increased OR of 3.32 (95% CI 1.01–10.93, p = 0.05) of presenting 1 stage later than whites. However, when including the variable indicating whether individuals under-reported disability relative to motor impairment, the magnitude of the association between race and stage at diagnosis decreased by 30% and the OR was no longer statistically significant (OR 2.34, 95% CI 0.67–8.19, p = 0.18).
Model 1: age and education, Model 2: under-report of disability/ symptoms
Philadelphia VAMC Electronic medical records data 2001-2010
Ellis 2009 36
Stroke Various: AA, other
4115 Likelihood of death: aHR for black 1.25 (1.10-1.43) and all other vs white, 0.84 (0.72-0.98)
Age, sex, HTN, CHD, diabetes, cancer, depression, Charlson comorbidity <2 vs 2
Charleston, SC VAMC VHA patient and administrative files 2000-2006
Koscuiszka 2012 37
Cancer (prostate, nonmetastatic, deferred primary treatment)
AA 518 More AA patients died, but NS: 14% vs 11%, P=0.81; Survival aHR=0.93 (0.54-1.60)
Age, PSA, Gleason Score, Palliative treatment
New York VAMC Pathology database 1990-2005
Liang 2013 38
SSI AA 128 On multivariate analysis, white race was associated with a significantly higher risk of developing an SSI (black race OR 95% CI: (0.35; 0.13- 0.86), p=0.03)
History of fascial dehiscence, colostomy, thicker subcutaneous fat
Michael E. DeBakey VAMC Medical records data 2005-2001
Lynch 2010 39
DM AA 8,812 Among Veterans with diabetes, the risk of mortality is higher among non-Hispanic blacks vs NHW aHR=0.84 (0.75-0.94)
Age, sex, employment status, marital status, HbA1c level, hypertension, CHD, cancer, PTSD
Southeastern VA facility VHA DSS files data 1997-2006
21
Evidence Brief: Racial and Ethnic Disparities within the VA Evidence-based Synthesis Program Supplemental Materials
Author Year
Clinical Area Minority Group(s)
N Relevant Conclusions Adjustment Setting Data Source Timeframe
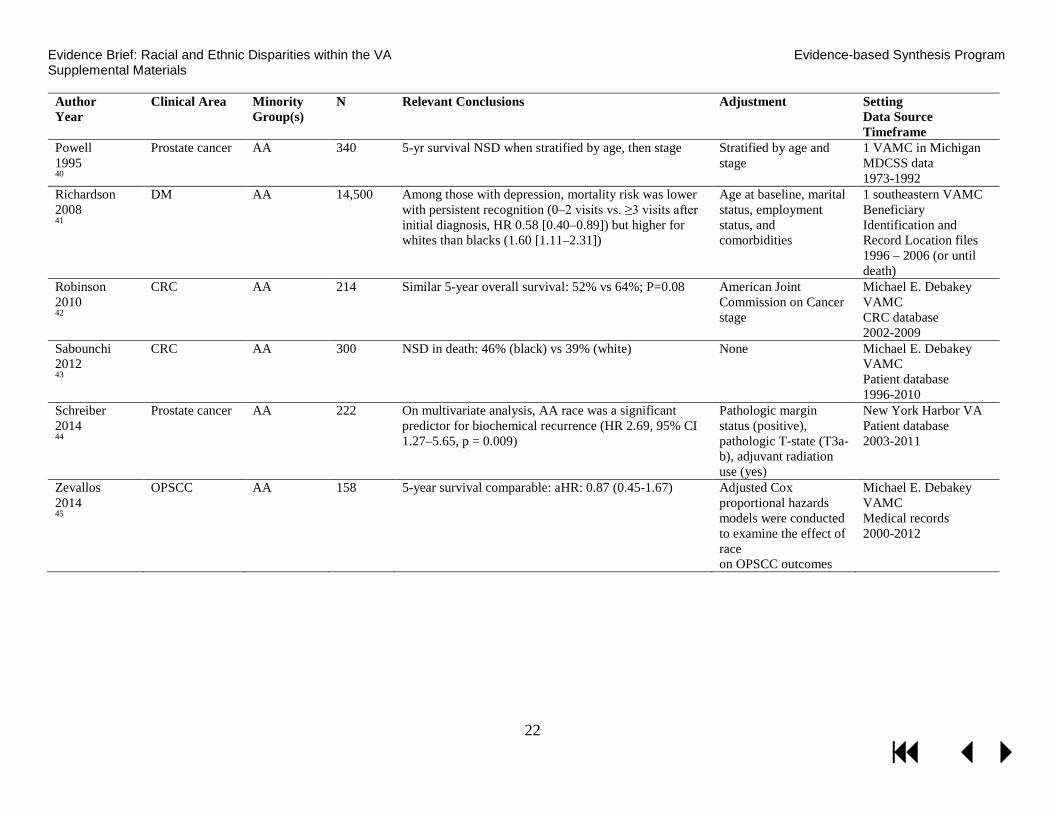
Powell 1995 40
Prostate cancer AA 340 5-yr survival NSD when stratified by age, then stage Stratified by age and stage
1 VAMC in Michigan MDCSS data 1973-1992
Richardson 2008 41
DM AA 14,500 Among those with depression, mortality risk was lower with persistent recognition (0–2 visits vs. ≥3 visits after initial diagnosis, HR 0.58 [0.40–0.89]) but higher for whites than blacks (1.60 [1.11–2.31])
Age at baseline, marital status, employment status, and comorbidities
1 southeastern VAMC Beneficiary Identification and Record Location files 1996 – 2006 (or until death)
Robinson 2010 42
CRC AA 214 Similar 5-year overall survival: 52% vs 64%; P=0.08 American Joint Commission on Cancer stage
Michael E. Debakey VAMC CRC database 2002-2009
Sabounchi 2012 43
CRC AA 300 NSD in death: 46% (black) vs 39% (white) None Michael E. Debakey VAMC Patient database 1996-2010
Schreiber 2014 44
Prostate cancer AA 222 On multivariate analysis, AA race was a significant predictor for biochemical recurrence (HR 2.69, 95% CI 1.27–5.65, p = 0.009)
Pathologic margin status (positive), pathologic T-state (T3a-b), adjuvant radiation use (yes)
New York Harbor VA Patient database 2003-2011
Zevallos 2014 45
OPSCC AA 158 5-year survival comparable: aHR: 0.87 (0.45-1.67) Adjusted Cox proportional hazards models were conducted to examine the effect of race on OPSCC outcomes
Michael E. Debakey VAMC Medical records 2000-2012
22

Evidence Brief: Racial and Ethnic Disparities within the VA Evidence-based Synthesis Program Supplemental Materials DATA ABSTRACTION: INTERVENTION STUDIES ADDRESSING KQ2
Author Year Study design
Clinical area
Minority groups N
Setting Observation period Follow-up Population Intervention
Outcomes Results
Long 201246 RCT
Diabetes Black Control: N=39 Peer mentoring: N=38 Financial incentives: N=40
Philadelphia VA Medical Center October 2009 to October 2010 6 months
Control: Mean age (SD): 60 (4) Male: 92% Any complications: 92% Mean baseline HbA1c (SD): 9.9 (1.6) Peer mentoring: Mean age (SD): 60 (5) Male: 100% Any complications: 82% Mean baseline HbA1c (SD): 9.8 (1.8) Financial incentives: Mean age (SD): 59 (5) Male: 90% Any complications: 98% Mean baseline HbA1c (SD): 9.5 (1.2)
Control: -Notified of baseline HbA1c, informed of ADA/VA HbA1c targets Peer mentoring: -Notified of baseline HbA1c, informed of ADA/VA HbA1c targets -Matched to trained mentors by age and gender -Monthly phone calls on motivations, goals Financial incentives: -Notified of baseline HbA1c, informed of ADA/VA HbA1c targets -$100 for 1-point drop in HbA1c -$200 for 2-point drop in HbA1c or to 6.5%
Mean percent change in HbA1c (95% CI) Control: -0.01 (-0.52, 0.51) Peer mentoring: -1.08 (-1.62, -0.54) Financial incentives: -0.46 (-1.02, 0.10) Mean percent change relative to control, controlled for baseline HbA1c, marital status, insulin use, diabetes comorbidities, duration of diabetes, self-reported adherence (95% CI) Peer mentoring: -1.07 (-1.84, -0.31), p=.006 Financial incentives: -0.45 (-1.23, 0.32), p=.25
23

Evidence Brief: Racial and Ethnic Disparities within the VA Evidence-based Synthesis Program Supplemental Materials
Author Year Study design
Clinical area
Minority groups N
Setting Observation period Follow-up Population Intervention
Outcomes Results
Ibrahim 201347 RCT
Arthritis and pain management
Black Attention control: N=161 Decision aid: N=162 Motivational interviewing: N=158 Decision aid + motivational interviewing: N=158
Pittsburgh, Cleveland, and Philadelphia VA Medical Centers March 2007 to February 2009 12 months
Attention control: Mean age (SD): 61.3 (8.3) Male: 94% Cumulative Illness Scale score (SD): 2.8 (2.1) Decision aid: Mean age (SD): 60.7 (9.3) Male: 93% Cumulative Illness Scale score (SD): 2.9 (2.0) Motivational interviewing: Mean age (SD): 61.4 (8.7) Male: 94% Cumulative Illness Scale score (SD): 2.9 (1.9) Decision aid + motivational interviewing: Mean age (SD): 60.9 (8.3) Male: 94% Cumulative Illness Scale score (SD): 3.1 (2.3)
Attention control: -Received education booklet on OA Decision aid: -40-min video on treatment option risks, benefits, and efficacy Motivational interviewing: -30-min counseling session with trained interventionist Decision aid + motivational interviewing: -40-min video on treatment option risks, benefits, and efficacy, then -30-min counseling session with trained interventionist
Willingness to consider TKR compared with baseline, adjusted for age, baseline WOMAC score, comorbidity index aOR (95% CI) Attention control: 1 month: 1.79 (0.98, 3.26) 3 months: 1.16 (0.63, 2.12) 12 months: 1.15 (0.62, 2.13) Decision aid: 1 month: 2.46 (1.30, 4.63) 3 months: 2.22 (1.16, 4.25) 12 months: 1.96 (1.00, 3.85) Motivational interviewing: 1 month: 2.41 (1.24, 4.69) 3 months: 0.89 (0.47, 1.68) 12 months: 1.50 (0.76, 2.99) Decision aid + motivational interviewing: 1 month: 1.97 (1.00, 3.89) 3 months: 1.01 (0.52, 1.98) 12 months: 0.87 (0.44, 1.72)
24

Evidence Brief: Racial and Ethnic Disparities within the VA Evidence-based Synthesis Program Supplemental Materials QUALITY ASSESSMENT: INCLUDED MORBIDITY/MORTALITY STUDIES ADDRESSING KQ1 Author Year Country
Non-biased selection?
Adequate handling of missing data?
Outcomes pre-specified and defined?
Ascertainment techniques adequately described? Data source.
Non-biased and adequate ascertainment methods? Validation of VA race/ethnicity data?
Level of adjustment for potential confounders
Adequate duration of follow-up?
Overall quality rating
Alvord 20091
Yes: AI/AN and Caucasian men who underwent procedures between 1991-2002
Unknown.
Yes. Yes: National Surgical Quality Improvement Program (NSQIP) database
Yes: Race and ethnicity were determined either by the clinicians caring for the patients or from the medical record No
No adjustment.
Yes. Poor.
Alvord 20052
Yes: AI/AN and Caucasian men who underwent procedures between 1991-2002
Yes: Missing values were imputed within each race for selected variables using a regression procedure developed by NSQIP, and based on previous models to estimate missing values
Yes. Yes: National Surgical Quality Improvement Program (NSQIP) database
Yes: Race and ethnicity were determined either by the clinicians caring for the patients or from the medical record No
High: Age, dependent functional status, wound infection, COPD, ventilator-dependent, albumin ≤2.5 g/dL, hematocrit ≤38%, ASA class ≥4%, emergency operation, operative complexity score; matched by VAMC facility.
Yes. Good.
25

Evidence Brief: Racial and Ethnic Disparities within the VA Evidence-based Synthesis Program Supplemental Materials Author Year Country
Non-biased selection?
Adequate handling of missing data?
Outcomes pre-specified and defined?
Ascertainment techniques adequately described? Data source.
Non-biased and adequate ascertainment methods? Validation of VA race/ethnicity data?
Level of adjustment for potential confounders
Adequate duration of follow-up?
Overall quality rating
Aujesky 20073
Yes. Veterans treated for VTE at the VA Pittsburgh Philadelphia Medical Centers in 2000-2002
Unknown. Yes. Yes. VA National Patient Care Database
Yes. No.
Death: no adjustment Complications: high: Age, sex, history of VTE, surgery in past 30 days, pulse, BP, RR, altered mental status, comorbidity index, hemoglobin, creatinine, PE, study site
Yes. Fair for complications, poor for death.
Ayotte 20124
Yes. Data from the Cardiac Decision Making Study, white and black male Veterans who had cardiac nuclear imaging study performed between August 1999 and January 2001.
No. Excluded 23% with incomplete data.
Yes. Yes. Cardiac Decision Making Study.
Yes. No.
None. N/A Poor.
26

Evidence Brief: Racial and Ethnic Disparities within the VA Evidence-based Synthesis Program Supplemental Materials Author Year Country
Non-biased selection?
Adequate handling of missing data?
Outcomes pre-specified and defined?
Ascertainment techniques adequately described? Data source.
Non-biased and adequate ascertainment methods? Validation of VA race/ethnicity data?
Level of adjustment for potential confounders
Adequate duration of follow-up?
Overall quality rating
Choi 20076
Yes. Veterans with at least one serum creatinine measurement in the VA Decision Support System Laboratory Results File without ESRD between October 2000 and September 2001
Yes. 14% excluded with ESRD or unknown, nonblack or nonwhite race.
Yes. Yes. VA Decision Support System Laboratory Results File, Immunology Case Registry, VA National Patient Care Database, Medicare.
Yes. Yes. Preferentially use Medicare race data.
High: Age, sex, baseline eGFR category, CAD, HTN, heart failure, COPD, PVD, HCV infection, CVD, SES; clustering within zip code of residence.
Yes. Good.
27

Evidence Brief: Racial and Ethnic Disparities within the VA Evidence-based Synthesis Program Supplemental Materials Author Year Country
Non-biased selection?
Adequate handling of missing data?
Outcomes pre-specified and defined?
Ascertainment techniques adequately described? Data source.
Non-biased and adequate ascertainment methods? Validation of VA race/ethnicity data?
Level of adjustment for potential confounders
Adequate duration of follow-up?
Overall quality rating
Choi 20095 US
Yes. “To be eligible for the study, we included all veterans of white or black race with one or more outpatient serum creatinine level recorded at a VA facility between October 2000 and September 2001. Patients entered the study at the time of their first creatinine measurement during the enrollment period.”
Yes. 14% excluded due to missing data.
Yes. Yes. VA National Patient Care Database, VA Fee Basis files, Medicare Denominator File, Immunology Case Registry, and inpatient and outpatient Medicare claims, VA death registry, Beneficiary Identification and Records Locator Subsystem, US Census, US Renal Data System.
Yes. Yes. Preferentially used Medicare race data
High: Age, sex, baseline comorbidities, SES, stratified by eGFR at baseline, VA center.
Yes. Good.
28

Evidence Brief: Racial and Ethnic Disparities within the VA Evidence-based Synthesis Program Supplemental Materials Author Year Country
Non-biased selection?
Adequate handling of missing data?
Outcomes pre-specified and defined?
Ascertainment techniques adequately described? Data source.
Non-biased and adequate ascertainment methods? Validation of VA race/ethnicity data?
Level of adjustment for potential confounders
Adequate duration of follow-up?
Overall quality rating
Daskivich 20157
Yes. All men newly diagnosed with prostate cancer at the Greater Los Angeles and Long Beach VA Medical Centers between 1998 and 2004.
No;. Excluded 22% with incomplete data.
Yes. Yes. California Cancer Registry, VA medical records.
Yes. No.
High: Age, site, comorbidity, PSA at diagnosis, T stage, gleason score, d’amico tumor risk.
Yes. Fair.
Egede 20128 US
Yes. “Veterans who had an ICD-9 code for clinically diagnosed TBI between January 1, 2006 and December 31, 2006.”
Unknown. Yes. Yes. VA electronic medical records.
Yes. No.
Medium: Age, marital status, gender, service connectedness, urban residence, VA region of residence, insurance status, comorbidities.
Yes. Fair.
El-Serag 20149
Yes. Patients diagnosed with HCV in the VA between October 1999 and January 2010.
Yes. 8% excluded due to missing race/ethnicity data.
Yes. Yes. VA HCV Clinical Case Registry (CCR) and VA Patient Treatment File
Yes. No.
High: Age, sex, period of service, year of diagnosis, diabetes, alcohol abuse, HIV, Hep B coinfection, BMI, HCV genotype, HCV treatment response, HCV treatment response, antiviral treatment.
Yes. Good.
29

Evidence Brief: Racial and Ethnic Disparities within the VA Evidence-based Synthesis Program Supplemental Materials Author Year Country
Non-biased selection?
Adequate handling of missing data?
Outcomes pre-specified and defined?
Ascertainment techniques adequately described? Data source.
Non-biased and adequate ascertainment methods? Validation of VA race/ethnicity data?
Level of adjustment for potential confounders
Adequate duration of follow-up?
Overall quality rating
Freeman 200310 US
Yes. “The cohort consisted of all cases of adenocarcinoma of the prostate diagnosed among black and white men at 2 private university medical centers between January 1, 1986 and December 31, 1990.”
No. 74% of cases identified had were included in analysis.
Yes. Yes. Inpatient and outpatient medical records from 2 VA and 2 private hospitals.
Yes. No.
Medium: Age, moderate differentiation, poor differentiation, stage, treatment.
Yes. Follow-up ended on December 31, 3000.
Fair.
Frei 201011
Yes. VHA patients 65 years and older diagnosed with pneumonia between 2002-2007
Unknown. Yes. Yes. VHA administrative databases
Yes. No.
High: Age, sex, marriage status, priority group, comorbidities, organ failure and sepsis, site.
Yes. Good.
30

Evidence Brief: Racial and Ethnic Disparities within the VA Evidence-based Synthesis Program Supplemental Materials Author Year Country
Non-biased selection?
Adequate handling of missing data?
Outcomes pre-specified and defined?
Ascertainment techniques adequately described? Data source.
Non-biased and adequate ascertainment methods? Validation of VA race/ethnicity data?
Level of adjustment for potential confounders
Adequate duration of follow-up?
Overall quality rating
Fudalej 201012
Yes. All individuals in the VA National Patient Care Database who were diagnosed with AUD during FY2001
Unknown. Yes. Yes. VA National Patient Care Database (NPCD), CDC’s National Death Index
Yes. No.
Medium: Age, sex, medical comorbidities, schizophrenia, PTSD, other anxiety disorders, bipolar disorder, personality disorder, major depression, drug use disorders.
N/A Fair.
Ganti 201413 US
Yes. “Patients with NSCLC (all histologies) included in the VACCR database between January 1995 and February 2009 were identified.”
No. 11% were excluded for missing or miscoded data.
Yes. Yes. VA Central Cancer Registry (VACCR), electronic medical records.
Yes. No.
Medium: Age, histology type, clinical stage, family history of cancer, type of treatment.
Yes. Fair.
Graham-steed 201314
Yes. Men diagnosed with prostate cancer between 1991-1995 at 9 VAMCs
Unknown. Yes. Yes. VAMC medical record review.
Yes. No.
Medium: Age, comorbidity, D’Amico score.
Yes. Fair.
31

Evidence Brief: Racial and Ethnic Disparities within the VA Evidence-based Synthesis Program Supplemental Materials Author Year Country
Non-biased selection?
Adequate handling of missing data?
Outcomes pre-specified and defined?
Ascertainment techniques adequately described? Data source.
Non-biased and adequate ascertainment methods? Validation of VA race/ethnicity data?
Level of adjustment for potential confounders
Adequate duration of follow-up?
Overall quality rating
Hou 201215
Yes Patients identified with ulcerative colitis during fiscal years 1998 to 2009 in the national VA administrative datasets.
Unknown. Yes. Yes. VA Patient Treatment Files and Outpatient Care Files.
Yes. No.
High: Sex, history of endoscopy in VA, VA encounters, UC index year, age at UC index, Deyo score, priority level.
Yes. Fair.
Jia 201048
Yes. Patients that received inpatient care for acute stroke within the VA system during fiscal year 2001.
Unknown. Yes. Yes. VA national medical SAS database, VA functional status outcomes database, VA beneficiary identification and records locator subsystem, VA pharmacy benefit management, Medicare claims data.
Yes. Yes. Confirmed VA data with Medicare claims data.
High: Age, marital status, region, VA care priority, 12-month mortality, 12-month hospital stays, 12-month outpatient visits, comorbidity summary score, ischemic stroke, hospital referral.
Yes. Fair.
32

Evidence Brief: Racial and Ethnic Disparities within the VA Evidence-based Synthesis Program Supplemental Materials Author Year Country
Non-biased selection?
Adequate handling of missing data?
Outcomes pre-specified and defined?
Ascertainment techniques adequately described? Data source.
Non-biased and adequate ascertainment methods? Validation of VA race/ethnicity data?
Level of adjustment for potential confounders
Adequate duration of follow-up?
Overall quality rating
Jones 201417
Yes. All male participants from the public-use version of the BEST data.
Yes. Yes. Yes. The public-use version of the BEST data.
Yes. N/A
High: Age, NYHA class IV, CAD, DM, hypertension, Afib, peripheral artery disease, CKD, bucindoldol group, PE, LV ejection fraction <20%, RV ejection faction <20%.
Yes. Good.
Kamalesh 200718
Yes. All veterans discharged between October 1990 and September 1997 with a primary diagnosis of stroke.
Yes. Yes. Yes. VA Patient Treatment File, Beneficiary Information and Resource Locator file.
Yes. No.
High: Age, sex, hypertension, DM, CAD, HF, hyperlipidemia, Afib, # discharge diagnoses, charlson index, utilization, F-U within 60 days.
Yes. Good.
Kokkinos 200919
Yes. Veterans with type 2 diabetes who underwent an ETT at one of two VAMCs
Unknown. Yes. Yes. Medical records, VA Beneficiary Identification and Record Locator System File.
Yes. No.
High: Age, CVD, BP, cardiovascular meds, insulin and oral glycemic agents, and peak exercise capacity.
Yes. Fair.
33

Evidence Brief: Racial and Ethnic Disparities within the VA Evidence-based Synthesis Program Supplemental Materials Author Year Country
Non-biased selection?
Adequate handling of missing data?
Outcomes pre-specified and defined?
Ascertainment techniques adequately described? Data source.
Non-biased and adequate ascertainment methods? Validation of VA race/ethnicity data?
Level of adjustment for potential confounders
Adequate duration of follow-up?
Overall quality rating
Kovesdy 201320
Yes. Identified patients with chronic kidney disease… using laboratory data for serum creatinine from the VA Decision Support System National Data Extracts Laboratory Results File
Yes. Excluded 13% “other” or missing race info, women, and CKD stages 1 and 2.
Yes. Yes. VA Decision Support System National Data Extracts Laboratory Results File, VA inpatient and outpatient datasets, Medicare
Yes. Yes. Merged VA and Medicare data, used Medicare entry in cases of discrepancies
High: Age, sex, marital and insurance status, region, DM, CVD, vascular disease, cerebrovascular disease, CHF, comorbidity score, glomerular filtration rate, serum albumin, cholesterol, hemoglobin, WBC, serum alkaline phosphatase values.
Yes. Good.
Kressin 200721
Yes. Data from the Cardiac Decision Making Study, white and black male Veterans who had cardiac nuclear imaging study performed between August 1999 and January 2001.
Yes. Response rate of 74% at 12 months.
Yes. Yes. Cardiac Decision Making Study.
Yes. No.
Medium: Baseline functional status scores, receipt of revascularization, receipt of CABG, receipt of catheterization, site.
Yes. Fair.
34

Evidence Brief: Racial and Ethnic Disparities within the VA Evidence-based Synthesis Program Supplemental Materials Author Year Country
Non-biased selection?
Adequate handling of missing data?
Outcomes pre-specified and defined?
Ascertainment techniques adequately described? Data source.
Non-biased and adequate ascertainment methods? Validation of VA race/ethnicity data?
Level of adjustment for potential confounders
Adequate duration of follow-up?
Overall quality rating
Lynch 201422
Yes: Veterans with Type 2 Diabetes
Yes. 0.5% excluded due to death prior to 2002, missing age or no service connection
Yes. Yes. Yes. No.
None. Yes. Poor.
Meyers 200823
Yes: retired military members admitted to 1 of 54 hospitals in the Direct Care System (DCS) of the Military Health System (MHS) between 2000-2004.
Yes: 2.9% excluded due to missing data
Yes. Yes: DCS facilities data (MHS Management and Reporting Tool)
Yes: Race was recorded at admission to the hospital as Caucasian, African American, Asian, Native American, or other non-Caucasian (including Hispanic) No
High: Patient-level: Age, fiscal year, military rank, marital status, comorbidities, length of stay, primary admission diagnosis Hospital-level: # of patients treated annually, availability of coronary artery bypass surgery, proportion of non-Caucasian patients with diagnoses of interest, and region
Yes. Good.
35

Evidence Brief: Racial and Ethnic Disparities within the VA Evidence-based Synthesis Program Supplemental Materials Author Year Country
Non-biased selection?
Adequate handling of missing data?
Outcomes pre-specified and defined?
Ascertainment techniques adequately described? Data source.
Non-biased and adequate ascertainment methods? Validation of VA race/ethnicity data?
Level of adjustment for potential confounders
Adequate duration of follow-up?
Overall quality rating
Optenberg 199524 US
Yes. All patients with prostate cancer from the ACTUR treated at DOD facilities.
Unknown. Yes. Yes. Defense Enrollment Eligibility Reporting System (DEERS) Automated Central Tumor Registry (ACTUR): provides data on patients will all neoplasms diagnosed or treated at DOD medical treatment facilities.
Yes. No.
Low: Age, date of entry, stratified by stage.
Yes. Fair.
Polsky 200826
Yes: Patients ≥65 admitted with a principal diagnosis of interest between 1998-2002
Unknown.
Yes. Yes: Medicare Provider Analysis and Review (MedPAR) File, the VA Patient Treatment File (PTF), and 2000 U.S. Census data for zipcode-level SES characteristics of patients
Yes: obtained from data sources Yes.
High: Health risk (age, sex, year of discharge, comorbid conditions), SES (median household income, percentage of population with college degrees, and urbanicity of patient’s zip code of residence), and hospital fixed effects.
Yes. Fair.
36
Evidence Brief: Racial and Ethnic Disparities within the VA Evidence-based Synthesis Program Supplemental Materials Author Year Country
Non-biased selection?
Adequate handling of missing data?
Outcomes pre-specified and defined?
Ascertainment techniques adequately described? Data source.
Non-biased and adequate ascertainment methods? Validation of VA race/ethnicity data?
Level of adjustment for potential confounders
Adequate duration of follow-up?
Overall quality rating
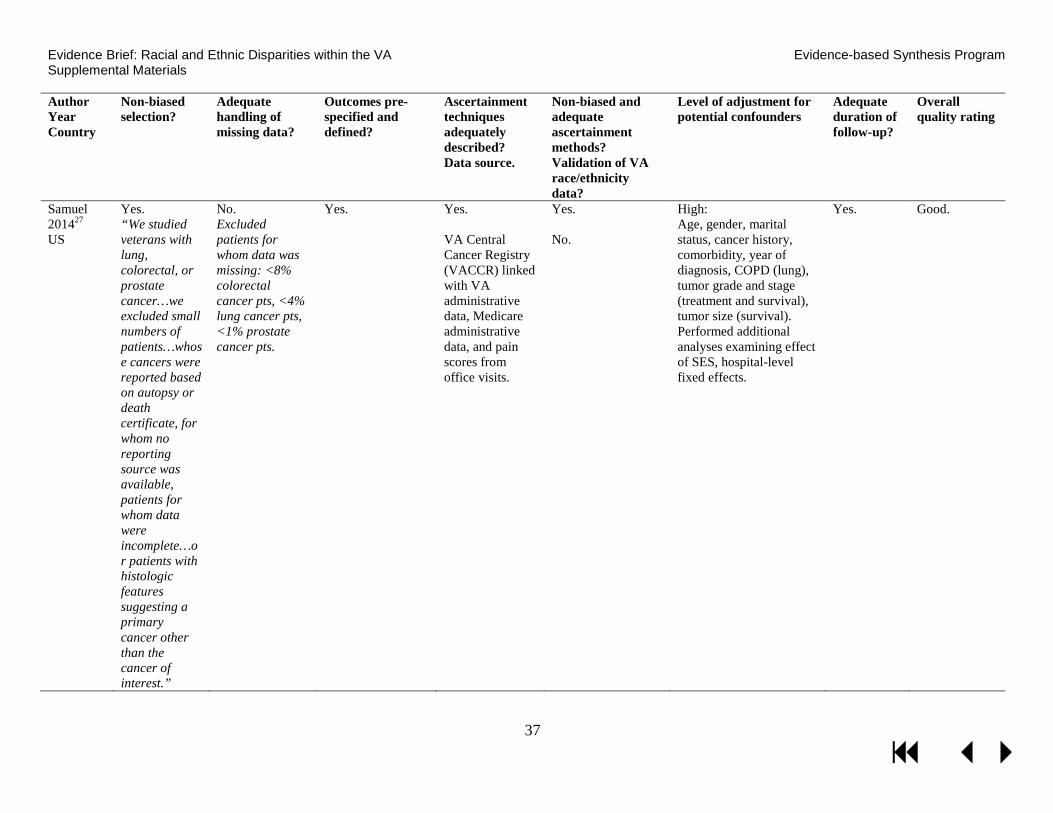
Samuel 201427 US
Yes. “We studied veterans with lung, colorectal, or prostate cancer…we excluded small numbers of patients…whose cancers were reported based on autopsy or death certificate, for whom no reporting source was available, patients for whom data were incomplete…or patients with histologic features suggesting a primary cancer other than the cancer of interest.”
No. Excluded patients for whom data was missing: <8% colorectal cancer pts, <4% lung cancer pts, <1% prostate cancer pts.
Yes. Yes. VA Central Cancer Registry (VACCR) linked with VA administrative data, Medicare administrative data, and pain scores from office visits.
Yes. No.
High: Age, gender, marital status, cancer history, comorbidity, year of diagnosis, COPD (lung), tumor grade and stage (treatment and survival), tumor size (survival). Performed additional analyses examining effect of SES, hospital-level fixed effects.
Yes. Good.
37

Evidence Brief: Racial and Ethnic Disparities within the VA Evidence-based Synthesis Program Supplemental Materials Author Year Country
Non-biased selection?
Adequate handling of missing data?
Outcomes pre-specified and defined?
Ascertainment techniques adequately described? Data source.
Non-biased and adequate ascertainment methods? Validation of VA race/ethnicity data?
Level of adjustment for potential confounders
Adequate duration of follow-up?
Overall quality rating
Sarrazin 200928
Yes. Admissions to VA hospitals between October 2002 and September 2006 for COPD exacerbation.
Yes. 7% excluded for missing data.
Yes. Yes. VA Patient Treatment File (PTF) and Outpatient Care File (OCF)
Yes. No.
High: Admission source, principle diagnosis, year of admission, prior hospital and COPD-related admissions, comorbidities), ICU admission and mechanical ventilation or noninvasive ventilation use, within-hospital clustering of patients.
Yes. Good.
Shaw 201429
Yes. All VA-reimbursed deliveries in fiscal years 200-2012
Yes. 11% without race data were included with race categorized as missing; sensitivity analyses ruled out confounding
Yes. Yes. National VHA clinical and administrative databases.
Yes. No.
Medium: Maternal age, PTSD, twins or higher-order gestation, deployed.
Yes. Fair.
38

Evidence Brief: Racial and Ethnic Disparities within the VA Evidence-based Synthesis Program Supplemental Materials Author Year Country
Non-biased selection?
Adequate handling of missing data?
Outcomes pre-specified and defined?
Ascertainment techniques adequately described? Data source.
Non-biased and adequate ascertainment methods? Validation of VA race/ethnicity data?
Level of adjustment for potential confounders
Adequate duration of follow-up?
Overall quality rating
Shimada 200830
Yes: Veterans receiving inpatient acute care at one of 128 VHA acute care hospitals between FY2001 and FY2005
Yes: 3.6% excluded due to missing race
Yes. Yes: VA patient treatment files (PTF) and Outpatient Care Files
Yes: Race information was prioritized by: (1) self-reported race from inpatient record, (2) observed race from inpatient record, (3) self-reported race from outpatient visits(4) observed race from outpatient visits No.
High: Age, sex, and 27 comorbidities, site.
Yes. Good.
Tseng 201131
Yes. Patients with diabetes using the VA Diabetes Epidemiology Cohorts data
Yes. Yes. Yes. VA Diabetes Epidemiology Cohorts data
Yes. No.
High: Age, sex, marital status, census region, rural/urban, disability, microvascular, macrovascular, and metabolic complications, diabetes medications.
Yes. Good.
Volpp 200732
Yes: Veterans with principle diagnosis of interest between FY1996-FY2002
Yes: 3.5% excluded due to missing race
Yes. Yes: VA Patient Treatment File (PTF), VA Beneficiary Identification Record Locator System, and the National Death Index
Yes: Race data obtained via PTF No.
High: Age, discharge year, comorbidities, SES, hospital site, national death index deaths added, hospital site.
Yes. Good.
39

Evidence Brief: Racial and Ethnic Disparities within the VA Evidence-based Synthesis Program Supplemental Materials Author Year Country
Non-biased selection?
Adequate handling of missing data?
Outcomes pre-specified and defined?
Ascertainment techniques adequately described? Data source.
Non-biased and adequate ascertainment methods? Validation of VA race/ethnicity data?
Level of adjustment for potential confounders
Adequate duration of follow-up?
Overall quality rating
Zullig 201333 US
Yes. “Patients identified through the VA Central Cancer Registry…if they had been diagnosed with lung cancer between October 1, 2006 and December 31, 2007.”
Unclear; excluded 3577 (46%) “missing stage, stage 1 or stage 2”; did not differentiate how many missing stage information
Yes. Yes. VA Central Cancer Registry (VACCR), electronic medical records.
Yes. No.
Medium: Age at diagnosis, marital status, geographic region, stage at diagnosis, poor performance status.
Yes. Fair.
40

Evidence Brief: Racial and Ethnic Disparities within the VA Evidence-based Synthesis Program Supplemental Materials QUALITY ASSESSMENT: INCLUDED INTERVENTION STUDIES ADDRESSING KQ2
Author Year
Adequate sequence generation?
Adequate allocation concealment?
Blinding of participants, personnel and outcome assessors?
Incomplete outcome data adequately addressed?
Study reports free of suggestion of outcome reporting bias?
Study free of other sources of bias? Risk of bias?
Long 201246
Yes. Yes. The Research Assistant was un-blinded. Participants were necessarily un-blinded.
Yes. “We used multiple imputation to generate values for each subject with missing follow-up data”
Yes. Yes. Low.
Ibrahim 201347
Yes. Yes. Participants and personnel unblended after randomization.
Yes. 2 participants lost to follow-up (1 in MI group, 1 in DA+MI group)
Yes. Yes. Low.
STRENGTH OF EVIDENCE: MORBIDITY/MORTALITY STUDIES ADDRESSING KQ1 SOE Grade Study Design: No.
Studies (N) Study Limitations
Direct-ness
Consistency Precision Reporting Bias
Other Issues
Finding
Black
DM: All-cause mortality: Low
Historical cohort: 1 (3,148) (Kokkinos, 2009)19
Medium Direct Unknown Precise Undetected None The risk of all-cause mortality is higher in black compared to white Veterans aHR: 1.23 (1.02-1.47)
HIV: ESRD: Moderate
Historical cohort: 1 (2,015,891) (Choi, 2007)6
Low Direct Unknown Precise Undetected None Among HIV-infected individuals with diabetes, the risk for ESRD was greater among black compared to white veterans aHR: 2.33 (1.02-5.35)
Type 1 and 2 DM: Decline in ILEA: Low
Serial cross-sectional study: 1 (405,580 to 739,377) (Tseng, 2011)31
Low Direct Unknown Imprecise Undetected None Rate of decline in initial lower extremity amputation (ILEA) is not different between black and white Veterans (p=.37) and Hispanic and white Veterans (p=.91).
41

Evidence Brief: Racial and Ethnic Disparities within the VA Evidence-based Synthesis Program Supplemental Materials SOE Grade Study Design: No.
Studies (N) Study Limitations
Direct-ness
Consistency Precision Reporting Bias
Other Issues
Finding
Inpatient/ acute care: Mortality within 30 days of hospitalization for hip fracture, AMI, stroke, CHF, GI bleed, or pneumonia: Moderate
Historical cohort: 1 (283,912) (Volpp, 2007)32
Low Direct Unknown Precise Undetected None No disparity. Pneumonia: Under 65: 1.09 (0.98-1.21); 65 and older: 0.90 (0.85-0.95) CHF: Under 65: 0.71 (0.62-0.82); 65 and older: 0.70 (0.65-0.76) GI bleed: Under 65: 0.93 (0.78-1.10); 65 and older: 0.88 (0.79-0.99) Hip fracture: Under 65: 0.66 (0.28-1.55); 65 and older: 0.73 (0.58-0.90) Stroke: Under 65: 1.12 (0.95-1.32); 65 and older: 0.81 (0.74-0.89) AMI: Under 65: 1.19 (0.99-1.43); 65 and older: 0.75 (0.67-0.84)
Inpatient/ acute care: Death in low-mortality diagnosis-related groups: Moderate
Historical cohort: 1 (294,381) (Shimada, 2008)30
Low Direct Unknown Precise Undetected None No disparity. No association between black race and death in low-mortality diagnosis-related groups aOR=1.18 (p>.05)
Stroke: Mortality between 30 days and 2 years after hospitalization: Low
Historical cohort: 1 (155,529) (Polsky, 2008)26
Medium Direct Unknown Precise Undetected None Disparity present. Difference in mortality rate between black and white Veterans 2 years after hospitalization for stroke: 2.5 (p<.05)
Inpatient/ acute care: Hospital mortality: Low
Historical cohort: 1 (14,122) (Meyers, 2008)23
Low Direct Unknown Imprecise Undetected None No disparity. No association between black race and hospital death aOR=0.95 (0.92-1.26)
42

Evidence Brief: Racial and Ethnic Disparities within the VA Evidence-based Synthesis Program Supplemental Materials SOE Grade Study Design: No.
Studies (N) Study Limitations
Direct-ness
Consistency Precision Reporting Bias
Other Issues
Finding
Inpatient/ acute care: Mortality within 30 days of admission to medical ward for pneumonia: Moderate
Historical cohort: 1 (35,706) (Frei, 2010)11
Low Direct Unknown Precise Undetected None No disparity. No association between black race and mortality within 30 days of admission to medical ward for pneumonia aOR=0.98 (0.87-1.10)
Inpatient/ acute care: Mortality within 30 days of admission to ICU for pneumonia: Moderate
Historical cohort: 1 (5,172) (Frei, 2010)11
Low Direct Unknown Precise Undetected None No disparity. Black race is associated with lower mortality within 30 days of admission to ICU for pneumonia. aOR=0.82 (0.68-0.99)
Inpatient/ acute care: In-hospital or 30-day mortality after admission for COPD exacerbation: Moderate
Historical cohort: 1 (50,979) (Sarrazin, 2009)28
Low Direct Unknown Precise Undetected None No disparity. Black race is associated with lower in-hospital or 30-day mortality after admission for COPD exacerbation; 7.1% vs 9.2% (p<.001); aOR=0.69 (0.62-0.77)
CKD: End-stage renal disease: Moderate
VA NPCD historical cohort: 1 (2,015,891) (Choi, 2009)5
Low Direct Unknown Precise Undetected None Worse incidence of end-stage renal disease among black Veterans: aHR (95% CI): a=2.14 (1.72-2.65), 2=2.30 (2.02-2.61), 3A=3.08 (2.74-3.46), 3B=2.47 (2.26-2.70), 4=1.86 (1.75-1.98) and 5=1.23 (1.12-1.34).
CKD: Morality among Veterans with Stage 3A or 3B: Insufficient
Historical cohort: 1 (992,290) (Choi, 2009, Kovesdy, 2013)5,20
Low Direct Inconsistent Imprecise Undetected None Unknown disparity. Among Veterans with CKD Stage 3A or 3B, black race is associated with increased mortality risk in one study (aHR: 1.32 (1.27-1.36) and 1.21 (p<.05), respectively) and decreased 5-year mortality (aHR: 0.88 (0.81-0.97) and 0.81 (0.71-0.92), respectively) in another study.
43

Evidence Brief: Racial and Ethnic Disparities within the VA Evidence-based Synthesis Program Supplemental Materials SOE Grade Study Design: No.
Studies (N) Study Limitations
Direct-ness
Consistency Precision Reporting Bias
Other Issues
Finding
CKD: Mortality among Veterans with Stage 4 or 5: High
Historical cohorts: 2 (992,290) (Choi, 2009, Kovesdy, 2013)5,20
Low Direct Consistent Precise Undetected None No disparity. Among Veterans with CKD Stage 4 or 5, black race is not associated with mortality risk aHR range: 1.01 (0.81-1.27) to 1.07 (p>.05) and 0.83 (0.48-1.44) to 0.97 (p>.05), respectively.
Infectious disease: HCV: Moderate Infectious disease: HCC: Moderate
Historical cohort: 1 (149,407) (El-Serag, 2014)9
Low Direct Unknown Precise Undetected None Incident cirrhosis black vs white: aHR=0.58 (0.55-0.60) Hispanic vs white: aHR=1.28 (1.21-1.37) Incident HCC black vs white: aHR=0.77 (0.71-0.83) Hispanic vs white: aHR=1.61 (1.44-1.80)
HIV-infected individuals: ESRD: Moderate HIV-infected individuals with DM: ESRD: Moderate
Historical cohort: 1 (2,015,891) (Choi, 2007)6
Low Direct Unknown Precise Undetected None ESRD among HIV-infected individuals black vs white: aHR: 5.97 (3.12-11) ESRD among HIV-infected individuals with diabetes black vs white: aHR: 2.33 (1.02-5.35)
Colon cancer: 3-year survival: Moderate
1 National registry study (N=4,642) (Samuel, 2014)27
Low Direct Unknown Precise Undetected None 3-year survival: 53% (black) vs 61% (white), aOR (black vs white): 0.78 (95% CI: 0.64-0.96)
NSCLC any stage: 5-year survival: Low
1 National registry study (N=81,823) (Ganti, 2014)13
Medium Direct Unknown Precise Undetected None 5-year mortality aHR (black vs white): 0.94 (95% CI: 0.92-0.96)
Any stage NSCLC or SCLC 1-year survival: Moderate
1 National registry study (N=4642) (Samuel, 2014)27
Low Direct Unknown Precise Undetected None 1-year survival NSCLC: 39.5% (black) vs 40.6% (white), aOR: 1.05 (95% CI: 0.96-1.15) SCLC: 26.2% (black) vs 26.6% (white), aOR: 1.07 (95% CI: 0.82-1.39)
NSCLC late stage: Days from diagnosis to death at 2 years: Low
1 National registry study (N=2,200) (Zullig, 2013)33
Medium Direct Unknown Imprecise Undetected None Survival in days: 133 vs 117; aHR, 1.31 (95% BI, 1.14-1.50)
44

Evidence Brief: Racial and Ethnic Disparities within the VA Evidence-based Synthesis Program Supplemental Materials SOE Grade Study Design: No.
Studies (N) Study Limitations
Direct-ness
Consistency Precision Reporting Bias
Other Issues
Finding
Prostate cancer: All-cause mortality at 5 to 5.7 years: Moderate
2 studies: 1 DoD registry (N=1991) (Optenberg, 1995, Freeman, 2003)24,1 of 9 VA centers 10, N=1991
Medium Direct Consistent Imprecise Undetected None No disparity HR=1.50 (0.94-2.38)
Prostate cancer: Prostate-cancer mortality at 5.7 to 16 years: Moderate
3 multicenter studies: (N=2892) (Daskivich, 2015, Freeman, 2003, Graham-Steed, 2013)7,10,14
Medium Direct Consistent Precise Undetected None No disparity HR at 5.7 years=1.36 (0.62-2.96) to 0.90 (0.58-1.40) at 11-16 years
Rectal cancer: All-cause survival at 3 years: Low
1 study of VACCR; (N=1,301) (Samuel, 2014)27
Low Direct Unknown Imprecise Undetected None No disparity; 48% vs 57.8%; aOR 0.66 (0.43-1.00)
Stroke: 1-year all-cause mortality: Moderate
1 VA PTF study; N=55,094 (Kamalesh, 2007)18
Low Direct Unknown Precise Undetected None No disparity; 1-year mortality higher for whites: 13.1% vs 12.2%; absolute difference = 0.9%; HR 1.06 (1.02-1.10)
Stroke: Any readmission: Insufficient
1 VA PTF study; (N=55,094) (Kamalesh, 2007)18
High Direct Unknown Precise Undetected None Disparity unknown: Unadjusted readmission: W=2.19% vs AA=2.02%, P<0.001
Stroke: Post-stroke depression at 1 year: Low
1 fair study of several national VA sources; (N=5,100) (Jia, 2010)48
Medium Direct Unknown Precise Undetected None 30.7% vs 42.5%; OR 0.57 (0.49, 0.66)
Advanced chronic systolic heart failure: 2-year all-cause mortality: Low
1 study of VA hospitals participating in BEST trial, (N=918) (Jones, 2014)17
Low Direct Unknown Imprecise Undetected None 2-year all-cause mortality: HR 1.14 (0.86-1.50)
VTE: 90-day mortality: Insufficient
VA NPCD for 2 Philadelphia centers; (N=168) (Aujesky, 2007)3
High Direct Unknown Imprecise Undetected None B=10% vs W=11%, P=0.80
45
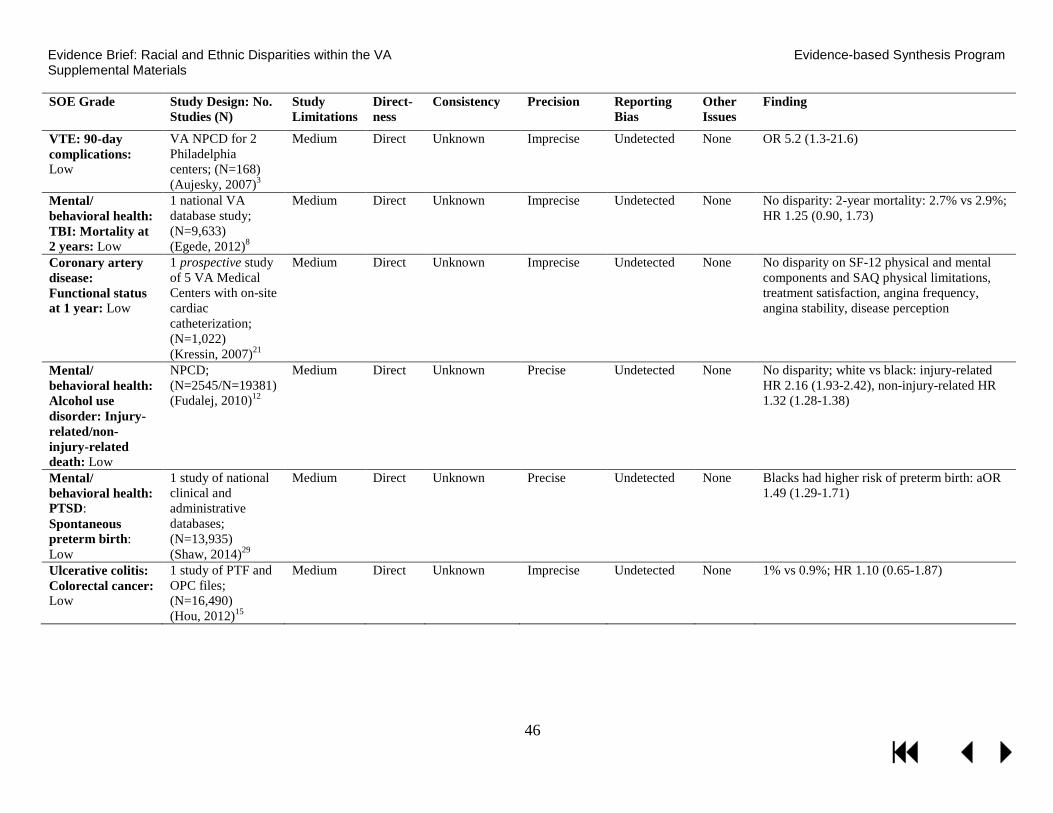
Evidence Brief: Racial and Ethnic Disparities within the VA Evidence-based Synthesis Program Supplemental Materials SOE Grade Study Design: No.
Studies (N) Study Limitations
Direct-ness
Consistency Precision Reporting Bias
Other Issues
Finding
VTE: 90-day complications: Low
VA NPCD for 2 Philadelphia centers; (N=168) (Aujesky, 2007)3
Medium Direct Unknown Imprecise Undetected None OR 5.2 (1.3-21.6)
Mental/ behavioral health: TBI: Mortality at 2 years: Low
1 national VA database study; (N=9,633) (Egede, 2012)8
Medium Direct Unknown Imprecise Undetected None No disparity: 2-year mortality: 2.7% vs 2.9%; HR 1.25 (0.90, 1.73)
Coronary artery disease: Functional status at 1 year: Low
1 prospective study of 5 VA Medical Centers with on-site cardiac catheterization; (N=1,022) (Kressin, 2007)21
Medium Direct Unknown Imprecise Undetected None No disparity on SF-12 physical and mental components and SAQ physical limitations, treatment satisfaction, angina frequency, angina stability, disease perception
Mental/ behavioral health: Alcohol use disorder: Injury-related/non-injury-related death: Low
NPCD; (N=2545/N=19381) (Fudalej, 2010)12
Medium Direct Unknown Precise Undetected None No disparity; white vs black: injury-related HR 2.16 (1.93-2.42), non-injury-related HR 1.32 (1.28-1.38)
Mental/ behavioral health: PTSD: Spontaneous preterm birth: Low
1 study of national clinical and administrative databases; (N=13,935) (Shaw, 2014)29
Medium Direct Unknown Precise Undetected None Blacks had higher risk of preterm birth: aOR 1.49 (1.29-1.71)
Ulcerative colitis: Colorectal cancer: Low
1 study of PTF and OPC files; (N=16,490) (Hou, 2012)15
Medium Direct Unknown Imprecise Undetected None 1% vs 0.9%; HR 1.10 (0.65-1.87)
46

Evidence Brief: Racial and Ethnic Disparities within the VA Evidence-based Synthesis Program Supplemental Materials Hispanic/Latino
Inpatient/ acute care: Death in low-mortality diagnosis-related groups: Low
Historical cohort: 1 (244,397) (Shimada, 2008)30
Low Direct Unknown Imprecise Undetected None No disparity. No association between Hispanic/Latino ethnicity and death in low-mortality diagnosis-related groups aOR=1.32 (p>.05)
Prostate cancer: Survival at 6.6 years: Low
1 study of 2 Southern California VA hospitals (N=720) (Daskivich, 2015)7
Medium Direct Unknown Imprecise Undetected None No disparity: HR 0.24 (0.03 to 1.82)
Mental/ behavioral health: TBI: Mortality at 2 years: Low
1 national study (N=8,199) (Egede, 2012)8
Medium Direct Unknown Imprecise Undetected None No disparity: 6.7% vs 2.9%; HR 1.61 (1.00, 2.58)
Stroke: Post-stroke depression at 1 year: Low
1 fair study of several national VA sources; (N=4,226) (Jia, 2010)48
Medium Direct Unknown Precise Undetected None No disparity: 41.7% vs 42.5%; OR 0.78 (0.56, 1.08)
Ulcerative colitis: Colorectal cancer: Low
1 study of PTF and OPC files; (N=15,573) (Hou, 2012)15
Medium Direct Unknown Imprecise Undetected None 1.1% vs 0.9%; HR 1.17 (0.55-2.51)
Asian
Lung cancer: Mortality at 4 years: Low
1 study of VA CCR; (N=67,332) (Ganti, 2014)13
Medium Direct Unknown Precise Undetected None No disparity: aHR 0.96 (0.84 to 1.09)
Mental/ behavioral health: PTSD: Spontaneous preterm birth: Low
1 study of national clinical and administrative databases; (N=10,518) (Shaw, 2014)29
Medium Direct Unknown Imprecise Undetected None No disparity: Asian vs white: aOR 1.27 (0.82-1.96)
47
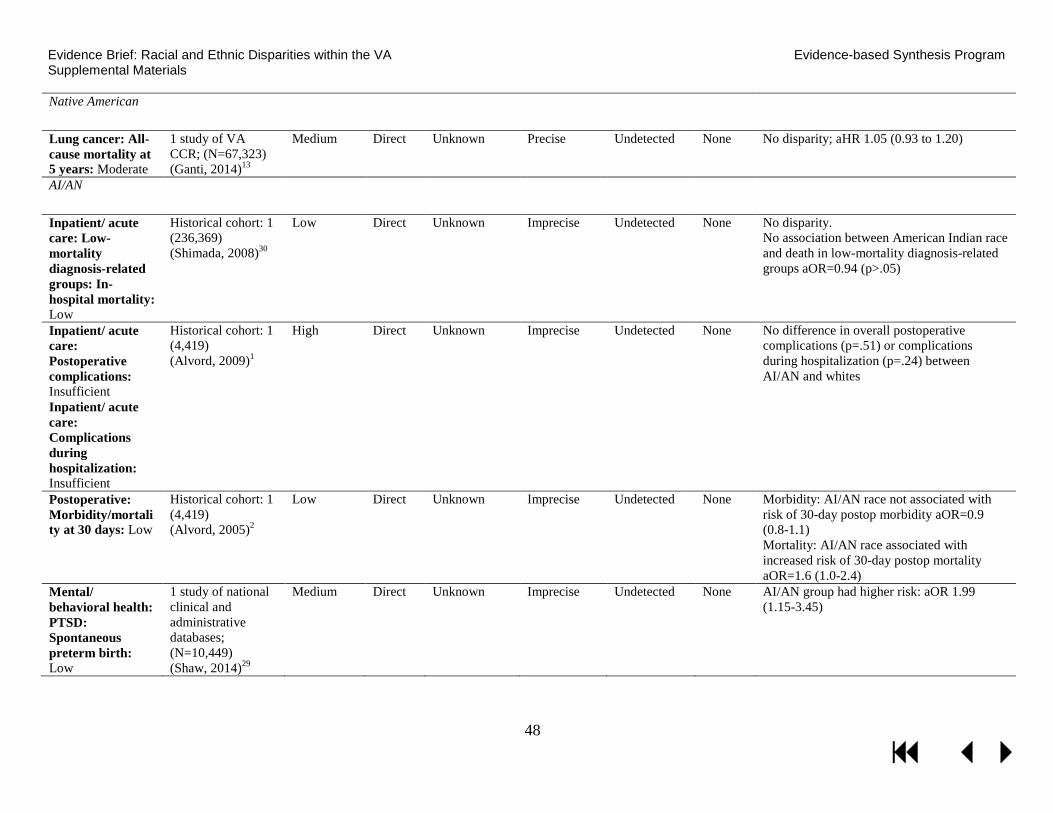
Evidence Brief: Racial and Ethnic Disparities within the VA Evidence-based Synthesis Program Supplemental Materials Native American
Lung cancer: All-cause mortality at 5 years: Moderate
1 study of VA CCR; (N=67,323) (Ganti, 2014)13
Medium Direct Unknown Precise Undetected None No disparity; aHR 1.05 (0.93 to 1.20)
AI/AN
Inpatient/ acute care: Low-mortality diagnosis-related groups: In-hospital mortality: Low
Historical cohort: 1 (236,369) (Shimada, 2008)30
Low Direct Unknown Imprecise Undetected None No disparity. No association between American Indian race and death in low-mortality diagnosis-related groups aOR=0.94 (p>.05)
Inpatient/ acute care: Postoperative complications: Insufficient Inpatient/ acute care: Complications during hospitalization: Insufficient
Historical cohort: 1 (4,419) (Alvord, 2009)1
High Direct Unknown Imprecise Undetected None No difference in overall postoperative complications (p=.51) or complications during hospitalization (p=.24) between AI/AN and whites
Postoperative: Morbidity/mortality at 30 days: Low
Historical cohort: 1 (4,419) (Alvord, 2005)2
Low Direct Unknown Imprecise Undetected None Morbidity: AI/AN race not associated with risk of 30-day postop morbidity aOR=0.9 (0.8-1.1) Mortality: AI/AN race associated with increased risk of 30-day postop mortality aOR=1.6 (1.0-2.4)
Mental/ behavioral health: PTSD: Spontaneous preterm birth: Low
1 study of national clinical and administrative databases; (N=10,449) (Shaw, 2014)29
Medium Direct Unknown Imprecise Undetected None AI/AN group had higher risk: aOR 1.99 (1.15-3.45)
48

Evidence Brief: Racial and Ethnic Disparities within the VA Evidence-based Synthesis Program Supplemental Materials Hawaiian/Asian Pacific Islander
Inpatient/ acute care: Death in low-mortality diagnosis-related groups: Low
Historical cohort: 1 (236,845) (Shimada, 2008)30
Low Direct Unknown Imprecise Undetected None No disparity. No association between Asian/Pacific Islander ethnicity and death in low-mortality diagnosis-related groups aOR=0.44 (p>.05)
Mental/ behavioral health: PTSD: Spontaneous preterm birth: Low
1 study of national clinical and administrative databases; (N=10,392) (Shaw, 2014)29
Medium Direct Unknown Imprecise Undetected None No disparity: aOR 1.35 (0.85-2.13)
Combined Racial/Ethnic Minority Groups (excluding AA)
Mental/ behavioral health: Alcohol use disorder: Injury-related/non-injury-related death: Low
NPCD; (N=2,545/ N=19,381) (Fudalej, 2010)12
Medium Direct Unknown Precise Undetected None Disparity; Other vs black: injury-related HR 1.59 (1.40-1.80), non-injury-related HR 0.97 (0.92-1.01)
Stroke: Post-stroke depression: Low
1 fair study of several national VA sources: (N=4,141) (Jia, 2010)48
Medium Direct Unknown Precise Undetected None 31.3% vs 42.5%; OR 0.64 (0.50, 0.83)
Ulcerative colitis: Colorectal cancer: Low
1 study of PTF and OPC files; (N=15,274) (Hou, 2012)15
Medium Direct Unknown Imprecise Undetected None 0.9% vs 0.9%; HR 1.04 (0.33-3.27)
49

Evidence Brief: Racial and Ethnic Disparities within the VA Evidence-based Synthesis Program Supplemental Materials STRENGTH OF EVIDENCE: INTERVENTION STUDIES ADDRESSING KQ2
Strength of Evidence Grade
Study Design: No. Studies (N)
Study Limitations
Direct-ness
Consist-ency Precision
Reporting Bias
Other Issues Finding
6-month effectiveness of peer mentoring: Low
RCT: 1 (117) (Long, 2012)46
Low Direct Unknown Imprecise Undetected None Peer mentoring is associated with a decrease in HbA1c compared with control (-1.07% [-1.84% to -0.31%], p=.006)
6-month effectiveness of financial incentives: Low
RCT: 1 (117) (Long, 2012)46
Low Direct Unknown Imprecise Undetected None Financial incentives are not associated with a decrease in HbA1c compared with control (-0.45% [-1.23% to 0.32%] p=.25)
12-month attendance at orthopedic surgery appointment after decision aid, motivational interviewing, or both: Low
RCT: 1 (639) (Ibrahim, 2013)47
Low Direct Unknown Imprecise Undetected None Appointment attendance after decision aid (vs education booklet) aOR: 1.27 (95% CI: 0.54-3.00) Appointment attendance after motivational interviewing (vs education booklet) aOR: 1.79 (95% CI: 0.78-4.07) Appointment attendance after decision aid + motivational interviewing (vs education booklet) aOR: 2.05 (95% CI: 0.90-4.65)
50

Evidence Brief: Racial and Ethnic Disparities within the VA Evidence-based Synthesis Program Supplemental Materials
PEER REVIEW DISPOSITION TABLE Comment
# Reviewer
# Comment Author response 1. Are the objectives, scope, and methods for this review clearly described?
1 2 Yes No response 2 3 No - The methods are not described in sufficient detail to understand what
was done. Though a weblink is provided, a brief description of the methods should be included so that this evidence brief can stand on its own. At a minimum, the search criteria and the methods for rating study quality need to be described.
Added a description of methods for searching, internal validity assessment, and strength of evidence rating.
3 3 In the literature flow section, there are numerous discrepancies in the article count within and between the text and the figure (e.g., 105 vs 108 articles included, 174 vs 176 full text articles assessed, the number of articles addressing key question 1, to name a few). It is also not clear which articles are included in the review, e.g., (page 7, lines 22-29), were there 43 articles included for key question 1, or only the 32 fair or better quality articles.
We corrected the literature flow figure and text overview.
4 4 Yes No response 5 5 No - See reviewer comments below See responses below 6 6 Yes No response 7 8 Yes No response
2. Is there any indication of bias in our synthesis of the evidence? 8 2 No No response 9 3 No No response 10 4 No No response 11 5 No No response 12 6 No No response 13 8 No No response
3. Are there any published or unpublished studies that we may have overlooked? 14 2 No 15 3 Yes - The search strategies for published studies and the methods for
identifying unpublished studies are not described, so the completeness of the methods cannot be assessed. Across the classifications, there are three broad areas that appear to have been omitted from the evidence that is reported on, and therefore these categories should be removed from the classifications. These categories are: studies providing a rationale for verify disparity in more recent cohort (A1); studies on the magnitude and strength of evidence
Added brief description of search strategy and methods for assessing internal validity of individual studies and for rating the strength of the body of evidence. The three areas you are referring to are indeed outside of the scope of this review, and are being suggested as the next logical steps for future research. We added a figure to better illustrate the framework that guided our research
51

Evidence Brief: Racial and Ethnic Disparities within the VA Evidence-based Synthesis Program Supplemental Materials Comment
# Reviewer
# Comment Author response of the disparity outside the VA (C1); and studies supporting whether there is reason to believe that decreasing the causes would reduce the disparity (C3). Omission of studies on the disparity outside the VA should be reported as a limitation, so that the recommendations of this evidence brief can be considered in the proper context.
recommendations and added more detail about the rationale behind our recommendations. We focused on studies of disparities within the VA as the most applicable to the national VA population.
16 4 No No response 17 5 Yes - See review below See responses below 18 6 Yes -
1. Axon RN, Gebregziabher M, Echols C, Msph GG, Egede LE. Racial and ethnic differences in longitudinal blood pressure control in veterans with type 2 diabetes mellitus. J Gen Intern Med. 2011;26(11):1278-1283.
2. Ayotte BJ, Hausmann LR, Whittle J, Kressin NR. The relationship between perceived discrimination and coronary artery obstruction. Am Heart J. 2012;163(4):677-683.
3. Bosworth HB, Olsen MK, Grubber JM, Powers BJ, Oddone EZ. Racial differences in two self-management hypertension interventions. Am J Med. 2011;124(5):468 e461-468.
4. Burgess DJ, Gravely AA, Nelson DB, et al. A national study of racial differences in pain screening rates in the VA health care system. Clin J Pain. 2013;29(2):118-123.
5. Burgess DJ, Nelson DB, Gravely AA, et al. Racial differences in prescription of opioid analgesics for chronic noncancer pain in a national sample of veterans. J Pain. 2014;15(4):447-455.
6. Burgess DJ, van Ryn M, Grill J, et al. Presence and correlates of racial disparities in adherence to colorectal cancer screening guidelines. J Gen Intern Med. 2011;26(3):251-258.
7. Egede LE, Dismuke C, Echols C. Racial/Ethnic disparities in mortality risk among US veterans with traumatic brain injury. Am J Public Health. 2012;102 Suppl 2:S266-271.
8. Egede LE, Gebregziabher M, Hunt KJ, et al. Regional, geographic, and racial/ethnic variation in glycemic control in a national sample of veterans with diabetes. Diabetes Care. 2011;34(4):938-943.
9. Egede LE, Mueller M, Echols CL, Gebregziabher M. Longitudinal differences in glycemic control by race/ethnicity among veterans with type 2 diabetes. Med Care. 2010;48(6):527-533.
10. Hausmann LR, Hannon MJ, Kresevic DM, Hanusa BH, Kwoh CK, Ibrahim SA. Impact of perceived discrimination in healthcare on
Axon et al, 2011: We excluded this study since it does not report on any outcomes of interest for this review. Ayotte et al, 2012: We included this study in our synthesis. Bosworth et al, 2011: We excluded this study since it does not report on Veterans, the population of interest for this review. Burgess et al, 2013: We included this study in our process measure and access supplemental spreadsheet. Burgess et al, 2011: We included this study in our process measure and access supplemental spreadsheet. Burgess et al, 2014: We included this study in our process measure and access supplemental spreadsheet. Egede et al, 2012: We included this study in our synthesis. Egede et al, 2011: We excluded this study since it does not report on any outcomes of interest for this review. Egede et al, 2010: We excluded this study since it does not report on any outcomes of interest for this review. Hausman et al, 2010: We included this study in our process measure and access supplemental spreadsheet. Hausmann et al, 2011a: We excluded this study since it does not report on any outcomes of interest for this review.
52

Evidence Brief: Racial and Ethnic Disparities within the VA Evidence-based Synthesis Program Supplemental Materials Comment
# Reviewer
# Comment Author response patient-provider communication. Med Care. 2011;49(7):626-633.
11. Hausmann LR, Hanusa BH, Kresevic DM, et al. Orthopedic communication about osteoarthritis treatment: Does patient race matter? Arthritis Care Res (Hoboken). 2011;63(5):635-642.
12. Hausmann LR, Mor M, Hanusa BH, et al. The effect of patient race on total joint replacement recommendations and utilization in the orthopedic setting. J Gen Intern Med. 2010;25(9):982-988.
13. Jackson GL, Oddone EZ, Olsen MK, et al. Racial differences in the effect of a telephone-delivered hypertension disease management program. J Gen Intern Med. 2012;27(12):1682-1689.
14. May FP, Bromley EG, Reid MW, et al. Low uptake of colorectal cancer screening among African Americans in an integrated Veterans Affairs health care network. Gastrointest Endosc. 2014;80(2):291-298.
15. Myaskovsky L, Almario Doebler D, Posluszny DM, et al. Perceived discrimination predicts longer time to be accepted for kidney transplant. Transplantation. 2012;93(4):423-429.
16. Rao SR, Reisman JI, Kressin NR, et al. Explaining Racial Disparities in Anticoagulation Control: Results From a Study of Patients at the Veterans Administration. Am J Med Qual. 2014.
17. Rosen MI, Afshartous DR, Nwosu S, et al. Racial differences in veterans' satisfaction with examination of disability from posttraumatic stress disorder. Psychiatr Serv. 2013;64(4):354-359.
18. Spoont MR, Nelson DB, Murdoch M, et al. ARE THERE RACIAL/ETHNIC DISPARITIES IN VA PTSD TREATMENT RETENTION? Depress Anxiety. 2014.
19. Williams CD, Stechuchak KM, Zullig LL, Provenzale D, Kelley MJ. Influence of comorbidity on racial differences in receipt of surgery among US veterans with early-stage non-small-cell lung cancer. J Clin Oncol. 2013;31(4):475-481.
Hausmann et al, 2011b: We excluded this study since it does not report on any outcomes of interest for this review. Jackson et al, 2012: We excluded this study since the intervention was not specifically designed to reduce racial/ethnic disparities. May et al, 2014: We included this study in our process measure and access supplemental spreadsheet. Myaskovsky et al, 2012: We added this study to our process measure and access supplemental spreadsheet. Rao et al, 2014: We excluded this study since it does not report on any outcomes of interest for this review. Rosen et al, 2013: We excluded this study since it does not report on any outcomes of interest for this review. Spoont et al, 2014: We included this study in our process measure and access supplemental spreadsheet. Williams et al, 2013: We included this study in our process measure and access supplemental spreadsheet.
19 8 No No response
4. Additional suggestions or comments can be provided below. If applicable, please indicate the page and line numbers from the draft report. 20 2 The purpose of this evidence brief is to identify the research and
implementation priorities in racial and ethnic disparities that have emerged since previous ESPs examined clinical areas in which disparities exist and
Added search details to Executive Summary and Methods (To identify relevant citations, we searched MEDLINE® (via PubMed®) and the Cochrane Central Register of Controlled Trials from 10/09/2006 to
53

Evidence Brief: Racial and Ethnic Disparities within the VA Evidence-based Synthesis Program Supplemental Materials Comment
# Reviewer
# Comment Author response intervention to improve health care among minorities were reviewed. Racial and ethnic minorities in the Veterans Health Administration (VHA) are important indicators nationally and in the VHA because it is an equal access health care system. Disparities that are observed in this setting are important because it is a context in which other mitigating factors related to racial and ethnic background (e.g., education, income, health insurance) are better controlled. For this reason, disparities in the VHA may be a more accurate reflection of the effects of racial and ethnic backgrounds on health care and outcomes. Comments about the scope, methods, and conclusions of the brief are provided below. The authors should clearly describe the inclusion date for articles that were eligible for inclusion in the report. It is implied that the inclusion dates were 2007 through 2011, but this is not clearly stated. While this information may be provided in the protocol that is registered with PROSPERO, it should also be listed in the Executive Summary and the Methods section of the report. The authors should also make sure that the registration number identifies the protocol for the review in PROSPERO. I searched the database using the registration number provided in the methods and was unable to find the review.
2/13/2015). Verified protocol listing in PROSPERO, which can be a little slow to upload.
21 2 If studies had to be published between 2007 through 2011 in order to update findings from previous ESP reviews, then it seems that there would have been some restrictions put in place to address Key Questions 1 and 2. This should be clarified.
Added search details to Executive Summary and Methods (To identify relevant citations, we searched MEDLINE® (via PubMed®) and the Cochrane Central Register of Controlled Trials from 10/09/2006 to 2/13/2015).
22 2 The authors describe three categories that were used to group findings about morbidity and mortality outcomes in racial and ethnic minority groups. Caution should be used in the descriptions used in these categories. In particular, the text used to describe Category (B) suggests that the available evidence indicated that it is uncertain if a disparity even exists. For instance, diabetes has a low rating in terms of strength of evidence related to the disparities, but it appears that the evidence is based on only two studies. The rating given to diabetes implies that additional research is needed to determine if there are actually disparities in diabetes between African Americans and whites. But, one of the two studies that are cited as being as the basis for this category is from a study that compared end-stage renal disease rates among patients with HIV to rates of diabetes. The primary purpose of this research was not to compare diabetes outcomes between African Americans and whites. Rather, the purpose of this study was to
We agree there are limitations to using studies that are not specifically designed to answer our questions. Most often the limitations are in the form of imprecision and inadequate adjustment for important confounders. Because of such limitations for the examples you noted, we downgraded the strength of the evidence to low to reflect our limited confidence in their findings We did not rate strength of evidence of the results from the 2007 and 2011 ESP reviews.
54

Evidence Brief: Racial and Ethnic Disparities within the VA Evidence-based Synthesis Program Supplemental Materials Comment
# Reviewer
# Comment Author response compare rates of end-stage renal disease between Veterans who have HIV to those who have diabetes. Similarly, the other study related to diabetes also had a different focus and only included men. Concluding that more research is needed to determine if a disparity exists based on studies that were not designed to address the disease specifically is inaccurate. This point may be relevant to other conditions. Relatedly, drawing conclusions about the strength of the evidence about disparities results reported in other systematic reviews seems like a big leap to make.
23 2 The connection between the strength of the evidence about the presence of disparities and interventions that were developed and evaluated them is not explicitly made. This may be beyond the scope of the report, but it could be a missed opportunity to link interventions with any declines in disparities that were observed since the 2007 report.
Added to summary: “Although it would be useful to link interventions with any declines in disparities that were observed since the 2007 report, there was no opportunity to make such a this link. The only mortality/morbidity disparity observed in the 2007 report was higher mortality among African American Veterans with HIV and we identified no subsequent studies of mortality among African American Veterans with HIV or of interventions to reduce disparities in African Americans with HIV.”
24 2 Although the authors provide a strong rationale for limiting the scope of this review to the time period following the 2007 and 2011 ESP, it seems that this aspect of their review limits the overall strength of the evidence. That is, making a determination that the strength of evidence is limited or that additional research is not needed based on a relatively small number of studies (the absolute number of studies) that were published during a 4-year period may be a premature conclusion.
We also included findings from the 2007 and 2011 ESP reports in addition to any new studies that had subsequently emerged. The 2007 and 2011 ESP reports identified very few studies that evaluated mortality or morbidity outcomes or interventions to reduce disparities to begin with. The 34 multi-site studies that evaluate mortality or mortality outcomes that were published since the 2011 ESP report represents a huge increase in disparities research.
25 2 The most significant finding of this review may be that during a relatively limited period of time, a small number of studies have been conducted to examine or address racial and ethnic disparities in health care and outcomes in the VHA. This point should be emphasized and future directions for how to address this finding should be included in the conclusions.
Added to Future Research section: “Although much progress has been made since the 2007 ESP review in conducting studies on the presence of mortality and morbidity disparities, as noted in the 2011 ESP review, still much more work is needed to implement disparities intervention research.”
26 3 Page 1-2, prevalence and associated research priorities section, and page 19 Summary: These sections are confusing as written because the metrics are not described before they are used, and the type of information presented is not uniform across categories. It would be clearer to introduce the classifications as categorizing the findings by racial and ethnic minority group and by four classifications based on the (1) the morbidity and mortality difference between minority and majority groups (greater versus similar/better), and (2) the strength of the evidence (moderate or better versus low). A clear way to present these classifications would be as a 2 x 2
We added a figure to the Executive Summary and Overview of Research Plan sections to better introduce and illustrate the framework that guided our research recommendations. The figure accomplishes the same objective as you recommended with the 2x2 table of visually illustrating how each research need category links to the direction of the finding (worse or similar/better mortality for racial/ethnic minorities) and its strength (moderate or better vs low).
55

Evidence Brief: Racial and Ethnic Disparities within the VA Evidence-based Synthesis Program Supplemental Materials Comment
# Reviewer
# Comment Author response table, with the research needs for each of the classifications appearing within their respective cells.
27 3 Classification A appears to be studies with good evidence for a morbidity or mortality difference, and therefore, the next research priorities in this category would be those listed as describing the category. By reframing the category definition in this manner, the rationale for the research recommendations becomes more apparent. I suggest moving the listing of the studies out of this section, so that the definition of the categories is reported on separately from the findings. When discussing the studies for this category, it would be useful to clarify which type of research is being recommended (e.g., verifying the disparity, identifying the source of the disparity, evaluating interventions), and provide a supporting rationale for the recommendation.
We kept the findings and future research recommendations together, but reorganized the table horizontally to reframe as you’ve suggested: 1) a column with the 4 categories of direction and strength of evidence, along with a reference to which part of the new figure each category links to, 2) a column with the racial/ethnic minority groups, conditions and outcomes that link to each evidence category, and 3) a column with the research recommendations. We added clarification about which type of research we are recommending and provided more supporting rationale.
28 3 Page 3, Table 1: Why are Native Americans listed as a category separate from American Indian or Alaska Native?
Moved the Native American category into the American Indian or Alaska Native category.
29 3 Page 4, Conclusion: It is not clear from the evidence why a recommendation is being made to verify the disparities listed in a more recent cohort. An evidence gap analysis informed by the non-VA scientific literature was beyond the scope of this review. Specifically, for many racial/ethnic groups and conditions there were no VA studies. That is an important finding which should be emphasized because this is a potential area for future research.
As colon cancer, HIV and CKD findings were based on VA cohorts from the early 2000’s, and changes are possible in the past 10 years, we are suggesting considering the need to verify the disparity in a more recent VA cohort. Added to Future Research section: “As most of the mortality and morbidity disparity prevalence studies focused on African Americans or Hispanic minority groups and on cancer, heart disease or acute care conditions, more work is needed to evaluate prevalence of disparities in other racial/ethnic minority groups and for OHE PEC’s other priority conditions including HIV, hepatitis C, mental illness, spinal cord injury, substance use disorders, polytrauma and blast-related injuries.”
30 3 Page 8, Key Question 1: Since the focus of KQ1 is to provide a 2015 update of evidence on prevalence, it is unclear why isolated findings from the 2007 review are highlighted.
The focus of KQ1 is to provide a synthesis of all evidence to-date on mortality/morbidity disparities, including those from the 2007 review. The only mortality/moribidity disparity from the 2007 review was the higher mortality among African American Veterans with HIV.
31 3 Page 9, ESRD in African-American Veterans with HIV: The sample size appears to be for the parent study, not for the study of the subset of Veterans registering as having HIV (not likely to be 2 million of the 5.5 million VA users). Along those lines, throughout the tables, the sample sizes should be corrected to reflect the manuscript being reported on.
We confirmed and corrected sample sizes throughout the document.
56

Evidence Brief: Racial and Ethnic Disparities within the VA Evidence-based Synthesis Program Supplemental Materials Comment
# Reviewer
# Comment Author response 32 3 Page 18, Summary: Statements such as “increased risk of pre-term birth in
Veterans with PTSD is the only disparity that is present in multiple racial/ethnic minority groups” are misleading in the absence of a large number of studies to examine disparities in multiple racial/ethnic groups.
Changed to: “However, for PTSD, because the higher risk of preterm birth was consistently found across two minority groups, we recommend considering examining sources as the next step for future research.”
33 4 This evidence brief addresses the important and timely topic of health and health care disparities that affect Veterans being cared for by the Veterans Affairs (VA) Healthcare System. The report offers an informative snapshot of current state of research on disparities in the VA. I offer several comments for the authors to consider as they finalize this worthwhile report: The classification categories in the executive summary were not intuitive to me. Were they supposed to range from strongest to weakest evidence, along with the recommended action based on the level of evidence? That did not come through in the way they were written. I was particularly confused by Category C from the executive summary.
Yes, the classification categories were based on direction (worse or similar/better mortality for racial/ethnic minorities) and strength (moderate or better vs low) of evidence. We added a figure to the Executive Summary and Overview of Research Plan sections to better introduce and illustrate how each research need category links to the direction of the finding (worse or similar/better mortality for racial/ethnic minorities) and its strength (moderate or better vs low).
34 4 Minor point: There are some stray or missing punctuation marks throughout the text and table that need to be corrected prior to finalization of the report. I did not line-item edit these marks, but first noticed them in the colon cancer section on p. 9.
We copy-edited the evidence brief and removed all stray punctuation marks.
35 4 Page 10, paragraph 1: Why is adjustment for between-facility differences being emphasized as a major limitation of studies? Is the VA only interested in within-facility racial differences? Identifying whether disparities observed at the national level are happening because patients receive different treatment within the same facilities and/or because minority patients receive care at lower-performing facilities is moving into the “understanding” phase of disparities. That is, a study focused on identifying the presence of disparities shouldn’t necessarily be faulted for not taking into account facility-level variation in outcomes. Once a disparity is recognized as being present (regardless of where patients receive care), determining whether the disparity is due, in part or in full, to differences in where patients get care would be one of many possible avenues to pursue in trying to understand why the disparity is happening, which will then guide intervention strategies to reduce the disparities.
We take your point that facility-level variation overlaps with the understanding phase of disparities. Although we still note whether treatment facility were included in the models, we corrected instances where we downgraded evidence due to lack of treatment facility adjustment. This resulted in three instances where we changed the strength of evidence rating from low to moderate: increased risk of incidence cirrhosis and hepatocellular carcinoma in Hispanics with Hepatitis C, reduced risk of incident cirrhosis and incident hepatocellular carcinoma in blacks with Hepatitis C, and reduced risk of death in blacks one-year after a stroke.
36 4 In Table 1 a 3-star system is used to designate high, moderate, and low strength of evidence. How does that map onto the 4 categories of studies presented in the executive summary? Also, in the second column of the table, terms like “fair”, “good” “unknown consistency” and “imprecision”
We added a figure to the Executive Summary and Overview of Research Plan sections to better introduce and illustrate how each research need category links to the direction of the finding (worse or similar/better mortality for racial/ethnic minorities) and its strength (moderate or better vs
57
Evidence Brief: Racial and Ethnic Disparities within the VA Evidence-based Synthesis Program Supplemental Materials Comment
# Reviewer
# Comment Author response are used, and I’m not sure how those fit into the 3-star system or the A-D categories of evidence from the executive summary. I understand you are trying to summarize a lot of different things in a single table, which is a challenge, but I think the take-home message would be more powerful and clear if you had a more straightforward and consistent way of communicating all the different components you evaluated for each study.
low). To clarify how the concepts “fair”, “good” “unknown consistency” and “imprecision” were used to determine strength of evidence, we added a brief description of the rating system to the Methods section.
37 4 P. 18, Arthritis and pain management section: The explanation of study 64 is a little strange, in that it does not give the comparison group (i.e., attention control), and the conclusion is not clear from the way the findings are described. My understanding of that study is that none of the intervention arms resulted in significantly different 12-month attendance rates at orthopedic clinics compared to an attention control arm. So, is the intervention effective or not? This ambiguity is also present in the summary section, where it says the 3 interventions all result in similar consult rate (similar to what? an attention control study arm).
Yes, no intervention resulted in different 12-month attendance rates at an orthopedic clinic compared to the attention control arm. We changed the explanation of this study: “There is low-strength evidence from a good-quality RCT of 639 African American Veterans from the Pittsburgh, Cleveland, and Philadelphia VAMCs that, compared to an attention control group who only received an educational booklet, there was no difference in 12-month orthopedic surgeon appointment attendance for a decision aid intervention group who watched a video on the risks and benefits of different treatment options (aOR 1.27, 95% CI, 0.54-3.00), a motivational interviewing intervention group that underwent a counseling session with a trained interventionist (aOR 1.79, 95% CI, 0.78-4.07), or for a decision aid and motivational interviewing group that watched the video before their counseling session (aOR 2.05, 95% CI, 0.90-4.65).”
38 4 As noted in my comment on the executive summary, I find the A-D categories not very clear or particularly useful as currently presented. I think the groupings are probably fine, but the way the categories are described does not really drive home the recommendations that follow from each category. Consider providing more explanation for each category and the logical next steps for research/action for each. For example, the 3rd part of Category C needs to be elaborated (i.e., “whether there is reason to believe that decreasing the causes would reduce the disparity). What do the authors mean by that? A category that includes “may or may not be needed” is really not very useful. How are people supposed to act (or not) on that? Taking Category B as another example, I think it would be much more clear if was relabeled something like, “More research is needed to establish the presence/absence of disparity.”
We added a figure to the Executive Summary and Overview of Research Plan sections to better introduce and illustrate how each research need category links to the direction of the finding (worse or similar/better mortality for racial/ethnic minorities) and its strength (moderate or better vs low) and added more explanation of each category and logical next steps. . Also, we changed Category B as suggested and simplified Category C to: “More research to establish the presence/absence of disparity is probably not needed unless there is a large proven disparity outside of the VA.”
39 4 Limitations: I don’t think the exclusion of Non-English studies needs to be mentioned as a limitation given that there are unlikely to be many, if any, non-English studies published using VA data.
Removed.
58

Evidence Brief: Racial and Ethnic Disparities within the VA Evidence-based Synthesis Program Supplemental Materials Comment
# Reviewer
# Comment Author response 40 4 I disagree with excluding all single-center studies, given that the HSR&D
budget caps and the 3-year project timeline makes large multi-site trials difficult to conduct in the VA. Consider including at least the high-quality single-center studies.
We focused on multi-center studies because their findings have the broadest generalizability to the national US Veteran population
41 5 This evidence brief seeks to provide an update on the prevalence of racial/ethnic health disparities in VA and interventions to address these disparities. Comments: page 1: I was unclear about the different classifications. “A” refers to “need for research to … verify disparity in more recent cohort or … identify sources of disparity.” These seem like separate concepts. For example, for the lower 3-years survival for colon cancer, is there a need to verify this disparity using more recent data, identify the sources of the disparity, or implement interventions to address the disparity.
Added: “In applying these findings, the OHE should consider that all are based on VA cohorts from the early 2000’s. Over the past 10 years, changes in the delivery system or in diagnostic and treatment approaches may have changed these disparities. OHE can decide whether these findings are still current, or can fund studies to verify them in more recent cohorts. If 10-year-old data is acceptable, or if the mortality and morbidity disparity is verified in a more recent cohort, then new research should examine its sources.”
42 5 page 1: what is “3.7-year end stage renal disease”. Seems like there is a word or phrase missing.
Added details about when timeframe started or whether it was average follow-up for a mixed cohort.
43 5 page 5: the section labeled conceptual framework does not present a conceptual framework. This appears to be an overview of the research plan. The reason this would be important is that the report presents differences that adjust for socioeconomic factors, while the IOM framework would consider SES to be a mediator of disparities rather than a “confounder”. A conceptual model would be helpful to orient the reader about the types of studies included, identify how the authors defined the terms “dispartity” and “differences” and the estimates that are abstracted from each study.
We changed title of section to “Overview of Research Plan”. We did not use or refer to the IOM framework because its objective of evaluating healthcare inequities differs to our objective of evaluating health inequities. We added to the ‘Overview of Research Plan’ this sentence about how we defined disparity: “To fit the purpose of this report, we defined disparity as any instance of worse mortality or morbidity outcomes for the racial/ethnic minority groups. “ For SES, we added to Methods:” For SES, we included studies whether or not they adjusted for SES. When studies adjusted for SES, we noted its impact.” Only 5 studies adjusted for SES and 4 of them found disparities despite that adjustment. We do not believe that Volpp 2007’s findings of no disparity are due to their adjustment for SES as the additional analyses in Jha 2010 and Polsky 2007 did not adjust for SES and also found no disparity
44 5 Page 6: Given the scope outlined, there appear to be missing studies. Here are 7: 1. Rehman SU, Hutchison FN, Hendrix K, Okonofua EC, Egan BM. Ethnic
Thank you for these suggestions. Rehman et al, 2005: We added this study to our process measure and access supplemental spreadsheet.
59

Evidence Brief: Racial and Ethnic Disparities within the VA Evidence-based Synthesis Program Supplemental Materials Comment
# Reviewer
# Comment Author response differences in blood pressure control among men at Veterans Affairs clinics and other health care sites. Arch Intern Med 2005;165(9):1041-1047. 2. Heisler M, Smith DM, Hayward RA, Krein SL, Kerr EA. Racial disparities in diabetes care processes, outcomes, and treatment intensity. Med Care 2003;41(11):1221-1232. 3. Safford M, Eaton L, Hawley G, et al. Disparities in use of lipid-lowering medications among people with type 2 diabetes mellitus. Arch Intern Med 2003;163(8):922-928. 4. Etzioni DA, Yano EM, Rubenstein LV, et al. Measuring the quality of colorectal cancer screening: the importance of follow-up. Dis Colon Rectum 2006;49(7):1002-1010. 5. Bosworth HB, Dudley T, Olsen MK, et al. Racial differences in blood pressure control: potential explanatory factors. Am J Med 2006;119(1):70 e79-15. 6. Trivedi AN, Grebla R, Wright SM, Washington DL. Despite improved quality of care in the Veterans Affairs health care system, racial disparity persists for important clinical outcomes. Health Affairs 2011. 7: Halanych JH, Wang F, Miller DR, Pogach LM, Lin H, Berlowitz DR, Frayne SM. Racial/ethnic differences in diabetes care for older veterans: accounting for dual health system use changes conclusions. Med Care. 2006 May;44(5):439-45. PubMed PMID: 16641662. There is a table of ongoing projects, which does not include a VA-funded Merit study (PI Donna Washington) that examines facility-level determinants of racial/ethnic disparities. This suggests that either the search strategy was incomplete, or there were other inclusion and exclusion criteria that are not described in the review. A more complete description of the seach strategy including search terms would be helpful.
Heisler et al, 2003: We added this study to our process measure and access supplemental spreadsheet. Safford et al, 2003: We added this study to our process measure and access supplemental spreadsheet. Etsioni et al, 2006: We added this study to our process measure and access supplemental spreadsheet. Bosworth et al, 2006: We excluded this study since it does not report on any outcomes of interest for this review. Trivedi et al, 2011: We included this study in our process measure and access supplemental spreadsheet. Halanych et al, 2006: We excluded this study since it is cross-sectional. We did identify Donna Washington’s ongoing VA-funded merit study, but it does not meet the inclusion criteria of this review.
46 5 The tables in the review issue grades and an overall quality rating without a clear rubric for how these assignments are made. What were the criteria for assigning studies to “fair” or “good”? What does “non-biased” selection mean? How did the reviewers determine that missing data were handled “adequately”? What is an “adequate” duration of follow-up? None of these ratings are defined nor is there a description of the interrater reliability of these classifcations.
Although described in detail in our PROSPERO-registered protocol, we added details to our Methods section that we rated internal validity of included studies based on Cochrane’s Risk of Bias Tool for controlled trials and the Drug Effectiveness Review Project’s Tool for observational studies. It is not standard to formally assess interrater agreement using kappa statistics because the goal of dual review is not to achieve high agreement, but to identify, explore and resolve reasons for disagreement.
60

Evidence Brief: Racial and Ethnic Disparities within the VA Evidence-based Synthesis Program Supplemental Materials Comment
# Reviewer
# Comment Author response It appears that every article included “outcomes that were pre-specified and defined. Does this column need to be included given the ‘yes’ for all of the studies? It is unclear how an article could be included or published without specifying an outcome. The level of adjustment for potential confounders and multilevel modeling column is particularly problematic, since the IOM does not consider SES to be a confounder of racial/ethnic disparities. Further, the choice of a multi-level model (vs. a fixed effect or GEE) is not a marker of the quality of a study but rather reflects the objective of a particular analysis. If including a facility fixed effect eliminates the racial/ethnic disparity, that does not necessarily mean that the study found no disparity within the VA. A conceptual model that describes how the authors treat clinical factors, SES, and providers in the relationship between race/ethnicity and otucomes would be helpful. The IOM model might provide a helpful orientation.
For the item, ‘included “outcomes that were pre-specified and defined’, yes we often find that publications’ methods sections do not prespecify the total number of planned outcomes and lack clear definitions for outcomes. For example, a publication could report that they assessed mortality, but omit details as to at which timepoint(s) and when the counting began (e.g., after diagnosis? after initiation of treatment?). We did not use or refer to the IOM framework because its objective of evaluating healthcare inequities differs to our objective of evaluating health inequities. For clarification of how we assessed level of adjustment for potential confounders, we added the following details from our protocol to our Methods: “We categorized level of adjustment for potential confounders as high, medium or low based on the degree to which studies accounted (1) demographic, (2) illness severity, and (3) comorbidity variable and, to add insight, noted whether SES and treatment facility were included in the models and whether studies presented a conceptual model that explained covariate selection.” We removed the multi-level modeling specification. We had meant that specification to capture whether treatment facility was included as a covariate, regardless of the choice of multi-level modeling. .
47 6 Executive Summary Question if Category B or C has evidence from earlier studies, and also for Category A. Or were the results from the Systematic Reviews included as well? (I wasn’t sure from what was said under Methods, Literature Flow which references systematic reviews.) If it includes the Systematic Reviews also, I think that some description of this would be helpful in the Executive Summary.
Yes, our future research recommendations include evidence from the previous ESP reviews. We added clarification to the Executive Summary as to which findings were from the previous reviews.
48 6 Executive Summary Purpose in Exec Summary gives timeframe. Maybe should include number of studies part of this analysis. I know it’s in the full report. I would be interested in seeing someplace the number of studies by year – would be interesting to see quantity of research findings – if seeing more or less research. This is all context.
Added to Executive Summary that the 2007 ESP review only identified 1 mortality/morbidity study and that, since 2007, there has been a steady stream of new research emerging and for this update, we identified 34 new studies of mortality and morbidity outcomes.
49 6 Executive Summary VA based interventions to reduce disparities. Bosworth found a multi-pronged intervention did result in differences for AA in hypertension. Not sure where that is.
Bosworth et al, 2011: We excluded this study since it does not report on Veterans, the population of interest for this review.
61

Evidence Brief: Racial and Ethnic Disparities within the VA Evidence-based Synthesis Program Supplemental Materials Comment
# Reviewer
# Comment Author response
50 6 My concern here is that by not at all mentioning that some areas may be addressed in earlier studies and systematic reviews, this leaves the impression that we need to investigate the prevalence of disparities for all kinds of conditions, and also reasons, when we may know some of these already. If as it seems as I read the full report, these are included, I think stating up front in Ex Sum would be helpful for clarification also. Also, this is probably in the body of the document, but I will look to see the dates of study for when there was documentation of disparities. If it’s 10 years ago or 5 years ago… Not to say update is not needed, but it does have relevance. Maybe there needs to be more explicit attention to what update means. For example, in body when I see evidence about disparities in color cancer, it does say that one study based on 2001-2004. Clearly, update is needed since changes possible in 10 years. CKD also old data, etc.
Yes, we included evidence from the previous ESP reviews and better clarified this up front in the Executive Summary. Yes, we agree that the findings on African American Veterans with colon cancer, HIV and CKD are based on old data from the early 2000’s and that changes are possible in the past 10 years and that the next step is to consider the need to verify the disparity in a more recent VA cohort. We better clarified this in the Future Research Recommendations section.
51 6 P. 10 - for which almost no promising interventions have been developed.4 I’d have to think about more whether this statement is accurate. In looking at conditions – I was thinking that some listing – not sure how you’d get that – maybe in some order – either body system or alphabetical – could be helpful to think systematically where we know something or not. Obviously, there are conditions where we know nothing (or maybe where there might not be any disparities). I’m just thinking in terms of going forward, what we need to do. At any rate, some systematic way for listing/ordering the conditions could be helpful in looking from one category or section to another. So what I’m thinking is: Cancer, CVD, diabetes, mental health, etc. As I’m looking, sometimes the different conditions are discussed alphabetically, but not always.
Revised to consistently list conditions in alphabetical order.
52 6 Scope For comparison, does this mean you didn’t look at studies that focused on a single population (African American but not in relationship to whites)?
For prevalence, we required a comparison group. But, for interventions, we included studies that compared before and after an intervention in a single minority group.
53 6 Methods Nine single center studies39-47 were not assessed for quality or included in our synthesis but are abstracted in the supplemental materials. Just curious
We focused on multi-center studies because their findings have the broadest generalizability to the national US Veteran population
62

Evidence Brief: Racial and Ethnic Disparities within the VA Evidence-based Synthesis Program Supplemental Materials Comment
# Reviewer
# Comment Author response why – something about single center??? Later saw reference to only multicenter studies included.
54 6 Table 1 I like this table a lot. Again, not sure of logic of order. What is RR on last column? So for African-American vs. white – nothing on mental health other than 1 PTSD and preterm birth? Nothing in what other categories? I thought there was a recent PTSD study – Spoont.
RR=rapid review, but this was changed to ‘brief’ Yes, Spoont and colleagues published a PTSF study in Depression and Anxiety in 2014 showing that African Americans and Latino Veterans were less likely to receive treatments. We provided data abstraction of this process measure study in an appendix, but in the report only synthesized findings of mortality/morbidity outcomes.
56 6 In Table 1, are these the same studies that look at different racial/ethnic groups compared to whites? I guess I’d like to know that at some point in the text narrative.
Yes, Table 1 reflects comparisons of minority groups to white groups. Added clarification to the table.
57 6 When you say # of new process/access measures studies and types of outcomes identified in RR – I understand the process measures, not sure what you’re looking at in terms of access (I’m not sure if all of this is defined somewhere) and by types of outcomes – you mean treatment, time between diagnosis and drug initiation, etc.
Added examples of both process measures (i.e., offer and uptake of care, guideline adherence, etc.) and access (e.g., wait times)
58 6 Table 2 There’s no discussion/column for 2007 report, intervention etc. because these are low-strength evidence studies?
We felt that evidence about potential causes and interventions were not relevant because Table 2 reflects evidence suggesting similar or better mortality for minority groups.
59 6 Question Except for pre-term birth – there are no studies that address racial/ethnic disparities in females?
Yes.
60 6 Maybe Category E – no studies on disparities. Like if really none on PTSD, other mental health, other than stroke, nothing on CVD? Breast cancer?
Added clear statement to results that we found no studies in spinal cord injury, polytrauma and blast-related injuries and added recommendation for more studies in less well-researched racial/ethnic minority groups and for OHE PEC’s other priority conditions including HIV, hepatitis C, mental illness, spinal cord injury, substance use disorders, polytrauma and blast-related injuries
61 6 Limitations Additionally, due to the exclusion of studies published in languages other than English, and because we only synthesized evidence from multicenter studies, we may have missed additional studies of important disparities or interventions. I guess this is why the single center studies were not included. We did not evaluate studies of the sources of differences in health care quality (eg, patient, provider, patient-provider, and system factors). You list
We focused on multi-center studies because their findings have the broadest generalizability to the national US Veteran population. Regarding excluded studies, added: “Among the 76 excluded studies, the majority were excluded for being in non-Veteran populations (N=18), involving an ineligible study design (e.g., cross-sectional) (N=16), or having ineligible outcomes (N=26). Types of ineligible outcomes included intermediate clinical outcomes such as glucose or blood pressure control,
63
Evidence Brief: Racial and Ethnic Disparities within the VA Evidence-based Synthesis Program Supplemental Materials Comment
# Reviewer
# Comment Author response studies not included. Maybe there should be a few sentences that describe what types of studies these are – since they could examine factors that may impact morbidity and mortality.
which could contribute to mortality or morbidity disparities, but which were outside of the scope of this brief.”
62 6 Evidence Tables Split of conducting….
Corrected.
63 6 Chapko study is officially completed. Not sure if publications. Thank you for your comment. We contacted Dr. Chapko and he confirmed that they are still analyzing their data. This is captured in the status listed in the supplemental materials.
64 6 Supplemental materials This is likely the format you always use, but I find it cumbersome to have to consult end list of references to see study. It would be helpful to me to have first author and date in the table. This is Page 34 on. I see earlier ones do have author and year.
Added Author and Year to tables.
65 8 Good report- some major comments: I would distinguish mortality studies by users of VA care versus Veteran non-VA care users (it was not clear whether study populations only constituted VA users, which differ than the general Veteran population). Were there disparities in HIV -realated outcomes apparent beyond ESRD? This conclusion seems too specific to generalize to the larger HIV population. This also points to the need for fewer disease-specific studies and more population-based analyses that do not parse out by diagnosis.
Added clarification that the majority of studies reflected VA care use only, with only 24% supplemented with Medicare data to more completely capture the totality of care across the general VA population. Also added recommendation that future studies should supplement VHA data with Medicare data whenever possible to more completely capture the totality of patients’ care. For HIV, yes, the 2007 ESP review found higher mortality for African Americans with HIV. Regarding the limitation of evaluating rarer morbidities such as ESRD in HIV, added to the Future Research Recommendations: “For morbidity outcomes, to maximize generalizability to the broadest disease populations, studies should examine multiple relevant outcomes, not just a single rare outcome in isolation. For example, future studies of rates of ESRD in HIV should be done in the context of other more common outcomes, such as severe bacterial infections or AIDS events..
64

Evidence brief: Racial and ethnic disparities within the VA Evidence-based Synthesis Program Supplemental Materials
REFERENCES 1. Alvord LA, Henderson WG, Benton K, Buchwald D. Surgical outcomes in American
Indian veterans: a closer look. J Am Coll Surg. 2009;208(6):1085-1092 e1081. 2. Alvord LA, Rhoades D, Henderson WG, et al. Surgical morbidity and mortality among
American Indian and Alaska Native veterans: a comparative analysis. J Am Coll Surg. 2005;200(6):837-844.
3. Aujesky D, Long JA, Fine MJ, Ibrahim SA. African American race was associated with an increased risk of complications following venous thromboembolism. J Clin Epidemiol. 2007;60(4):410-416.
4. Ayotte BJ, Hausmann LR, Whittle J, Kressin NR. The relationship between perceived discrimination and coronary artery obstruction. Am Heart J. 2012;163(4):677-683.
5. Choi AI, Rodriguez RA, Bacchetti P, Bertenthal D, Hernandez GT, O'Hare AM. White/black racial differences in risk of end-stage renal disease and death. Am J Med. 2009;122(7):672-678.
6. Choi AI, Rodriguez RA, Bacchetti P, Bertenthal D, Volberding PA, O'Hare AM. Racial differences in end-stage renal disease rates in HIV infection versus diabetes. J Am Soc Nephrol. 2007;18(11):2968-2974.
7. Daskivich TJ, Kwan L, Dash A, Litwin MS. Racial parity in tumor burden, treatment choice and survival outcomes in men with prostate cancer in the VA healthcare system. Prostate Cancer Prostatic Dis. 2015.
8. Egede LE, Dismuke C, Echols C. Racial/Ethnic disparities in mortality risk among US veterans with traumatic brain injury. Am J Public Health. 2012;102 Suppl 2:S266-271.
9. El-Serag HB, Kramer J, Duan Z, Kanwal F. Racial differences in the progression to cirrhosis and hepatocellular carcinoma in HCV-infected veterans. Am J Gastroenterol. 2014;109(9):1427-1435.
10. Freeman VL, Durazo-Arvizu R, Arozullah AM, Keys LC. Determinants of mortality following a diagnosis of prostate cancer in Veterans Affairs and private sector health care systems. Am J Public Health. 2003;93(10):1706-1712.
11. Frei CR, Mortensen EM, Copeland LA, et al. Disparities of care for African-Americans and Caucasians with community-acquired pneumonia: a retrospective cohort study. BMC Health Serv Res. 2010;10:143.
12. Fudalej S, Bohnert A, Austin K, Barry K, Blow F, Ilgen M. Predictors of injury-related and non-injury-related mortality among veterans with alcohol use disorders. Addiction. 2010;105(10):1759-1766.
13. Ganti AK, Subbiah SP, Kessinger A, Gonsalves WI, Silberstein PT, Loberiza FR, Jr. Association between race and survival of patients with non--small-cell lung cancer in the United States veterans affairs population. Clin Lung Cancer. 2014;15(2):152-158.
14. Graham-Steed T, Uchio E, Wells CK, Aslan M, Ko J, Concato J. 'Race' and prostate cancer mortality in equal-access healthcare systems. Am J Med. 2013;126(12):1084-1088.
15. Hou JK, Kramer JR, Richardson P, Mei M, El-Serag HB. Risk of colorectal cancer among Caucasian and African American veterans with ulcerative colitis. Inflammatory bowel diseases. 2012;18(6):1011-1017.
16. Jha AK, Stone R, Lave J, Chen H, Klusaritz H, Volpp K. The concentration of hospital care for black veterans in Veterans Affairs hospitals: implications for clinical outcomes. J Healthc Qual. 2010;32(6):52-61.
65
Evidence brief: Racial and ethnic disparities within the VA Evidence-based Synthesis Program Supplemental Materials 17. Jones LG, Sin MK, Hage FG, et al. Characteristics and Outcomes of Patients with
Advanced Chronic Systolic Heart Failure Receiving Care at the Veterans Affairs vs. Other Hospitals: Insights from the BEST Trial. Circ Heart Fail. 2014.
18. Kamalesh M, Shen J, Tierney WM. Stroke mortality and race: does access to care influence outcomes? Am J Med Sci. 2007;333(6):327-332.
19. Kokkinos P, Myers J, Nylen E, et al. Exercise capacity and all-cause mortality in African American and Caucasian men with type 2 diabetes. Diabetes Care. 2009;32(4):623-628.
20. Kovesdy CP, Quarles LD, Lott EH, et al. Survival advantage in black versus white men with CKD: effect of estimated GFR and case mix. Am J Kidney Dis. 2013;62(2):228-235.
21. Kressin NR, Glickman ME, Peterson ED, Whittle J, Orner MB, Petersen LA. Functional status outcomes among white and African-American cardiac patients in an equal access system. Am Heart J. 2007;153(3):418-425.
22. Lynch CP, Gebregziabher M, Zhao Y, Hunt KJ, Egede LE. Impact of medical and psychiatric multi-morbidity on mortality in diabetes: emerging evidence. BMC Endocr Disord. 2014;14:68.
23. Meyers JF, Robbins AS, Gildengorin GL, Grayson JK. Racial differences in mortality among men hospitalized in military hospitals. Mil Med. 2008;173(6):539-543.
24. Optenberg SA, Thompson IM, Friedrichs P, Wojcik B, Stein CR, Kramer B. Race, treatment, and long-term survival from prostate cancer in an equal-access medical care delivery system. JAMA. 1995;274(20):1599-1605.
25. Polsky D, Lave J, Klusaritz H, et al. Is lower 30-day mortality posthospital admission among blacks unique to the Veterans Affairs health care system? Med Care. 2007;45(11):1083-1089.
26. Polsky D, Jha AK, Lave J, et al. Short- and long-term mortality after an acute illness for elderly whites and blacks. Health Serv Res. 2008;43(4):1388-1402.
27. Samuel CA, Landrum MB, McNeil BJ, Bozeman SR, Williams CD, Keating NL. Racial disparities in cancer care in the Veterans Affairs health care system and the role of site of care. Am J Public Health. 2014;104 Suppl 4:S562-571.
28. Sarrazin MV, Cannon KT, Rosenthal GE, Kaldjian LC. Racial differences in mortality among veterans hospitalized for exacerbation of chronic obstructive pulmonary disease. J Natl Med Assoc. 2009;101(7):656-662.
29. Shaw JG, Asch SM, Kimerling R, Frayne SM, Shaw KA, Phibbs CS. Posttraumatic stress disorder and risk of spontaneous preterm birth. Obstet Gynecol. 2014;124(6):1111-1119.
30. Shimada SL, Montez-Rath ME, Loveland SA, Zhao S, Kressin NR, Rosen AK. Racial Disparities in Patient Safety Indicator (PSI) Rates in the Veterans Health Administration Advances in Patient Safety: New Directions and Alternative Approaches (Vol. 1: Assessment). Rockville MD2008.
31. Tseng CL, Rajan M, Miller DR, Lafrance JP, Pogach L. Trends in initial lower extremity amputation rates among Veterans Health Administration health care System users from 2000 to 2004. Diabetes Care. 2011;34(5):1157-1163.
32. Volpp KG, Stone R, Lave JR, et al. Is thirty-day hospital mortality really lower for black veterans compared with white veterans? Health Serv Res. 2007;42(4):1613-1631.
33. Zullig LL, Carpenter WR, Provenzale DT, et al. The association of race with timeliness of care and survival among Veterans Affairs health care system patients with late-stage non-small cell lung cancer. Cancer Manag Res. 2013;5:157-163.
66

Evidence brief: Racial and ethnic disparities within the VA Evidence-based Synthesis Program Supplemental Materials 34. Agarwal R, Bunaye Z, Bekele DM, Light RP. Competing risk factor analysis of end-stage
renal disease and mortality in chronic kidney disease. Am J Nephrol. 2008;28(4):569-575. 35. Dahodwala N, Karlawish J, Siderowf A, Duda JE, Mandell DS. Delayed Parkinson's
disease diagnosis among African-Americans: the role of reporting of disability. Neuroepidemiology. 2011;36(3):150-154.
36. Ellis C, Zhao Y, Egede LE. Racial/ethnic differences in stroke mortality in veterans. Ethn Dis. 2009;19(2):161-165.
37. Koscuiszka M, Hatcher D, Christos PJ, et al. Impact of race on survival in patients with clinically nonmetastatic prostate cancer who deferred primary treatment. Cancer. 2012;118(12):3145-3152.
38. Liang MK, Li LT, Avellaneda A, Moffett JM, Hicks SC, Awad SS. Outcomes and predictors of incisional surgical site infection in stoma reversal. JAMA Surg. 2013;148(2):183-189.
39. Lynch CP, Gebregziabher M, Echols C, Gilbert GE, Zhao Y, Egede LE. Racial disparities in all-cause mortality among veterans with type 2 diabetes. J Gen Intern Med. 2010;25(10):1051-1056.
40. Powell IJ, Schwartz K, Hussain M. Removal of the financial barrier to health care: does it impact on prostate cancer at presentation and survival? A comparative study between black and white men in a Veterans Affairs system. Urology. 1995;46(6):825-830.
41. Richardson LK, Egede LE, Mueller M. Effect of race/ethnicity and persistent recognition of depression on mortality in elderly men with type 2 diabetes and depression. Diabetes Care. 2008;31(5):880-881.
42. Robinson CN, Balentine CJ, Marshall CL, et al. Ethnic disparities are reduced in VA colon cancer patients. Am J Surg. 2010;200(5):636-639.
43. Sabounchi S, Keihanian S, Anand BS. Impact of race on colorectal cancer. Clin Colorectal Cancer. 2012;11(1):66-70.
44. Schreiber D, Levy EB, Schwartz D, et al. Impact of race in a predominantly African-American population of patients with low/intermediate risk prostate cancer undergoing radical prostatectomy within an equal access care institution. Int Urol Nephrol. 2014;46(10):1941-1946.
45. Zevallos JP, Sandulache VC, Hamblin J, et al. The impact of race on oropharyngeal squamous cell carcinoma presentation and outcomes among veterans. Head Neck. 2014.
46. Long JA, Jahnle EC, Richardson DM, Loewenstein G, Volpp KG. Peer mentoring and financial incentives to improve glucose control in African American veterans: a randomized trial. Ann Intern Med. 2012;156(6):416-424.
47. Ibrahim SA, Hanusa BH, Hannon MJ, Kresevic D, Long J, Kent Kwoh C. Willingness and access to joint replacement among African American patients with knee osteoarthritis: a randomized, controlled intervention. Arthritis Rheum. 2013;65(5):1253-1261.
48. Jia H, Chumbler NR, Wang X, et al. Racial and ethnic disparities in post-stroke depression detection. Int J Geriatr Psychiatry. 2010;25(3):298-304.
67


![Effectiveness of brief psychological interventions for ... · gender differences with men more likely to die by sui- ... tional) [11, 12] generally report brief interventions as](https://img.dokumen.tips/doc/110x75/5b93d8c209d3f219658ba46d/effectiveness-of-brief-psychological-interventions-for-gender-differences.jpg)