Embed Size (px)
Citation preview

Evidence-based teaching in introductory biology
Scott Freeman, Department of Biology
University of Washington

Why are we still lecturing?

But first: The goal (of higher education)
Imagination
Expertise
Thank you: John Bransford (pers. comm. and Bransford et al. 2000. How People Learn (NAP: WashDC) Hatano, G. & K. Inagaki. 1986. Child Development and Education in Japan (W.H. Freeman, New York) Schwartz et al. in Mestre, ed. Transfer of Learning from a Modern Interdisciplinary Perspective.
rudderless
routine experts
Adaptive experts

• Bio180: evolution, Mendelian genetics, ecology • Bio200: molecular genetics, cell biology, development • Bio220: plant and animal physiology
Research on the introductory sequence required for biology-related majors at the University of Washington:
Today’s big question: How can we lower failure rates—and help capable but underprepared students—in introductory biology courses?

Bio180 background:
2000-2007 Students/qtr 340 Students/year 1,200
5,650 students in 2011 freshman class … ~40% of all undergrads at UW are taking Bio180
2008 390 1,350
2009- 700 2,100
10% of UW freshmen are first in their families to attend college; >50% receive financial aid; 1/3rd eligible for Pell grants; 25% pay no tuition.

Bio 180 demographics:
Most students are sophomores (Chem prereq)
Gender & ethnicity: 61% female; 39% male 44.6% white
45.3% Asian-American and International
8.4% underrepresented minorities
90% pre-grad/professional school
~30% ESL
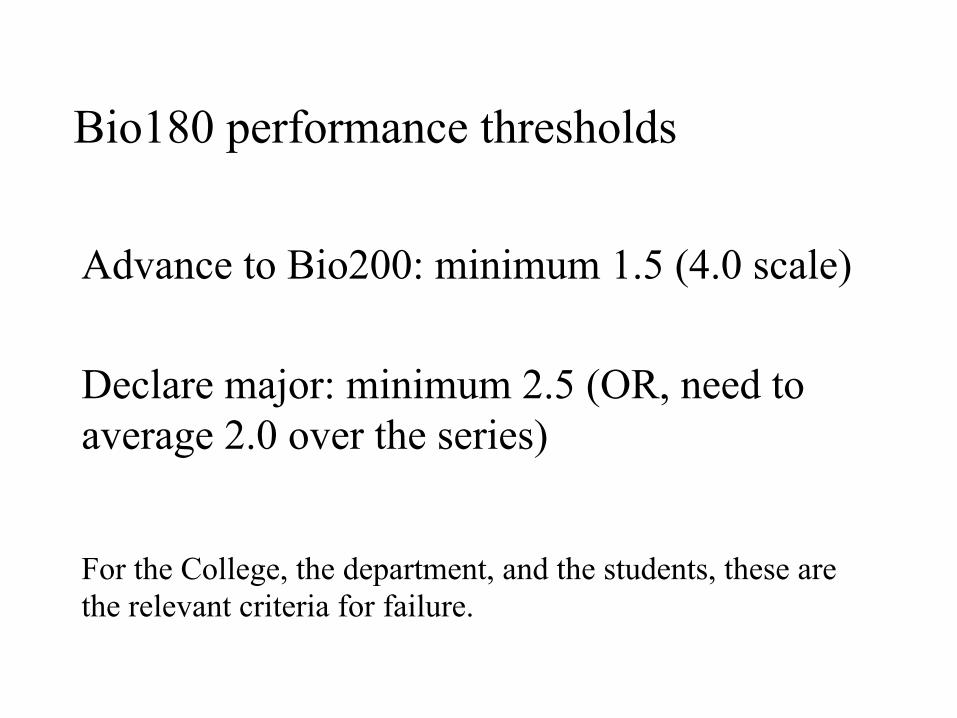
Bio180 performance thresholds
Advance to Bio200: minimum 1.5 (4.0 scale)
For the College, the department, and the students, these are the relevant criteria for failure.
Declare major: minimum 2.5 (OR, need to average 2.0 over the series)

Why be concerned about the failure rate?
Predicted grade
Average % EOP students in Bio180

Two timelines: (U.S. data)
1920: 4% 2010: 55%
1860s: first land grant colleges 1900: first community colleges 1944: GI bill 1962: James Meredith integrates the University of Mississippi 1963: Vivian Malone and James Hood integrate the University of Alabama 2010: 57% of U.S. undergrads are women

Spring 2002 Course design
Spr ‘02
< 1.5 18.2%
< 2.5 44.8%
Modified Socratic style
Student performance (does not include drops):

Spring 2003 Course Design: Modified Socratic + 3-5 daily, active-learning exercises in class
• exam-style questions: work, give answer, discuss
• think/pair/share: state a hypothesis, make a prediction, interpret a graph
• case studies on tough topics: informal groups
• minute papers (handed in but not graded): muddiest point, write an exam question
• in-class demonstrations with student participation

Spring 2003 Course Design Results
Spr ‘02 Spr ‘03
< 1.5 18.2% 15.8%
< 2.5 44.8% 42.3%
Student performance:
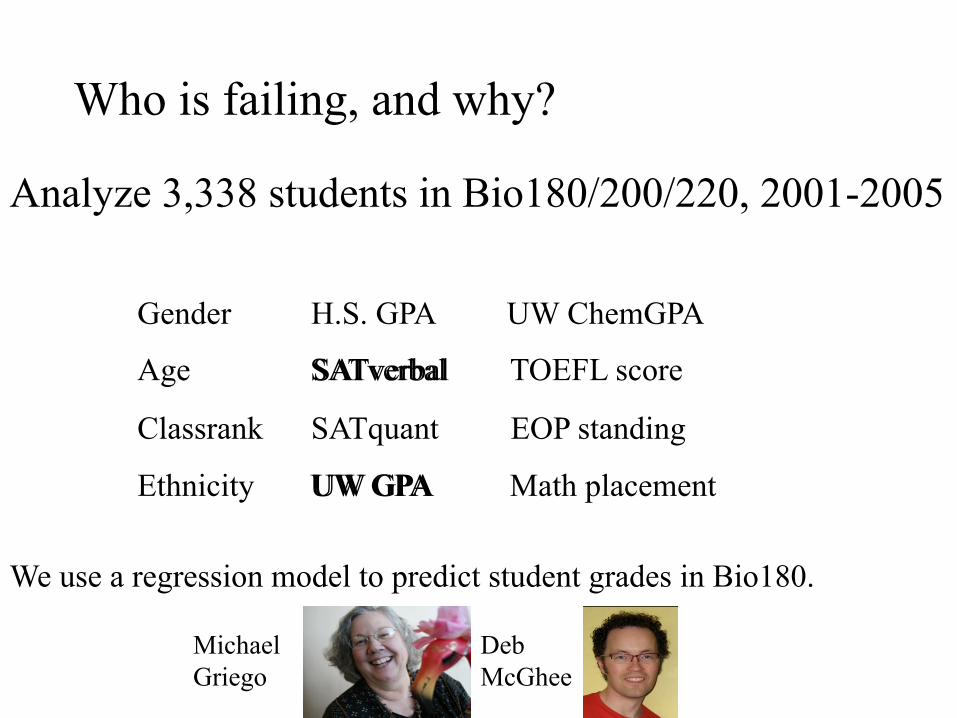
Who is failing, and why?
Analyze 3,338 students in Bio180/200/220, 2001-2005
Gender H.S. GPA UW ChemGPA
Age SATverbal TOEFL score
Classrank SATquant EOP standing
Ethnicity UW GPA Math placement
SATverbal
UW GPA
Michael Griego
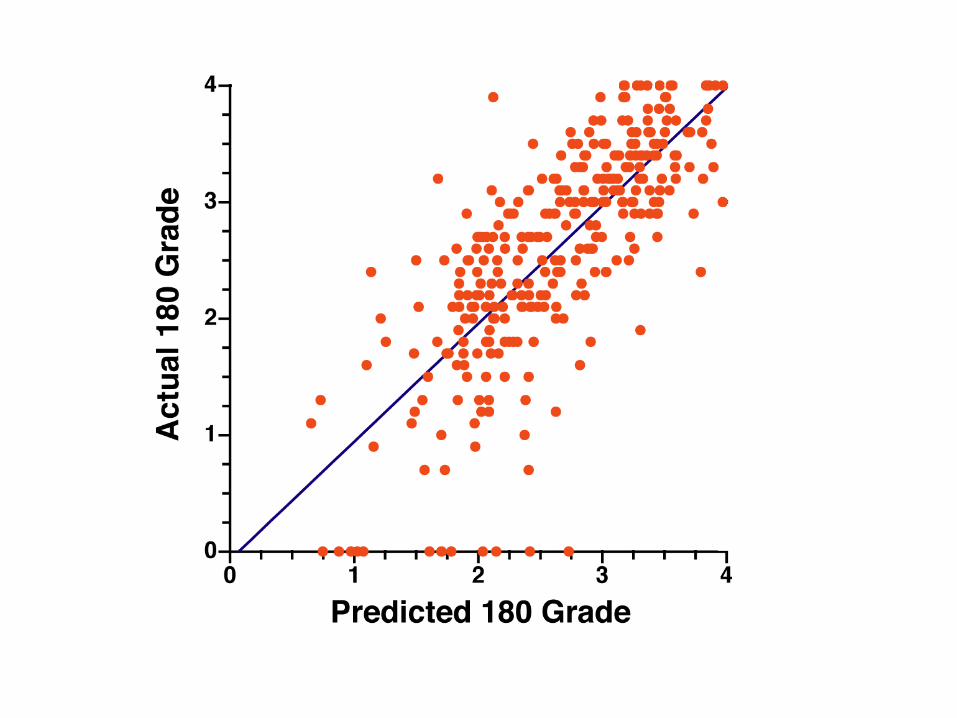
We use a regression model to predict student grades in Bio180.
Deb McGhee
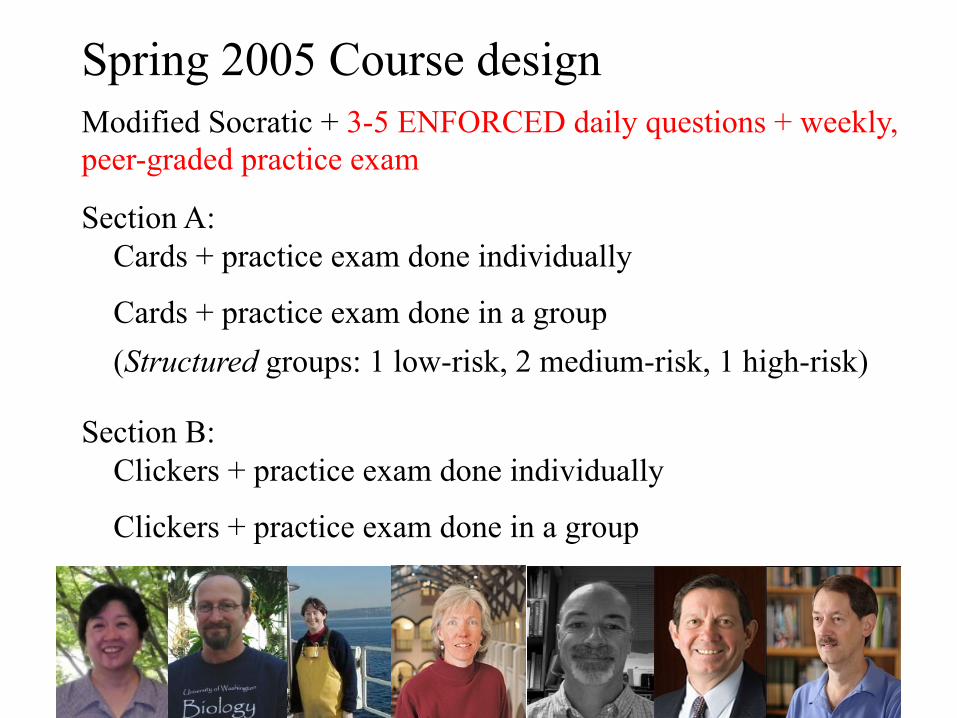
Spring 2005 Course design Modified Socratic + 3-5 ENFORCED daily questions + weekly, peer-graded practice exam
Section A: Cards + practice exam done individually
Cards + practice exam done in a group (Structured groups: 1 low-risk, 2 medium-risk, 1 high-risk)
Section B: Clickers + practice exam done individually
Clickers + practice exam done in a group

Spring 2005 Results
Spr ‘02 Spr ‘03 Spr ‘05
< 1.5 18.2% 15.8% 10.9%
< 2.5 44.8% 42.3% 37.9%
• Total exam points increased by an average of 14
Student performance:
• Median on identical midterm (spring ’03) increased by 7 points

" "
Spring 2003 Midterm 2
0
10
20
30
40
50
60
0 5 10 15 20 25 30 35 40 45 50 55 60 65 70 75 80 85 90 95 100More
Points
Nu
mbe
r
Spring 2005 Midterm 2
0
510
1520
25
3035
4045
50
0 5 10 15 20 25 30 35 40 45 50 55 60 65 70 75 80 85 90 95 100More
Points
Nu
mbe
r
Fall 2005 Course design
Modified Socratic + 3-5 daily clicker questions + weekly practice exam
Section A: Clicker points for right/wrong answers
Section B: Clicker points for participation
Question: How should we grade clicker points?

Fall 2005 Results
Spr ‘02 Spr ‘03 Spr ‘05 Fall ‘05
< 1.5 18.2% 15.8% 10.9% 11.7%
< 2.5 44.8% 42.3% 37.9% 39.3%
Student performance:
Total exam points increased by an average of 12 over Spr ’02, Spr ’03

Fall 2007 Course design
“No lecturing” + ~4 daily clicker questions + weekly practice exam + daily reading quiz + weekly notes check + some random call during class
Half the students did the weekly practice exam online
Half the students did the weekly practice exam in structured groups
Questions:
1. Was failure rate lower because the class was half the size?
2. Will even more structure help high-risk students?
3. Do EOP/URM students benefit most from group or individual practice?

Fall 2007 Results
Spr ‘02 Spr ‘03 Spr ‘05 Fall ‘05 Fall ‘07
< 1.5 18.2% 15.8% 10.9% 11.7% 7.4%
< 2.5 44.8% 42.3% 37.9% 39.3% 33.9%
Student performance:
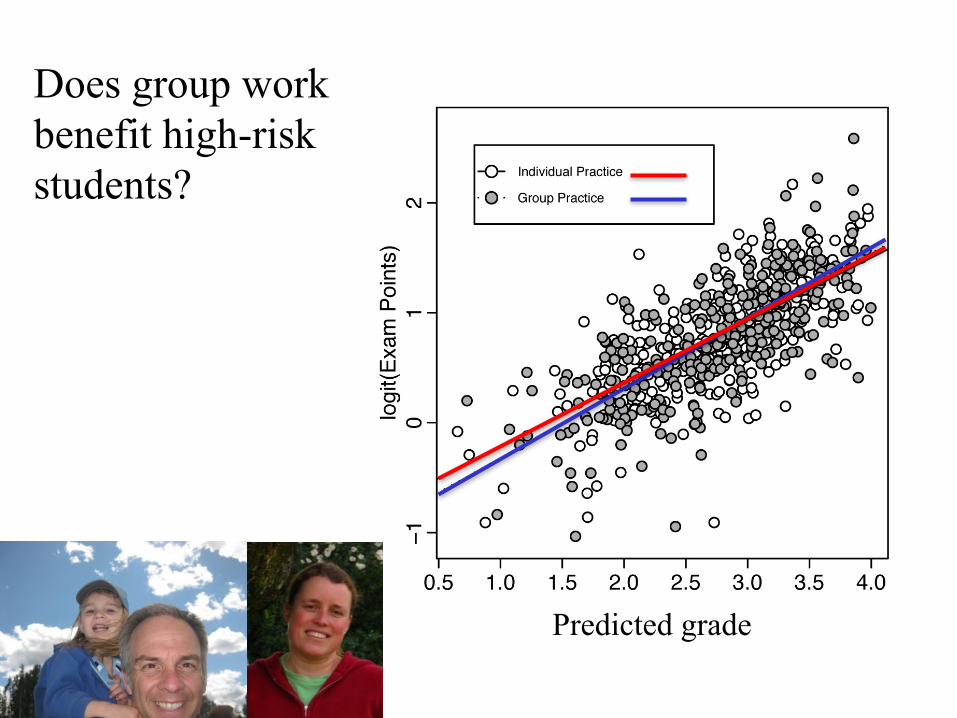
Does group work benefit high-risk students?
Predicted grade

Fall 2009 Course design
No lecturing (at all) + ~4 daily clicker questions + weekly practice exam + daily reading quiz + ~15 random call exercises in class
Questions:
1. Can we implement a highly structured course design in an EXTREMELY large-enrollment course? (700 students)
2. And live to tell the tale?

Low structure Medium structure High structure
Fall 2009 Results Student performance:
Why put a course point on everything? Why “enforce”?
Spr ‘02 Spr ‘03 Spr ‘05 Fall ‘05 Fall ‘07 Fall ‘09
< 1.5 18.2% 15.8% 10.9% 11.7% 7.4% 6.3%
< 2.5 44.8% 42.3% 37.9% 39.3% 33.9% 28.3%

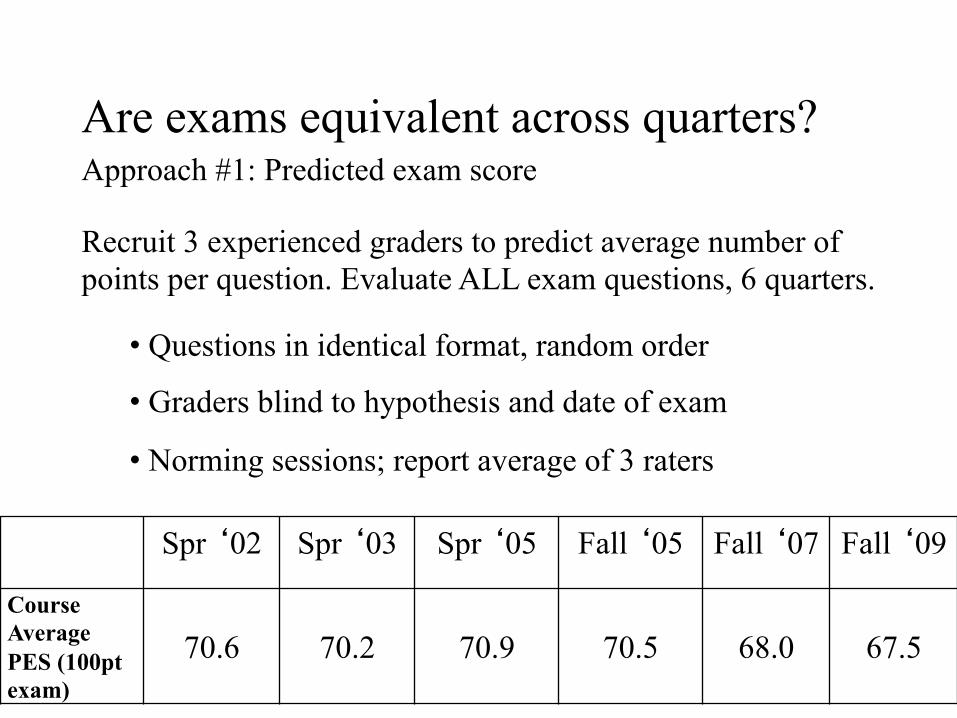
Are exams equivalent across quarters? Approach #1: Predicted exam score
Recruit 3 experienced graders to predict average number of points per question. Evaluate ALL exam questions, 6 quarters.
• Questions in identical format, random order
• Graders blind to hypothesis and date of exam
• Norming sessions; report average of 3 raters
Spr ‘02 Spr ‘03 Spr ‘05 Fall ‘05 Fall ‘07 Fall ‘09
Course Average PES (100pt exam)
70.6
70.2
70.9
70.5
68.0
67.5

Apply: Can I use these ideas in a new situation?
Understand: Can I explain these ideas to someone else?
Remember: Can I recall key terms and ideas?
Analyze: Can I recognize underlying patterns and structure?
Synthesize: Can I put ideas and information together to create something new?
Evaluate: Can I make judgments on the relative value of ideas and information?
Lower order thinking
Higher order thinking
Are exams equivalent across quarters? Approach #2: “Blooming” the exams
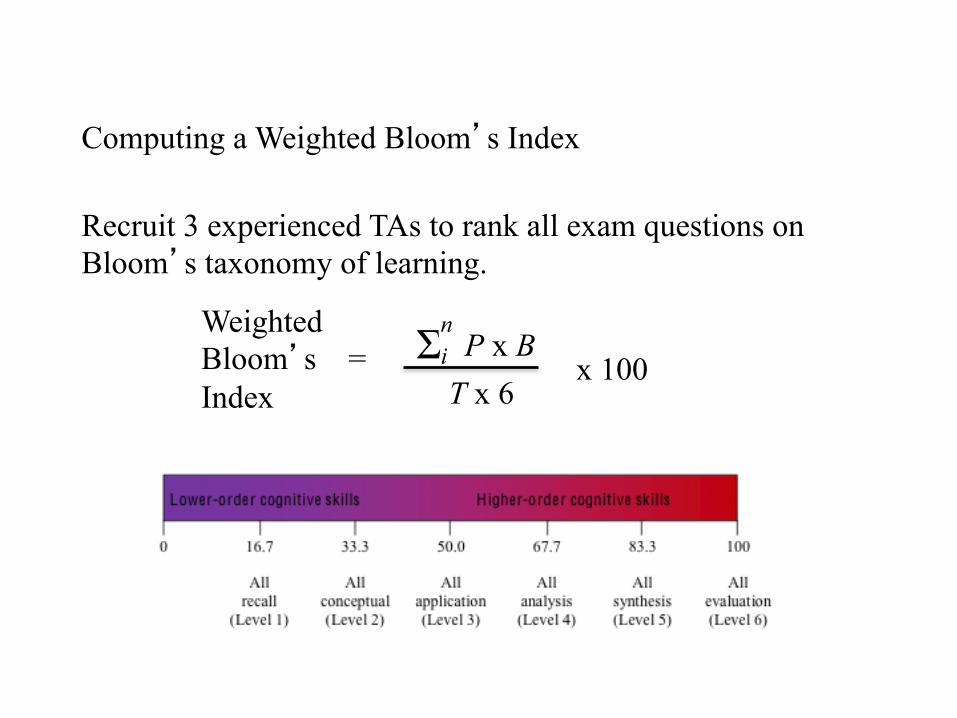
Computing a Weighted Bloom’s Index
Recruit 3 experienced TAs to rank all exam questions on Bloom’s taxonomy of learning.
Weighted Bloom’s = Index
i n Σ P x B T x 6
x 100

Are exams equivalent across quarters?
For Weighted Bloom’s Index:
• Questions in identical format
• Graders blind to hypothesis and date of exam
• Norming sessions, then “decision rules” (following Zheng et al. 2008)
Spr ‘02 Spr ‘03 Spr ‘05 Fall ‘05 Fall ‘07 Fall ‘09
Course Average (weighted Bloom’s index)
45.8
52.1
46.9
52.2
52.1
53.5

64
66
68
70
72
74
76
44 46 48 50 52 54 56 58 60
Pred
icte
d E
xam
Sco
re
(avg
. % c
orre
ct)
Weighted Bloom’s Index

Are students equivalent across quarters?
Spring 2002
Spring 2003
Spring 2005
Autumn 2005
Autumn 2007
Autumn 2009
Predicted grade (mean)
2.46
2.57
2.64
2.67
2.85
2.70
n 327 338 334 328 339 691
Create a general linear model to explain actual grade, based on predicted grade and degree of structure in course.
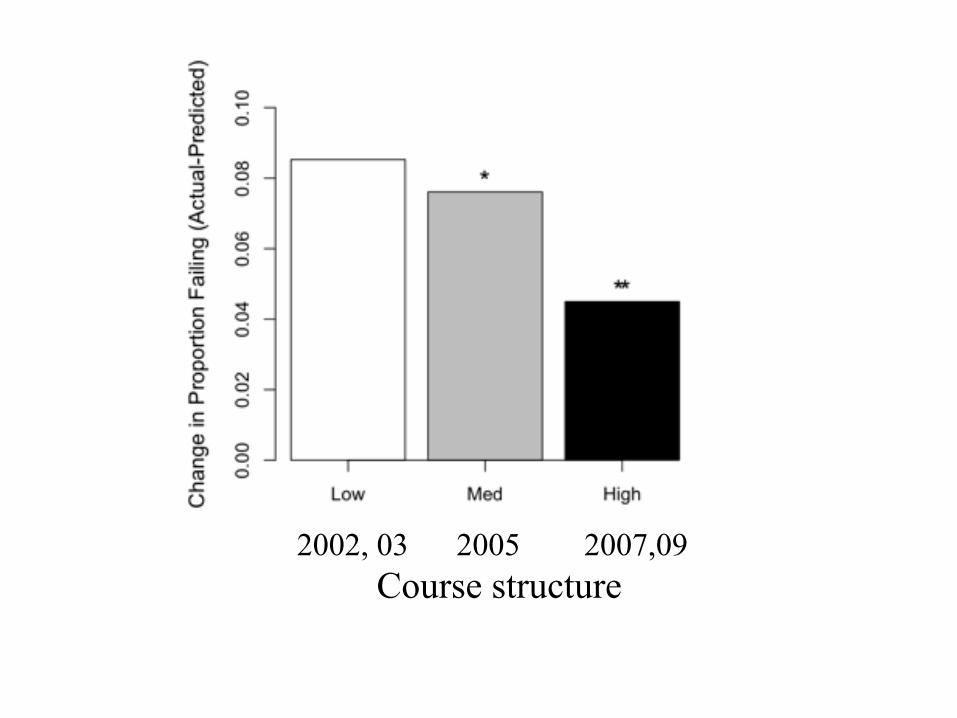
2002, 03 2005 2007,09 Course structure

Last question: Did we reduce the achievement gap? … without spending a lot more money? or maybe even less money?
2003-2008 (Aut/Win/Spr) averages: EOP v non-EOP final grade differences in UW gateway STEM courses

Is there an interaction between degree of course structure and EOP status? (many instructors)
General linear mixed-effects modeling and MMI: Best models include EOP as a fixed effect; likelihood-ratio test, p = 0.0027).

Changes in the EOP vs. non-EOP achievement gap, by quarter (same instructor)
Controlling for changes in student ability/preparation (average predicted grade), there is also a drop in the achievement gap with medium structure.
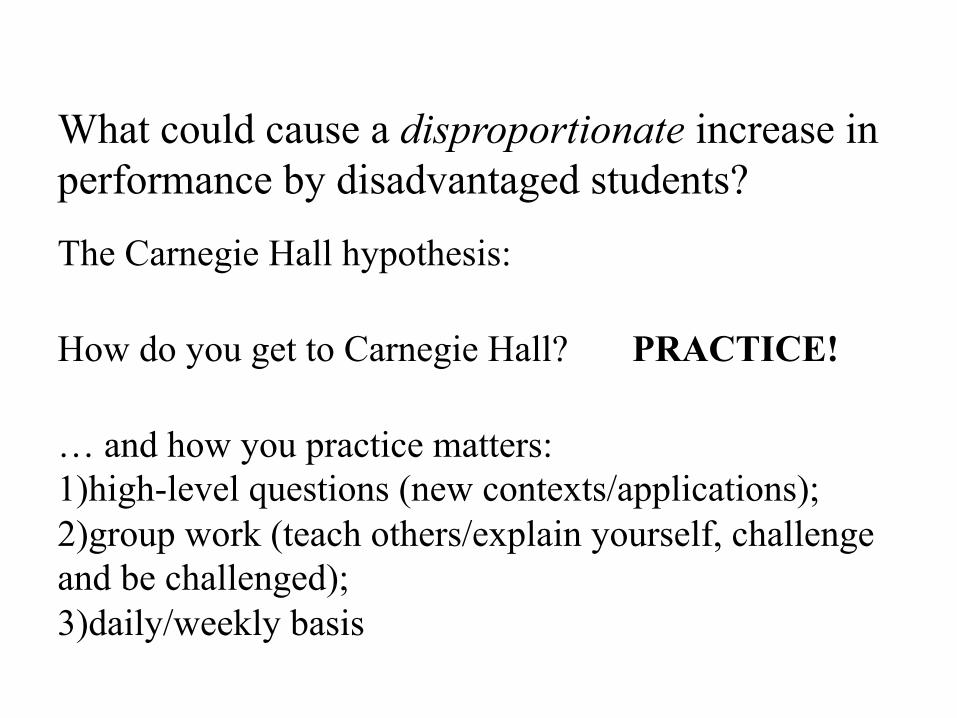
What could cause a disproportionate increase in performance by disadvantaged students?
The Carnegie Hall hypothesis:
How do you get to Carnegie Hall?
… and how you practice matters: 1) high-level questions (new contexts/applications); 2) group work (teach others/explain yourself, challenge and be challenged); 3) daily/weekly basis
PRACTICE!

Current questions
• Faculty development (including future faculty): Moving from evidence to action.
• Curriculum/program assessment: Are students achieving mastery of stated learning objectives?
• Can we promote change from the bottom up?
• Does high structure work elsewhere? Does active learning work across the STEM disciplines?

A clicker question from Autumn 2011: Why aren’t more professors using evidence-based teaching? 1. The data are too new—there hasn’t been time to change. 2. They don’t get rewarded for good teaching. 3. They haven’t received training in these approaches. 4. Students don’t demand it. 5. They don’t have access to the curriculum, needed, and don’t have time to create it themselves.
1st 18.8
9.9
23.3
6.4 41.5
2nd 11.2
5.3
20.8
5.3 57.5

My all-time favorite line from a course evaluation:
“Keep pushing us—we can do it!”