Embed Size (px)
Citation preview

Evidence and a Computational Explanation of Cultural Differences inFacial Expression Recognition
Matthew N. DaileyAsian Institute of Technology
Carrie JoyceUniversity of California, San Diego
Michael J. LyonsRitsumeikan University
Miyuki KamachiKogakuin University
Hanae IshiSendai National College of Technology
Jiro GyobaTohoku University
Garrison W. CottrellUniversity of California, San Diego
Facial expressions are crucial to human social communication, but the extent to which they are innate anduniversal versus learned and culture dependent is a subject of debate. Two studies explored the effect ofculture and learning on facial expression understanding. In Experiment 1, Japanese and U.S. participantsinterpreted facial expressions of emotion. Each group was better than the other at classifying facialexpressions posed by members of the same culture. In Experiment 2, this reciprocal in-group advantagewas reproduced by a neurocomputational model trained in either a Japanese cultural context or anAmerican cultural context. The model demonstrates how each of us, interacting with others in a particularcultural context, learns to recognize a culture-specific facial expression dialect.
Keywords: facial expressions, cross-cultural emotion recognition, computational modeling
The scientific literature on innate versus culture-specific expres-sion of emotion is large and lively. Over a hundred years ago,Darwin (1872/1998) argued for innate production of facial expres-sions based on cross-cultural comparisons. Landis (1924), how-ever, found little agreement between participants. Woodworth(1938) and Schlosberg (1952) found structure in the disagreementin interpretation, proposing a low-dimensional similarity spacecharacterizing affective facial expressions.
Starting in the 1960s, researchers found more support forfacial expressions as innate, universal indicators of particularemotions. Tomkins and colleagues articulated the theory of
basic emotions that could be reliably read from facial expres-sions (Tomkins, 1962–1963; Tomkins & McCarter, 1964).Ekman and colleagues found cross-cultural consistency inforced choice attribution of emotion to carefully posed expres-sions in both literate and preliterate cultures (Ekman, 1972;Ekman et al., 1987; Ekman, Sorensen, & Friesen, 1969).
Today, researchers disagree on the precise degree to which ourinterpretation of facial expressions of emotion is universal versusculture-specific (Ekman, 1994, 1999b; Fridlund, 1994; Izard,1994; Russell, 1994, 1995), but there appears to be consensus thatuniversal factors interact to some extent with culture-specific
Matthew N. Dailey, Computer Science and Information Management,Asian Institute of Technology; Carrie Joyce and Garrison W. Cottrell,Computer Science and Engineering, University of California, San Diego;Michael J. Lyons, College of Image Arts and Sciences, RitsumeikanUniversity; Miyuki Kamachi, Faculty of Informatics, Kogakuin University;Hanae Ishi, Department of Design and Computer Applications, SendaiNational College of Technology; and Jiro Gyoba, Department of Psychol-ogy, Tohoku University.
This research was supported in part by National Institutes of Mental Health(NIMH) Grant MH57075 to GWC, by National Science Foundation (NSF)Science of Learning Center Grant SBE-0542013 to GWC, by Thailand Re-search Fund Grant MRG4780209 to MND, by an Advanced Telecommuni-cations Research Institute International (ATR) contract with the Telecommu-nications Advancement Organization of Japan entitled “Research on Human
Communication,” and a grant by the James S. McDonnell Foundation to thePerceptual Expertise Network, Isabel Gauthier, PI. We are grateful to PaulEkman for providing us with the Pictures of Facial Affect and JACFEE. Wethank Jeffrey Cohn for providing us with the Cohn-Kanade database. We areindebted to Judy Reilly for training the posers in CAFE and FACS-codingtheir facial expressions. We thank Stephen Lindsay, David Matsumoto, VickiBruce, Gary’s Unbelievable Research Unit (GURU), and anonymous review-ers for many helpful comments on previous versions of this article. Nick Butkohelped write our stimulus presentation software, and Matthew Michelsonhelped prepare the CAFE still image stimuli.
Correspondence concerning this article should be addressed to MatthewN. Dailey, Computer Science and Information Management, Asian Insti-tute of Technology, P.O. Box 4, Klong Luang, Pathumthani, 12120 Thai-land. E-mail: [email protected]
Emotion © 2010 American Psychological Association2010, Vol. 10, No. 6, 874–893 1528-3542/10/$12.00 DOI: 10.1037/a0020019
874

learning to produce differences between cultures. A number ofmodern theories (Ekman, 1999a; Russell, 1994; Russell & Bul-lock, 1986; Scherer, 1992) attempt to account for these universalsand culture-specific variations.
Cultural Differences in Facial ExpressionInterpretation
The early cross-cultural studies on facial expression recognitionfocused mainly on the question of universality and the psycho-physiological underpinnings of emotion. Few sought to analyzeand interpret the cultural differences that came up in those studies.However, a steadily increasing number of studies have focused onthe factors underlying cultural differences. These studies eithercompare the facial expression judgments made by participantsfrom different cultures or attempt to find the relevant dimensionsof culture predicting observed cultural differences. Much of theresearch was framed by Ekman’s “neuro-cultural” theory of emo-tion (Ekman, 1972), in which universal motor programs for emo-tional facial expressions might have different elicitors, displayrules, and/or consequences because of culture-specific learning.
Ekman (1972) and Friesen (1972) proposed display rules as oneof the main aspects of emotional facial expression production andinterpretation that vary across cultures. An example would be thatin some cultures, one should not show displeasure in the work-place. Matsumoto and colleagues have found display rule differ-ences among ethnic groups in the United States (Matsumoto, 1993)and are developing methods to assess individual-level display ruledifferences (Matsumoto, Yoo, Hirayama, & Petrova, 2005).
Along with display rules, researchers have also proposed dif-ferent decoding rules as a source of cross-cultural variability infacial expression interpretation (Huang, Tang, Helmeste, Shiori, &Someya, 2001; Matsumoto & Ekman, 1989). For example, mem-bers of some cultural groups might avoid attributing negativeemotions to other people to increase social harmony. Thus far,only limited experimental support for the theory has been found.
Another approach to understanding cultural differences in facialexpression production and interpretation is to correlate observeddifferences with dimensions of cultural variability, such as Hofst-ede’s (1983, 2001) power distance, individualism, masculinity, anduncertainty avoidance, or Matsumoto and colleagues’ status dif-ferentiation (Matsumoto et al., 2002). Several studies have foundthese dimensions diagnostic for explaining differences betweenbroad cultural groups and individuals (Gudykunst & Ting-Toomey, 1988; Matsumoto, 1990; Matsumoto et al., 2002; Matsu-moto, Kudoh, & Takeuchi, 1996; Matsumoto, Takeuchi, An-dayani, Kouznetsova, & Krupp, 1998; Tanako & Osaka, 1999).
One of the confounding factors in studies of emotion acrosscultures is the effect of language. Matsumoto and Ekman (1989)found no effect of label language in Japanese and Americanmultiscalar intensity ratings, but Matsumoto and Assar (1992)found that bilingual Indian students’ emotion judgments weremore accurate with English labels than with corresponding Hindilabels.
Other researchers have explored cross-cultural differences ininterpretations of cultural artifacts depicting faces (Lyons et al.,2000) and the possibility that, rather than identical motor programsfor facial expressions, each culture might develop its own emo-tional dialect containing variations on a universal theme (Elfen-
bein & Ambady, 2002b, 2003b; Elfenbein, Beaupre, Levesque, &Hess, 2007).
Encoder-Decoder Distance
Perhaps the most controversial recent attempt to explain culturalvariability in facial expression production and interpretation is theencoder-decoder distance hypothesis. Elfenbein and Ambady(2002b) performed a meta-analysis of the data on cross-culturalrecognition of emotional expressions across different modalities instudies from 1931–2001. Their main conclusion was that emotionsare generally better recognized when posed and judged by mem-bers of the same culture. Over 168 studies, participants judgingposers from their own culture were an average of 9.3% moreaccurate than judges from other cultures. This apparent in-groupadvantage decreased for cultures with more exposure to eachother, but was generally unaffected by factors like experimentalmethodology and the type of emotional stimuli used. There werealso two interesting situations in which the patterns were reversed.First, in most of the analyzed studies that included minority ethnicgroups within a nation, members of the minority groups tended tohave an out-group advantage when observing emotions in majoritygroup members (minorities were more accurate when judgingemotions posed by the majority group than vice versa). Also, in afew of the analyzed studies (Biehl et al., 1997; Matsumoto &Assar, 1992; Matsumoto & Ekman, 1988), members of imitatedcultures tended to have an out-group advantage when the imitatorswere from different cultures. For example, Americans tended to bemore accurate than Japanese when judging the Japanese posers inthe Japanese and Caucasian Facial Expressions of Emotion(JACFEE) data set (Matsumoto & Ekman, 1988), in which bothJapanese and Caucasian posers precisely imitate the same proto-typical expressions posed according to Facial Action Coding Sys-tem (FACS) standards defined by Americans.
According to Elfenbein and Ambady, display rule and decodingrule theories, which hold that cultural differences in facial expres-sion interpretation arise from differing levels of appropriateness ofparticular expressions and appraisals in particular situations, can-not by themselves explain the in-group advantage. In a dynamictwo-way interaction, matched display and decoding rules couldcertainly lead to more effective communication. However, in ex-periments with static emotional stimuli, judges do not have thisopportunity. Instead, when a judge is asked to interpret the sameexpression by posers from different cultures, under display ruleand decoding rule accounts, the effect of judge culture should bethe same across all poser cultures. The fact that in-group advan-tages arise even when stimuli are prerecorded independent of therater’s identity and even in studies with balanced designs, in whichraters from two or more cultures each judge stimuli from theother’s culture, indicates that the groups are either processingexpressions from different cultures differently or are applyingdifferent criteria when judging them. That this apparent affinitybetween poser and judge seems to be an important factor under-lying emotional expression interpretation led Elfenbein and Am-bady to postulate that in general, recognition accuracy decreaseswith physical or cultural distance between the encoder and decoder.Supporting this theory, another study (Elfenbein & Ambady, 2003a)found that cultural distance between poser and encoder was a betterpredictor of emotion recognition discrepancies than a static view of
875CULTURAL DIFFERENCES IN FACIAL EXPRESSION

Hofstede’s dimensions of cultural variability (Hofstede, 1983, 2001).The critical factor could be that judges learn the subtleties of theirin-group’s expressive style, or the equivalent of the “other-race effect”observed in face recognition (O’Toole, Deffenbacher, Valentin, &Abdi, 1994), except that the cue for the in-group advantage might bethe subtleties of the expressions themselves, rather than race.
Matsumoto (2002) criticizes Elfenbein and Ambady’s conclu-sions on several grounds. First, many of the studies in the meta-analysis used unbalanced stimulus sets, and that makes it difficultto draw any conclusions from the results. An advantage on anunbalanced data set could simply reflect better overall decoding ofemotional signals rather than a better understanding of the posergroup’s emotional communication. Second, even when the studieshad balanced stimulus sets, the stimuli were usually not con-structed to have equivalent emotion-signaling properties. If theemotions signaling properties of the two stimulus sets are notequivalent, then the experimenter cannot determine the relativecontribution of the poser’s culture and the differences in thesignals. In the case of facial expressions of emotion, if a data setcontains facial expressions from two cultures but the actual set ofmuscle movements associated with the emotion categories aredifferent, any differences in interpretation between the two cul-tures could be the result of different decoding by different cultures,or the result of the differences in the stimuli themselves. Matsu-moto therefore recommends normalizing stimuli so that the phys-ical properties of the stimuli related to emotion are exactly equal,and only the cultural identification signal is different. Third, signalclarity was not controlled. Clarity can be affected by the intensity ofan emotional expression, by adding noise, or decreasing presentationtime. Matsumoto claims that as clarity decreases, accuracy also de-creases, so that individual differences, correlated with personalitytraits, tend to emerge. He concludes that clear stimuli should not begrouped with unclear stimuli when estimating effect sizes.
To date, the only cross-cultural stimulus set meeting Matsumo-to’s validity criteria is the Japanese and Caucasian Facial Expres-sions of Emotion (JACFEE), a set of facial expression stimuliincluding reliably recognized expressions of happiness, sadness,fear, anger, surprise, disgust, and contempt posed by both Japaneseand Caucasian models (Matsumoto & Ekman, 1988). The JACFEEcontains 56 photographs: eight examples of each of the sevenemotion categories portrayed by 56 different posers. The eightexamples of each emotional expression were coded using theFacial Action Coding System (FACS; Ekman & Friesen, 1978) toensure that every expression involved the exact same set of musclecontractions at the same level of intensity. The data set is alsobalanced so that half of the posers are Caucasian and half Japaneseand so that half of the posers are men and half are women. Matsumoto(2002) cites experiments, using JACFEE, in which no in-group ad-vantage was found, as evidence that in-group advantages in otherexperiments are merely artifacts of flawed experimental methods.
Elfenbein and Ambady (2002b), in reply, offer an alternative setof criteria for establishing an in-group advantage. First, evidencefor an in-group advantage is strongest when it is found in balancedstudies. Second, emotional stimuli should be created inside thecultural context with posers from the culture and preferably withexperimenters from the same culture. Third, emotional stimulishould be elicited from the participants rather than instructed orimitated based on “preselected theoretical models.” The authorsargue that signal equivalence (Matsumoto’s second criterion for
establishing an in-group advantage) is actually a culture eraser,eliminating any possibility of finding and understanding culturaldifferences in interpretation of emotional expressions.
Understanding Cultural Differences ThroughComputational Modeling
We approach the problem of understanding cultural differencesboth through traditional human studies, in which participants fromdifferent cultures are asked to interpret facial expression stimuli foremotional content, and through computational modeling studies, inwhich hypotheses about the mechanisms underlying observed humanbehavioral patterns are tested by manipulating a computational model.Consider a situation in which one person seeks to further understandanother by observing his or her facial expressions and inferring anunderlying emotion. If we assume a set of n discrete, mutuallyexclusive, and exhaustive emotions C ! !c1, c2, . . . , cn", we canformalize the observer’s task as a Bayesian a posteriori estimationproblem: at each point in time t, given an observation (facial image)xt, estimate the posterior probabilities P#ci!xt$, the probability of eachcategory given a face. Using Bayes’ rule, these estimates can becomputed based on the product of two quantities, the likelihoodsand the priors. The likelihood P# xt!ci$ is the probability of seeinga particular facial expression given the emotion being expressed.This is sometimes called the “appearance model”—a probabilisticdescription of how each emotional expression is expected to ap-pear. The prior P#ci$ is the probability of a particular emotionbeing expressed, that is, the frequency of an emotion in a particularcultural context. We assume that our observer learns the likelihoodgradually, over the course of a lifetime, but that the priors are moredynamic, with a baseline depending on past experience and mod-ulation according to the current context. Computing the probabilityof each category given the input this way is called Bayesianinference, which is optimal in the sense that an observer choosingthe highest probability category is least likely to make an error injudgment.
There is solid evidence linking perception and decision makingwith Bayes-optimal inference, particularly in psychophysics.Bayesian models have long been used for functional descriptionsof perceptual performance (see, e.g., Knill & Richards, 1996, foran overview). More recently, theoretical and experimental work onpopulation coding has provided detailed accounts of how proba-bility distributions can be represented and posterior probabilitycalculations can be performed in the nervous system (Ma, Beck,Latham, & Pouget, 2006).
We implement this model through a simple neural network(Figure 1) called EMPATH (Dailey, Cottrell, Padgett, & Adolphs,2002) that is trained to categorize facial expressions from photo-graphs into the six basic emotions. The network starts with imagesand processes them in a neutrally plausible way, using a model ofthe receptive fields of neurons in primary visual cortex, followedby a network that looks for correlations between these neuraloutputs, forming a more compact representation that encodes facialexpression and shape. This is followed by a simple nonlinearperceptron, trained to activate one of six different outputs corre-sponding to the six basic emotions. If none of the outputs aresufficiently activated (as explained below), then the face is clas-sified as neutral. Through (supervised) training on many examples
876 DAILEY ET AL.

pairing facial images with emotion labels, this network changes itsconnection strengths to produce the correct output for each input.
In Bayesian terms, with the correct training rules, the model willdirectly estimate P#ci!xt$ (Bishop, 1995). That is, the activationlevel of the six output units will converge on these probabilities.Treating the model as a Bayesian probability estimator leads toclear correspondences in the model for encoder-decoder distance,decoding rules, and display rules.
First, we can model encoder-decoder distance by manipulatingthe level of exposure of the model to the facial expressions ofdifferent cultures during training. Because the model’s appearancemodel P#ci!xt$ depends entirely on the model’s “experience,” thatis, what images it is trained upon, if the model is trained primarilyon natural Japanese expressions, its classifications will depend onthe appearance of the Japanese facial expressions, which in turnare determined to some extent by the cultural variation in Japaneseexpressions. If the model is then asked to classify prototypicalAmerican expressions, it will respond to these based upon itsexperience, just as we imagine Japanese subjects do. A modeltrained primarily on Japanese-style facial expressions will have ahigh distance to American encoders, and vice versa. Because wehave complete control over the model’s training environment, wecan fit the training environment to the data by varying the per-centage of different culture-specific datasets.
Second, we can model the way decoding rules within a cultureaffect facial expression interpretation as modulating the priors oneapplies in different situations. For example, in a hierarchical cul-ture, it might be very rare for negative emotions to be expressed toa superior, in turn making an observer less likely to interpret agiven expression as a negative emotion. This type of influence isstraightforward to model as a multiplicative factor on the net-work’s outputs:
Pcult%context#ci!xt$ ! Ptraining#ci!xt$"Pcult%context#ci$
Ptraining#ci$# (1)
The first factor on the right-hand side of the equation is what thenetwork computes and represents what a person has learned overa lifetime, while the factor in braces, which corresponds to adjust-ments due to the social situation, can be fit to data. For example,in a situation where a superior is interacting with a subordinate,
this factor could be low for negative expressions from the subor-dinate and correspondingly higher for the positive categories. Wedo not attempt to manipulate cultural context during an experi-ment, so we can make the simplifying assumption that theseadjustments are constant over the experiment for participants froma particular culture, leading to an overall cultural bias in interpret-ing facial expressions in the experiment. Thus, even though themodel is simply a network trained to categorize facial expressions,we can use it to model the way decoding rules in a particularculture manifest during an experiment.
Third, we can model the effects of display rules within a cultureby manipulating the frequency with which the model is exposed toparticular categories of facial expressions. For example, in a cul-ture that discourages the display of negative emotions, we mightexpect that observers would see expressions of those emotions lessfrequently than expressions of positive emotions and would there-fore be less accurate at classifying those expressions. To modelthis phenomenon, we could decrease the ratio of negative expres-sions to positive expressions in the model’s training set. Theresulting model, after training, would very likely be less accurateat classifying negative expressions than positive expressions.
Finally, although we do not pursue it in this article, we can modelthe effects of language by using multiple, overlapping labels asoutputs, based on, for example, a label elicitation study. In this case,the network’s interpretation as a Bayesian classifier is more complex,because of the allowance for multiple, nonmutually exclusive labels(the output activations no longer need to sum to one—rather, eachoutput would correspond to the probability that that particular labelcould be applied to the input image). This extends the reach of themodel, from one limited to the six basic emotions, to one that is moreable to capture mixtures of multiple emotions. In any case, we leavethis observation for future work, and concentrate here on the sixemotions most widely studied in the literature.
In this article, we test the validity of EMPATH as a model forhuman interpretation of facial expressions, and we explore how wellthe aforementioned manipulations model the effects of culture onfacial expression interpretation. To test the validity of the model, wefirst run an experiment that explicitly tests for in-group advantage, andthen we use the data to test the model’s explanation.
Experiments
Toward a further understanding of cultural differences in facialexpression interpretation, we set out to answer two open questionsin the debate on cross-cultural interpretation of facial expressions:
• To date, all of the balanced human studies comparing westernand east Asian participants’ interpretation of emotional facialexpressions have obtained out-group effects, in which westernersare better able to interpret Asian emotional faces than are Asians.Does the lack of in-group effects in western and Asian interpre-tation of facial expressions falsify the encoder-decoder distancehypothesis for facial expressions?
• Thus far, the models that have been proposed to explaincross-cultural differences in facial expression interpretation havebeen abstract and interpretive rather than computational and pre-dictive. Is it possible to explain cultural differences in facialexpression interpretation in terms of a simple neurocomputationalmodel such as that described in Figure 1?
Figure 1. EMPATH schematic.
877CULTURAL DIFFERENCES IN FACIAL EXPRESSION

To answer these questions, we performed two experiments: ahuman study using a new cross-cultural emotional expression stimu-lus set, and a computational modeling study exploring the interactionof universal emotional expressions with cultural learning.
In Experiment 1, we had participants in Japan and the UnitedStates rate the intensity of happiness, sadness, fear, anger, surprise,and disgust in a balanced set of emotional expressions meetingElfenbein and Ambady’s (2002b) criteria for establishing in-groupadvantages, for comparison with the results previously obtained byMatsumoto and others using the JACFEE. The data set containsJapanese and Caucasian women posing facial expressions of hap-piness, sadness, anger, surprise, and disgust. To contrast judges’interpretations of imitated American expressions versus expressionselicited in the poser’s cultural context, we included both Japanesestimuli from the JACFEE, in which Japanese posers imitated Amer-ican expressions, and Japanese stimuli that were freely elicited byJapanese experimenters in Japan. The results of the human studyexhibit a reciprocal in-group advantage for Japanese and Americanparticipants, as predicted by the encoder-decoder distance hypothesis.They thus support the view of the previously discussed signal equiv-alence requirement as a culture eraser.
In Experiment 2, we used the Bayesian model proposed aboveas embodied by EMPATH (Dailey et al., 2002) to explore possiblecomputational explanations of the results of Experiment 1. Wetrained multiple EMPATH models to recognize facial expressionsin a variety of different cultural contexts, then tested each modelon the stimulus set created for Experiment 1. By “different culturalcontexts” we mean different sets of facial expression images withdifferent mixes of Japanese and American facial expressions. Wefound that models trained in a primarily Japanese cultural contextbest reproduced the Japanese participants’ pattern of responses,and that models trained in a primarily American cultural contextbest reproduced the American participants’ pattern of responses.These results thus support the hypothesis that our interpretation offacial expressions depends on the interaction of a learning processthat slowly tunes our estimates of class-conditional densities and asecond process that adapts to the cultural decoding rules viadifferent priors on emotion categories. The model provides astraightforward computational account of cultural differences inemotional expression recognition: they emerge naturally as a con-sequence of learning to interpret others’ expressions in a specificcultural context.
Experiment 1: Human Interpretation of FacialExpressions
In Experiment 1, we collected intensity ratings and forced-choice emotion classifications on Japanese and Caucasian femalefacial expressions.
Participants
U.S. participants. Fifty students (25 women and 25 men) at theUniversity of California, San Diego, who had not grown up in Asiaparticipated in the study. Their ages ranged from 18 to 26 (mean 20).Eighteen described themselves as East Asian but not Japanese, 17 asCaucasian, 3 as Japanese, 2 as Indian, 2 as Middle Eastern, and 3as other or mixed. Forty-seven described the culture they grew up inas North American, 2 as Eastern European, and 1 as Middle Eastern.
At the end of the experiment, the U.S. participants were given abrief questionnaire aimed at determining their exposure to Asianculture. The distribution of responses was as shown in Table 1.Reflecting the diversity of southern California, the U.S. partici-pants’ responses indicate a moderately high degree of familiaritywith Asian culture.
Japanese participants. 50 Japanese students (25 women and25 men) from Tohoku University participated in the study. Theirages ranged from 19 to 27 years (mean & 21.1). All were nativesof Japan, and all spoke Japanese as their primary language.
These participants answered a demographic questionnaire asshown in Table 2.
Overall, these responses indicate a high degree of exposure towesterners via popular culture, but little social interaction.
The multicultural diversity of the U.S. sample compared withthe relative homogeneity of the Japanese sample might be seen asa confounding factor in the experiment. However, our aim is tocompare how members of two different cultures interpret facialexpressions. All of the Asian Americans included in the U.S.sample spent their youth in North America. Although they mayhave assimilated American culture to varying degrees, regardlessof their genetic makeup, they share a similar cultural experiencewith our other U.S. participants, through school, social activity,popular culture, and so on. Furthermore, finding, say, a matchedsample of Caucasian judges with little previous direct interactionwith Asians would be nearly impossible in southern California,
Table 1U.S. Participants’ Prior Exposure to Asian Culture in Experiment 1
Question Distribution of answers
Your primary language English (33) Non-English European (2) Other (5) East Asian but not Japanese (10)How many East Asian movies you see
each month None (28) Between 1 and 2 (17) Between 3 and 5 (2) 6 or more (3)How many East Asian families were in
your childhood neighborhood None (11) A few (21) Several (18)How many East Asians are in your
current neighborhood None (0) A few (16) Several (34)Level of fluency in an Asian language Not at all (23) A little (10) Quite a bit (10) Fluent (7)a
Frequency of trips to Asia Never (38) One holiday or business trip (5) Several (6) Frequent (1)Amount of time spent living abroad Never (38) 1–3 months (5) 4–6 months (1) More than a year (6)
a Six participants who selected “East Asian but not Japanese” as their primary language rated their fluency in an Asian language as “Quite a bit” (4) or“A little” (2).
878 DAILEY ET AL.
and even if it were possible, the group would not be representativeof the culture. For these reasons, the only restriction we placed onour ethnically Asian subjects was that they should have grown upin North America.
Method
Face stimuli. Experiment 1’s intent was to compare U.S. andJapanese responses to emotional facial expressions and test thehypothesis that cultural differences in facial expression interpre-tation emerge when the expressions are freely elicited in theposer’s own cultural context. For these purposes, we collectedfacial expression stimuli from the following sources:
1. JACFEE: Matsumoto and Ekman’s Japanese and CaucasianFacial Expressions of Emotion and Neutral Faces (1988)data set contains 112 photographs. Fifty-six are photos ofposers portraying emotional expressions. Each of the 56posers is a different individual. The remaining 56 photos areof the same 56 individuals portraying a neutral expression.The 56 emotional stimuli include 2 Japanese women, 2Japanese men, 2 Caucasian women, and 2 Caucasian menfor each of the 7 emotions happiness, sadness, fear, anger,surprised, disgust, and contempt. For a given emotionalexpression, every one of the eight photos has been FACScoded to ensure that they meet Ekman, Friesen, and Hager’s(2002) criteria for prototypical expressions of basic emo-tions and to ensure that for every image of the same facialexpression, every poser is using exactly the same facialactions. Because the JACFEE stimuli were screened forfacial expression criteria created by Americans in the UnitedStates, we call them “American” expressions regardless ofwhether the poser is Japanese or Caucasian.
2. The California Facial Expression database (CAFE):CAFE is a data set created at University of California,San Diego.1 CAFE is comprised of posers from southernCalifornia portraying happiness, sadness, fear, anger, sur-prise, and disgust, as well as neutral expressions. CAFEposers were first trained by a FACS expert in a shortgroup session to portray each emotion. Then each posersat for an individual photo session in which we askedthem to portray each emotion in turn. Finally, the expertcoded each photograph and screened out the faces notmeeting FACS criteria for the emotion in question. Be-cause the CAFE stimuli were screened against the same
criteria as the JACFEE stimuli, we also call them “Amer-ican” expressions. However, note that whereas allJACFEE stimuli for a particular emotion involve exactlythe same facial actions, the CAFE posers were allowed toportray an emotion however they pleased, so long as theexpression met the FACS expert’s criteria. This meansthere is more variability across the examples of a partic-ular emotion in CAFE than there is in JACFEE.
3. The Japanese Female Facial Expressions (JAFFE) dataset: The JAFFE (Lyons, Akamatsu, Kamachi, & Gyoba,1998) data set contains 217 photos of 10 Japanese femalemodels posing expressions of happiness, sadness, fear,anger, surprise, disgust, and neutrality.2 The expressionswere posed without instruction by Japanese participantsin Japan, and they were not screened against any stan-dards for emotional facial expressions. We therefore callthe JAFFE expressions “Japanese” expressions. Al-though the JAFFE stimuli are not screened against anyemotional expression criteria, note that we did select thespecific subset of JAFFE for Experiment 1 according toan intensity criterion described below.
From these three sources, we built the face data set for Exper-iment 1. The stimuli consisted of 28 Japanese female and 28Caucasian female posers portraying either a single emotional ex-pression or remaining neutral. The Caucasian posers consisted ofthe 14 Caucasian women in JACFEE (Matsumoto & Ekman, 1988)and 14 randomly chosen Caucasian women from CAFE. TheJapanese stimuli consisted of the 14 Japanese women in JACFEE,the 10 Japanese women in JAFFE portraying sad, afraid, angry,surprised, and disgusted expressions, as well as 4 additional Jap-anese female posers portraying happy and neutral expressions. Thepublished JAFFE dataset only contains 10 posers, but during theJAFFE photo sessions, Lyons et al. (1998) also acquired photos of4 additional posers portraying a subset of the expressions. Wesupplemented the 10 photos selected from JAFFE with neutral andhappy expressions from these four posers. We selected the JAFFEstimuli that were rated most intense by Japanese participants in aseparate pilot study (not reported here), subject to the constraintthat each poser could only appear once in the data set. Figure 2
1 See http://www.cse.ucsd.edu/'gary for details on obtaining CAFE.2 See http://www.kasrl.org/jaffe.html for details on obtaining JAFFE.
Table 2Japanese Participants’ Prior Exposure to Western Culture in Experiment 1
Question Distribution of answers
Number of western movies you see per month None (12) 1–2 per month (33) 3–5 per month (5) 6 or more (0)How many western families were in your
childhood neighborhood None (39) A few (11) Several (0)How many western families are in your current
neighborhood None (37) A few (13) Several (0)How well you speak English Not at all (3) A little (45) Quite a bit (2) Fluent (0)How often have you traveled overseas Never (36) One trip (10) A few times (4) Several (0)How much time have you spent living overseas Never (45) 1–3 months (4) 4–6 months (0) More than a year (1)
879CULTURAL DIFFERENCES IN FACIAL EXPRESSION

shows the CAFE and JAFFE stimuli used for the experiment (theJACFEE stimuli cannot be reprinted because of copyright restric-tions).
In anticipation of presenting the same face stimuli to humansand our computational model, we preprocessed all faces accordingto the requirements of the model. In each face, three points weremanually located: the center of the pupil of each eye (the eyes aredirected at the camera for all of the stimuli in our dataset) and themidpoint of the bottom of the poser’s top row of teeth. In faceswithout exposed teeth, the location of this point was estimated.3
Each image was then rotated to make the eyes level, linearly scaledin the horizontal direction so that the eyes were 128 pixels apart,then linearly scaled in the vertical direction so that the mouth andeyes were 136 pixels apart. The resulting image was then croppedto a size of 240 ( 292, with the left eye at row 88, column 56.Finally, the pixel values in each cropped image were then linearlytransformed to a mean of 140 and a SD of 40.
Procedure. After a brief explanation of the experiment by anexperimenter, the 56 stimuli were presented twice, in two blocks.In the first block, participants performed an intensity rating pro-cedure in which the 56 facial expression stimuli were presentedindividually in random order on a computer screen. The partici-pants were instructed to rate the intensity of happiness, sadness,fear, surprise, anger, and disgust conveyed by each image on a 1–5scale using the mouse, with 5 being a “very strong display” and 1being “none at all.” For the Japanese version of the experiment, weused the emotion labels Koufuku, Kanashimi, Osore, Odoroki,Ikari, and Ken’o, respectively.5 The order in which the emotionrating buttons were displayed in the graphical user interface wasrandomized for each participant but remained constant throughoutthe experiment. Participants were allowed to examine the face aslong as they desired, and once they had rated the intensity of all sixemotions, could then press a graphical button to advance to thenext face.
In the second block, the 56 stimuli were again presented in adifferent random order, and the participants’ task was a 7-wayforced choice decision for each stimulus. The forced-choice blockfollowed the intensity rating procedure to prevent the participantsfrom thinking of the stimuli as portraying one and only oneemotion during the intensity rating procedure.
At the end of the experiment, participants answered the ques-tions in the demographic questionnaires as previously describedand listed in Tables 1 and 2.
Pilot Study
The Experiment 1 stimuli were balanced for poser race, posedexpression, and judge culture, but we were concerned about thefact that 75% of the stimuli (the American-style expressions) wereselected by a FACS criterion whereas the remaining 25% (theJapanese-style expressions) were selected by an in-group maxi-mum rated intensity criterion. To determine whether this imbal-ance might bias our participants’ responses, we performed a pilotstudy in which one group, “Group 1,” (20 U.S. and 20 Japaneseparticipants) rated all 56 of the stimuli in the design just described,and another group, “Group 2” (another 20 U.S. and 20 Japaneseparticipants), rated a 28-stimulus subset of the data. The stimuli forGroup 2 were the 14 JACFEE Caucasian stimuli and the 14 JAFFEJapanese stimuli from the full data set. With this change, Group 2’sstimuli were balanced for poser race, posed expression, and judgeculture, as well as expression style.
Other than the change in the stimulus set for Group 2, thepilot study’s procedure was identical to that previously de-scribed for Experiment 1. We subjected the pilot participants’intensity ratings for the 28 stimuli in common for the twogroups to a five-way analysis of variance with the followingindependent variables:
3 The bottom of the nose is another possible third landmark that is easierto localize, but we find that the top row of teeth gives slightly better results.
4 The JACFEE images not shown are E35, E36, E43, E44, E27, E28, E4,E3, E51, E52, E19, E20, N18, N21, E39, E40, E47, E48, E31, E32, E7, E8,E55, E56, E23, E24, N45, and N53.
5 These are the same labels used by Lyons, Akamatsu, Kamachi, andGyoba (1998). Although most researchers do not publish the specific labelsthey use, ours are identical to those of Matsumoto (2005) except that heuses the label Yorokobi (a slightly more transient state of happiness) ratherthan Koufuku.
Figure 2. Stimuli for Experiment 1. (a) Images from California Facial Expression database (CAFE). (b) Imagesare from Japanese Female Facial Expressions (JAFFE). Not shown are 28 images from Japanese and CaucasianFacial Expressions of Emotion (JACFEE), which cannot be reprinted because of copyright restrictions.4
880 DAILEY ET AL.

1. Judge culture (Japanese, American).
2. Judge group (Group 1 with 56 Stimuli or Group 2 with 28stimuli).
3. Dataset (JACFEE vs. JAFFE).
4. Posed expression (happy, sad, Afraid, Angry, Surprised,Disgusted, neutral).
5. Rated emotion (happy, sad, Afraid, Angry, Surprised,disgusted).
We predicted no marginal effects or interactions due to theGroup variable, and we indeed found no significant effects. Wefollowed up on the null results with an analysis to ensure thatthe experiment was sufficiently powerful and that the confi-dence intervals on )2 using Fleishman’s (1980) method in-cluded )2 & 0. We concluded that the unbalanced ratio ofAmerican-style (FACS-selected) stimuli to Japanese-style(maximum intensity-selected) stimuli in Experiment 1 was un-likely to affect our participants’ responses, and continued withthe experiment as described. The 40 Group 1 pilot participants’data were analyzed with an additional 60 subjects in the Ex-periment 1 analyses described in the rest of this section.
Predictions
Based on previous studies with JACFEE, we could make somegeneral predictions for the main experiment. In the intensity ratingblock, we expected a Culture ( Posed ( Rated interaction (Jap-anese and U.S. participants should attribute different levels ofintensity to some of the stimuli), and in the forced-choice ratingblock, we expected a Culture ( Posed interaction (Japanese andU.S. participants should be more or less accurate on some posedexpressions).
For the forced-choice block in particular, theories make morespecific predictions regarding the effect of the Dataset variable.According to Elfenbein and Ambady’s (2002a, 2002b) concept ofin-group advantages, Japanese participants should be more accu-rate than U.S. participants at judging the expressions of Japaneseposers posing Japanese expressions, and similarly, U.S. partici-pants should be more accurate than Japanese participants at judg-ing the expressions of American posers. However, previous bal-anced cross-cultural studies of Japanese and Americaninterpretations of emotional facial expressions (Biehl et al., 1997;Matsumoto, 1992) have failed to find any such pattern. Oneexplanation lies in these studies’ use of JACFEE. As previouslydiscussed, JACFEE was specifically designed to eliminate anycultural differences in the emotion signal by ensuring that everystimulus for a given emotion category, regardless of poser culture,contains the exact same set of facial actions. Under the criterion ofElfenbein and Ambady, that in-group stimuli should be elicitedwithin the poser’s own culture, the Japanese faces in JACFEEshould not be treated as in-group stimuli for the Japanese judges.If a reciprocal in-group advantage does exist for Japanese and U.S.judges, it should manifest when the JAFFE posers (not theJACFEE Japanese posers) are treated as in-group members forJapanese judges.
Matsumoto explains cultural differences in facial expressioninterpretation in terms of three factors: display rules, decodingability, and signal clarity. He does not rule out the possibility ofin-group advantages in recognition, but suggests that they areunlikely when the emotion signal is clear, as in the JACFEE dataset, and that they may be more prevalent when the emotion signalis less clear without being completely ambiguous, when judges“may rely on cues or processes that are idiosyncratic to theircultural group” (Matsumoto, 2002, p. 241). Under Matsumoto’stheory, any evidence of in-group advantage (a poser culture (judge culture interaction) would be small compared to the maineffects of poser culture and judge culture and would be driven bystimuli with relatively weak clarity.
Results
Intensity rating results. We subjected the participants’ inten-sity ratings for the 56 stimuli to a 4-way analysis of variance withrated intensity as the dependent variable and the following predic-tor variables:
1. Judge Culture (Japanese, American)
2. Dataset (JAFFE, JACFEE Japanese, JACFEE Caucasian,CAFE)
3. Posed Expression (happy, sad, Afraid, Angry, Surprised,Disgusted, neutral)
4. Rated Emotion (happy, sad, Afraid, Angry, Surprised,disgusted)
The results of the analysis of variance (ANOVA) are shown inTable 3. We see immediately that most of the variance in theintensity data is either explained by the Posed ( Rated interaction(55.4%) or attributable to unmodeled factors such as individualjudge differences and individual stimulus differences (35.0%). Thelarge effect of the Posed ( Rated interaction comes from the factthat, as expected, for most images, most participants rate theintensity of the posed expression as being higher than the otherexpressions.
The largest effect involving variables other than the posed andrated emotion is the Dataset ( Posed ( Rated interaction (differ-ent datasets have different intensity matrices). A visual inspectionof the treatment means appeared to indicate that the participants’rated intensity of the nominal emotion is generally higher forJACFEE than for CAFE or JAFFE. To quantify the support for thishypothesis, we did a separate one-way analysis of variance withthe rated intensity of the nominal emotion as a dependent variableand the dataset as a predictor. We found a significant effect (F(3,4796) & 53.8, p * .001, )2 & .0326). Since this regrouping of thedata is a post hoc comparison of linear combinations of cell meansin the original analysis, we compared the rated intensities with aScheffe correction (Keppel, 1991) to achieve +FW ! .05 andfound the following relative rated intensities:
JAFFE " CAFE " JACFEE Japanese
! JACFEE Caucasian
That is, for the nominal emotion for each stimulus, our partic-ipants attributed more intensity to JACFEE stimuli overall than to
881CULTURAL DIFFERENCES IN FACIAL EXPRESSION

CAFE stimuli, and more intensity to CAFE stimuli than to JAFFEstimuli.
There were also significant interactions involving judge culture,though they were small #)2 " .01$. All of the differences can besummarized by the Culture ( Dataset ( Posed ( Rated interac-tion. Of the four datasets, our Japanese and U.S. participantsdiffered the most on JAFFE, as measured by the sum of squareddifferences between the two intensity matrices. First, we comparedthe two matrices cell-by-cell with 42 F-tests and a family wiseType I error rate +FW ! .05 spread over the 42 comparisons(seven posed expressions ( six rated expressions). We then com-pared the marginal responses (seven posed expressions , six ratedexpressions) with 13 F-tests and a family wise Type I error rate+FW ! .05 spread over those 13 comparisons. Finally, we com-pared the mean intensity for the two judge cultures over all ofJAFFE with an F-test and a Type I error rate + ! .05. Asummary of these differences is shown in Figure 3. The cells andmarginals that were significantly different across cultures areshaded. The Japanese participants attribute more anger to theJAFFE anger stimuli, and they also attribute more disgust tothe stimuli overall. However, the American participants attributemore happiness to the JAFFE happy stimuli and more fear to theJAFFE surprise stimuli, and they also attribute more sadness to thestimuli overall.
To summarize the main results of the intensity rating block ofExperiment 1, we found that
• Participants rated the nominal emotion as being less intense inJAFFE than in CAFE, and less intense in CAFE than in JACFEE.
• Japanese participants attributed more anger to the angryJAFFE faces and more disgust to the JAFFE faces overall, but U.S.participants attributed more sadness to the JAFFE faces overall,more happiness to the happy JAFFE faces, and more fear to thesurprised JAFFE faces.
We now turn our attention to the second block of Experiment 1,in which participants made a 7-way forced-choice decision foreach stimulus.
Forced-choice accuracy results. We coded each decision par-ticipants made in the forced-choice rating block as “correct” or “in-
correct” based on the nominal posed expression for the stimulus, thenperformed a three-way analysis of variance with correctness as thedependent variable and the following predictor variables:
1. Judge Culture (Japanese, American)
2. Dataset (JAFFE, JACFEE Japanese, JACFEE Caucasian,CAFE)
3. Posed Expression (happy, sad, afraid, angry, surprised,disgusted, neutral)
Table 3Analysis of Variance on Intensity Ratings in Experiment 1
Source df )2 F p
Culture 1 .0000 0.416 0.5188Dataset 3 .0030 10.094 *.001Posed 6 .0408 646.119 *.001Rated 5 .0102 193.414 *.001Culture ( Dataset 3 .0002 4.951 0.0019Culture ( Posed 6 .0008 13.149 *.001Culture ( Rated 5 .0030 56.341 *.001Dataset ( Posed 18 .0023 12.273 *.001Dataset ( Rated 15 .0029 18.651 *.001Posed ( Rated 30 .5539 1755.963 *.001Culture ( Dataset ( Posed 18 .0003 1.719 0.0292Culture ( Dataset ( Rated 15 .0010 6.122 *.001Culture ( Posed ( Rated 30 .0078 24.685 *.001Dataset ( Posed ( Rated 90 .0201 21.281 *.001Culture ( Dataset ( Posed ( Rated 90 .0066 7.010 *.001Error 33264 .3498 (0.65)
Note. Values enclosed in parentheses represent mean square errors.
RatedPosed H M F A S D Mean
H 3.22 1.39 1.15 1.09 1.16 1.21 1.54M 1.04 2.96 1.62 1.55 1.11 2.10 1.73F 1.01 2.79 3.85 1.37 3.21 2.84 2.51A 1.07 1.45 1.18 3.71 1.01 2.36 1.80S 1.23 1.03 1.59 1.13 4.92 1.06 1.83D 1.02 1.82 1.54 2.32 1.18 4.01 1.98N 1.49 1.47 1.23 1.27 1.11 1.14 1.29
Mean 1.44 1.84 1.74 1.78 1.96 2.10 1.81Japanese
RatedPosed H M F A S D Mean
H 4.00 1.17 1.13 1.06 1.64 1.03 1.67M 1.06 3.49 1.82 1.61 1.20 1.36 1.76F 1.03 2.17 4.39 1.30 3.18 2.37 2.41A 1.05 2.58 1.28 2.87 1.09 1.78 1.78S 1.13 1.12 2.84 1.18 4.90 1.40 2.10D 1.04 2.58 1.56 2.63 1.40 2.91 2.02N 1.66 1.60 1.29 1.37 1.17 1.14 1.37
Mean 1.57 2.10 2.04 1.72 2.08 1.71 1.87American
Figure 3. Average intensity matrices for Japanese and American subjectson the Japanese Female Facial Expressions (JAFFE) stimuli used in Ex-periment 1. Rows correspond to the posed emotion and columns corre-spond to the rated emotion. Emotion labels H & happy; M & sad; F &afraid; A & angry; S & surprised; and D & disgusted. Significantlydifferent means are shaded in both matrices. Japanese subjects attributemore disgust to the stimuli, and American subjects attribute more sadnessand fear to the stimuli.
882 DAILEY ET AL.

The results of the ANOVA are shown in Table 4. Although mostof the variance in accuracy is unexplained by the model, we doobserve several statistically significant effects. The effects can bebest understood by closely examining the Culture ( Dataset (Posed interaction. We performed a post hoc analysis using theTukey correction for all pairwise comparisons (Keppel, 1991) tomaintain a family wise Type I error rate of +FW ! .05.
Figure 4 shows the Culture ( Dataset ( Posed interaction indetail. The confidence intervals are for the cell means and includethe between-subjects variance (Loftus, 2002).
The interaction can be further understood through separateconsideration of the marginal Culture ( Dataset and Culture (Posed interactions. For both interactions, we again used Tukey’scorrection for all pairwise comparisons. The U.S. participants’levels of accuracy for each data set were related as follows:
JAFFE " CAFE " Japanese JACFEE
! Caucasian JACFEE
For the Japanese participants, the accuracy levels were slightlydifferent:
CAFE " JAFFE " JACFEE Japanese
! JACFEE Caucasian
The U.S. participants’ level of accuracy for each nominal emo-tion category was related as follows:
D " F ! A ! N ! M ! S " H, A " S
The pattern was again different for the Japanese participants:
F " D " A " M ! N " S ! H
The Japanese participants were more accurate on the surprisestimuli, whereas the U.S. participants were more accurate onanger, sadness, and fear.
Qualitatively, examination of the results shown in Figure 4indicates that our Japanese participants’ responses to the JACFEEJapanese stimuli are much more similar to their responses to theCAFE and JACFEE Caucasian stimuli than to their responses tothe JAFFE stimuli. As previously discussed, this might mean thatour Japanese participants regard the JAFFE posers as in-groupmembers but the Japanese JACFEE posers as out-group members.To address this issue quantitatively, we regrouped the stimuli into
an “American” style expression group containing the FACS-selected CAFE, Caucasian JACFEE, and Japanese JACFEE stim-uli, and a “Japanese” style expression group containing only theJAFFE stimuli. To determine if the U.S. participants had an overalladvantage for the American expressions and the Japanese partic-ipants had an overall advantage for the Japanese expressions, weperformed a 2-way analysis of variance with the dependent mea-sure being correctness and the predictors being (a) judge cultureand (b) expression style (American or Japanese).
The results of the ANOVA are shown in Table 5. The Culture (Expression Style interaction is a small but significant effect, shownin detail in Figure 5a. The confidence intervals are for the cellmeans and include the between-subjects variance (Loftus, 2002).Because the regrouping and reanalysis is a post hoc comparison oflinear combinations of cell means in the original design, weapplied the Scheffe correction for all possible linear contrasts(Keppel, 1991). We found that the Japanese participants weremore accurate than the U.S. participants on JAFFE, and the U.S.participants were more accurate than the Japanese participants onthe FACS-selected stimuli.
Discussion
We consider each of the main findings of our Experiment 1analysis in turn.
We first found that the JAFFE stimuli were rated as less intenseoverall than the CAFE stimuli, and the CAFE stimuli were rated asless intense overall than the JACFEE stimuli. In Matsumoto’sterms, this means that the JAFFE and CAFE stimuli have lesssignal clarity than the JACFEE stimuli, so we should expect to seemore evidence of cultural differences on the JAFFE and CAFEstimuli.
Indeed, the differences between Japanese and American inten-sity ratings were largest for JAFFE. In most cases, the U.S.participants attributed more intensity to the JAFFE faces than didthe Japanese participants. This is not surprising in light of previousfindings (Ekman et al., 1987; Matsumoto & Ekman, 1989) thatAmericans attribute more intensity to emotional faces than Asiansdo. Ekman et al. (1987) found that participants from Japan, HongKong, and Indonesia tended to attribute less intensity to happiness,surprise, and fear in Caucasian faces than did Westerners. Matsu-moto and Ekman (1989) similarly found that Americans tended toattribute more intensity to JACFEE faces than did Japanese par-ticipants, regardless of whether the face in question was Asian orCaucasian.
More surprising in the current experiment is that the Japaneseparticipants attributed more anger to the angry JAFFE faces andmore disgust to the JAFFE faces overall. We attribute this to thefact that, in contrast to previous studies, we have Japanese judgesrating Japanese-style expressions. We reject the hypothesis thatJapanese participants, because of decoding rules or other influ-ences, are simply less likely to attribute intense emotion to others.The Japanese participants may be picking up on subtle culture-specific signals in the data.
In the forced-choice block of Experiment 1, as shown in Fig-ure 5a, we found reciprocal in-group advantages for Japaneseparticipants judging Japanese-style expressions and U.S. partici-pants judging American-style expressions. This study is the first todemonstrate an in-group advantage for Japanese over Western
Table 4Analysis of Variance on Accuracy of Forced Choice Responsesin Experiment 1
Source df )2 F p
Culture 1 .0054 38.73 *.001Dataset 3 .0124 29.44 *.001Posed 6 .1034 123.10 *.001Culture ( Dataset 3 .0086 20.58 *.001Culture ( Posed 6 .0147 17.47 *.001Dataset ( Posed 18 .0451 17.92 *.001Culture ( Dataset ( Posed 18 .0347 13.77 *.001Error 5544 .7758 (0.13)
Note. Values enclosed in parentheses represent mean square errors.
883CULTURAL DIFFERENCES IN FACIAL EXPRESSION
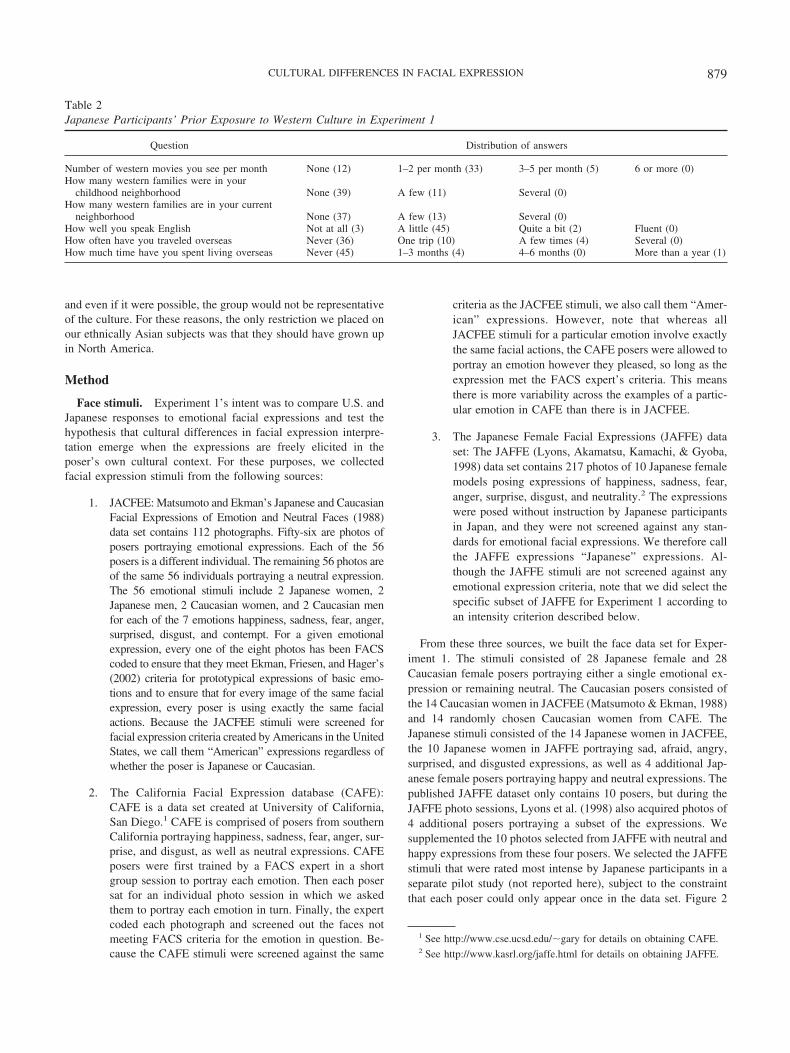
participants using facial photograph stimuli. Crucially, the group-ing of posers was cultural, not racial. Consistent with Elfenbeinand Ambady’s (2002b) criteria for establishing in-group advan-tages, the advantage was observed when, in the analysis, wetreated the Japanese posers in JAFFE as in-group members for theJapanese judges and the Japanese posers in JACFEE as in-groupmembers for the U.S. judges. For comparison, consider Figure 5b, inwhich we perform the same type of analysis, but group the stimuli byposer race rather than poser culture. When we combine the expres-sions of the Japanese posers in JACFEE with the JAFFE expressions,the Japanese participants’ advantage disappears. The JAFFE stimuliwere freely elicited in a Japanese cultural context, whereas theJACFEE expressions were posed in an American cultural context.At the same time, consistent with Matsumoto’s (2002) suggestionsabout signal clarity and accuracy, we found that the JAFFE stimuliwere rated less intense overall and that participants’ accuracy waslower on JAFFE than on JACFEE. However, the lower intensity ofthe JAFFE stimuli only resulted in lowered accuracy for the U.S.judges, not the Japanese judges. The Japanese judges were just asaccurate on the JAFFE stimuli as on the CAFE and JACFEEstimuli (Figure 5a). Past studies using the Japanese JACFEE facesas in-group stimuli for Japanese participants have failed to findin-group advantages and have been used to argue against a directrole for cultural learning in the interpretation of facial expressions(Matsumoto, 2002). In contrast, our results demonstrate that the
requirement for posers from different cultures to portray the exactsame set of facial muscle movements is, as Elfenbein and Ambady(2002a) put it, a “culture eraser.”
A closer examination of the Culture ( Dataset ( Posed inter-action in Figure 4 shows that the in-group advantage for theJapanese participants is driven by their improved accuracy overU.S. participants on the JAFFE anger and disgust stimuli. Indeed,the four JAFFE stimuli for which the Japanese advantage wasgreatest were the four anger and disgust stimuli. Two of thesestimuli are shown in Figure 6. The facial movement in these facesis clearly less intense than in the Japanese JACFEE faces, yet theynevertheless send a clear signal to a majority of the Japaneseparticipants.
In the case of the JAFFE fear stimuli, however, the pattern isactually reversed—U.S. participants were more accurate than Jap-anese participants on the JAFFE fear stimuli. This is consistentwith many studies finding reduced agreement among non-Westerners on fear stimuli. For example, Ekman and Friesen’s(1971) study with the Fore of New Guinea found that participants,when told a particular story about someone feeling fearful thenasked to select the photograph consistent with the story, selected asurprise photo 67% of the time. In another study asking Japaneseand American participants to rate emotional intensity in theJACFEE faces (Matsumoto & Ekman, 1989), 50% of Japaneseparticipants rated surprise most intense in the JACFEE fear faces.In our own data, 68% of the Japanese participants rated theintensity of surprise as equal to or greater than that of fear in theJACFEE fear faces. Similar results have been found in otherstudies, especially with JACFEE (Matsumoto, 1992; Russell, Su-zuki, & Ishida, 1993; Shioiri, Someya, Helmeste, & Tang, 1999).In the case of JAFFE, the models reported difficulty producing fearexpressions, and some of the resulting faces are barely distinguish-able from neutral. Nevertheless, on the set of JAFEE fearful facesselected for the current experiment, U.S. participants were moreaccurate than they were on other negative JAFFE expressions, and
H M F A S D N
0.0
0.2
0.4
0.6
0.8
1.0
Mea
n Ac
cura
cy
Japanese ratersUS raters
C J J AC C J F
C J J AC C J F
C J J AC C J F
C J J AC C J F
C J J AC C J F
C J J AC C J F
C J J AC C J F
Figure 4. Culture ( Dataset ( Posed interaction in Experiment 1. Dataset labels CC & CAFE (Caucasians);JC & Japanese and Caucasian Facial Expressions of Emotion (JACFEE; Caucasians); JJ & JACFEE (Japanese);AF & Japanese Female Facial Expressions (JAFFE; Japanese). Error bars denote 95% confidence intervals.
Table 5Analysis of Variance of in-Group Advantages in Experiment 1
Source df )2 F p
Culture 1 .0000 2.36 .1244Expression style 1 .0040 22.68 0Culture ( Expression style 1 .0075 42.85 0Error 5596 .9831 (0.1653)
Note. Values enclosed in parentheses represent mean square errors.
884 DAILEY ET AL.

they were more accurate than Japanese participants. This consis-tent difficulty producing and recognizing fearful faces but notangry or disgusted faces may be partly explained by the fact thatJapanese people report feeling less fear of strangers than Amer-icans or Europeans (Scherer, Matsumoto, Wallbott, & Kudoh,1988) and by Japan’s status-differentiating culture (Matsumotoet al., 2002) in which it might be appropriate to display negativeemotions such as anger and disgust but not fear toward lower-status others.
Putting the intensity rating and forced choice data together, it isinteresting to note that as rated intensity on the nominal emotionincreases, so does accuracy—both the Japanese and Caucasianfaces in JACFEE were rated more intense than the CAFE and
JAFFE faces on the nominal emotion, and both Japanese and U.S.participants were more accurate at classifying the JACFEE stimulithan the CAFE or JAFFE stimuli. In terms of our computationalmodel (Figure 1), this may mean that the JACFEE stimuli repre-sent exemplars near peaks of the class-conditional likelihoodsP# xt!ci$. On this view, the peaks of the distributions would berelatively stable across cultures, whereas stimuli in regions farfrom the peaks would be rated less intense and lead to loweraccuracy but would also allow for culture-specific variations onthe larger theme.
Because JAFFE was acquired through free elicitation of emo-tional facial expressions from Japanese posers in a Japanese cul-tural context, it is very likely to include such culture-specificvariations in facial expression style, if they exist. This couldexplain the higher intensities that our Japanese participants at-tribute to the JAFFE anger stimuli, and it could also explain thereciprocal in-group advantage we obtain when we treat the JAFFEstimuli as in-group data for the Japanese participants and theJACFEE stimuli as in-group data for the U.S. participants, regard-less of poser race.
The results of Experiment 1 thus suggest a strong role forlearning facial expression styles within cultures. In Experiment 2,we use a computational model to explain the cultural differencesobserved in Experiment 1. We find that the participants’ pattern ofresponses can be explained as a consequence of learning to inter-pret others’ expressions in a specific cultural context, representedin the model first as a particular mix of facial expressions andexpression styles during learning, and second as differing responsebiases being applied during interpretation.
Experiment 2: Modeling Interpretation ofFacial Expressions
In Experiment 1, we found several differences in the wayJapanese and U.S. participants interpret emotional facial expres-sions. It is difficult, however, to determine the causes of thesedifferences, because so many interacting factors contribute to the
JapanesePosers
CaucasianPosers
0.0
0.2
0.4
0.6
0.8
1.0
Mea
n Ac
cura
cy
JapaneseratersUS raters
*
JapaneseExpressions
AmericanExpressions
0.0
0.2
0.4
0.6
0.8
1.0
Mea
n Ac
cura
cy
* *a b
JapaneseExpressions
AmericanExpressions
0.0
0.2
0.4
0.6
0.8
1.0
Mea
n Ac
cura
cy
JapanesemodelAmericanmodel
* *c
Figure 5. In-group advantages in Experiments 1 and 2. Error bars represent 95% confidence intervals.Significantly different with Scheffe correction and +FW & .05. (a) Culture ( Expression Style interaction inExperiment 1. Japanese participants exhibit an in-group advantage on Japanese expressions, and U.S. partici-pants exhibit an in-group advantage on American expressions. (b) The reciprocal in-group advantage is not foundin an equivalent analysis by poser race. Japanese and U.S. participants are equally accurate on expressions ofJapanese posers; U.S. participants exhibit an advantage over Japanese participants on expressions of Caucasianposers. (c) Culture ( Expression style interaction in Experiment 2. Model participants exhibit the samereciprocal in-group advantages shown in (a).
Figure 6. Images for which Japanese and American accuracy differedthe most in Experiment 1. (a) A Japanese Female Facial Expressions(JAFFE) angry face. The mean anger intensity rating was 2.97 com-pared with 3.62 for angry faces overall. 82% of Japanese participantsand 34% of American participants correctly classified the face as“angry.” (b) A JAFFE disgusted face. The mean disgust intensity was3.07 compared with 3.86 for disgusted faces overall. 66% of Japaneseparticipants and 18% of American participants correctly classified theface as “disgusted.”
885CULTURAL DIFFERENCES IN FACIAL EXPRESSION

participants’ responses. In Experiment 2, we apply EMPATH(Dailey et al., 2002) toward a better understanding of the results ofExperiment 1. With EMPATH, unlike our human participants, allof the factors contributing to a response are under our control andcan be manipulated independently. To the extent that experimentalmanipulations produce patterns similar to the human data, we caninfer analogous influences underlying human performance.
We do not manipulate all of the possible factors underlying ourparticipants’ facial expression interpretations. We focus instead onfactors that model the influence of culture-specific display rules,encoder-decoder distance, and culture-specific decoding rules:
• To model culture-specific display rules, we manipulatejudges’ previous experience with different categories of facialexpressions.
• To model the effects of encoder-decoder distance, we manip-ulate judges’ previous experience with different styles of facialexpressions.
• To model the effects of culture-specific decoding rules, wemanipulate judges’ response biases for particular emotion catego-ries.
We assume that a judge’s previous experience affects his or hersensitivity in detecting a particular emotional signal, and thatdifferent groups of judges may bring different response biases withthem into the experiment, reflecting their expectations about theprevalence of emotions in the world and in the experimentalcontext.
EMPATH is just a pattern classifier trained on a set of imagescontaining facial expressions then tested on a different set ofimages containing posers never seen during training. By train-ing, we mean that the model is presented with a face as input(which corresponds to presenting the face as a pattern of acti-vation across a set of input units, like pixels in a camera), andattempts to classify that face into one of six categories byactivating output nodes corresponding to the six categories. Theoutput units are activated by weighted connections between theinput and the output. If the model activates the wrong output,say “Happy,” when the face is in fact “Sad,” then the trainingalgorithm adjusts the connection strengths between the inputsand the outputs in order to reduce the error in the output. So, inthe example given, it would lower the connection strengths tothe “Happy” output (the ones that led to it being incorrectlyactivated), and raise the connection strengths to the “Sad”output from the input stimulus. In this way, the model learnsover many presentations to differentiate the facial expressionsfrom one another. The detailed procedure is given in the Meth-ods section.
To model two groups of participants’ differing previous expe-rience with facial expressions, we can simply build two differentclassifiers with different training sets. To model a participantgroup’s response biases, we can first train our system with uniformpriors over the categories and stimuli, then reweight its outputsaccording to different priors over the categories in order to im-prove the fit to the data. The model can then respond as if itassumes, say, that happiness is twice as likely as sadness in theworld.
Based on the results of Experiment 1, especially the reciprocalin-group advantage shown in Figure 5a, we hypothesize that moretraining on Japanese-style expressions might produce a model thatbehaves more like a Japanese participant on the test stimuli, and
that more training on American-style expressions might produce amodel that behaves more like a U.S. participant.
In the following sections, we describe our model, experimentalmethods, and modeling results, followed by a discussion of theirimplications for the human data.
Method
The model. EMPATH is shown schematically in Figure 1. Ithas been described in detail elsewhere (Dailey et al., 2002)6; herewe describe it briefly. At the input level, stimuli are represented ascropped, aligned, grayscale images. At the next level, the percep-tual level, we filter the image with a rigid grid of overlapping 2DGabor filters (Daugman, 1985) in quadrature pairs at five scalesand eight orientations. A Gabor filter is simply an oriented sinu-soidal grating modulated by a Gaussian envelope. They act as edgedetectors and have been shown to accurately model the receptivefields of simple cells in primary visual cortex (Jones & Palmer,1987). When we combine paired sine-shaped and cosine-shapedfilters at each location, scale, and orientation, we obtain a so-calledGabor magnitude representation that is often used as a simplifyingmodel of the spatial responses of complex cells in the early visualsystem (Lades et al., 1993). At the next level, the gestalt level, thehigh-dimensional Gabor representation is reduced to a lower-dimensional representation via principal components analysis(PCA), a commonly used optimal linear compression technique(see, e.g., Kirby & Sirovich, 1990; Turk & Pentland, 1991). At thefinal level, the category level, the input is classified into one of sixcategories corresponding to the six “basic” emotions originallyportrayed in Ekman and Friesen’s (1976) Pictures of Facial Affect(POFA). The categorization is accomplished by a simple statisticalmodel known as a generalized linear model in statistics or aperceptron in neural networks. The system is trained by errorcorrection to predict the posterior probabilities P#ci!xj$, where theci are the categories happy, sad, afraid, angry, surprised, anddisgusted, and xj is the gestalt-level representation of input stim-ulus j. In previous research we have found this model to providestraightforward explanations of participant behavior in experi-ments on facial expression perception and recognition.
Face stimuli. In addition to the 56 test stimuli used in Exper-iment 1, we assembled a large collection of training images fromseveral sources:
1. JAFFE: we used all 217 images of the 10 Japanesefemale posers in JAFFE for training EMPATH. Ten ofthese stimuli had also been used to test human partici-pants in Experiment 1, but we ensured that no classifierswere both trained and tested on the same individuals (seethe “Training procedure” section below for training andtesting details).
2. CAFE: During video sessions, according to the FACSexpert trainer, 11 of 60 posers (5 female, 6 male) metFACS criteria for all 6 emotional expressions. Seventy-seven images of these 11 posers were selected for train-ing EMPATH. Two of these 11 posers’ faces were also
6 The system is also similar to one proposed by Lyons, Budynek, andAkamatsu (1999).
886 DAILEY ET AL.

used with the human participants in Experiment 1, but aswith JAFFE, we again ensured that no classifiers wereboth trained and tested on these individuals. The 11posers included 7 Caucasians, 2 east Asians (one ofKorean descent and one of Chinese descent), and 2 ofunknown descent (most likely from the Pacific region).
3. JACFEE: We used all 48 happy, sad, afraid, angry,surprised, and disgusted stimuli as well as the 56 neutralstimuli from JACFEE/JACNeuF (Matsumoto & Ekman,1988). (Only the 8 JACFEE stimuli portraying contemptwere left out.) The posers included 28 different Japaneseand 28 different Caucasian individuals, half female andhalf male. The 28 female posers in JACFEE were alsoused with the human participants in Experiment 1, but weagain ensured that no classifiers were both trained andtested on the same individuals.
4. Cohn-Kanade: Because the JAFFE, CAFE, and JACFEEdata sets are relatively small, to improve the robustnessand accuracy of the trained EMPATH classifiers, weselected an additional set of 48 examples of Caucasiansportraying happy, sad, afraid, angry, surprised, and dis-gusted expressions from the publicly released version ofthe Cohn-Kanade database (Kanade, Cohn, & Tian,2000). This database consists of 97 posers performingvarious combinations of facial action units in 481 videosequences of varying length beginning from a neutralexpression. We selected stills from the endpoints of 48sequences. Because not all of the sequences in the data-base portray facial actions meeting FACS criteria for theemotional facial expressions, and few of the posers por-tray all 6 basic emotional expressions, our 48-imagesubset of the Cohn-Kanade database contains 19 uniqueactors.
Each stimulus was coded according to three variables:• Racial group: “Japanese” in the case of JACFEE Japanese and
JAFFE, or “non-Japanese” in the case of CAFE, JACFEE Cauca-sian, and Cohn-Kanade;
• Expression style: “American” in the case of CAFE, JACFEE,and Cohn-Kanade, or “Japanese” in the case of JAFFE;
• Posed emotion: Happy, sad, afraid, angry, surprised, dis-gusted, or neutral.
Stimulus normalization. To create a consistent dataset forEMPATH to learn from, we rotated, scaled, and cropped all 462JAFFE, CAFE, JACFEE, and Cohn-Kanade training and testingimages as already described for Experiment 1. One additionalpreprocessing step was necessary due to the variability in lightingconditions and backgrounds across the four databases. Statisticallearning methods have difficulty generalizing to examples from adistribution that is systematically different from the training dis-tribution. Lighting differences are an example of this, so weattempted to ensure that the face sets had similar pixel distributionsin the face region with a simple histogram equalization technique.For each image, we masked off the face outline, including thehairline, and computed the cumulative distribution of the pixelvalues within the unmasked face interior. From these distributionswe computed the average distribution over all the faces then
mapped each face’s interior pixel values to the mean distribution.In other (unpublished) work, we have found this technique to beuseful when a classifier is trained on one database and expected togeneralize to other databases.
EMPATH training. Our first task was to produce a version ofEMPATH able to classify the 56-stimulus test set for Experiment1 with a high level of accuracy, so that we would then have somefreedom to manipulate the parameters to better fit the Japanese andAmerican human data.
However, we should not train the classifier on the same data thatwas shown to participants in Experiment 1. Because the raters hadnever seen the faces before, their task was to generalize their priorknowledge of facial expressions to a new set of faces. To accu-rately model the experiment, then, our classifiers should similarlynot be tested on the same data they are trained on. But if we wereto exclude all 56 test individuals from the classifier’s training set,there would not be enough stimuli left to achieve good classifica-tion accuracy. To solve this problem, we partitioned the 56-stimulus test set into 14 sets, each containing 4 of the Experiment1 stimuli: 1 from JAFFE, 1 from CAFE, 1 Japanese face fromJACFEE, and 1 Caucasian face from JACFEE. We further con-strained each partition to contain no more than one example ofeach emotional expression, but otherwise, the partitions werechosen arbitrarily.
For each of the 14 partitions of the test set, we trained 10different classifiers with different random training sets, for a totalof 140 classifiers. The training set for each classifier was chosen atrandom, subject to the constraint that none of the four individualsin the classifier’s test set could be used during training. Becausefor a given classifier, only four posers were removed from the poolof possible training stimuli, each classifier could be trained on alarge number of stimuli without contaminating the test. This tech-nique, called cross-validation, is a common way to test machinelearning algorithms when training data is limited.
After the training and test set for a particular EMPATH classi-fier is selected, we further reserve some of the training data as ahold out set. This is because iterative learning methods such asgradient descent tend to overlearn the training set; using a hold outset to determine when to stop training prevents this. We select adifferent random hold out set for every classifier.
For our baseline EMPATH model, we used the following break-down for the training and hold out sets:
• Hold out set: 1 random individual (7 expressions each) fromCAFE, 1 random individual (7 expressions each) from JAFFE, and7 random stimuli (7 different expressions) from JACFEE, for atotal of 21 stimuli.
• Training set: 8 random individuals (7 expressions each) fromCAFE, 8 random individuals (7 expressions each) from JAFFE, 42random stimuli (6 examples of each of 7 expressions) fromJACFEE, and all 48 Cohn-Kanade stimuli, for a total of 202stimuli.
Once the test set, hold out set, and training set are fixed for aparticular EMPATH classifier, processing can begin as shown inFigure 1. Each input-level (image) pattern is processed to obtain ahigh-dimensional perceptual-level representation, the previouslydescribed Gabor magnitude representation of the image. Eachelement of the 40,600 perceptual-level pattern is z-scored to amean of 0 and a variance of 1 over the entire data set so that eachelement has an equal opportunity to contribute. We then compute
887CULTURAL DIFFERENCES IN FACIAL EXPRESSION
the principal component eigenvectors of the training set and de-termine k, the number of eigenvectors required to account for 85%of the training data’s variance (typically, k is approximately 120).We then project all of the perceptual-level data (training set, holdout set, and test set) onto the subspace spanned by the top kprincipal component eigenvectors then z-score the projections,again using the means and variances calculated over the trainingset. These k-dimensional projections are EMPATH’s gestalt-levelrepresentations of the training, hold out, and test images.
Finally, a standard single layer, six-output, feed-forward neuralnetwork is trained to minimize error on the training set untilaccuracy on the hold out set is maximized. We use stochasticgradient descent and the cross-entropy error criterion (Bishop,1995). After each neural network is trained, we save its weightsand test its generalization to its test set. That is, for each test setitem xj, we obtain predictions P#ci!xj$, with c1 & H (happy), c2 &M (sad), c3 & F(afraid), c4 & A (angry), c5 & S (surprised), andc6 & N (neutral). EMPATH does not explicitly represent neutralfaces with a separate category; rather, neutrality is assumed to bean absence of any emotional expression. To accomplish this, thetraining target for an emotional face is a binary vector, for example
-0 0 1 0 0 0.
for a Fearful Face, and the Training Target for Neutral Faces Is theUniform Vector
$ 16
16
16
16
16
16%
The final output of the training procedure is a 560 ( 6 matrix ofclassifier responses, because there are 56 test stimuli and 10classifiers tested on each test stimulus.
The use of binary targets is suboptimal in the sense that somefaces are more representative of a given emotion than others.Better agreement with the human data could in principle be ob-tained by training the model on human responses. In that case,though, we would be “building in” the biases of one particulargroup of participants. Binary targets avoid that issue, so that anyemergent agreement between network and human responses can beattributed to perceptual properties of the stimuli rather than theway the networks were trained.
Prior experience manipulation. Based on previous experi-ments with EMPATH, we expected the baseline model just de-scribed to perform fairly well at classifying the test stimuli fromExperiment 1. However, the particular mix of facial expressioncategories, poser races, and expression styles we chose was to anextent arbitrary, reflecting the availability of data more so than anyprior theories about the composition of our human participants’“training sets.” Given the results of Experiment 1, we hypothe-sized that the Japanese participants had more prior exposure toexpressions like those in JAFFE, that U.S. participants had moreprior exposure to expressions like those in JACFEE and CAFE,and that the two participant groups had different prior exposure tosome facial expression categories. To determine the extent towhich these kinds of factors might produce model “participants”more like our Japanese or U.S. human participants, we performedseparate experiments with different mixtures of expressions, poserraces, and expression styles.
Recall that we model the effects of display rules by modulatingEMPATH’s exposure to different categories of emotions and that
we model cultural distance by modulating EMPATH’s exposure todifferent styles of expressions. We also added exposure to differentraces as an additional variable to see if it had an effect. Thebaseline model was trained on most of the data available to uswithout repeating any * poser, emotion / pairs in any of thetraining sets, so all of our manipulations took the form of subsam-pling one or more categories of stimuli during model training. Wedefined the following parameter space to model participants’ dif-fering prior experience:
• Exposure to happy faces: eH 0 !.5, .75, 1.0"• Exposure to sad faces: eM 0 !.5, .75, 1.0"• Exposure to afraid faces: eF 0 !.5, .75, 1.0"• Exposure to angry faces: eA 0 !.5, .75, 1.0"• Exposure to surprised faces: eS 0 !.5, .75, 1.0"• Exposure to disgusted faces: eD 0 !.5, .75, 1.0"• Exposure to Japanese faces (JACFEE Japanese, JAFFE):
eJR 0 !.5, .6, .7, .8, .9, 1.0"• Exposure to non-Japanese faces (JACFEE Caucasian, CAFE,
Cohn-Kanade): eNJ 0 !.5, .6, .7, .8, .9, 1.0"• Exposure to American-style expressions (JACFEE, CAFE,
Cohn-Kanade): eAS 0 !.5, .6, .7, .8, .9, 1.0"• Exposure to Japanese-style expressions (JAFFE):
eJS 0 !.5, .6, .7, .8, .9, 1.0"These 10 parameters allow for 944,784 possible mixtures of
training set patterns. An exposure level of 1.0 means all of thepatterns in a category for the baseline model are retained in themanipulated training set. An exposure level ec " 1.0 * 1.0 forcategory c means when a pattern is selected for inclusion in aclassifier’s training set, if it is in category c, we only use thepattern with probability ec. For example, if eJS ! .5, eachclassifier will be trained on an average of 28 JAFFE faces ratherthan 56.
Response bias and neutral threshold manipulation. Recallthat we model decoding rules by modulating EMPATH’s responsebias for each emotion. Response bias is a shift in the criterion oneuses to make a decision. To model this shift mathematically, weassume it reflects a change in one’s estimate of the prior proba-bility P#ci$ of seeing a given emotion category ci. A participant’sactual response will of course also depend on the visual stimulus.We assume participants’ intensity and forced-choice responses arefunctions of their estimates of P#ci!xj$, the posterior probability ofemotion class ci given a stimulus xj. The posterior and prior arerelated by Bayes’ rule: given stimulus xj, the posterior probabilityof emotion ci is
P#ci!xj$ !P# xj!ci$P#ci$
P# xj$(2)
where P# xj!ci$ is the class-conditional probability of the stimulusand P#ci$ and P# xj$ are priors for emotion i and stimulus j. Ourclassifiers estimate P#ci!xj$ directly under the assumption of train-ing priors Pold#ci$. These priors are uniform for our baseline model,but they differ from the uniform distribution whenever some of theemotion exposure parameters ec introduced in the previous sectionare less than 1. In either case, to obtain an estimate P#ci!xj$ underdifferent priors, we simply normalize each of the classifier’s out-
puts by a factor bi !Pnew#ci$
old
P#ci$. As will be explained below,
we fit the parameters bi directly to the human data using leastsquares.
888 DAILEY ET AL.

Because Experiment 1 included a forced-choice decision includ-ing a seventh category choice (neutral), we needed to modelparticipants’ seven-way forced choice decisions based on six pos-terior category probability estimates. The simplest way to accom-plish this is with a winner-takes-all model, in which we assumeparticipants calculate P#ci!xj$ based on some set of priors then findthe category c* with the highest posterior probability
c* !argmax biP#ci!xj$
ci(3)
Then, we assume participants apply the decision rule
Category# xj$ ! " c* if bc * P#c*!xj$ # 1N,Neutral otherwise (4)
The threshold 1N is a free parameter. If the estimated probabilityof the most probable class, say “surprise,” is greater than 1N, werespond with the emotional category “surprise,” but otherwise, theestimated probability of the surprise category is too small, and werespond with the “neutral” category decision.
Winner-takes-all is a straightforward way to model an individ-ual participant’s forced choice responses. But in fact, we want tomodel the entire population’s decisions, not just a single partici-pant’s, so instead of winner-takes-all, we form the vector
-Vi#xj$.7(1 ! &bHP#H⎪xj$bMP#M⎪xj$bFP#F⎪xj$bAP#A⎪xj$bSP#S⎪xj$bDP#D⎪xj$
1N
' (5)
representing the value of each possible decision, then apply themultinomial logit choice model
P#ci⎪xj$ !e2Vi#xj$
(ke2Vk#xj$(6)
for the entire population’s seven-way forced choice behavior.Altogether, with six response bias factors bH, . . . , bD, the neu-
tral threshold 1N, and the logit gain parameter 2, we have a total ofeight parameters that must be fitted to the human data. However,there are only seven intrinsic parameters, since the final vector ofdecision probabilities is constrained to sum to 1.
Results
Baseline model. We first trained the baseline model consist-ing of 140 classifiers using most of the available training data, aspreviously described. We found that k, the number of gestalt-leveldimensions accounting for 85% of the variance at the perceptuallevel, was approximately 120, though k varied somewhat fordifferent random training sets.
The ensemble’s winner-takes-all test set accuracy on the 48emotional stimuli from Experiment 1 was 88.3%. With a neutralthreshold 1N ! .33, the ensemble’s winner-take-all accuracy inthe 7-way decision over all 56 stimuli was 82.7%. In principle, itwould be possible to estimate the neutral threshold automaticallyusing hold out data, but we did not do so, since we planned to fitthe threshold directly to the human data later. The model’s forced
choice accuracy was quite good compared to the human partici-pants in Experiment 1: the Japanese participants’ accuracy was75.6%, and the U.S. participants’ accuracy was 81.6%.
In a preliminary analysis of the model’s winner-takes-all perfor-mance in comparison with human participants, we found one seriousoutlier. One of the two CAFE stimuli portraying surprise (stimulus ID033_s1) was classified as surprise by 89% of our human participants(both U.S. and Japanese), but all 10 of the EMPATH classifiers testedon this stimulus classified it as a fearful face. Indeed, the participantssaw weak fear in the image (rated intensity of 2.16 compared to 4.53for surprise), but EMPATH saw this stimulus as more similar to thefearful stimuli in its training set than to the surprise stimuli in itstraining set.7 This was the only stimulus for which EMPATH’s modalresponse was different from that of the human participants. To preventthis outlier from adversely skewing our parameter estimates, weexcluded it from all of the analyses reported below.
Using the unfitted model’s estimates of P#ci!xj$ for the 6 emo-tion categories and 55 test stimuli, we fit the 8 parameters of thedecision model (Equation 6) to the Japanese and U.S. participants’accuracy data separately, using the BFGS quasi-Newton algorithmimplemented in Matlab (The Mathworks, Inc., 2002). The optimi-zation’s objective was to find the parameters minimizing the sumsquared difference between the predicted and observed humanaccuracies on each of the seven categories happy, sad, afraid,angry, surprised, disgusted, and neutral. Note that even though thenumber of parameters exceeds the number of data points to be fit,the parameters interact nonlinearly, so in general there is nosolution and error minimization still applies.
Both the “Japanese” and “American” versions of the baselinemodel fit their human populations’ per-emotion accuracies fairlyclosely; the model fit to the Japanese data achieved a root meansquared error (RMSE) of .0102, and the model fit to the Americandata achieved a RMSE of .0923. However, the pair of models didnot exhibit the in-group effect found in Experiment 1 and shown inFigure 5a. Thus, in our model, decoding rules are not by them-selves sufficient to explain the in-group advantage observed inExperiment 1. In the next section, we show how the previouslydescribed training set manipulations (aimed at modeling displayrules and encoder-decoder distance) do indeed lead to models thatdo exhibit the in-group advantages from Experiment 1.
Training set manipulation. We performed a search in thepreviously described 10-dimensional space describing the mixtureof expressions, styles, and races comprising EMPATH’s trainingset. The objective of this search was to find the training set mixturebest predicting the Judge Culture ( Expression Style interaction(Figure 5a) after the 8-parameter response bias model was fit to thesubjects’ marginal emotion category accuracies. The training mix-ture search procedure was to begin at the baseline model, do a linesearch along every variable, choose the best fit so far, and repeat.We measured the difference between model and participants by theroot mean squared difference between the participants’ and mod-el’s performance on two categories of stimuli: the American-style
7 This may be because of a less pronounced jaw drop (AU 26) in picture033_s1 compared with the other surprise stimuli. Also, the wrinkles on thisposer’s forehead because of AUs 1 and 2 have a curved appearance, whichEMPATH could confuse with the effects of the brows coming together(AU 4) as is typical in fearful expressions.
889CULTURAL DIFFERENCES IN FACIAL EXPRESSION

stimuli in JACFEE and CAFE and the Japanese-style stimuli inJAFFE. The pair of models best predicting these category meansshould exhibit the in-group advantages observed in Experiment 1,and the composition of the training sets for these two modelsshould reflect differences in the prior experience of the corre-sponding participant populations.
The results of the search are shown in Table 6. The “BaselineJapanese” and “Baseline American” refer to the baseline modeldescribed above, with response biases fit to the Japanese or Amer-ican per-emotion accuracy data.
So that we could perform the same ANOVA on the model as wedid on the human data, we used the Japanese and Americanmodels’ posterior probability estimates to generate 100 modelJapanese and 100 model American participants’ responses to thestimuli. This is done by flipping a 7-sided weighted coin 100 timesfor each stimulus. The American model participants’ mean accu-racies for each of the 55 test stimuli fit the American humanparticipants’ mean accuracies with r2 & .2654; the Japanese modelparticipants’ means fit the human means with r2 & .2986. Wecompared the models with the same analysis of variance per-formed in Table 5 and Figure 5a. The results of the model analysisare shown in Table 7 and Figure 5c. As expected, given the resultsof Table 6, our model Japanese participants were more accurate onthe Japanese-style expressions, and our model American partici-pants were more accurate on the American-style expressions.
Discussion
In the introduction to this article, we described three factors thatpotentially affect facial expression interpretation in different cul-tures: encoder-decoder distance, display rules, and decoding rules.
We model encoder-decoder distance by manipulating theamount of training our model has on a specific culture’s expres-sions. More training corresponds to lower distance, and less train-ing corresponds to greater distance. A model trained on fewerAmerican style expressions than another model would have ahigher encoder-decoder distance for American-style expressions,and a model trained on fewer Japanese style expressions wouldhave a higher encoder-decoder distance for Japanese-style expres-sions. Indeed, referring to Table 6, we see that the best model ofthe Japanese raters and the best model of the U.S. raters differalong the encoder-decoder distance dimension. The Japanese mod-els were each trained, on average, on 54 Japanese style faces(100% of the JAFFE training data with 75% subsampling of theangry faces) and 92.4 American style faces (60% of the non-Japanese faces and 100% of the JACFEE Japanese faces with 75%
subsampling of the angry faces), whereas the American modelswere each trained, on average, on 30.2 Japanese style faces (90% !60% of the JAFFE training data) and 143.9 American style faces.Overall, then, the Japanese models were trained on 78.8% moreJapanese-style faces than the American models, and the Americanmodels were Trained on 55.7% more American-style faces thanthe Japanese models. These results are consistent with the hypoth-esis that different cultures evolve different styles of emotionalexpression, each a dialect of a universal language.
We model display rules by manipulating the frequency of eachemotion category in the training sets for each model population.Referring to Table 6, the best model of the U.S. raters had auniform mixture of emotion categories in its training set, while thebest model of the Japanese raters had a training set mixture inwhich the angry faces were subsampled at a rate of 75%. Themodel thus suggests that the Japanese participants have had lessprior exposure to angry faces than their American counterparts.This would be consistent with the concept of display rules dis-couraging the expression of negative emotions in Japanese culture(see, e.g., Matsumoto et al., 1998). Looking more closely at thebehavioral data, we see that Japanese participants were less accu-rate than U.S. participants on anger overall, but they were moreaccurate than U.S. participants on the JAFFE anger stimuli. Whenthe anger stimulus is posed by a Japanese person in a Japanesecultural context (as was the case for the JAFFE stimuli), Japaneseparticipants readily detect the anger signal and classify the stim-ulus as angry. Combined with the modeling data, this suggests thatauthentic Japanese-style anger expressions are rare but highlysalient. If Japanese culture is indeed status differentiating (Matsu-moto et al., 2002), detecting anger coming from higher-statusothers would be very important.
We model decoding rules by manipulating the model’s responsebiases (priors) for each emotion category at classification time.
Table 6Results of Search for Optimal Training Set Composition
Model RMSENon-Japanese
facesJapanese
facesAmerican
styleJapanese
styleDisplay rulemanipulation
Response biases (relative to training set)
Happy Sad Afraid Angry Surprised Disgusted
Baseline Japanese .0102 100% 100% 100% 100% None 0.2279 0.1394 0.0970 0.1124 0.2548 0.1187Baseline American .0923 100% 100% 100% 100% None 0.1317 0.2267 0.1788 0.1741 0.1279 0.1609Best Japanese .0035 60% 100% 100% 100% Anger 75% 0.1419 0.2115 0.1247 0.2161 0.1605 0.1453Best American .0206 100% 90% 100% 60% None 0.1863 0.1768 0.1805 0.1781 0.1347 0.1347
Note. Display rule manipulation corresponds to lower frequency of exposure to one or more emotion categories in the training set.
Table 7Analysis of Variance of Model In-Group Advantages inExperiment 2
Source df )2 F p
Culture 1 .0002 2.04 .153Expression style 1 .0023 25.52 *.001Culture ( Expression style 1 .0041 45.98 *.001Error 10,996 .9909 (.1771)
Note. Values enclosed in parentheses represent mean square errors.
890 DAILEY ET AL.

Referring again to Table 6, in the optimal response bias results, wesee that the Japanese model places large priors on sadness andanger, compared to its training set, whereas the American modelplaces large priors on happiness, sadness, fear, and anger. Theresult that the Japanese model has a high response bias on anger isparticularly interesting in light of the display rule results justmentioned. The best model of the Japanese raters is one that seesangry expressions rarely during training but is also one that mon-itors for angry expressions actively at classification time. This isagain consistent with the theory of Japanese culture as statusdifferentiating (Matsumoto et al., 2002). Furthermore, the resultthat the Japanese model has high response biases for both angerand sadness might indicate monitoring for negative expressions asa deviation from the norm in a homogeneity-sensitive (Triandis,1995) or interdependent (Markus & Kitayama, 1991) society.
Taken together, the results of our manipulations lead us to theconclusion that no one theory or factor accounts for culturaldifferences in facial expression interpretation. Rather, encoder-decoder distance, display rules, decoding rules, and other factorswe did not model no doubt interact in a holistic way to produce apattern of systematic differences among cultures. Our modelingexperiments are a step toward untangling and understanding theseinteracting effects.
As an example of the interdependence of the factors underlyingcross cultural differences in facial expression interpretation, con-sider the cultural differences in recognition of fearful expressionsfound in our behavioral data and many other experiments in theliterature. The Japanese model raters are inaccurate on fearfulexpressions compared to the American model raters because of (a)the perceptual similarity between fear and other negative expres-sions, (b) the overall smaller training set, and (c) a relatively lowresponse bias for fear. Since fearful expressions are perceptuallysimilar to other negative expressions, a large number of examplesare required to train a model to distinguish them. As the trainingset size decreases (note from Table 6 that the Japanese models aretrained on fewer faces overall, due to subsampling of non-Japaneseand angry faces) the models’ performance on fear degrades fasterthan it does on easier expressions. These effects are exacerbated bythe low response bias for fear, also shown in Table 6. Extrapolat-ing from the model to the human population, we would say that inJapan, fearful expressions are neither frequent enough nor salientenough to warrant monitoring for them. This is in contrast to thepreviously discussed results on anger and sadness—anger andsadness expressions are surely more important than fearful expres-sions in day-to-day social communication, and this may be evenmore so in a culture which is more status differentiating (Matsu-moto et al., 2002) and less fearful (Scherer et al., 1988) thanwestern cultures. Our results point to the need for further study ofthe relationship between expression and recognition of fear and itsrole in social communication across cultures.
Finally, we should point out that although the Model U.S. andJapanese participants exhibited the same interaction between judgeculture and expression style as the human participants, at a moredetailed level, there were also differences between the models andhumans. On a per-stimulus basis, the American model only ac-counted for 26.5% of the variance in the U.S. participant data, andthe Japanese model only accounted for 30.0% of the variance inthe Japanese participant data. As an example, from the human datashown in Figure 4, we might expect that our model of the Japanese
raters would be less accurate at classifying the JAFFE fear facesthan our model of the American raters. However, in the experimentit turned out that both model populations classified the two JAFFEfear stimuli in the test set with 100% accuracy. Similarly, aspreviously explained, one of the CAFE surprise stimuli had to bedropped from the analysis because 100% of the models classifiedit as fear. In general, the model participants perform more similarlyto each other than human participants do. This is because ulti-mately, all of our models are trained on different subsets of thesame training set containing less than 400 images. Obtainingmodel populations with performance as diverse as human popula-tions would require a much larger and more diverse training set,mirroring the diversity of individual human experience.
Conclusion
In this article, we have proposed a new computational modeland methodology for analysis of cross-cultural differences in in-terpretation of emotional facial expressions. The model is based onBayes-optimal inference using a set of class-conditional probabil-ity distributions and a set of priors, both of which are modifiedthrough experience and context.
In two experiments, we have demonstrated reciprocal in-groupadvantages for Japanese and American judges of emotional facialexpressions and shown, with the model, how the differences mightarise in different cultural learning environments.
The Japanese in-group advantage occurs when the Japanesestimuli in JACFEE are analyzed as out-group stimuli rather thanin-group stimuli. This is consistent with Matsumoto and col-leagues’ null results in testing for in-group advantages withJACFEE (Matsumoto, 2002); however, by contrast, our findingsalso support the view that cultural differences in emotional expres-sion are best studied with stimuli elicited as naturally and freely aspossible within the poser’s cultural context (Elfenbein & Ambady,2002a).
Is it actually possible for the Japanese participants to deter-mine, consciously or unconsciously, that the JACFEE Japanesestimuli portray out-group members and treat them as such? Theanswer might be yes; in a recent study, Marsh, Elfenbein, andAmbady (Marsh, Elfenbein, & Ambady, 2003) found thatAmerican participants were not only above chance at classify-ing the nationality (Japanese or American) of the ethnicallyJapanese posers in JACFEE, but also more accurate at the taskwhen using the JACFEE emotional images as opposed to thecorresponding neutral stimuli from the same posers. This resultwas obtained even though the JACFEE emotional stimuli wereoriginally carefully prepared to eliminate any trace of individ-uality in the expressions.
Comparing the training set mixtures for our best Japanese andbest American EMPATH models, we found that the Japanesepattern of responses is reproduced by EMPATH when it istrained on fewer non-Japanese faces, fewer angry faces, moreJapanese faces, and more Japanese-style expressions. This is asatisfying explanation of the results of Experiment 1. But moregenerally, it is a parsimonious explanation of the culturallydependent aspects of facial expression recognition in that onlya few factors (prior exposure to expression styles, emotioncategories, and racial groups, along with differing responsebiases) are necessary to explain the subtle differences in facial
891CULTURAL DIFFERENCES IN FACIAL EXPRESSION

expression interpretation between cultures. We find that whilemany aspects of production of facial expressions may be innateand universal across cultures, there are subtle differences inthe gestures used in different cultures, and the system respon-sible for recognizing and interpreting those facial gestures isstrongly dependent on learning. As the recognition systemlearns through experience in the context of a specific culture,subtle differences in expression lead to systematic differencesin interpretation across cultures. Our results thus indicate thatlearning such culture-specific variations in facial gestures is thecritical factor underlying the in-group advantage in emotionalexpression recognition.
We have found that EMPATH is a powerful tool for exploringhypotheses about human behavior in facial expression experi-ments. In future research, we hope to employ it toward a moredetailed understanding of the critical facial features humans use tomake judgments about emotion in faces and the subtle differencesin facial expression styles.
References
Biehl, M., Matsumoto, D., Ekman, P., Hearn, V., Heider, K., Kudoh, T., etal. (1997). Matsumoto and Ekman’s Japanese and Caucasian FacialExpressions of Emotion (JACFEE): Reliability data and cross-nationaldifferences. Journal of Nonverbal Behavior, 21, 3–21.
Bishop, C. M. (1995). Neural networks for pattern recognition. Oxford:Oxford University Press.
Dailey, M. N., Cottrell, G. W., Padgett, C., & Adolphs, R. (2002).EMPATH: A neural network that categorizes facial expressions.Journal of Cognitive Neuroscience, 14, 1158 –1173.
Darwin, C. (1998). The expression of the emotions in man and animals (3rded.). New York: Oxford University Press. (Original work published1872)
Daugman, J. G. (1985). Uncertainty relation for resolution in space, spatialfrequency, and orientation optimized by two-dimensional visual corticalfilters. Journal of the Optical Society of America A, 2, 1160–1169.
Ekman, P. (1972). Universals and cultural differences in facial expressionsof emotion. In J. Cole (Ed.), Nebraska Symposium on Motivation 1971(pp. 207–283). Lincoln, NE: University of Nebraska Press.
Ekman, P. (1994). Strong evidence for universals in facial expressions: A replyto Russell’s mistaken critique. Psychological Bulletin, 115, 268–287.
Ekman, P. (1999a). Basic emotions. In T. Dalgleish & M. Power (Eds.),Handbook of cognition and emotion (pp. 45–60). New York: Wiley.
Ekman, P. (1999b). Facial expressions. In T. Dalgleish & M. Power (Eds.),Handbook of cognition and emotion (pp. 301–320). New York: Wiley.
Ekman, P., & Friesen, W. (1976). Pictures of facial affect. Palo Alto, CA:Consulting Psychologists Press.
Ekman, P., & Friesen, W. (1978). Facial action coding system: A techniquefor the measurement of facial movement. Palo Alto, CA: ConsultingPsychologists Press.
Ekman, P., & Friesen, W. V. (1971). Constants across cultures in the face andemotion. Journal of Personality and Social Psychology, 17, 124–129.
Ekman, P., Friesen, W. V., & Hager, J. C. (2002). FACS investigator’sguide. Salt Lake City, UT: A Human Face.
Ekman, P., Friesen, W. V., O’Sullivan, M., Chan, A., Diacoyanni-Tarlatzis, I., Heider, K., et al. (1987). Universals and cultural differencesin the judgments of facial expressions of emotion. Journal of Personalityand Social Psychology, 53, 712–717.
Ekman, P., Sorensen, E. R., & Friesen, W. V. (1969). Pan-cultural elementsin facial displays of emotions. Science, 164, 86–88.
Elfenbein, H., & Ambady, N. (2002a). Is there an in-group advantage inemotion recognition? Psychological Bulletin, 128, 243–249.
Elfenbein, H., & Ambady, N. (2002b). On the universality and cultural
specificity of emotion recognition: A meta-analysis. Psychological Bul-letin, 128, 203–235.
Elfenbein, H., & Ambady, N. (2003a). Cultural similarity’s consequences:A distance perspective on cross-cultural differences in emotion recog-nition. Journal of Cross-Cultural Psychology, 34, 92–110.
Elfenbein, H., & Ambady, N. (2003b). When familiarity breeds accuracy:Cultural exposure and facial emotion recognition. Journal of Personalityand Social Psychology, 85, 276–290.
Elfenbein, H., Beaupre, M., Levesque, M., & Hess, U. (2007). Toward adialect theory: Cultural differences in the expression and recognition ofposed facial expressions. Emotion, 7, 131–146.
Fleishman, A. (1980). Confidence intervals for correlation ratios. Educa-tional and Psychological Measurement, 40, 659–670.
Fridlund, A. (1994). Human facial expression: An evolutionary view. SanDiego: Academic Press.
Friesen, W. V. (1972). Cultural differences in facial expressions in a socialsituation: An experimental test of the concept of display rules. Unpub-lished doctoral dissertation, University of California, San Francisco.
Gudykunst, W., & Ting-Toomey, S. (1988). Culture and affective com-munication. American Behavioral Scientist, 31, 384–400.
Hofstede, G. (1983). Dimensions of national cultures in fifty countries andthree regions. In J. Deregowski, S. Dziurawiec, & R. Annis (Eds.),Expiscations in cross-cultural psychology (pp. 335–355). Lisse: Swets &Zeitlinger.
Hofstede, G. (2001). Culture’s consequences: Comparing values, behav-iors, institutions, and organizations across nations (2nd ed.). ThousandOaks, CA: Sage.
Huang, Y., Tang, S., Helmeste, D., Shiori, T., & Someya, T. (2001).Differential judgement of static facial expressions of emotions in threecultures. Psychiatry and Clinical Neurosciences, 55, 479–483.
Izard, C. E. (1994). Innate and universal facial expressions: Evidence fromdevelopmental and cross-cultural research. Psychological Bulletin, 115,288–299.
Jones, J. P., & Palmer, L. A. (1987). An evaluation of the two-dimensionalGabor filter model of receptive fields in cat striate cortex. Journal ofNeurophysiology, 58, 1233–1258.
Kanade, T., Cohn, J., & Tian, Y. (2000). Comprehensive database for facialexpression analysis. In Proceedings of the fourth IEEE internationalconference on automatic face and gesture recognition (pp. 46–53).Grenoble, France: IEEE Computer Society.
Keppel, G. (1991). Design and analysis: A researcher’s handbook (3rded.). Upper Saddle River, NJ: Prentice Hall.
Kirby, M., & Sirovich, L. (1990). Application of the Karhunen-Loeveprocedure for the characterization of human faces. IEEE Transactions onPattern Analysis Machine Intelligence, 12, 103–108.
Knill, D., & Richards, W. (Eds.). (1996). Perception as Bayesian inference.New York: Cambridge University Press.
Lades, M., Vorbruggen, J. C., Buhmann, J., Lange, J., von der Malsburg,C., Wurtz, R. P., et al. (1993). Distortion invariant object recognition inthe dynamic link architecture. IEEE Transactions on Computers, 42,300–311.
Landis, C. (1924). Studies of emotional reactions: II. General behavior andfacial expression. Journal of Comparative Psychology, 4, 447–509.
Loftus, G. (2002). Analysis, interpretation, and visual presentation ofexperimental data. In Stevens’ handbook of experimental psychology(3rd ed., Vol. 4, pp. 339–390). New York: Wiley.
Lyons, M. J., Akamatsu, S., Kamachi, M., & Gyoba, J. (1998). Codingfacial expressions with Gabor wavelets. In Proceedings of the thirdIEEE international conference on automatic face and gesture recogni-tion (pp. 200–205). Nara, Japan: IEEE Computer Society.
Lyons, M. J., Budynek, J., & Akamatsu, S. (1999). Automatic classifica-tion of single facial images. IEEE Transactions on Pattern Analysis andMachine Intelligence, 21, 1357–1362.
Lyons, M. J., Campbell, R., Plante, A., Coleman, M., Kamachi, M., &
892 DAILEY ET AL.
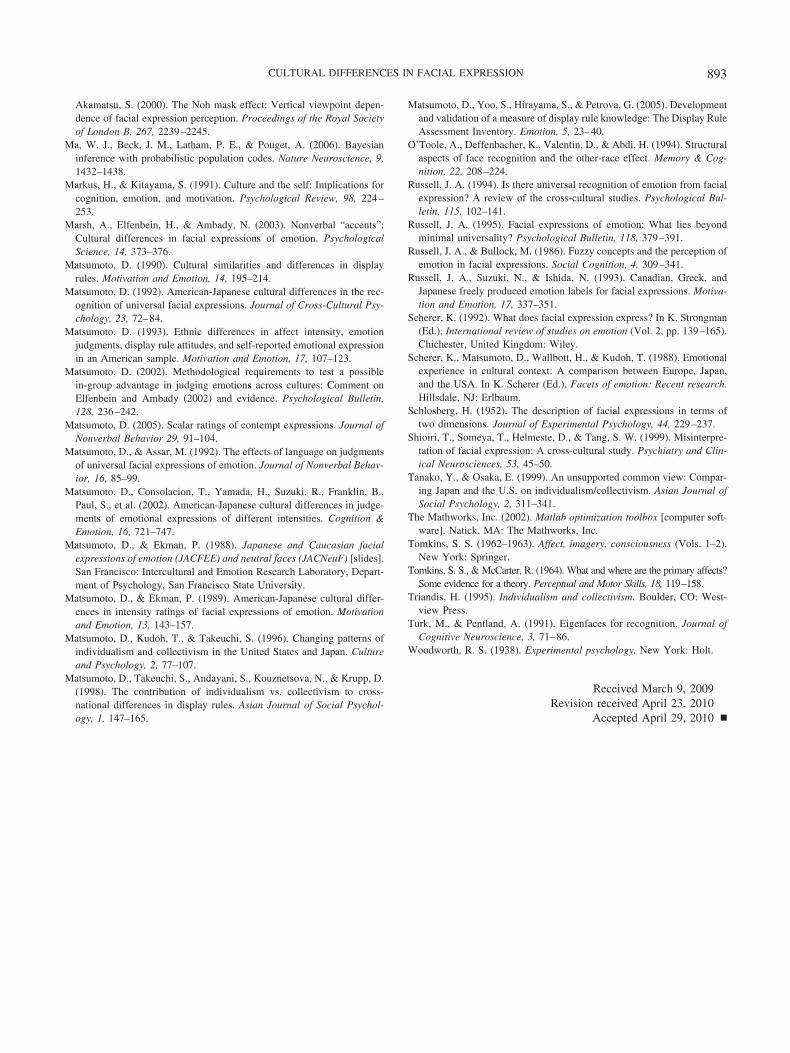
Akamatsu, S. (2000). The Noh mask effect: Vertical viewpoint depen-dence of facial expression perception. Proceedings of the Royal Societyof London B, 267, 2239–2245.
Ma, W. J., Beck, J. M., Latham, P. E., & Pouget, A. (2006). Bayesianinference with probabilistic population codes. Nature Neuroscience, 9,1432–1438.
Markus, H., & Kitayama, S. (1991). Culture and the self: Implications forcognition, emotion, and motivation. Psychological Review, 98, 224–253.
Marsh, A., Elfenbein, H., & Ambady, N. (2003). Nonverbal “accents”:Cultural differences in facial expressions of emotion. PsychologicalScience, 14, 373–376.
Matsumoto, D. (1990). Cultural similarities and differences in displayrules. Motivation and Emotion, 14, 195–214.
Matsumoto, D. (1992). American-Japanese cultural differences in the rec-ognition of universal facial expressions. Journal of Cross-Cultural Psy-chology, 23, 72–84.
Matsumoto, D. (1993). Ethnic differences in affect intensity, emotionjudgments, display rule attitudes, and self-reported emotional expressionin an American sample. Motivation and Emotion, 17, 107–123.
Matsumoto, D. (2002). Methodological requirements to test a possiblein-group advantage in judging emotions across cultures: Comment onElfenbein and Ambady (2002) and evidence. Psychological Bulletin,128, 236–242.
Matsumoto, D. (2005). Scalar ratings of contempt expressions. Journal ofNonverbal Behavior 29, 91–104.
Matsumoto, D., & Assar, M. (1992). The effects of language on judgmentsof universal facial expressions of emotion. Journal of Nonverbal Behav-ior, 16, 85–99.
Matsumoto, D., Consolacion, T., Yamada, H., Suzuki, R., Franklin, B.,Paul, S., et al. (2002). American-Japanese cultural differences in judge-ments of emotional expressions of different intensities. Cognition &Emotion, 16, 721–747.
Matsumoto, D., & Ekman, P. (1988). Japanese and Caucasian facialexpressions of emotion (JACFEE) and neutral faces (JACNeuF) [slides].San Francisco: Intercultural and Emotion Research Laboratory, Depart-ment of Psychology, San Francisco State University.
Matsumoto, D., & Ekman, P. (1989). American-Japanese cultural differ-ences in intensity ratings of facial expressions of emotion. Motivationand Emotion, 13, 143–157.
Matsumoto, D., Kudoh, T., & Takeuchi, S. (1996). Changing patterns ofindividualism and collectivism in the United States and Japan. Cultureand Psychology, 2, 77–107.
Matsumoto, D., Takeuchi, S., Andayani, S., Kouznetsova, N., & Krupp, D.(1998). The contribution of individualism vs. collectivism to cross-national differences in display rules. Asian Journal of Social Psychol-ogy, 1, 147–165.
Matsumoto, D., Yoo, S., Hirayama, S., & Petrova, G. (2005). Developmentand validation of a measure of display rule knowledge: The Display RuleAssessment Inventory. Emotion, 5, 23–40.
O’Toole, A., Deffenbacher, K., Valentin, D., & Abdi, H. (1994). Structuralaspects of face recognition and the other-race effect. Memory & Cog-nition, 22, 208–224.
Russell, J. A. (1994). Is there universal recognition of emotion from facialexpression? A review of the cross-cultural studies. Psychological Bul-letin, 115, 102–141.
Russell, J. A. (1995). Facial expressions of emotion: What lies beyondminimal universality? Psychological Bulletin, 118, 379–391.
Russell, J. A., & Bullock, M. (1986). Fuzzy concepts and the perception ofemotion in facial expressions. Social Cognition, 4, 309–341.
Russell, J. A., Suzuki, N., & Ishida, N. (1993). Canadian, Greek, andJapanese freely produced emotion labels for facial expressions. Motiva-tion and Emotion, 17, 337–351.
Scherer, K. (1992). What does facial expression express? In K. Strongman(Ed.), International review of studies on emotion (Vol. 2, pp. 139–165).Chichester, United Kingdom: Wiley.
Scherer, K., Matsumoto, D., Wallbott, H., & Kudoh, T. (1988). Emotionalexperience in cultural context: A comparison between Europe, Japan,and the USA. In K. Scherer (Ed.), Facets of emotion: Recent research.Hillsdale, NJ: Erlbaum.
Schlosberg, H. (1952). The description of facial expressions in terms oftwo dimensions. Journal of Experimental Psychology, 44, 229–237.
Shioiri, T., Someya, T., Helmeste, D., & Tang, S. W. (1999). Misinterpre-tation of facial expression: A cross-cultural study. Psychiatry and Clin-ical Neurosciences, 53, 45–50.
Tanako, Y., & Osaka, E. (1999). An unsupported common view: Compar-ing Japan and the U.S. on individualism/collectivism. Asian Journal ofSocial Psychology, 2, 311–341.
The Mathworks, Inc. (2002). Matlab optimization toolbox [computer soft-ware]. Natick, MA: The Mathworks, Inc.
Tomkins, S. S. (1962–1963). Affect, imagery, consciousness (Vols. 1–2).New York: Springer.
Tomkins, S. S., & McCarter, R. (1964). What and where are the primary affects?Some evidence for a theory. Perceptual and Motor Skills, 18, 119–158.
Triandis, H. (1995). Individualism and collectivism. Boulder, CO: West-view Press.
Turk, M., & Pentland, A. (1991). Eigenfaces for recognition. Journal ofCognitive Neuroscience, 3, 71–86.
Woodworth, R. S. (1938). Experimental psychology. New York: Holt.
Received March 9, 2009Revision received April 23, 2010
Accepted April 29, 2010 "
893CULTURAL DIFFERENCES IN FACIAL EXPRESSION