Embed Size (px)
Citation preview

Event Tracing for Windows (ETW)Uwe Hartmann
27.05.2013 1

ETW Classification/General
• ETW = tracing facility
• efficient, general purpose, holistic performance analysis
• kernel-level
• Purpose: Debugging, performance profiling, monitoring/logging
• Enable/Disable tracing: dynamically, (without application restart)
• Live production system analysis
• Originally developed for windows development performance analysis
27.05.2013 2

ETW Architecture Overview
27.05.2013 3Source:http://msdn.microsoft.com/en-us/magazine/cc163437.aspx

ETW Architecture Deep Dive
27.05.2013 4

Controller
• Any Process
• Functions• Start/stop Session• Configure Session
• Size/type/location of log file/process for real-time delivery
• Enable providers• Manage size of buffer pool• Resolution of time stamp• Verbosity, filtering• Update Session
• Obtain execution statistics of the Session• Number of events lost
27.05.2013 5

Session
• Record events from (multiple) providers. • Managing and flushing the buffers• Buffers per processor, in nonpaged pool kernel memory• Not statically tied to providers• Log to
• Disk• Memory• Real time delivery• Ring buffer …
• NT Kernel Logger Session• The NT Kernel Logger event tracing session records predefined system events
generated by the operating system, for example, disk IO or page fault events.
27.05.2013 6

Provider
• User-mode or kernel-mode
• for capturing log data
27.05.2013 7

Consumer
• Uses data collected by the sessions
• Can register callback for real-time consumption
• Reads recorded data from binary file
27.05.2013 8

Special Purpose Sessions
• Global Logger Session• The Global Logger event tracing session records events that occur early in the
operating system boot process, such as those generated by device drivers.
• Private Session• user-mode event tracing session that runs in the same process as its event
trace provider
27.05.2013 9

ETW Library
• Contained in Ntdll.dll
• Parts in ntoskrnl.dll
• ETW kernel-mode API• For drivers
• Mirror ETW Library principles, slightly different functions
• Completly Contained in ntoskrnl.dll
27.05.2013 10

Control Flow Kernel logging
Controller
• Enables providers
• Enables and configures session (Ntdll)
ETW (Ntdll)
• Calls NtTracwControl system call
ETW
(Kernel)
• Submits configuration to NT Kernel Logger Session
• If file logging, create writer system process
NT Kernel Logger Session
• Receives eventrecords to buffer
• File logging thread periodically writes out disk
27.05.2013 11
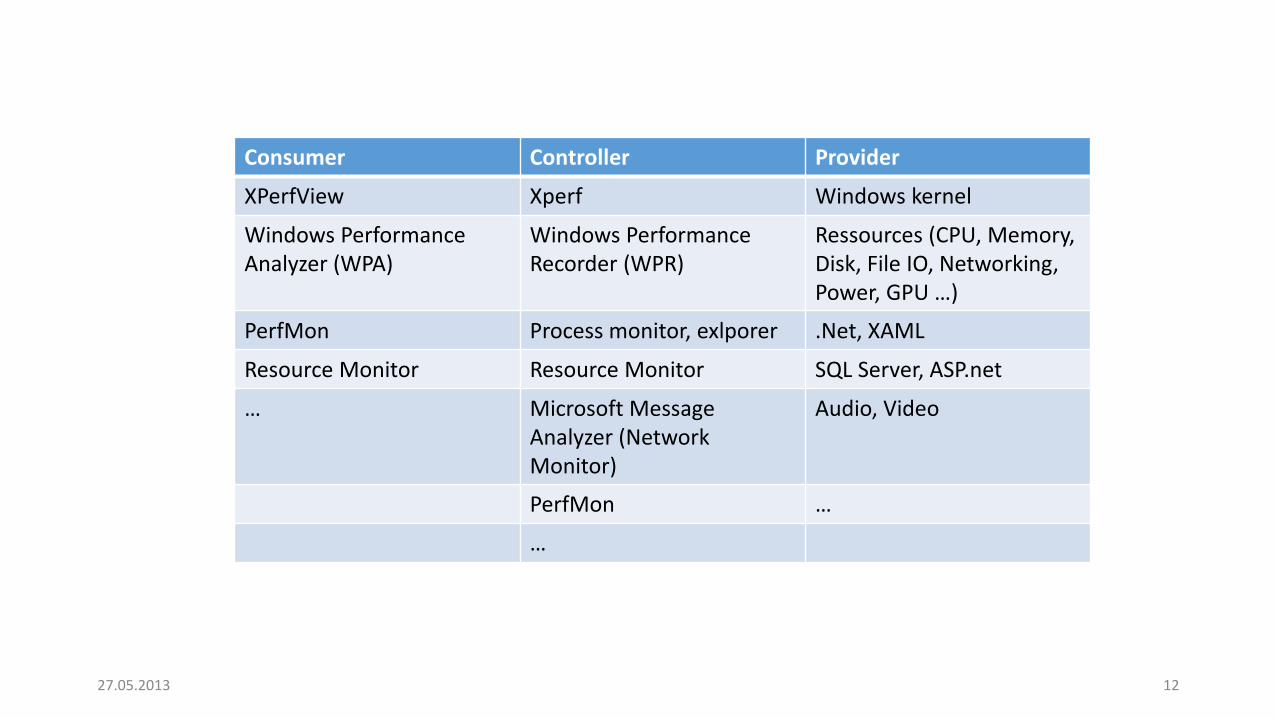
Consumer Controller Provider
XPerfView Xperf Windows kernel
Windows Performance Analyzer (WPA)
Windows Performance Recorder (WPR)
Ressources (CPU, Memory, Disk, File IO, Networking, Power, GPU …)
PerfMon Process monitor, exlporer .Net, XAML
Resource Monitor Resource Monitor SQL Server, ASP.net
… Microsoft Message Analyzer (Network Monitor)
Audio, Video
PerfMon …
…
27.05.2013 12

ETW vs. DTrace
13
Dtrace
• Application predefines places to log
• Probes
• D Language
• Selection and transformation at recording Time
• Can be dynamicallyenabled/disabled
• Low Overhead, usable forproduction enviromment, lockless
ETW
• Application predefines informationand places to log
• Events
• Static typed
• Selection and transformation at analysis Time
• Can be dynamicallyenabled/disabled
• Low Overhead, usable forproduction enviromment, lockless

Dropped Events
• Events to large
• Real-time consumer not fast enough
• When logging to file disk too slow
27.05.2013 14

Windows Performance Toolkit (WPR + WPR)
• Used within Microsoft to build Windows, Office etc.
Windows Performance Recorder ETW Controller
Windows Performance AnalyzerETW Consumer
27.05.2013 15

Powerpoint Demo
27.05.2013 16

Purpose
• Visual Studio Profiling Tools• During development in particular for CPU and memory issues
• EWT• For everything else in windows
• Pick your tool or write your own
• In particular for production environment profiling and debugging, operating system profiling
• Advanced issues
27.05.2013 17

Scenarios
• Debugging• Monitoring• Diagnosis• Capacity Planning
• Scanning• Delta Analysis• Statistical Analysis• State Machine and Resource Tracking• End-To-End Tracing
27.05.2013 18

End
1927.05.2013