Embed Size (px)
Citation preview

AFRL-AFOSR-VA-TR-2018-0433
Phase-Change on Nanoporous Graphene for Advanced Thermal management
Evelyn WangMASSACHUSETTS INSTITUTE OF TECHNOLOGY
Final Report11/28/2018
DISTRIBUTION A: Distribution approved for public release.
AF Office Of Scientific Research (AFOSR)/ RTB1Arlington, Virginia 22203
Air Force Research Laboratory
Air Force Materiel Command

REPORT DOCUMENTATION PAGE
Standard Form 298 (Rev. 8/98) Prescribed by ANSI Std. Z39.18
Form Approved OMB No. 0704-0188
The public reporting burden for this collection of information is estimated to average 1 hour per response, including the time for reviewing instructions, searching existing data sources, gathering and maintaining the data needed, and completing and reviewing the collection of information. Send comments regarding this burden estimate or any other aspect of this collection of information, including suggestions for reducing the burden, to Department of Defense, Washington Headquarters Services, Directorate for Information Operations and Reports (0704-0188), 1215 Jefferson Davis Highway, Suite 1204, Arlington, VA 22202-4302. Respondents should be aware that notwithstanding any other provision of law, no person shall be subject to any penalty for failing to comply with a collection of information if it does not display a currently valid OMB control number. PLEASE DO NOT RETURN YOUR FORM TO THE ABOVE ADDRESS.
1. REPORT DATE (DD-MM-YYYY) 2. REPORT TYPE 3. DATES COVERED (From - To)
4. TITLE AND SUBTITLE 5a. CONTRACT NUMBER
5b. GRANT NUMBER
5c. PROGRAM ELEMENT NUMBER
5d. PROJECT NUMBER
5e. TASK NUMBER
5f. WORK UNIT NUMBER
6. AUTHOR(S)
7. PERFORMING ORGANIZATION NAME(S) AND ADDRESS(ES) 8. PERFORMING ORGANIZATIONREPORT NUMBER
10. SPONSOR/MONITOR'S ACRONYM(S)
11. SPONSOR/MONITOR'S REPORTNUMBER(S)
9. SPONSORING/MONITORING AGENCY NAME(S) AND ADDRESS(ES)
12. DISTRIBUTION/AVAILABILITY STATEMENT
13. SUPPLEMENTARY NOTES
14. ABSTRACT
15. SUBJECT TERMS
16. SECURITY CLASSIFICATION OF:
a. REPORT b. ABSTRACT c. THIS PAGE
17. LIMITATION OFABSTRACT
18. NUMBEROFPAGES
19a. NAME OF RESPONSIBLE PERSON
19b. TELEPHONE NUMBER (Include area code)
DISTRIBUTION A: Distribution approved for public release.

INSTRUCTIONS FOR COMPLETING SF 298
1. REPORT DATE. Full publication date, including day, month, if available. Must cite at least the year and be Year 2000 compliant, e.g. 30-06-1998; xx-06-1998; xx-xx-1998. 2. REPORT TYPE. State the type of report, such as final, technical, interim, memorandum, master's thesis, progress, quarterly, research, special, group study, etc. 3. DATE COVERED. Indicate the time during which the work was performed and the report was written, e.g., Jun 1997 - Jun 1998; 1-10 Jun 1996; May - Nov 1998; Nov 1998. 4. TITLE. Enter title and subtitle with volume number and part number, if applicable. On classified documents, enter the title classification in parentheses. 5a. CONTRACT NUMBER. Enter all contract numbers as they appear in the report, e.g. F33315-86-C-5169. 5b. GRANT NUMBER. Enter all grant numbers as they appear in the report. e.g. AFOSR-82-1234. 5c. PROGRAM ELEMENT NUMBER. Enter all program element numbers as they appear in the report, e.g. 61101A. 5e. TASK NUMBER. Enter all task numbers as they appear in the report, e.g. 05; RF0330201; T4112. 5f. WORK UNIT NUMBER. Enter all work unit numbers as they appear in the report, e.g. 001; AFAPL30480105. 6. AUTHOR(S). Enter name(s) of person(s) responsible for writing the report, performing the research, or credited with the content of the report. The form of entry is the last name, first name, middle initial, and additional qualifiers separated by commas, e.g. Smith, Richard, J, Jr. 7. PERFORMING ORGANIZATION NAME(S) AND ADDRESS(ES). Self-explanatory.
8. PERFORMING ORGANIZATION REPORT NUMBER. Enter all unique alphanumeric report numbers assigned by the performing organization, e.g. BRL-1234; AFWL-TR-85-4017-Vol-21-PT-2. 9. SPONSORING/MONITORING AGENCY NAME(S) AND ADDRESS(ES). Enter the name and address of the organization(s) financially responsible for and monitoring the work. 10. SPONSOR/MONITOR'S ACRONYM(S). Enter, if available, e.g. BRL, ARDEC, NADC. 11. SPONSOR/MONITOR'S REPORT NUMBER(S). Enter report number as assigned by the sponsoring/ monitoring agency, if available, e.g. BRL-TR-829; -215. 12. DISTRIBUTION/AVAILABILITY STATEMENT. Use agency-mandated availability statements to indicate the public availability or distribution limitations of the report. If additional limitations/ restrictions or special markings are indicated, follow agency authorization procedures, e.g. RD/FRD, PROPIN, ITAR, etc. Include copyright information. 13. SUPPLEMENTARY NOTES. Enter information not included elsewhere such as: prepared in cooperation with; translation of; report supersedes; old edition number, etc. 14. ABSTRACT. A brief (approximately 200 words) factual summary of the most significant information. 15. SUBJECT TERMS. Key words or phrases identifying major concepts in the report. 16. SECURITY CLASSIFICATION. Enter security classification in accordance with security classification regulations, e.g. U, C, S, etc. If this form contains classified information, stamp classification level on the top and bottom of this page. 17. LIMITATION OF ABSTRACT. This block must be completed to assign a distribution limitation to the abstract. Enter UU (Unclassified Unlimited) or SAR (Same as Report). An entry in this block is necessary if the abstract is to be limited.
Standard Form 298 Back (Rev. 8/98)
DISTRIBUTION A: Distribution approved for public release.

Final report for
Grant FA9550-15-1-0310
Phase-Change on Nanoporous Graphene Membranes
for Advanced Thermal Management
Principal Investigator:
Prof. Evelyn N. Wang
Email: [email protected]
Submitted to: Dr. Ali Sayir
Email: [email protected]
November 24, 2018
DISTRIBUTION A: Distribution approved for public release.

Abstract
Evaporative cooling has the potential to address extreme heat fluxes expected in high performance
electronics, as it takes advantage of the enthalpy of vaporization. Despite being extensively studied for
decades, the fundamental understanding of evaporation, which is necessary for making full use of
evaporation, remains limited up to date. We designed and microfabricated an ultrathin nanoporous
membrane as an experimental platform to fundamentally probe the evaporation kinetics. Our nano device
consisted of an ultrathin free-standing membrane (~200 nm thick) containing an array of nanopores (pore
diameter ~100 nm). It realizes accurate and yet non-invasive interface temperature measurement, decouples
the interfacial transport resistance from the thermofluidic resistance in the liquid phase and the diffusion
resistance in the vapor phase, and mitigates the blockage risk of the liquid-vapor interface due to non-
evaporative contaminants. We utilized the kinetic theory with the Boltzmann transport equation to model
the evaporative transport. With both experiments and modeling, we demonstrated that the kinetic limit of
evaporation is determined by the pressure ratio between the vapor in the far field and that generated by the
interface. The improved fundamental understanding of evaporation that we gained indicates the significant
promise of utilizing an ultrathin nanoporous design to achieve high heat fluxes for evaporation in thermal
management, desalination, steam generation, and beyond.
Background and Concept
Evaporation is an effective cooling mechanism commonly found in nature and widely used in thermal
management of electronics as it takes advantage of the enthalpy of vaporization. Even for cooling solutions
such as pool boiling [1-5] and flow boiling [6-11], it is still evaporation that governs the transport process
at the interface level. Fundamental understanding of evaporation is necessary to fully exploit this phase
change phenomenon, which however remains limited despite decades of studies. Some critical experimental
challenges include: (1) realizing accurate and yet non-invasive interface temperature measurement; (2)
decoupling the interfacial transport resistance from the thermofluidic resistance in the liquid phase and the
diffusion resistance in the vapor phase; and (3) mitigating the blockage risk of the liquid-vapor interface
due to non-evaporative contaminants. Here, we developed a nano device consisting of an ultrathin free-
standing membrane (~200 nm thick) that contains an array of nanopores (pore diameter ~100 nm) to address
these issues.
The uncertainty in temperature measurement δT can be estimated as
L
T qk
= (1)
DISTRIBUTION A: Distribution approved for public release.
where q̇″ is the interfacial heat flux, k is the thermal conductivity of the working fluid, and ΔL is the
uncertainty in where the temperature measurement is taken. When q̇″ becomes higher, δT also increases.
When q̇″ = 100 W/cm2 and k = 0.6 W/m-K (for water), we obtain that ΔL < 3 μm is necessary for δT < 5 °C,
which has been difficult to achieve in previous work [12-17].
It is also necessary to minimize the transport resistance associated with the heat supply and liquid refilling.
Otherwise, it is not possible to reach a high flux across the interface. For example, Xiao et al. proposed a
nanoporous configuration [18] for evaporation studies, where ΔL was reduced to the pore radius (≈75 nm),
but their evaporative flux was still limited by the viscous loss in the refilling liquid flow along the pore due
to the large pore length (>50 μm). In addition, the evaporation rate is very sensitive to contamination in the
system. If the contaminants do not evaporate, the liquid-vapor interface accumulates the contaminants and
eventually clogs the pores.
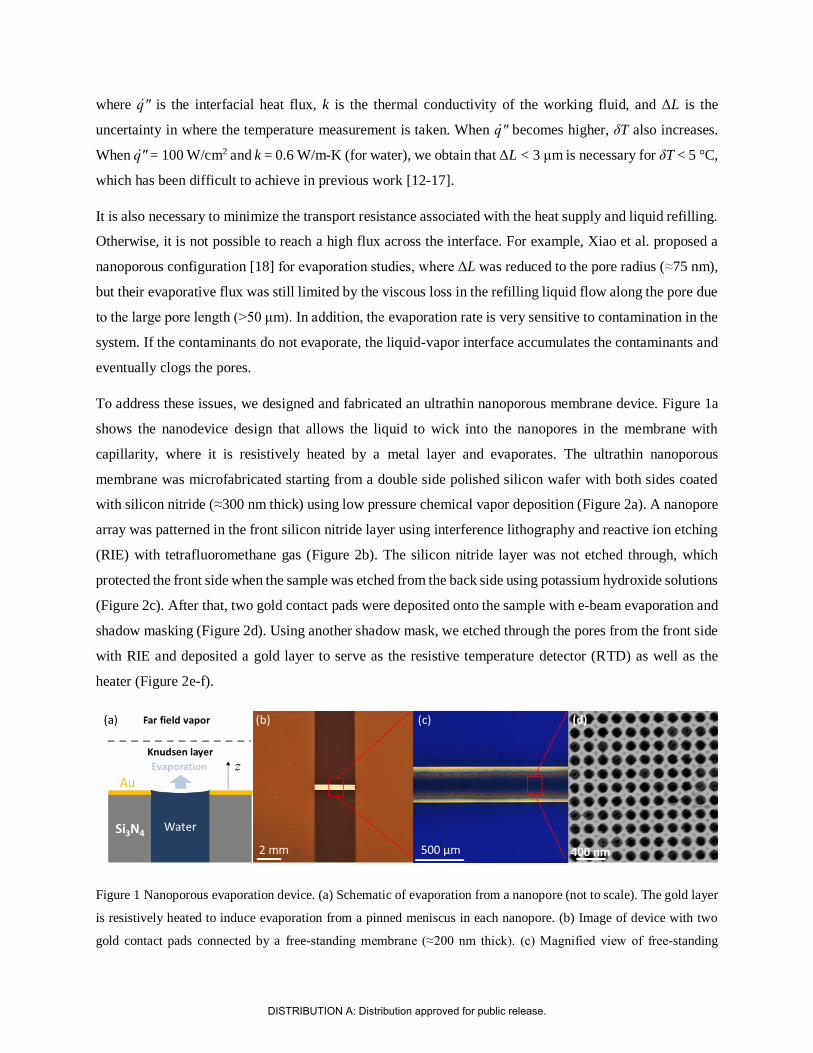
To address these issues, we designed and fabricated an ultrathin nanoporous membrane device. Figure 1a
shows the nanodevice design that allows the liquid to wick into the nanopores in the membrane with
capillarity, where it is resistively heated by a metal layer and evaporates. The ultrathin nanoporous
membrane was microfabricated starting from a double side polished silicon wafer with both sides coated
with silicon nitride (≈300 nm thick) using low pressure chemical vapor deposition (Figure 2a). A nanopore
array was patterned in the front silicon nitride layer using interference lithography and reactive ion etching
(RIE) with tetrafluoromethane gas (Figure 2b). The silicon nitride layer was not etched through, which
protected the front side when the sample was etched from the back side using potassium hydroxide solutions
(Figure 2c). After that, two gold contact pads were deposited onto the sample with e-beam evaporation and
shadow masking (Figure 2d). Using another shadow mask, we etched through the pores from the front side
with RIE and deposited a gold layer to serve as the resistive temperature detector (RTD) as well as the
heater (Figure 2e-f).
Figure 1 Nanoporous evaporation device. (a) Schematic of evaporation from a nanopore (not to scale). The gold layer
is resistively heated to induce evaporation from a pinned meniscus in each nanopore. (b) Image of device with two
gold contact pads connected by a free-standing membrane (≈200 nm thick). (c) Magnified view of free-standing
DISTRIBUTION A: Distribution approved for public release.

membrane where the central part is porous and coated with gold. (d) Scanning electron microscope image of the
nanoporous membrane with ≈140 nm diameter pores.
Figure 2 Schematics of the fabrication process. (a) Low pressure chemical vapor deposition of silicon nitride on both
sides of a double side polished silicon wafer. (b) Interference lithography on the front side to define nanoporous
patterns which were partially etched into the silicon nitride layer via RIE. (c) Back etching using potassium hydroxide
solutions with the front side protected due to the partial etch of the silicon nitride layer. (d) Contact pad deposition,
(e) through pore etching and (f) RTD/heater deposition with shadow masking.
In our previous report, we demonstrated the reliability of this research platform with diffusion limited
evaporation in air. We showed good agreement between experiments and the Maxwell-Stefan equation.
Here, to induce kinetically limited evaporation, the device was placed in an environmental chamber to
enable controlled vapor temperature and pressure of the far field (Figure 3a-b). A custom test fixture
interfaced the device to the liquid ports and electrical connections, while facilitating visualization of the
membrane surface during operation (Figure 3c). Deionized water was used as the working fluid. We
characterized evaporation with three ambient vapor pressures: P∞ = 2.643 kPa, 4.935 kPa, and 10.428 kPa,
and the associated saturation temperatures are T∞ = 22.0 °C, 32.6 °C, and 46.6 °C, respectively.
The environmental chamber that we used in this study was equipped with liquid feedthroughs, electrical
feedthroughs, thermocouple feedthroughs, viewports, and pressure transducers (Figure 4a). It was
connected to a rotary vane vacuum pump and a boiling canister which was used as the liquid reservoir tank
in the current work (Figure 4b). Prior to the experiments, the liquid reservoir tank was filled with deionized
water (Water for HPLC, Sigma-Aldrich) and then heated to > 100 °C for thermal degassing. The liquid
reservoir was subsequently sealed from the ambient. Meanwhile, we calibrated the RTD to an industrial
temperature sensor (P-L-A-1/4-6-1/4-T-6, Omega) in a convection oven. During the experiments, the
environmental chamber was first pumped down to <0.5 Pa (confirmed by 925 Micro Pirani™ vacuum
transducer, MKS) and then backfilled with pure water vapor from the reservoir. The vapor pressure in the
DISTRIBUTION A: Distribution approved for public release.

far field was regulated by the chamber wall temperature and measured by a capacitance pressure transducer
(740C Baratron® Manometer, MKS). We waited ~30 min to ensure that the vapor ambient reached a steady
state. Using a peristaltic pump (UX-77921-77, Masterflex), we supplied liquid to the sample with the inlet
flow rate maintained at 1 mL/min. We applied a four-point method to measure the total Joule heating power
and obtain the interface temperature from the RTD.
Figure 3 Experimental setup. (a) Schematic showing device placed in a custom test fixture in an environmental
chamber which allows for liquid feedthrough, electrical connection, and visualization. (b) Image of the experimental
setup. (c) Top-down image of the nanoporous membrane device during an experiment.
Figure 4 (a) Environmental chamber that provides the pure vapor ambient (b) Boiling canister used as the liquid
reservoir tank.
The measurements in this study were conducted in such a way that a set temperature was maintained. After
setting the heating power to a higher value, the membrane temperature would increase, resulting in more
DISTRIBUTION A: Distribution approved for public release.

intense evaporation at the interface. This served as a feedback loop as the cooling rate also increased. When
the cooling rate matched the heating power, the system reached a steady state. We recorded the temperature
and the heating power after maintaining the steady state for one minute. On the other hand, due to the
ultralow thermal mass of the membrane, the thermal time constant τ was very small:
pmc
UA = (2)
where m is the mass of the membrane, cp is its specific heat, A is the interface area ,and U is the overall heat
transfer coefficient. In our setup, m < 10-8 kg, cp < 2 J/g-K, and UA ≫ C, such that τ < 0.01 s. The heating
power in the experiment was limited by the onset of nucleation in the superheated liquid beneath the
membrane. Throughout the experiment, the uncertainty in vapor pressure measurement was ±138 Pa and
the error of the interface temperature measurement was ±0.52 K.
Figure 5 Experimental results of interfacial heat flux q̇″ as a function of temperature rise ΔT for select ambient
temperatures. The green crosses represent the results from evaporation into an air ambient reported in our previous
work [19], and the red triangles, blue squares, and orange circles are the evaporation data in the present study of
evaporation into a vapor ambient for T∞ = 22.0 °C, 32.6 °C, and 46.6 °C, respectively. The error bars in q̇″ were
smaller than the symbol size and generally less than 2%. The dashed lines are used to guide the eyes.
Figure 5 shows the interfacial heat flux q̇″ as a function of the temperature difference between the membrane
and the ambient ΔT for a few different working conditions. The green crosses represent the results from
evaporation in an air ambient, as also reported in our previous work [19]. The red triangles, blue squares,
and orange circles are the experimental data in the present study of vapor ambient evaporation for T∞ =
22.0 °C, 32.6 °C, and 46.6 °C, respectively. Comparing the red triangles to the green crosses, we note that
DISTRIBUTION A: Distribution approved for public release.

for similar far field vapor temperatures, the heat transfer coefficient (h = q̇″ / ΔT) associated with
evaporation into vapor is much higher than that in the air, because the former is kinetically limited and the
latter is diffusion limited. Moreover, among different working conditions for evaporation into vapor, h
increases significantly as T∞ increases. Based on Eqs. (3) and (4), a larger ρ0usΔhlv leads to more efficient
evaporative heat transfer, which explains that h becomes larger for higher T∞ as ρ0 increases sharply with
temperature.
Theoretically, the interfacial heat transfer has been modeled by the Boltzmann Transport Equation (BTE)
which governs the evolution of distribution functions of vapor molecules in the Knudsen layer [20, 21].
Moment solutions [22, 23], semi-analytical results [20, 24] as well as numerical solutions [25] of the BTE
have been reported for the Knudsen layer problem which can be characterized by the following three
parameters: PK/P0, TK/T0, and MK. Here, PK, TK, and MK are the pressure, temperature, and Mach number
of the vapor adjacent to the Knudsen layer, respectively, and P0 and T0 are the pressure and temperature of
the vapor in equilibrium with the liquid. A key finding from previous studies [22-25] is that one of these
three parameters uniquely determines the other two. Based on this result, the interfacial heat flux q̇″ can be
nondimensionlized as
0 s lv
u h
=
(3)
where ρ0 is the density of vapor in equilibrium with the liquid, us is in the vapor sonic speed evaluated at
T0, Δhlv is the enthalpy difference between two phases. Accordingly, we show that q̇̇̅ ″ is a function of the
above three parameters, and thus can be determined from any one of them. As a result,
0
Pq f
P
=
(4)
where ΔP = PK – P∞. In this form, ΔP/P0 can be considered as the dimensionless driving potential with q̇̇̅ ″
being the dimensionless flux. This nondimensionalization scheme is generally applicable to any kinetically
limited evaporation.
To obtain the explicit form of f in Eq.(4), we consider the boundary condition of BTE at the liquid-vapor
interface, which is set by the evaporation coefficient and condensation coefficient (σe and σc) [25-27]. At
equilibrium conditions, σe = σc [28]. We carried on this equality in our analysis as the Knudsen layer can
be considered in near equilibrium for q̇̇̅ ″≪1, where q̇̇̅ ″ can also be interpreted as a flux-based Mach number.
Given σe and σc, we solved the BTE in the Knudsen layer using the Direct Simulation Monte Carlo (DSMC)
method [29], with the variable soft sphere collision model [30] and the Borgnakke-Larsen method [31] to
DISTRIBUTION A: Distribution approved for public release.

account for the temperature dependent properties and internal degrees of freedom of water molecules.
Previous theoretical studies mostly assumed the molecules to be monatomic, but more recently, Frezzotti
[25, 32] showed significant differences of evaporation kinetics between polyatomic molecules and
monatomic ones. This signifies the effect of the internal degrees of freedom of vapor molecules, which has
generally not been properly considered in previous works when interpreting experimental data.
Figure 6 shows the collapse of our results in both experiments and DSMC modeling with water, when
plotting q̇̇̅ ″ as a function of ΔP/P0 for different working conditions. The red triangles, blue squares, and
orange circles represent the experimental data in a vapor ambient from Figure 5, where we approximated
PK as P∞ (which is more experimentally accessible) since q̇̇̅ ″ ≪ 1, based on continuum gas dynamics [22,
33]. The dashed lines represent the least-square fit of the DSMC calculation, which gives σe = σc = 0.32±0.04.
Molecular dynamics simulations of water generally yielded σe and σc on the same order of magnitude.
Although various values have been reported [34-36], which might be due to different intermolecular
potential models used, the simulation results generally suggest no significant variation of σe and σc for the
temperature range that we considered. Previous experimental studies, on the other hand, reported σe and σc
across three different orders of magnitude (0.002-1) [37]. Restricting the comparison to the studies with
dynamically renewing interfaces [37-41], the results become more similar to the current work (0.1-1),
indicating contamination could be a severe challenge in many previous studies. There are several transient
evaporation studies with liquid water exposed to vacuum, which simplifies the vapor transport into the free
molecular flow. Hickman [38] studied evaporation into vacuum from falling water, with only bulk liquid
temperature measurement using thermocouples and obtained σe = 0.254-0.532. More recently, Smith et al.
used Raman thermometry to probe the surface temperature of evaporating water droplet in vacuum and
reported σe = 0.62 ± 0.09. However, their thermal model did not account for the size change of the droplet
and the large Biot number of the droplet, which makes it difficult to interpret their results. For vapor ambient
studies, Narusawa and Springer [42] measured the evaporation rate of water in a cylindrical container in a
vacuum chamber, determined the interface temperature with thermal radiation, and reported σe = 0.19.
Nevertheless, the Schrage model that they used is known to overpredict the interfacial flux due to violation
of momentum and energy conservation [43], which means their σe should be higher than what they reported.
Kobayashi et al. [44] reported σc = 0.71-0.84 with shock tube experiments and numerical simulations of the
Gaussian-BGK Boltzmann equation. Since their model did not account for the energy exchange due to the
rotational modes of water molecules and underpredicted the interfacial heat flux, their σc should in fact be
smaller than what they reported. In general, even though the present work obtains similar σe and σc
compared to many previous studies, it represents quite different interfacial heat transfer as the Knudsen
layer non-equilibrium and internal degrees of freedom of water molecules were generally not properly taken
into account when interpreting the experimental data in prior works.
DISTRIBUTION A: Distribution approved for public release.

Figure 6 Dimensionless interfacial flux q̇̇̅ ″ as a function the dimensionless driving potential ΔP/P0. The red triangles,
blue squares, and orange circles represent the experimental data in the present study for T∞ = 22.0 °C, 32.6 °C, and
46.6 °C, respectively. The black dashed line is from the DSMC modeling result with σe = σc = 0.32. The error bars in
q̇̇̅ ″ are smaller than the symbol size.
Fundamentally, our work elucidates the unifying relationship between the flux and the driving potential for
evaporation in a dimensionless form. More practically, when designing an evaporative system, we can now
consider ρ0usΔhlv in Eq.(3) as the figure of merit of interfacial heat transfer, which assists in choosing the
working conditions and fluid. Our ultrathin nanoporous configuration provides an example of
simultaneously minimizing thermal resistance and viscous loss while generating high capillary pressure.
This work offers insights that can improve the performance of membrane-based cooling [45, 46], steam
generation [47], and desalination [48] devices.
Publications
The publications listed below represent papers, reports, and theses supported in whole or in part by the Air
Force Office of Scientific Research under Grant FA9550-15-1-0310.
1. Z. Lu, I. Kinefuchi, K.L. Wilke, G. Vaartstra, E.N. Wang, “Probing Kinetically Limited
Evaporation,” Physical Review Letters (under review).
2. K.L. Wilke, D.J. Preston, Z. Lu, E. N. Wang, "Condensation-Resistant Omniphobic Surfaces,”
ACS Nano (under review).
3. D.J. Preston, K.L. Wilke, Z. Lu, S.S. Cruz, Y. Zhao, L.L. Becerra, E.N. Wang, "Gravitationally-
Driven Wicking for Enhanced Condensation Heat Transfer," Langmuir, 34(15), 2018.
4. D.J. Preston, Z. Lu, Y. Song, Y. Zhao, K.L. Wilke, D.S. Antao, M. Louis, E.N. Wang, "Heat
Transfer Enhancement During Water and Hydrocarbon Condensation on Lubricant Infused
Surfaces," Scientific Reports, 8(540), 2018.
DISTRIBUTION A: Distribution approved for public release.

5. Y. Zhao, D.J. Preston, Z. Lu, L. Zhang, J. Queeney, E.N. Wang, "Effects of millimetric geometric
features on dropwise condensation under different vapor conditions," International Journal of Heat
and Mass Transfer, 119, 2018.
6. D.J. Preston, Y. Song, Z. Lu, D.S. Antao, E.N. Wang, "Design of lubricant infused surfaces," ACS
Applied Materials and Interfaces, 9(48), 2017.
7. K.L. Wilke, B. Barabadi, Z. Lu, T. Zhang, E.N. Wang, "Parametric study of thin film evaporation
from nanoporous membranes," Applied Physics Letters, 111(17), 2017.
8. Z. Lu, K.L. Wilke, D.J. Preston, I. Kinefuchi, E. Chang-Davidson, E.N. Wang, "An Ultra-Thin
Nanoporous Membrane Evaporator," Nano Letters, 17(10), 2017.
9. Z. Lu*, D.J. Preston*, D.S. Antao, Y. Zhu, E.N. Wang, "Coexistence of pinning and moving on a
contact line," Langmuir, 33(36), 2017. *equal contribution
References
[1] Jaikumar, A., and Kandlikar, S., 2016, "Pool boiling enhancement through bubble induced convective
liquid flow in feeder microchannels," Appl. Phys. Lett., 108(4), p. 041604.
[2] Cho, H. J., Mizerak, J. P., and Wang, E. N., 2015, "Turning bubbles on and off during boiling using
charged surfactants," Nature communications, 6, p. 8599.
[3] Chu, K.-H., Enright, R., and Wang, E. N., 2012, "Structured surfaces for enhanced pool boiling heat
transfer," Appl. Phys. Lett., 100(24), p. 241603.
[4] Chu, K.-H., Soo Joung, Y., Enright, R., Buie, C. R., and Wang, E. N., 2013, "Hierarchically structured
surfaces for boiling critical heat flux enhancement," Appl. Phys. Lett., 102(15), p. 151602.
[5] Kandlikar, S., 2013, "Controlling bubble motion over heated surface through evaporation momentum
force to enhance pool boiling heat transfer," Appl. Phys. Lett., 102(5), p. 051611.
[6] Kuo, C.-J., and Peles, Y., 2008, "Flow boiling instabilities in microchannels and means for mitigation
by reentrant cavities," J. Heat Transfer, 130(7), p. 072402.
[7] Zhu, Y., Antao, D. S., Chu, K.-H., Chen, S., Hendricks, T. J., Zhang, T., and Wang, E. N., 2016, "Surface
structure enhanced microchannel flow boiling," J. Heat Transfer, 138(9), p. 091501.
[8] Zhu, Y., Antao, D. S., Zhang, T., and Wang, E. N., 2016, "Suppressed Dry-out in Two-Phase
Microchannels via Surface Structures," J. Heat Transfer, 138(8), p. 080905.
[9] Zhu, Y., Antao, D. S., Bian, D. W., Rao, S. R., Sircar, J. D., Zhang, T., and Wang, E. N., 2017,
"Suppressing high-frequency temperature oscillations in microchannels with surface structures," Appl.
Phys. Lett., 110(3), p. 033501.
[10] Yang, F., Dai, X., Peles, Y., Cheng, P., Khan, J., and Li, C., 2014, "Flow boiling phenomena in a single
annular flow regime in microchannels (I): Characterization of flow boiling heat transfer," Int. J. Heat Mass
Transfer, 68, pp. 703-715.
[11] Zhu, Y., Antao, D. S., Lu, Z., Somasundaram, S., Zhang, T., and Wang, E. N., 2016, "Prediction and
Characterization of Dry-out Heat Flux in Micropillar Wick Structures," Langmuir, 32(7), pp. 1920-1927.
[12] Boelter, L., Gordon, H., and Griffin, J., 1946, "Free evaporation into air of water from a free horizontal
quiet surface," Industrial & Engineering Chemistry, 38(6), pp. 596-600.
[13] Kingdon, K. H., 1965, "Influence of ambient gases on the rate of evaporation of water," Nature,
206(4989), pp. 1148-1148.
[14] Pauken, M. T., 1998, "An experimental investigation of combined turbulent free and forced
evaporation," Exp. Therm Fluid Sci., 18(4), pp. 334-340.
[15] Saylor, J., Smith, G., and Flack, K., 2001, "An experimental investigation of the surface temperature
field during evaporative convection," PhFl, 13(2), pp. 428-439.
[16] Ward, C., and Stanga, D., 2001, "Interfacial conditions during evaporation or condensation of water,"
PhRvE, 64(5), p. 051509.
DISTRIBUTION A: Distribution approved for public release.

[17] Lu, Z., Preston, D. J., Antao, D. S., Zhu, Y., and Wang, E. N., 2017, "Coexistence of pinning and
moving on a contact line," Langmuir.
[18] Xiao, R., Maroo, S. C., and Wang, E. N., 2013, "Negative pressures in nanoporous membranes for thin
film evaporation," Appl. Phys. Lett., 102(12), p. 123103.
[19] Lu, Z., Wilke, K. L., Preston, D. J., Kinefuchi, I., Chang-Davidson, E., and Wang, E. N., 2017, "An
Ultrathin Nanoporous Membrane Evaporator," Nano Lett., 17(10), pp. 6217-6220.
[20] Sone, Y., 2000, "Kinetic theoretical studies of the half-space problem of evaporation and
condensation," TTSP, 29(3-5), pp. 227-260.
[21] Pao, Y. p., 1971, "Application of kinetic theory to the problem of evaporation and condensation," The
Physics of Fluids, 14(2), pp. 306-312.
[22] Ytrehus, T., 1997, "Molecular-flow effects in evaporation and condensation at interfaces," Multiphase
Science and Technology, 9(3).
[23] Labuntsov, D., and Kryukov, A., 1979, "Analysis of intensive evaporation and condensation," Int. J.
Heat Mass Transfer, 22(7), pp. 989-1002.
[24] Siewert, C., and Thomas Jr, J., 1973, "Half‐space problems in the kinetic theory of gases," The Physics
of Fluids, 16(9), pp. 1557-1559.
[25] Frezzotti, A., 2011, "Boundary conditions at the vapor-liquid interface," PhFl, 23(3), p. 030609.
[26] Sone, Y., Takata, S., and Golse, F., 2001, "Notes on the boundary conditions for fluid-dynamic
equations on the interface of a gas and its condensed phase," PhFl, 13(1), pp. 324-334.
[27] Meland, R., Frezzotti, A., Ytrehus, T., and Hafskjold, B., 2004, "Nonequilibrium molecular-dynamics
simulation of net evaporation and net condensation, and evaluation of the gas-kinetic boundary condition
at the interphase," PhFl, 16(2), pp. 223-243.
[28] Lu, Z., Narayanan, S., and Wang, E. N., 2015, "Modeling of Evaporation from Nanopores with
Nonequilibrium and Nonlocal Effects," Langmuir, 31(36), pp. 9817-9824.
[29] Bird, G. A., 1976, "Molecular gas dynamics," STIA, 76.
[30] Koura, K., and Matsumoto, H., 1992, "Variable soft sphere molecular model for air species," Physics
of Fluids A: Fluid Dynamics, 4(5), pp. 1083-1085.
[31] Borgnakke, C., and Larsen, P. S., 1975, "Statistical collision model for Monte Carlo simulation of
polyatomic gas mixture," J. Comput. Phys., 18(4), pp. 405-420.
[32] Frezzotti, A., 2007, "A numerical investigation of the steady evaporation of a polyatomic gas,"
European Journal of Mechanics-B/Fluids, 26(1), pp. 93-104.
[33] Kundu, P. K., Cohen, I. M., and Dowling, D., 2008, "Fluid Mechanics 4th," Elsevier.
[34] Yang, T., and Pan, C., 2005, "Molecular dynamics simulation of a thin water layer evaporation and
evaporation coefficient," Int. J. Heat Mass Transfer, 48(17), pp. 3516-3526.
[35] Tsuruta, T., and Nagayama, G., 2004, "Molecular dynamics studies on the condensation coefficient of
water," The Journal of Physical Chemistry B, 108(5), pp. 1736-1743.
[36] Ishiyama, T., Yano, T., and Fujikawa, S., 2004, "Molecular dynamics study of kinetic boundary
condition at an interface between a polyatomic vapor and its condensed phase," PhFl, 16(12), pp. 4713-
4726.
[37] Marek, R., and Straub, J., 2001, "Analysis of the evaporation coefficient and the condensation
coefficient of water," Int. J. Heat Mass Transfer, 44(1), pp. 39-53.
[38] Hickman, K., 1954, "Maximum evaporation coefficient of water," Industrial & Engineering Chemistry,
46(7), pp. 1442-1446.
[39] Lee, J., Laoui, T., and Karnik, R., 2014, "Nanofluidic transport governed by the liquid/vapour
interface," Nature nanotechnology, 9(4), p. 317.
[40] Wilke, K. L., Barabadi, B., Lu, Z., Zhang, T., and Wang, E. N., 2017, "Parametric study of thin film
evaporation from nanoporous membranes," Appl. Phys. Lett., 111(17), p. 171603.
[41] Smith, J. D., Cappa, C. D., Drisdell, W. S., Cohen, R. C., and Saykally, R. J., 2006, "Raman
thermometry measurements of free evaporation from liquid water droplets," J. Am. Chem. Soc., 128(39),
pp. 12892-12898.
[42] Narusawa, U., and Springer, G. S., 1975, "Measurements of evaporation rates of water."
DISTRIBUTION A: Distribution approved for public release.
[43] Barrett, J., and Clement, C., 1992, "Kinetic evaporation and condensation rates and their coefficients,"
J. Colloid Interface Sci., 150(2), pp. 352-364.
[44] Kobayashi, K., Watanabe, S., Yamano, D., Yano, T., and Fujikawa, S., 2008, "Condensation
coefficient of water in a weak condensation state," FlDyR, 40(7), pp. 585-596.
[45] Narayanan, S., Fedorov, A. G., and Joshi, Y. K., 2009, "Gas-assisted thin-film evaporation from
confined spaces for dissipation of high heat fluxes," Nanoscale and Microscale Thermophysical
Engineering, 13(1), pp. 30-53.
[46] Hanks, D. F., Lu, Z., Sircar, J., Salamon, T. R., Antao, D. S., Bagnall, K. R., Barabadi, B., and Wang,
E. N., 2018, "Nanoporous membrane device for ultra high heat flux thermal management," Microsystems
& Nanoengineering, 4(1), p. 1.
[47] Ghasemi, H., Ni, G., Marconnet, A. M., Loomis, J., Yerci, S., Miljkovic, N., and Chen, G., 2014,
"Solar steam generation by heat localization," Nature communications, 5, p. ncomms5449.
[48] Zhou, L., Tan, Y., Wang, J., Xu, W., Yuan, Y., Cai, W., Zhu, S., and Zhu, J., 2016, "3D self-assembly
of aluminium nanoparticles for plasmon-enhanced solar desalination," Nature Photonics, 10(6), p. 393.
DISTRIBUTION A: Distribution approved for public release.