Embed Size (px)
Citation preview

Report Number: FEP‐07‐10
Evaluation of Various Hot Mix Asphalt Pavement Thicknesses over Rubblized Concrete Pavement
FINAL REPORT
July 2010

Evaluation of Various Hot Mix Asphalt Pavement Thicknesses over Rubblized Concrete Pavement
Research Study # WI‐93‐06a
FINAL REPORT
Report # FEP‐07‐10
Prepared by:
Irene K. Battaglia, M.S. Engineering Research Consultant
Construction and Materials Support Center, UW‐Madison
WisDOT Contact:
Barry Paye, P.E. Pavement Research and Warranty Engineer
Wisconsin Department of Transportation Division of Transportation System Development
Bureau of Technical Services Materials Management Section
Foundation and Pavements Engineering Unit 3502 Kinsman Blvd, Madison, WI 53704
July 2010
This study was conducted by the Materials Management Section, Bureau of Technical Services, Division of Transportation System Development, of the Wisconsin Department of Transportation. The Federal Highway Administration provided financial and technical assistance for this research activity. This publication does not
endorse or approve any commercial product even though trade names may be cited, does not necessarily reflect official views or policies of the agency, and does not constitute a standard, specification or regulation.
Page i

Technical Documentation Page
1. Report No. FEP‐07‐10 2. Government Accession No. 3. Recipients Catalog No.
4. Title and Subtitle Evaluation of Various Hot Mix Asphalt Pavement Thicknesses over Rubblized Concrete Pavement
5. Report Date July 2010
6. Performing Organization CodeWisDOT Research Study # WI‐93‐06a
7. Author WisDOT ContactIrene K. Battaglia Barry Paye
8. Performing Organization ReportWisDOT Research Report FEP‐07‐10
9. Performing Organization Name and Address Wisconsin Department of Transportation Division of Transportation System Development, Bureau of Technical Services Materials Management Section, Foundation and Pavements Engineering Unit 3502 Kinsman Blvd., Madison, WI 53704
10. Work Unit No. (TRAIS)
12. Sponsoring Agency Name and Address Wisconsin Department of Transportation Division of Transportation System Development, Bureau of Technical Services Materials Management Section, Foundation and Pavements Engineering Unit 3502 Kinsman Blvd., Madison, WI 53704
13. Type of Report and Period CoveredFinal Report, 1999‐2010
14. Sponsoring Agency CodeWisDOT Research Study # WI‐93‐06a
15. Supplementary Notes Visit http://on.dot.wi.gov/wisdotresearch/compresprojs.htm for a PDF file of this and other research reports.
16. Abstract In 1999, the Wisconsin DOT constructed two test sections as part of a rubblized PCC pavement project on I‐39 to evaluate whether
increased HMA thickness could extend the pavement system's service life. Design thicknesses of the control and test sections 1 and
2 were 6.75, 8.5 and 10.25 inches, respectively. The actual paved thicknesses were 7.3, 8.4 and 9.8 inches, respectively. The project
included installation of edge drains after the completion of rubblization.
FWD testing showed that the thicker pavement sections had lower strain at the bottom of the HMA layer under a 9.5‐kip test load.
On average, a 1.0‐in increase in HMA thickness resulted in a 3x10‐6 strain reduction. The highest strain that occurred at the 9.5‐kip
load level, calculated in the control section with a pavement temperature of 71°F, was 56x10‐6. This strain level is lower than the
commonly accepted endurance limit range of 70x 10‐6 to 100x10‐6, indicating that even the thinnest pavement section would provide
adequate fatigue protection. Automated and visual performance surveys showed that a greater level of distress (transverse cracking)
was present in the control section after 11 years in service indicating that the thicker pavement sections delayed distress formation.
A series of LCCAs showed that an unrealistic extension of service life would be required for additional HMA thickness to be cost‐
effective. Although distress formation was delayed and a small strain reduction resulted from increased HMA thickness in the test
sections, these relatively small gains do not justify the increase in construction and material costs. The study results suggest that
additional HMA thickness is not necessary for long‐term performance and is likely not a cost‐effective method of extending a
rubblized pavement system's service life.
17. Key Words Rubblized PCC pavement, HMA pavement, FWD testing, strain measurement
18. Distribution Statement Distribution unlimited, approved for public release
19. Security Classification (of this report) Unclassified
20. Security Classification (of this page) Unclassified
21. No. of Pages 45
22. Price
Page ii
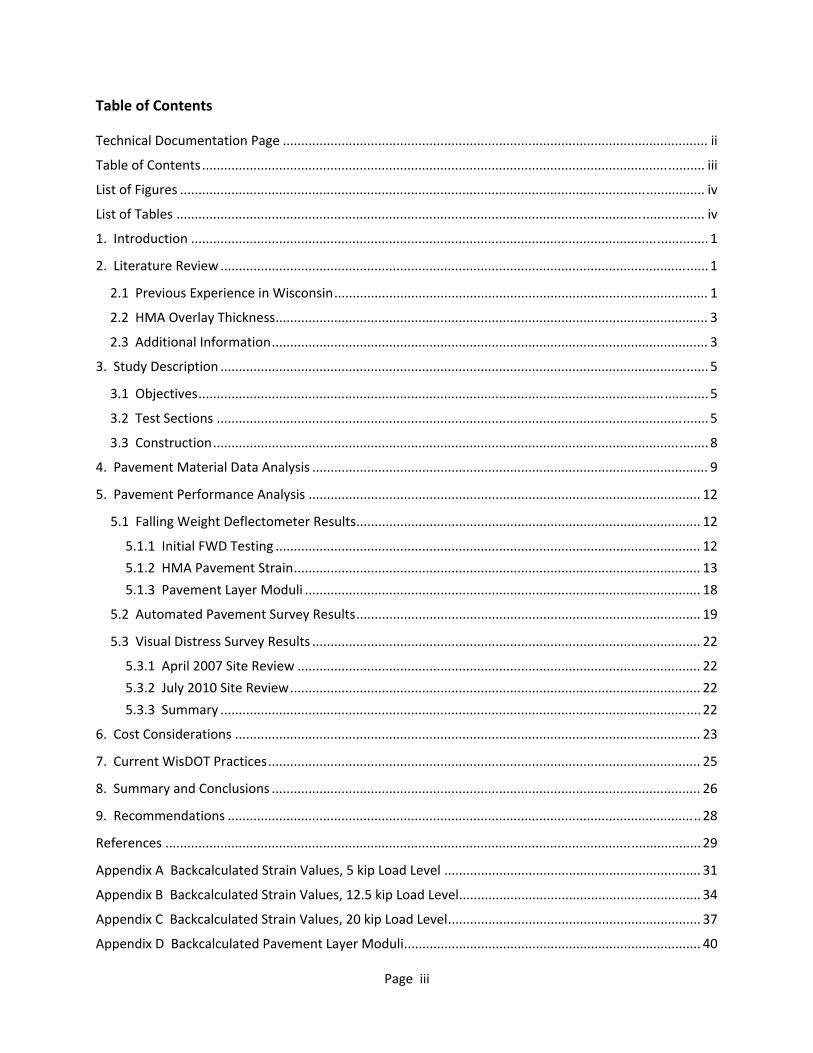
Table of Contents
Technical Documentation Page .................................................................................................................... ii
Table of Contents ......................................................................................................................................... iii
List of Figures ............................................................................................................................................... iv
List of Tables ................................................................................................................................................ iv
1. Introduction ............................................................................................................................................. 1
2. Literature Review ..................................................................................................................................... 1
2.1 Previous Experience in Wisconsin ...................................................................................................... 1
2.2 HMA Overlay Thickness ...................................................................................................................... 3
2.3 Additional Information ....................................................................................................................... 3
3. Study Description ..................................................................................................................................... 5
3.1 Objectives ........................................................................................................................................... 5
3.2 Test Sections ...................................................................................................................................... 5
3.3 Construction ....................................................................................................................................... 8
4. Pavement Material Data Analysis ............................................................................................................ 9
5. Pavement Performance Analysis ........................................................................................................... 12
5.1 Falling Weight Deflectometer Results .............................................................................................. 12
5.1.1 Initial FWD Testing .................................................................................................................... 12
5.1.2 HMA Pavement Strain ............................................................................................................... 13
5.1.3 Pavement Layer Moduli ............................................................................................................ 18
5.2 Automated Pavement Survey Results .............................................................................................. 19
5.3 Visual Distress Survey Results .......................................................................................................... 22
5.3.1 April 2007 Site Review .............................................................................................................. 22
5.3.2 July 2010 Site Review ................................................................................................................ 22
5.3.3 Summary ................................................................................................................................... 22
6. Cost Considerations ............................................................................................................................... 23
7. Current WisDOT Practices ...................................................................................................................... 25
8. Summary and Conclusions ..................................................................................................................... 26
9. Recommendations ................................................................................................................................. 28
References .................................................................................................................................................. 29
Appendix A Backcalculated Strain Values, 5 kip Load Level ...................................................................... 31
Appendix B Backcalculated Strain Values, 12.5 kip Load Level .................................................................. 34
Appendix C Backcalculated Strain Values, 20 kip Load Level ..................................................................... 37
Appendix D Backcalculated Pavement Layer Moduli ................................................................................. 40
Page iii

Page iv
List of Figures
Figure 1. Test section location: (a) Portage County; (b) area of test sections on I‐39 northbound. .......... 6
Figure 2. Test section description: (top) plan view; (bottom) pavement profile. ....................................... 7
Figure 3. Diametral resilient modulus values for surface layer mixture. ................................................... 10
Figure 4. Diametral resilient modulus values for lower layer mixture. ..................................................... 10
Figure 5. Fatigue curve for lower layer mixture. ........................................................................................ 11
Figure 6. Modulus of subgrade reaction values for rubblization project. ................................................. 13
Figure 7. Strain data backcalculated from June 22, 2000 FWD test results, 9.5‐kip load. ......................... 15
Figure 8. Strain data backcalculated from October 22, 2001 FWD test results, 9.5‐kip load. ................... 16
Figure 9. Strain data backcalculated from September 4, 2002 FWD test results, 9.5‐kip load. ................ 16
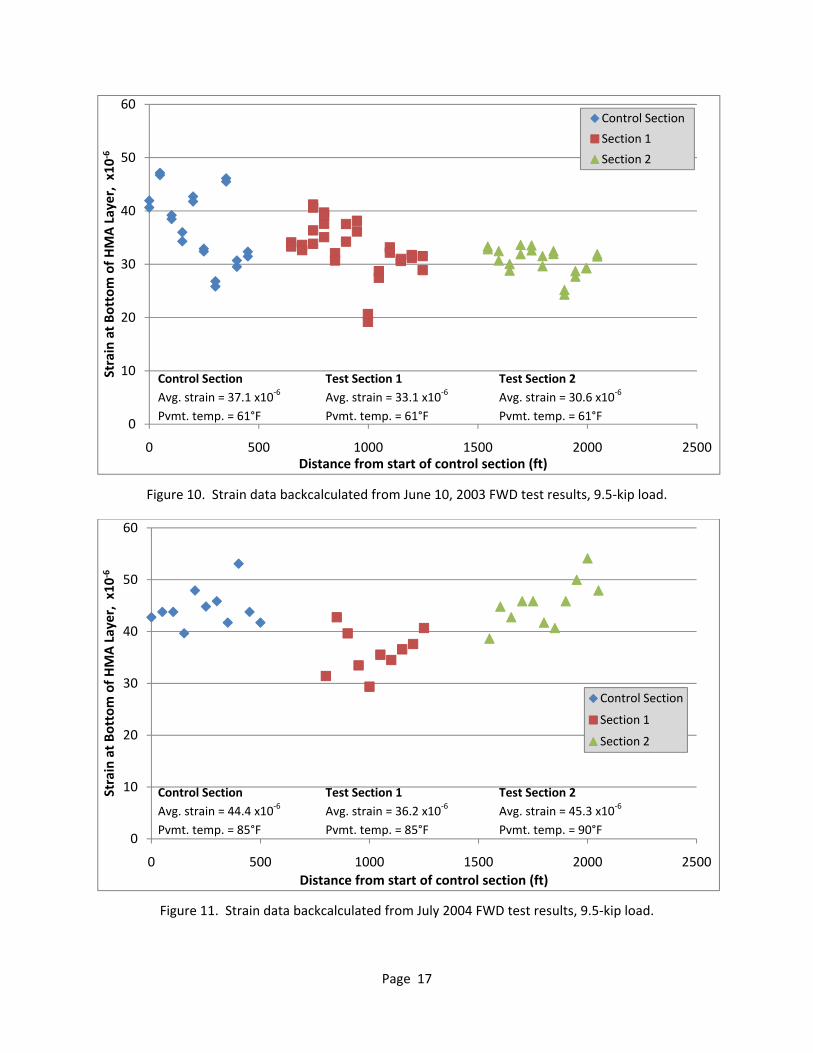
Figure 10. Strain data backcalculated from June 10, 2003 FWD test results, 9.5‐kip load. ....................... 17
Figure 11. Strain data backcalculated from July 2004 FWD test results, 9.5‐kip load. .............................. 17
Figure 12. Pavement distress index survey results. ................................................................................... 20
Figure 13. International roughness index survey results. .......................................................................... 21
Figure 14. Rut depth survey results. .......................................................................................................... 21
Figure 15. Control section cracking, July 2010. .......................................................................................... 23
Figure 16. Effect of initial service life increase on present worth cost compared to control section. ...... 25
Figure 17. Rubblized particle size requirements. ....................................................................................... 26
List of Tables
Table 1. Performance Data for Illinois Rubblized Test Sections*................................................................. 4
Table 2. Core Thicknesses (inches)............................................................................................................... 8
Table 3. Median Backcalculated HMA Layer Moduli (psi) ......................................................................... 18
Table 4. Median Backcalculated Base Layer Moduli (psi) .......................................................................... 19
Table 5. Median Backcalculated Subgrade Layer Moduli (psi) .................................................................. 19
Table 6. Total Initial Costs of Pavement Sections ...................................................................................... 24

1. Introduction
Concrete pavement rubblization is a rehabilitation technique suitable for a Portland cement concrete (PCC) pavement that has reached the end of its service life. Using this method, the concrete slabs are broken full‐depth into 2‐ to 12‐inch pieces. The end result is a layer of concrete rubble that is similar to an aggregate base course layer. The concrete material is then overlaid with hot mix asphalt (HMA) or new concrete; the former is the predominant approach in Wisconsin. The main benefit of rubblizing the PCC layer rather than simply overlaying with HMA is that reflective cracking due to working joints, cracks and other distresses in the PCC pavement is reduced or eliminated. Benefits from utilizing rubblization as an alternative to pavement replacement include reduced need for virgin material, resulting in lower hauling costs, reduced overall construction time and a lower environmental impact.
While the value of using rubblized pavement has been shown on numerous paving projects over the last twenty years, rubblization was still a fairly new technique for Wisconsin paving projects when this study began in 1999. Little design guidance was available for pavement systems with a rubblized layer. The appropriate HMA thickness to be placed over the rubblized pavement was a specific design issue that needed further review, as this thickness is critical to the performance and service life of the pavement system. It was unknown whether design values used for HMA pavements over new base course were appropriate for HMA pavements over a rubblized base. This study investigated the effect of increased HMA pavement thickness on the long‐term serviceability of rubblized PCC pavement systems.
2. Literature Review
2.1 Previous Experience in Wisconsin
Findings from several studies of rubblized pavements on Wisconsin Department of Transportation (WisDOT) roadways have been published previously. Results and conclusions from these studies are summarized below.
In 1996, test and control sections were constructed on a rubblized project on State Trunk Highway 16 west of Sparta, in Monroe County. The 1490‐ft control section included full depth repair at failed joints in the 8‐in jointed reinforced concrete pavement (JRCP), followed by a 3‐in HMA overlay. The rubblized test section was 2.25 miles long. Following rubblization, a 3‐in crushed aggregate layer was placed to establish slope, followed by a 3‐in HMA overlay. [1] Falling weight deflectometer (FWD) testing conducted first on the intact JRCP, and again between rubblization and placement of the crushed aggregate layer, showed that the modulus of the concrete pavement material was reduced by 98 percent following rubblization. The concrete then acted like a base material rather than an intact pavement slab. [2]
After approximately one year in service, 88.6 percent of transverse cracks and joints and 95.7 percent of the centerline longitudinal joint had reflected through to the HMA surface in the control section. All were low‐severity cracks. No reflective cracks were noted in the rubblized section. After 2.5 years in
Page 1

service, 96.4 percent of transverse cracks and joints and 98.2 percent of the centerline joint had reflected in the control section. Only nine low‐severity cracks were identified in the 2.25‐mile rubblized section. Rubblization was therefore shown to be an effective method of delaying or mimizing reflective cracks in an HMA surface. [1]
Other findings and recommendations from rubblization projects in Wisconsin form the basis of the state's current rubblization guidelines. HMA patches of the PCC pavement should be removed and replaced with crushed aggregate prior to rubblizing. It is possible for vehicles to travel on rubblized pavement without causing significant rutting, but ideally the rubblized area should be closed to traffic until an adequate HMA layer has been placed. [2]
For subgrades classified as A‐6 or A‐7 with high moisture contents, it was concluded that rubblization could not be effectively performed. The same was found to be true for high‐quality soils that were saturated at the time of rubblization. However, a moisture content threshold for effective rubblization was not provided. HMA overlay thickness was reported to be a determining factor in the service life of cracked and seated jointed plain concrete pavement (JPCP). However, HMA thickness was not related to service life for cracked and seated JRCP applications. Seven years of performance data on five Wisconsin projects using various fractured slab techniques showed that breaking of PCC pavements is the best way to minimize reflective cracking in subsequent HMA overlays. [1]
In 2007, a report was published by VonQuintus, et al. [3] for the Wisconsin Highway Research Program that summarized the performance of rubblized pavements in the state and proposed guidelines for the selection, design and construction of rubblized pavement systems. The performance analysis found that many projects had minor distresses. However, these sections were performing as expected for a new HMA pavement and would meet the expected design life of 22 years. [3]
The study recommended that the selection of pavements suitable for rubblizing be based on existing conditions (e.g., curb and gutter restraints, overpass clearance restrictions, water table location), adequate foundation support, and condition of the existing PCC pavement. The PCC pavement should have no remaining service life to be considered for rubblization, or else alternate rehabilitation strategies could be more cost effective. In order to support the slab breaking process, the foundation material modulus should be at least 10,000 psi as determined with FWD testing. In addition, adequate drainage in the foundation was found to be essential; it was recommended that drainage issues be addressed prior to the rubblization process if saturated materials are present. [3]
Based on the performance of Wisconsin's rubblized pavements, a structural layer coefficient of 0.22 was recommended for the rubblized layer when using AASHTO structural design procedures. An elastic layer modulus of 65,000 psi was recommended for the rubblized pavement in mechanistic‐empirical (M‐E) pavement design. A minimum HMA overlay thickness of four inches was proposed. It was also advised that test pits be dug during rubblization to ensure proper slab breaking. [3]
Page 2

2.2 HMA Overlay Thickness
A study of rubblized pavement performance in Iowa was published in 2008. [4] HMA overlay thickness of the rubblized test sections ranged from 6.4 to 9.7 inches. Distress performance was good for all sections monitored (HMA over rubblized PCC, HMA over non‐rubblized PCC and HMA over aggregate base course), although reflective cracking was noted in the non‐rubblized PCC sections. The average structural layer coefficient calculated from FWD data for the rubblized PCC layers was 0.19, slightly lower than the value of 0.22 determined for Wisconsin pavements. [3] However, the average rubblized PCC elastic layer modulus was 78,000 psi, slightly higher than the 65,000 psi recommended for Wisconsin pavements. [3] The average strain measured at the bottom of the HMA pavement layer during FWD testing was 74x10‐6 (no FWD load level specified). [4]
Several rubblization projects investigating various HMA thicknesses were constructed on Illinois Interstates in the 1990s. One project had existing JRCP, and two had continuously reinforced concrete pavement (CRCP). International roughness index (IRI) values and condition rating survey (CRS) values were collected. These data are summarized for each project in Table 1 on the following page. [5] The two projects where CRS information was available both fell into the "good" condition category under the Illinois rating system. The 1990 project showed rubblized sections performing better than the control, with lower‐severity cracking and better ride values. The rubblized section with thicker HMA had the best ride value. For the 1996 project, the control section had worse cracking but better rutting performance than the rubblized sections. Ride data did not show a conclusive trend. All the test sections were performing well in the 1997 project. These studies indicated that the rubblized sections performed at approximately the same or better level overall than the control sections. The rubblized sections with thicker HMA had better ride values but similar cracking performance compared to the thinner HMA sections.
Based on the PerRoad pavement design software, the National Asphalt Pavement Association developed guidelines for designing the thickness of HMA pavement in rubblized systems. The HMA thickness design considered rubblized PCC pavement thickness, subgrade modulus, subgrade structural number (SN) and equivalent single load axles (ESALs). As the subgrade quality increased (i.e. increasing modulus and SN), a thinner HMA pavement could be constructed. However, for a given subgrade SN, minimum HMA thicknesses are recommended at each design ESAL level to ensure adequate protection against reflective cracking. [6]
2.3 Additional Information
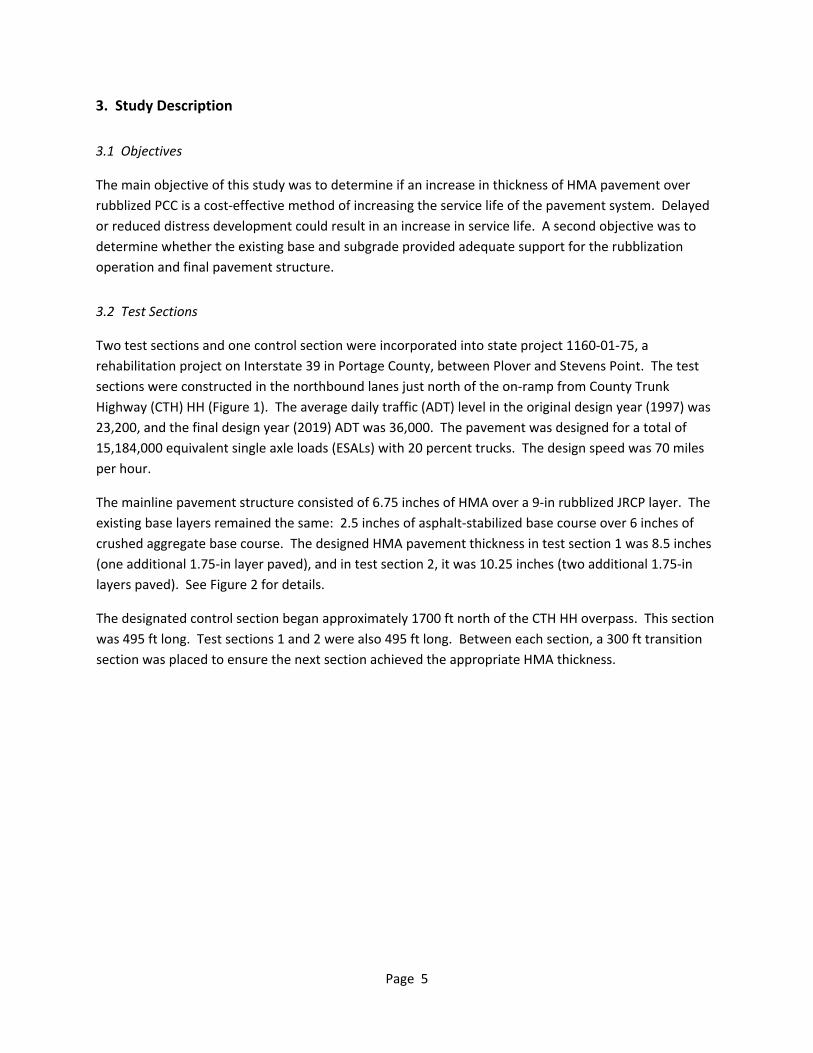
The condition of the existing subgrade is an integral part of a rubblized pavement system's success. If localized areas of weak subgrade are present, it might be necessary to repair those areas prior to rubblization. As an alternative to subgrade repair, it could be possible to reduce the impact energy of the rubblization equipment in specific areas to protect the weak subgrade. [7] Installation of edge drains also benefits the subgrade by reducing the amount of moisture present in the pavement system prior to rubblization and while the pavement is in service. A study of rubblized pavements in Louisiana noted that, in addition to the installation of edge drains prior to rubblization, the presence of a stiff
Page 3
cement‐treated base course under the original PCC pavement was beneficial to the rubblization process. [8]
Table 1. Performance Data for Illinois Rubblized Test Sections*
Project Site
HMA Thickness (inches)
Paving Platform 2002 CRS Value
IRI (m/km)
Notes
I‐57
(1990)
3.25 Patched 10‐in JRCP (control)
6.5 1.87
Cracking in rubblized sections was lower‐severity than control section
6 Rubblized 10‐in JRCP
6.5 1.40
8 Rubblized 10‐in JRCP
6.5 1.25
I‐57
(1996)
5 8‐in CRCP (control)
7.4 1.36 Mid‐lane cracking was more prevalent in control section. Control section had slightly less rutting than rubblized sections.
6 Rubblized 8‐in CRCP
7.4 1.74
8 Rubblized 8‐in CRCP
7.4 1.22
I‐70
(1997)
5.5 8‐in CRCP (control)
N/A
1.17 (average for all
sections)
All sections were in excellent condition in 2004. Some transverse and longitudinal cracks noted in 9‐ and 10‐inch rubblized sections. Rutting low in all sections.
9 Rubblized 8‐in CRCP
N/A
10 Rubblized 8‐in CRCP
N/A
11 Rubblized 8‐in CRCP
N/A
*Summarized from [5]
A 2010 survey conducted for WisDOT by CTC and Associates, LLC [9] reported on other states' experiences with the design, construction and performance of rubblized pavement systems. Seventeen states responded to the survey. Fourteen states reported using a structural coefficient between 0.14 and 0.29 for the rubblized pavement layer in a typical pavement design. Reported problems regarding rubblization included difficulties when soft subgrades are encountered and selecting the appropriate equipment necessary for rubblizing. Overall good performance of rubblized pavement systems was reported by 83 percent of respondents. HMA overlays of rubblized pavements have performed similarly to new HMA pavements, and over 20 years of service can be expected with proper maintenance. [9]
Conclusions of these cited studies generally agree that, when properly designed and constructed, HMA overlays of rubblized PCC pavement are an excellent rehabilitation strategy for concrete pavements that have reached the end of their service life. [3, 4, 9, 10, 11] The current study investigates a rubblized pavement with various HMA overlay thicknesses, a specific design detail that could affect the performance of rubblized pavement systems.
Page 4
3. Study Description
3.1 Objectives
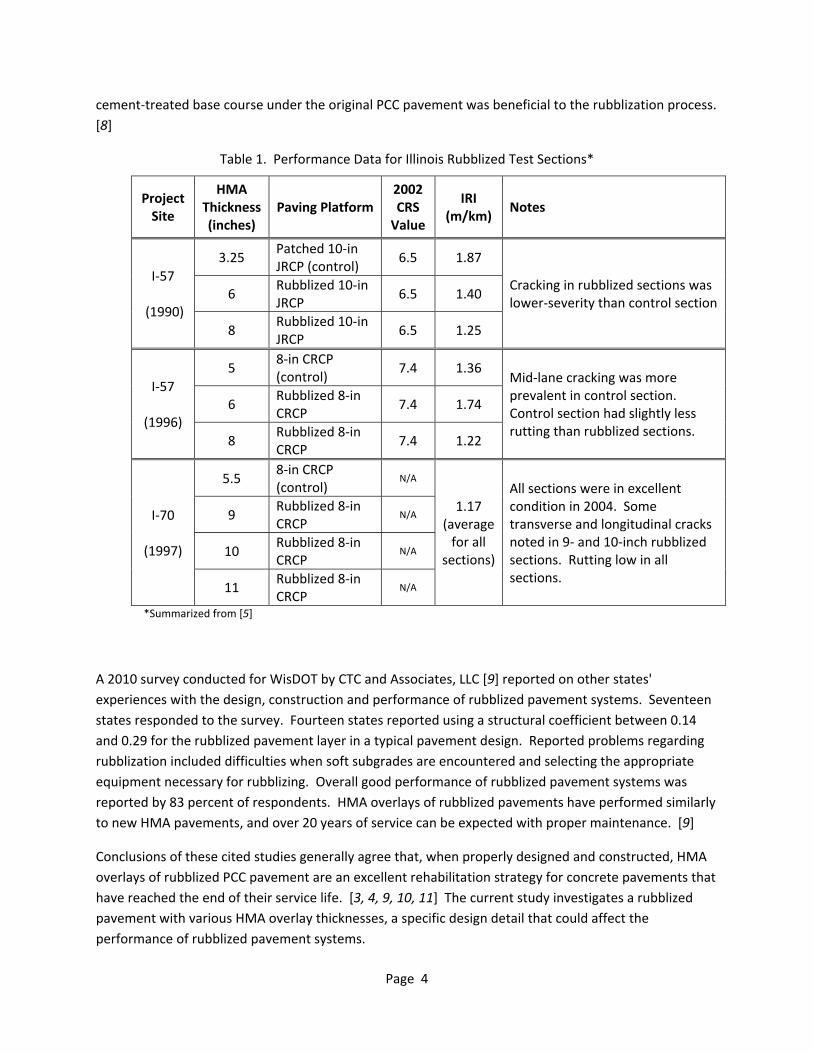
The main objective of this study was to determine if an increase in thickness of HMA pavement over rubblized PCC is a cost‐effective method of increasing the service life of the pavement system. Delayed or reduced distress development could result in an increase in service life. A second objective was to determine whether the existing base and subgrade provided adequate support for the rubblization operation and final pavement structure.
3.2 Test Sections
Two test sections and one control section were incorporated into state project 1160‐01‐75, a rehabilitation project on Interstate 39 in Portage County, between Plover and Stevens Point. The test sections were constructed in the northbound lanes just north of the on‐ramp from County Trunk Highway (CTH) HH (Figure 1). The average daily traffic (ADT) level in the original design year (1997) was 23,200, and the final design year (2019) ADT was 36,000. The pavement was designed for a total of 15,184,000 equivalent single axle loads (ESALs) with 20 percent trucks. The design speed was 70 miles per hour.
The mainline pavement structure consisted of 6.75 inches of HMA over a 9‐in rubblized JRCP layer. The existing base layers remained the same: 2.5 inches of asphalt‐stabilized base course over 6 inches of crushed aggregate base course. The designed HMA pavement thickness in test section 1 was 8.5 inches (one additional 1.75‐in layer paved), and in test section 2, it was 10.25 inches (two additional 1.75‐in layers paved). See Figure 2 for details.
The designated control section began approximately 1700 ft north of the CTH HH overpass. This section was 495 ft long. Test sections 1 and 2 were also 495 ft long. Between each section, a 300 ft transition section was placed to ensure the next section achieved the appropriate HMA thickness.
Page 5

Page 6
Test section area
(b)
(a)
Figure 1. Test section location: (a) Portage County; (b) area of test sections on I‐39 northbound.

Page 7
STA.1187+86
STA.1209+95
STA.1205+00
STA.1217+90
STA.1212+95
STA.1225+85
STA.1220+90
CTH HH
Overhead
I‐39 Northbound
6.75”
8.5” 10.25”
6.75”
Control Section
Test Section #1
Transition Transition Transition Test
Section #2
495’ 300’ 495’ 300’ 495’
3.25”
1.75”
HMA layers
9" Rubblized JRCP
2.5" Asphalt stabilized base course
6" Crushed aggregate base course
Figure 2. Test section description: (top) plan view; (bottom) pavement profile.
Page 7

In the summer of 2004, cores were taken to verify pavement thicknesses in the test and control sections. Results from the coring analysis are provided in Table 2. The actual thickness of the control section was on average 0.5 inches thicker than designed, and test section 2 was approximately 0.5 inch thinner than designed. The average thickness for test section 1 was very close to the designed thickness of 8.5 inches. Because the HMA strain estimates discussed in Section 5.1.2 did not depend on pavement thickness, the absolute thickness values were not critical. However, conclusions drawn should take into account that the thickness difference among the sections was approximately 1.0 inch, rather than the planned variation of 1.75 inches. The modulus analysis conducted in Section 5.1.3 did rely on thickness information, and in this case, the average core thickness from each section was used. The cost analysis in Section 6 used designed thicknesses and also investigated a 1.0‐in thickness variation.
Table 2. Core Thicknesses (inches)
Control Test
Section 1 Test
Section 2
Target Thickness 6.75 8.5 10.25
Core Data
7.1 7.9 9.5 7.0 8.2 9.2 7.0 7.5 9.4 7.2 7.4 9.5 7.4 7.4 9.5 7.1 7.5 9.4 7.6 8.4 9.8 7.2 8.5 10.2 7.4 9.3 10.3 8.0 10.1 10.1 7.5 9.9 11.0
Average 7.3 8.4 9.8 Standard Deviation 0.30 0.99 0.54 Coeff. Of Variation 4.1% 11.9% 5.5%
3.3 Construction
The test sections for this study were incorporated into an 11‐mile rehabilitation of I‐39 between Plover and Stevens Point. The project included 44.5 lane‐miles of 9‐in JRCP rubblization; at the time, it was the largest rubblization project in Wisconsin. In addition, the HMA pavement was constructed under a 5‐year warranty contract.
Prior to rubblizing, deteriorated PCC joints along the overall project were repaired with full‐depth undoweled concrete patches.1 One concrete patch (left and right lanes) was required in test section 1.
1 Concrete patching is no longer routinely performed on rubblized pavement projects.
Page 8

Test section 2 and the control section had no patching. Three‐inch wrapped edge drains were installed throughout the project.
Rubblization began in early April 1999 and was completed within two months. Several test holes were dug along the project length to check the effectiveness of the rubblization and the size of the resulting particles. Some areas of soft subgrade were noted at the northern end of the project, but the platform for rubblizing was adequate in the area of the test sections.
HMA paving began in April 1999 and was completed in mid‐August. The test and control sections were paved in June. HMA was placed directly over the rubblized surface; no additional base course was added. Slope and crown were established with HMA material in the first paved layer. The first 3.75‐in HMA layer was a 1‐in (25‐mm) warranty mixture. The subsequent 1.75‐in HMA layers were made with a 0.5‐in (12.5‐mm) stone matrix asphalt gap graded warranty mixture, with 4 percent asphalt content. All layers used PG 58‐28 binder.
4. Pavement Material Data Analysis
Samples of the HMA mixtures were analyzed at the Advanced Transportation Research Engineering Laboratory (ATREL) at the University of Illinois at Urbana‐Champaign. Surface and lower layer mixtures were tested for maximum theoretical density (Gmm) and diametral resilient modulus. The latter test was conducted at two test temperatures (25 and 40°C) and target air voids of 3, 5 and 7 percent for the surface layer and 5‐7 percent for the lower layer. The lower layer mixture was also tested for fatigue resistance at 20°C and 7 percent target air voids. The Gmm determined for the surface and lower layers was 2.471 and 2.505, respectively. [12]
The resilient modulus results are shown in Figures 3 and 4 for the surface and lower layers, respectively. The surface layer mixture modulus values were slightly on the soft side for the air void contents tested. The results for the lower layer were typical of a dense graded HMA mixture. As expected, the resilient modulus increased with decreasing air voids (increasing density) and decreasing temperature. [12]
Page 9

Figure 3. Diametral resilient modulus values for surface layer mixture. [12]
Figure 4. Diametral resilient modulus values for lower layer mixture. [12]
Page 10

Fatigue test results for the lower layer mixture are shown in Figure 5. The curve shows the number of load cycles (Nf) the mixture can sustain at a set strain level before failure. In this test, failure was defined as the point where the initial flexural modulus decreased by 50 percent. The material's predictive fatigue equation is also shown in Figure 5; the exponent of 3.9 indicates good fatigue resistance. [12]
The commonly accepted strain endurance limit for HMA pavements is 70x10‐6 to 100x10‐6, below which level no permanent fatigue damage will occur in the pavement. [13, 14] For this pavement's lower layer mixture, the 100x10‐6 strain level extrapolates to nearly 10 million load cycles to failure (Figure 5). As will be discussed in Section 5.1.2, loads resulting in a strain of 100x10‐6 are unlikely to occur in any of the test sections, and therefore the pavement is well‐protected from fatigue damage.
Load
Cycles to Failure
Strain at Bottom of HMA Layer
Nf = 3.73x10‐9x‐3.9
R2 = 0.938
Figure 5. Fatigue curve for lower layer mixture. [12]
Page 11

5. Pavement Performance Analysis
5.1 Falling Weight Deflectometer Results
Falling weight deflectometer (FWD) testing was used for several purposes in this study. First, an initial evaluation of the intact PCC pavement structure was performed to determine the soil support conditions along the length of the project. After construction, FWD testing was performed annually from 2000 to 2004 to assess the entire pavement system, including the strain level at the bottom of the HMA layers and the moduli of the individual pavement layers.
5.1.1 Initial FWD Testing
Prior to the rubblization construction project, FWD testing was performed along the length of the northbound PCC pavement. The area between approximately 10,000 and 25,000 ft north of the project start could not be tested because a bridge maintenance project was underway. It was suspected that the northern portion of this project had poor support, as the concrete in that area had more patches and cracking than in the southern portion. The modulus of subgrade reaction was calculated from the FWD results (Figure 6). This value is a measure of PCC slab support; a higher value indicates greater support. Values under 100 psi/in indicate that the foundation materials have a high moisture content.
The northern section of the project did have slightly lower modulus of subgrade reaction values, especially between 50,000 and 53,000 ft north of the project start. However, the support in this area was still within an adequate range for rubblizing. The area chosen for the experimental sections had very good slab support, as shown in Figure 6.
Page 12

0
50
100
150
200
250
300
350
0 10000 20000 30000 40000 50000 60000 70000
Mod
ulus of S
ubgrad
e Re
action
(psi/in)
Distance from project start (ft)
Test section 2
Control section
Test section 1
Northbound direction
Figure 6. Modulus of subgrade reaction values for rubblization project.
5.1.2 HMA Pavement Strain
FWD tests were performed on the test and control sections once per year from 2000 through 2004. Testing was conducted every 50 ft and used drop loads of approximately 5, 9.5, 15 and 20 kips at each test location. Tests were performed at the center of the driving lane.
Backcalculation for strain at the bottom of the HMA layer used the area under pavement profile (AUPP) method and the ti following equa ons:
5 2 2
0.999 1.014 Eq. 2
Eq. 1
where Di = pavement deflection at i inches from drop load (10‐3 inches) εAC = strain at the bottom of the HMA pavement layer
Strain levels calculated from annual FWD tests are shown for the control and test sections in Figures 7 through 11. Results from the 9.5‐kip load test are presented here, as this load level represents a truck
Page 13

load that is close to the maximum allowable wheel load of 11 kips. [15] Results from other load levels are provided in Appendices A, B and C. The average strain calculated for each section is also shown in these figures.
When analyzing strain in HMA pavement, the pavement temperature is an important parameter to consider. Higher pavement temperature results in higher strain for a given load. Temperatures can fluctuate during the FWD testing process, and therefore the pavement temperature at the actual time of testing was calculated with the "BELLS" temperature conversion equation for conditions where the FWD
pa l min ng tapparatus and tow vehicle shade the vement for severa utes duri esting: [16]
2.78 0.912 1.25 0.428 0.55 2.63 sin 15.50.027 sin 13.5
Eq. 3
where Td = HMA temperature at depth, d (°C) Tpvmt = pavement surface temperature (°C) d = depth for temperature prediction (mm) Tprev = average previous‐day air temperature (°C) t18 = time of day (24‐hour clock format)
Average pavement temperatures calculated at the bottom of the HMA layers for the test and control sections are shown in Figures 7 through 11.
It is first useful to compare strain data for test sections that were measured by the FWD under equal temperature conditions. Pavement temperatures were approximately equal (within 1°F) among the test and control sections in 2000, 2001 and 2003 (Figures 7, 8, and 10). In these cases, the strain typically decreased with increasing HMA thickness. One exception was that Test Section 1 in 2000 showed a slight increase in average strain compared to the thinner control section (Figure 7). The cause(s) of this anomaly is unknown.
On average for the three years noted above, an additional 1.0 inch of HMA resulted in a decrease of 3 microstrain (3x10‐6) at the bottom of the HMA layer. Lower strain is desirable, as this results in lower fatigue of the pavement layers during repeated loading. In addition, the pavement will transfer less strain to the base materials, providing better protection for the pavement's support layers.
The maximum strain measured in the thinnest (control) section at the 9.5‐kip load level was 56 microstrain (Figure 7). This strain level is lower than the 70 to 100 microstrain endurance limit that is commonly associated with a perpetual asphalt pavement. [13, 14] Therefore, while the additional 1.0‐in HMA layers resulted in a reduction in strain, the control section provided adequate thickness in terms of protecting the pavement foundation from the cumulative effect of high strain from traffic loadings.
A second aspect noted in the backcalculated strain data was the effect of pavement temperature on strain level. Considering the 2004 data (Figure 11), the pavement temperature increased from 85°F when the control section was tested to 90°F when test section 2 was tested. As a result, the test section 2 pavement had approximately the same strain level as the control section, despite being about two inches thicker.
Page 14

0
10
20
30
40
50
60
0 500 1000 1500 2000 2500
Strain at Bo
ttom
of H
MA Layer, x10‐
6
Distance from start of control section (ft)
Control SectionSection 1Section 2
Control Section Test Section 1 Test Section 2 Avg. strain = 44.2 x10‐6 Avg. strain = 45.4 x10‐6 Avg. strain = 42.2 x10‐6 Pvmt. temp. = 71°F Pvmt. temp. = 71°F Pvmt. temp. = 70°F
Figure 7. Strain data backcalculated from June 22, 2000 FWD test results, 9.5‐kip load.
Page 15

0
10
20
30
40
50
60
0 500 1000 1500 2000 2500
Strain at Bo
ttom
of H
MA Layer, x10‐
6
Distance from start of control section (ft)
Control Section
Section 1
Section 2
Control Section Test Section 1 Test Section 2 Avg. strain = 32.6 x10‐6 Avg. strain = 27.1 x10‐6 Avg. strain = 22.6 x10‐6 Pvmt. temp. = 55°F Pvmt. temp. = 54°F Pvmt. temp. = 54°F
Figure 8. Strain data backcalculated from October 22, 2001 FWD test results, 9.5‐kip load.
0
10
20
30
40
50
60
0 500 1000 1500 2000 2500
Strain at Bo
ttom
of H
MA Layer, x10‐
6
Distance from start of control section (ft)
Control Section
Section 1
Section 2
Control Section Test Section 1 Test Section 2 Avg. strain = 35.6 x10‐6 Avg. strain = 33.8 x10‐6 Avg. strain = 36.2 x10‐6 Pvmt. temp. = 67°F Pvmt. temp. = 69°F Pvmt. temp. = 70°F
Figure 9. Strain data backcalculated from September 4, 2002 FWD test results, 9.5‐kip load.
Page 16
0
10
20
30
40
50
60
0 500 1000 1500 2000 2500
Strain at Bo
ttom
of H
MA Layer, x10‐
6
Distance from start of control section (ft)
Control Section
Section 1
Section 2
Control Section Test Section 1 Test Section 2 Avg. strain = 37.1 x10‐6 Avg. strain = 33.1 x10‐6 Avg. strain = 30.6 x10‐6 Pvmt. temp. = 61°F Pvmt. temp. = 61°F Pvmt. temp. = 61°F
Figure 10. Strain data backcalculated from June 10, 2003 FWD test results, 9.5‐kip load.
0
10
20
30
40
50
60
0 500 1000 1500 2000 2500
Strain at Bo
ttom
of H
MA Layer, x10‐
6
Distance from start of control section (ft)
Control Section
Section 1
Section 2
Control Section Test Section 1 Test Section 2 Avg. strain = 44.4 x10‐6 Avg. strain = 36.2 x10‐6 Avg. strain = 45.3 x10‐6 Pvmt. temp. = 85°F Pvmt. temp. = 85°F Pvmt. temp. = 90°F
Figure 11. Strain data backcalculated from July 2004 FWD test results, 9.5‐kip load.
Page 17

5.1.3 Pavement Layer Moduli
To determine modulus values for each of the pavement layers (HMA, base and subgrade), the MODTAG Version 4.0 FWD analysis program was used to analyze the FWD data collected at the test and control sections. [17] Data from 2000 through 2003 were analyzed; 2004 data were not available for input into MODTAG. The median moduli for each layer of the pavement structure are reported in Tables 3 through 5. Plots of moduli as a function of distance along the test area are provided in Appendix D.
The moduli calculated for the HMA pavement layers were within a typical range for Superpave mixtures (Table 3). It is clear that temperature had a large effect on HMA stiffness. Test dates with cooler air temperatures, such as in 2001, resulted in lower HMA pavement temperatures and higher stiffness. The previous day's conditions also played a role in stiffness, as noted in Equation 3 (Section 5.1.2). In 2000 and 2002, the average temperatures on the testing day were equal, but the previous day was warmer in 2000. The stiffness values were therefore lower in 2000.
The median HMA modulus was typically highest in the control section and lowest in test section 2. This trend might also be due to temperature variations, as testing always started in the morning with the control section and ended several hours later with test section 2. However it is also possible that material and/or paving variations played a role in the stiffness variations among test sections.
The median base layer moduli were above average for a typical HMA pavement system (Table 4). The base layer for this study's pavement was substantial, consisting of a total of 17.5 inches of rubblized PCC, asphalt stabilized base course and crushed aggregate base course (Figure 2). The high moduli also indicated that drainage was adequate in the base layers. These moduli could be a sign that large PCC slab pieces remained and were not adequately broken in the rubblization process; transverse cracks were indeed noted in the thinner pavement section (see Section 5.3). However, the median base layer moduli were well below 1x10⁶ psi, a threshold that has been proposed to ensure the prevention of reflective cracking in fractured PCC pavement systems. [18]
Subgrade moduli calculated in MODTAG were typical of a sandy, drained layer (Table 5). The moduli were relatively constant among the control and test sections and also remained level over the four years for which data were available. The moduli exceed the recommended 10,000 psi minimum support modulus proposed in the Wisconsin rubblization study. [3]
Table 3. Median Backcalculated HMA Layer Moduli (psi)
Pavement Section Jun. 2000 Oct. 2001 Sep. 2002 Jun. 2003
Weather Conditions Cloudy Clear Clear Rain Daily Mean Temp. 67°F 44°F 67°F 60°F Previous Day Mean Temp. 70°F 43°F 67°F 60°F Control 880,000 2,170,000 1,575,000 1,710,000 Test Section 1 679,000 2,245,000 1,240,000 1,410,000 Test Section 2 578,000 1,850,000 830,000 1,210,000
Page 18

Table 4. Median Backcalculated Base Layer Moduli (psi)
Pavement Section Jun. 2000 Oct. 2001 Sep. 2002 Jun. 2003
Control 265,000 214,000 207,000 237,000 Test Section 1 255,000 205,000 215,000 274,000 Test Section 2 302,000 270,000 243,000 249,000
Table 5. Median Backcalculated Subgrade Layer Moduli (psi)
Pavement Section Jun. 2000 Oct. 2001 Sep. 2002 Jun. 2003
Control 21,400 21,500 28,200 25,000 Test Section 1 25,100 24,600 31,900 23,100 Test Section 2 24,400 22,300 30,800 27,600
5.2 Automated Pavement Survey Results
Automated pavement performance surveys of the test and control sections were conducted annually from 2000 to 2010. Data were not collected in 2008 and 2009. Pavement distress index (PDI), international roughness index (IRI) and rutting data were collected during each of the automated evaluations. Surveys were performed by the WisDOT Pavement Data Unit, using the Department's automated video surveying and profiling equipment. Data for PDI, IRI and rut depth are presented in Figures 12 through 14.
The WisDOT PDI value is a measure of distress in a pavement section, with a value of zero indicating no distresses present and a value of 100 indicating a severely deteriorated pavement. For reference, the PDI of the JRCP in the area of the test and control sections was 71 prior to the rubblization project. PDI data collected for the test and control sections showed no definitive change in PDI over time (Figure 12). In general, the PDI of the two test sections were approximately equal, and the thinner pavement section (control) had a slightly higher PDI. A PDI of zero was measured in all pavement sections in 2000, 2001 and 2004. Slight variation in PDI from year to year is not uncommon due to differences in the surveyor's interpretation of distresses. The relatively low values (PDI of 20 or less) indicated that the rubblized pavement system performed well during the first eleven years in service, regardless of HMA thickness.
The IRI value is a measure of pavement ride quality; IRI increases with roughness. For reference, the IRI of the JRCP in the area of the test and control sections was 1.63 m/km prior to the rubblize and overlay project. As expected, there was a slight increasing trend overall in IRI over time (Figure 13). The test and control sections performed at approximately equal levels in most years. In 2010, however, the roughness in the control section was greater than in the thicker test sections. The IRI data indicated excellent performance over eleven years, with values typically less than 1.0 m/km. The data from 2004 was anomalous; the higher measured values could be due to equipment calibration or tracking of the automated survey vehicle. It is puzzling to note that the high 2004 IRI values correlated with PDI values of zero in the same year (Figure 12).
Page 19

The measured rut depth data indicates excellent deformation resistance of the pavement layers to truck loads. Rut depth measurements in the test and control sections were less than one tenth of an inch for all 11 years of monitoring (Figure 14). There was no major difference in performance among the sections. As discussed in Section 5.1.2, the measured pavement strain was low in all pavement sections. Low strain at the bottom of the HMA pavement layer typically results in low permanent deformation (rutting), which was confirmed with this survey data.
0
5
10
15
20
25
2000 2001 2002 2003 2004 2005 2006 2007 2008 2009 2010
Pavemen
t Distress Inde
x ‐P
DI
Control Section
Test section 1
Test section 2
Data no
t available
Data no
t available
Figure 12. Pavement distress index survey results.
Page 20

0
0.5
1
1.5
2
2000 2001 2002 2003 2004 2005 2006 2007 2008 2009 2010
Internationa
l Rou
ghne
ss In
dex ‐IRI (m
/km)
Control Section
Test section 1
Test section 2
Data no
t available
Data no
t available
Figure 13. International roughness index survey results.
0
0.02
0.04
0.06
0.08
0.1
2000 2001 2002 2003 2004 2005 2006 2007 2008 2009 2010
Rut Dep
th (in)
Control Section
Test section 1
Test section 2
Data no
t available
Data no
t available
Figure 14. Rut depth survey results.
Page 21

5.3 Visual Distress Survey Results
In‐person visual surveys were conducted in April 2007 and in July 2010 to note individual distresses present in the test and control sections.
5.3.1 April 2007 Site Review
At the time of the April 2007 review, the pavement had been in service for eight years. No cracking or other pavement distress was noted in either test section.
In the control section, approximately ten transverse cracks were noted. Most of these cracks originated at the paving joint between the right edge of the control section and the left edge of the tapered entrance ramp from CTH HH. It was therefore difficult to determine whether the cracks were due to normal pavement deterioration or if they were caused by paving irregularities in the area of the ramp. In the pavement immediately south of the control section, prior to the ramp, numerous one‐foot transverse cracks were noted that originated from the right edge of pavement. In this area, a few transverse cracks extended the entire width of the driving and passing lanes. None of the cracks had been sealed at that time. It is possible that these transverse cracks had reflected through the HMA pavement layer at the locations of former PCC pavement joints. This would indicate that PCC slabs were not broken into small enough pieces during the rubblization process.
5.3.2 July 2010 Site Review
At the time of the July 2010 review, the pavement had been in service for 11 years. There were still no cracks or other pavement distresses noted in either test section.
In the control section, a 200‐ft longitudinal crack was noted at the right edge of the driving lane, adjacent to the tapered entrance ramp from CTH HH (Figure 15). The width of this crack was greater than ½‐inch, making it a severity level 2 crack according to the WisDOT Pavement Distress Manual. Ten transverse cracks were present that extended from the longitudinal crack half‐way into the driving lane. Similar cracking was noted in the pavement just south of the control section. No cracking was noted in the passing lane of the control section.
At the time of the survey, none of the cracks had been sealed. However, the paving joint between the driving and passing lanes had been sealed along the length of the rubblization project.
Pavement in the northbound and southbound lanes between CTH HH and U.S. Highway 10 (north of the control and test sections) was also evaluated during the 2010 field review. This pavement was constructed with the same HMA thickness as in the control section (6.75 inches). Good performance was noted overall, and no distresses were present in the southbound lanes.
5.3.3 Summary
Based on the results of the visual surveys, it can be concluded that the initiation of cracking was delayed in the thicker test sections by at least three years. This can be confirmed with the PDI data shown in Figure 12 (Section 5.2). The PDI measured in the control section was higher than that of the two test
Page 22

sections in 2007 and 2010, the final two years for which data were available. The actual length of time that crack formation will be delayed, however, requires further monitoring.
Figure 15. Control section cracking, July 2010.
6. Cost Considerations
To determine whether using additional HMA thickness is a cost‐effective method of extending the service life of HMA over rubblized PCC pavements, a cost analysis was performed using current construction prices. Average unit bid costs from WisDOT construction projects between April 2009 and April 2010 were used in the analysis. The costs of the HMA pavement, HMA shoulders and gravel shoulders were considered.
Three HMA pavement materials are bid separately in WisDOT construction projects: HMA mixture, asphalt cement binder and tack coat. For this analysis an E‐30 HMA mixture2 and PG 58‐28 binder were used, as these are common HMA paving materials for Interstate highway construction applications. A total paved width of 38 ft was used, to include costs of the driving and passing lanes and paved shoulders. In addition, 2‐ft wide outside gravel shoulders were included in the cost analysis, as the thickness of this part of the pavement structure also changes as HMA thickness changes.
2 The WisDOT E‐30 HMA mixture is designed for 30 million ESALs during the pavement's design life. [19]
Page 23

The average bid costs for the HMA mixture, binder and tack coat were $49.19/ton, $276.30/ton and $2.39/gallon, respectively. The average unit cost for 1.25‐in dense graded base aggregate (BAD) was $8.94/ton. Based on these unit prices and the pavement structures used in this study, the total construction costs per project mile for the test and control sections were calculated; these costs are reported in Table 6. Each additional 1.75 inches of HMA cost approximately $141,500/mile.
Using the WisDOT program WisPave, life cycle cost analyses (LCCAs) were performed to determine how many additional initial years of service the two test sections would need to provide in order to be cost effective compared to the control section. An analysis period of 50 years and a discount rate of 5 percent were used in the computations. The rehabilitation method used was a 2‐in mill and overlay; the cost of this operation was calculated to be $190,660/mile using the HMA unit costs from above and a milling unit cost of $1.41/yd2. The initial service life of the control section was set at 22 years, and the rehabilitation service life at 12 years. [20]
Figure 16 illustrates the relationship between service life and present worth cost of the test sections compared to the control section. If the initial service lives of the test sections increased, the percent increase in present worth cost compared to the control section decreased. Based on WisDOT LCCA procedures, the threshold defined for cost‐effectiveness of an alternative requires the alternative option to be within 5 percent of the control section's present worth cost. [21] The test section 1 scenario (1.75‐in HMA thickness increase) did not come within this threshold until the very end of the 50‐year design period, meaning that to be cost‐effective compared to the control section, the original HMA pavement in test section 1 must last 50 years with no mill and overlay rehabilitation. A 50‐year HMA pavement life with no rehabilitation is not reasonable expectation for Interstate highways. Therefore, based on the LCCA, the additional 1.75‐in pavement thickness is not a cost‐effective practice. The same holds true for test section 2, as the cost of a 3.5‐in HMA thickness increase did not come within 5 percent of the control section's cost during the 50‐year design period (Figure 16).
Because the thickness differences among the test and control sections were closer to 1.0 inch than 1.75 inches (Table 2, Section 3.2), a scenario with a 1.0‐in HMA thickness increase was considered in the LCCA. In this case, an 8‐year increase in initial service life must be achieved to gain cost effectiveness compared to the control section (Figure 16). This means that a 7.75‐in thick pavement must have a 30‐year initial service life to be cost‐effective compared to a 6.75‐in thick pavement with a 22‐year initial service life. This also pushes the boundaries for a reasonable pavement life in Wisconsin. These LCCA scenarios illustrate that to recover the extra cost of additional HMA thickness, a sizeable increase in initial service life is required.
Table 6. Total Initial Costs of Pavement Sections
Section Thickness
(in) HMA Cost Tack Cost BAD Cost
Total Cost per Project Mile
Control 6.75 $532,890 $2,660 $12,290 $547,840 Test 1 8.50 $671,050 $4,000 $16,920 $691,970 Test 2 10.25 $809,200 $5,330 $22,150 $836,680
Page 24

0%
5%
10%
15%
20%
25%
30%
35%
40%
45%
50%
0 5 10 15 20 25 30
Percen
t Increase in
Present W
orth Cost over
Control Section
Increase in Initial Service Life over Control Section (Years)
Test Section 1
Test Section 2
1‐inch increase
Cost‐effectiveness threshold
Figure 16. Effect of initial service life increase on present worth cost compared to control section.
7. Current WisDOT Practices
The WisDOT Facilities Development Manual (FDM) provides guidance on when to use rubblization as a concrete pavement rehabilitation method. [22] Rubblization is recommended when the existing PCC pavement has no remaining service life. The guidelines state that rubblization should be considered when more than 20 percent of the roadway is in need of concrete joint repair, has been patched, has slab breakup or has longitudinal joint distress greater than 4 inches in width; or when the PDI is greater than 60. The FDM also suggests that edge drain installation be considered, especially in areas of fine‐grained subgrade soils, but edge drains are not required. It further recommends that FWD testing or dynamic cone penetrometer (DCP) testing be performed to evaluate the existing subgrade conditions.
The WisDOT FDM also provides design guidance for pavement structures incorporating a rubblized layer. The existing soil k value should be increased in proportion with the thickness of the pavement to be rubblized. When calculating the HMA overlay thickness, the structural layer coefficient for the rubblized pavement layer is to be within the range of 0.20 to 0.24. [22] This recommended layer coefficient range correlates with recent research conducted for the Indiana DOT. A mechanistic evaluation of rubblized
Page 25

pavement layers was performed in that study, and the suggested layer coefficient for the rubblized layer was 0.22. [23]
The WisDOT Standard Specifications give the following direction to contractors regarding the rubblization process. The concrete must be uniformly broken so that the maximum dimension of any piece is 12 inches or less. In addition, 75 percent of the pieces must be smaller than the sizes shown in Figure 17. To ensure these particle size distributions are met, two 9‐ft2 test holes must be dug during the first half‐day of the rubblization operation, and if necessary, one test hole per lane mile thereafter. The engineer can adapt these requirements as necessary for conditions encountered during construction. [24]
Bottom half of slab ‐ 75% ≤ 9 inches
Top half of slab ‐ 75% ≤ 3 inches
Slab surface ‐ 75% ≤ 2 inches
Figure 17. Rubblized particle size requirements.
8. Summary and Conclusions
In April 1999, a section of concrete pavement on I‐39 between Plover and Stevens Point was rubblized and overlaid with HMA. For the majority of the project, the HMA layer was designed 6.75 inches thick. Two test sections were constructed to evaluate the effect of increased HMA thickness on rubblized pavement performance. The planned thicknesses for test sections 1 and 2 were 8.5 and 10.25 inches, respectively. Based on cores taken in 2004, the actual thicknesses of the control and test sections 1 and 2 were 7.3, 8.4 and 9.8 inches, respectively.
FWD testing conducted prior to rubblization showed that foundation support conditions were good in the area of the test and control sections. Additional FWD testing was performed annually between 2000 and 2004, when the pavement had been in service for five years.
Under constant temperature conditions, strain at the bottom of the HMA pavement layer decreased with increasing HMA thickness. At the 9.5‐kip load level, a decrease of 3 microstrain was noted for every additional 1.0 inch of HMA pavement. The highest recorded strain at 9.5 kips was 56 microstrain and occurred in the thinnest (control) section. This value was less than the commonly referenced endurance limit of 70 to 100 microstrain, below which repeated loading does not decrease the fatigue life of the HMA pavement. Therefore, it can be concluded that the actual 7.3‐in HMA thickness paved in
Page 26

the control section was adequate to provide lasting service life for the pavement. The 3 to 6 microstrain reductions achieved by the thicker test sections were likely not significant enough to provide a considerable extension of service life.
FWD testing was also used to evaluate modulus values for each layer of the pavement structure. Moduli for the HMA pavement ranged from approximately 600,000 psi in warm conditions (67°F air temperature) to over 2x10⁶ psi during colder conditions (44°F air temperature). These values are in a typical range for Superpave HMA mixtures. Base layer moduli values in the 200,000 psi range likely reflect a strong, well‐drained support layer. The calculated base moduli were below the 1x10⁶ psi threshold indicating that the PCC slab had been sufficiently broken, and cracks would likely not reflect through to the HMA surface. [18] Moduli of the subgrade layer ranged from 20,000 to 30,000 psi and exceeded the proposed 10,000 psi minimum support value for foundation support in a rubblized construction project. [3]
Automated pavement surveys for PDI, IRI and rutting were performed until 2010, when the pavement had been in service for 11 years. PDI values were low overall (less than 20), indicating good performance of the rubblized pavement system. PDI values were slightly lower in the test sections compared to the control section in 2007 and 2010, the last two years for which data were available. IRI values were typically less than 1.0 m/km, which signifies very good ride quality in the test and control sections. The measured rut depth was less than one tenth of an inch in all pavement sections after 11 years in service.
A visual survey conducted in 2007 (eight years in service) noted transverse cracks in the control section and other areas with a designed HMA thickness of 6.75 inches. It is possible that these cracks had reflected at the locations of previous joints in the PCC pavement. No distresses were noted in the test sections. Combined with the PDI data discussed above, these performance results suggest that the thicker HMA pavement resulted in delayed crack formation. Continued monitoring is necessary to determine how long each thicker pavement section will effectively resist crack formation.
A cost evaluation showed that, using current bid prices, an additional 1.75‐in HMA layer costs approximately $144,100 per project mile. According to the LCCA, the pavement designed for test section 1 would have to remain in service with no rehabilitation for the entire 50‐year design period to be cost‐effective compared to the control section. This is an unrealistic expectation. Test section 2 could not achieve cost‐effectiveness during the 50‐year design period. As constructed, test section 1 (1.0‐in actual thickness increase compared to the control section) could be cost‐effective if it remained in service for eight years longer than the control section prior to major rehabilitation.
Continued monitoring of the test and control sections is necessary to determine how long rehabilitation can be delayed with each of the thicker test sections. Preliminary results show at least a 3‐year delay of crack formation in the test sections compared to the control section. However, strain data indicated that the thicker sections did not significantly reduce the potential for fatigue cracking; the control section thickness was adequate. These results suggest that additional HMA thickness is not necessary
Page 27

for long‐term performance and is likely not a cost‐effective strategy to extend the rubblized pavement system's service life.
9. Recommendations
Based on pavement performance, structural testing using the FWD and life cycle cost analyses, increased HMA thickness is likely not a cost‐effective strategy to extend the service life of pavement systems that include a rubblized PCC pavement layer. While distress formation was delayed in the thicker test sections after 11 years in service, justification for the additional cost of the thicker pavement has not been demonstrated. In addition, estimated strain values in the control section were low enough that excessive fatigue would not cause a decrease in expected service life.
The current WisDOT procedures for selecting and designing rubblization projects are sound. When FWD equipment is available, it is also prudent to take measurements of the underlying support conditions, as this is a critical factor in successful breaking of the PCC pavement. During construction, test holes are essential to determine whether the PCC pavement is adequately broken. As with all pavement construction, good quality assurance is critical to ensure that adequate HMA pavement thickness is placed. Higher strain levels occur in thinner pavement sections, so any reduction from plan thickness could result in shorter pavement life.
Rubblization is overall a useful tool for state agencies. Long term performance can be achieved when the HMA pavement is designed as it would be in a situation where new base course was placed. Rubblization extends the investment in the original PCC pavement, eliminating the need for new base course material. Pavement removal and hauling costs are also reduced.
Page 28

References
1. Owusu‐Ababio, S. and Nelson, T. "Investigation and Application of Fractured Slab Techniques for PCC Pavements." University of Wisconsin‐Platteville. Report no. WI/SPR‐05‐99, Wisconsin Department of Transportation. Apr. 1999.
2. Nelson, T. and Owusu‐Ababio, S. "Rubblization of STH 16 Using the Multi‐Head Breaker." University of Wisconsin‐Platteville. Report no. WI/SPR‐07‐97, Wisconsin Department of Transportation. Dec. 1997.
3. Von Quintus, H., Rao, C., Mellela, J., and Aho, B. "Guidance, Parameters, and Recommendations for Rubblized Pavements." Report No. WHRP 06‐13, Wisconsin Highway Research Program, Wisconsin Department of Transportation. Jan. 2007.
4. Ceylan, H., Gopalakrishnan, K., and Kim, S. "Rehabilitation of Concrete Pavements Utilizing Rubblization and Crack and Seat Methods (Phase II): Performance Evaluation of Rubblized Pavements in Iowa." IHRB Project TR‐550, CTRE Project 05‐237, Iowa Highway Research Board, Center for Transportation Research and Education, Iowa Department of Transportation. Apr. 2008.
5. Wienrank, C. and Lippert, D. "Illinois Performance Study of Pavement Rubblization." Transportation Research Circular Number E‐C087. Jan. 2006.
6. National Asphalt Pavement Association. "Rubblization: Design and Construction Guidelines on Rubblizing and Overlaying PCC Pavements with Hot‐Mix Asphalt." Information Series 132. Jan. 2006.
7. Decker, D. and Hansen, K. "Design and Construction of HMA Overlays on Rubblized PCC Pavements: State of the Practice." Transportation Research Circular Number E‐C087. Jan. 2006.
8. Scullion, T. "Nondestructive Testing Results from the Rubblized Concrete Pavement on Interstate 10 in Louisiana." Transportation Research Circular Number E‐C087. Jan. 2006.
9. CTC and Associates, LLC. "Concrete Pavement Rubblization: A Survey of State Practice and Related Research." Wisconsin Department of Transportation Research and Library Unit. Mar. 2010.
10. Wolters, A.S., Smith, K.D., and Peterson, C.V. "Evaluation of Rubblized Pavement Sections in Michigan." Transportation Research Record 2005, Transportation Research Board, Washington, D.C. Dec. 2007.
11. Gulen, S., Noureldin, A.S., and Weaver, J. "Life and Cost Comparison of Three Rehabilitation Techniques on I‐65 Between SR‐2 and SR‐114." Report No. FHWA/IN/JTRP‐2004/8, Indiana Department of Transportation, Federal Highway Administration. Jun. 2004.
12. The Advanced Transportation Research Engineering Laboratory (ATREL). "Structural Characteristics of HMA Overlay on Rubblized PCC Pavement." University of Illinois at Urbana‐Champaign. Submitted to the Wisconsin Asphalt Pavement Association. Apr. 2001.
Page 29

13. Von Quintus, H.L. "Hot‐Mix Asphalt Layer Thickness Design for Longer‐Life Bituminous Pavements." Transportation Research Circular Number 503: Perpetual Bituminous Pavements. TRB, Washington, D.C. Dec. 2001.
14. Carpenter, S.H., Ghuzlan, K.A., and Shen, S. "Fatigue Endurance Limit for Highway and Airport Pavements." Transportation Research Record: Journal of the Transportation Research Board, No. 1832. TRB, National Research Council, Washington, D.C. 2003.
15. Wisconsin Statutes. Chapter 348, "Vehicles ‐ Size, Weight and Load." Aug. 2009.
16. Lukanen, E., Stubstad, R., and Briggs, R. "Temperature Predictions and Adjustment Factors for Asphalt Pavement." Federal Highway Administration Report No. FWHA‐RD‐98‐085. Jun. 2000.
17. Borter, R., Clark, T., and Irwin L. MODTAG Version 4.0 FWD Analysis Program. Virginia Department of Transportation and Cornell Local Roads Program, Cornell University. Aug. 2007.
18. Witczak, M.W. and Rada, G.R. "Asphalt Concrete Overlay Design Methodology for Fractured Portland Cement Concrete Pavements." Transportation Research Record 1374, Transportation Research Board, Washington, D.C. 1992.
19. Wisconsin Department of Transportation Standard Specifications for Highway and Structure Construction. Part 4, Section 460, "Hot Mix Asphalt Pavement." 2010 Edition.
20. Wisconsin Department of Transportation Facilities Development Manual. Chapter 14, Section 15, "Pavement Type Selection," Subject 10, "Life Cycle Cost Analysis Computation Parameters." Nov. 2009.
21. Wisconsin Department of Transportation Facilities Development Manual. Chapter 14, Section 15, "Pavement Type Selection," Subject 1, "Process." Nov. 2009.
22. Wisconsin Department of Transportation Facilities Development Manual. Chapter 14, Section 25, "Pavement Rehabilitation," Subject 15, "Concrete Pavement Rubblization." Nov. 2009.
23. Ji, Y. "Mechanistic Evaluation of Rubblized Pavements." Report No. FHWA/IN/JTRP‐2008/10. Joint Transportation Research Program (Purdue University and Indiana Department of Transportation). Jan. 2009.
24. Wisconsin Department of Transportation Standard Specifications for Highway and Structure Construction. Part 3, Section 335.3.2, "Rubblizing." 2010 Edition.
Page 30

Appendix A Backcalculated Strain Values, 5 kip Load Level
0
5
10
15
20
25
30
35
0 500 1000 1500 2000 2500
AC Microstrain
Distance from start of control section (ft)
Control Section
Section 1
Section 2
Figure A‐1. Strain data backcalculated from June 22, 2000 FWD test results, 5‐kip load.
Page 31

0
5
10
15
20
25
30
35
0 500 1000 1500 2000 2500
AC Microstrain
Distance from start of control section (ft)
Control Section
Section 1
Section 2
Figure A‐2. Strain data backcalculated from October 22, 2001 FWD test results, 5‐kip load.
0
5
10
15
20
25
30
35
0 500 1000 1500 2000 2500
AC Microstrain
Distance from start of control section (ft)
Control Section
Section 1
Section 2
Figure A‐3. Strain data backcalculated from September 4, 2002 FWD test results, 5‐kip load.
Page 32
0
5
10
15
20
25
30
35
0 500 1000 1500 2000 2500
AC Microstrain
Distance from start of control section (ft)
Control Section
Section 1
Section 2
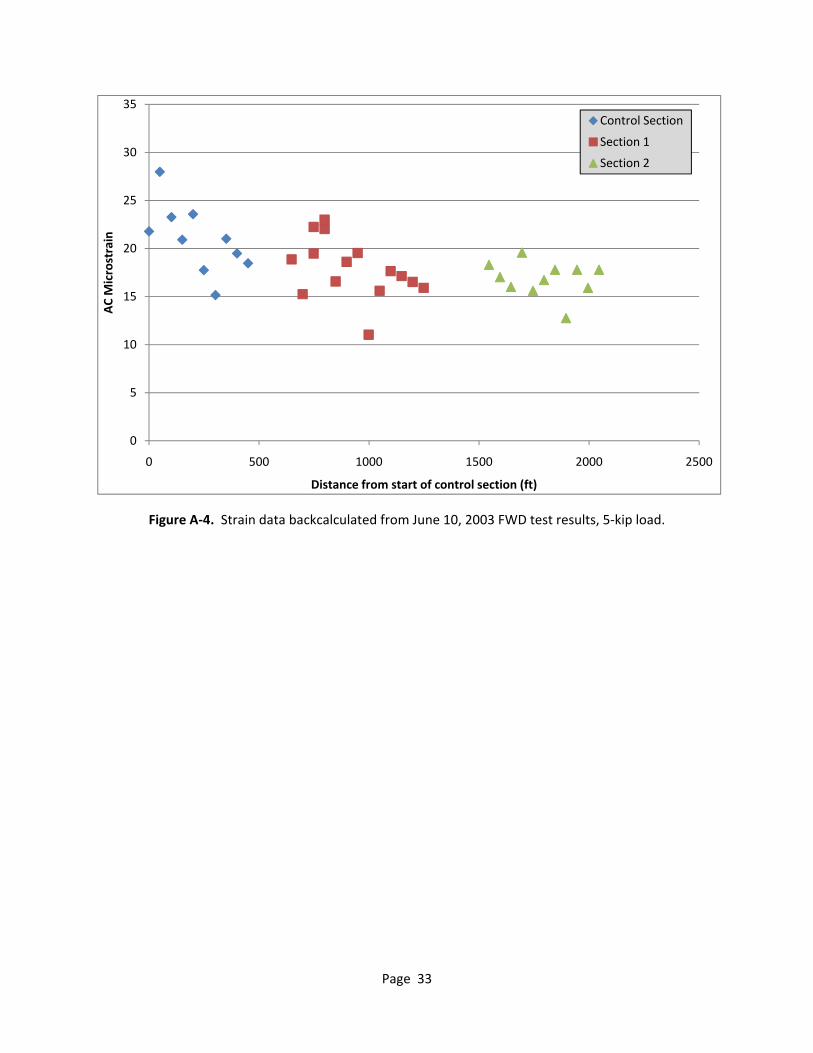
Figure A‐4. Strain data backcalculated from June 10, 2003 FWD test results, 5‐kip load.
Page 33

Appendix B Backcalculated Strain Values, 12.5 kip Load Level
0
10
20
30
40
50
60
70
80
90
0 500 1000 1500 2000 2500
AC Microstrain
Distance from start of control section (ft)
Control Section
Section 1
Section 2
Figure B‐1. Strain data backcalculated from June 22, 2000 FWD test results, 12.5‐kip load.
Page 34

0
10
20
30
40
50
60
70
80
90
0 500 1000 1500 2000 2500
AC Microstrain
Distance from start of control section (ft)
Control Section
Section 1
Section 2
Figure B‐2. Strain data backcalculated from October 22, 2001 FWD test results, 12.5‐kip load.
0
10
20
30
40
50
60
70
80
90
0 500 1000 1500 2000 2500
AC Microstrain
Distance from start of control section (ft)
Control Section
Section 1
Section 2
Figure B‐3. Strain data backcalculated from September 4, 2002 FWD test results, 12.5‐kip load.
Page 35
0
10
20
30
40
50
60
70
80
90
0 500 1000 1500 2000 2500
AC Microstrain
Distance from start of control section (ft)
Control Section
Section 1
Section 2
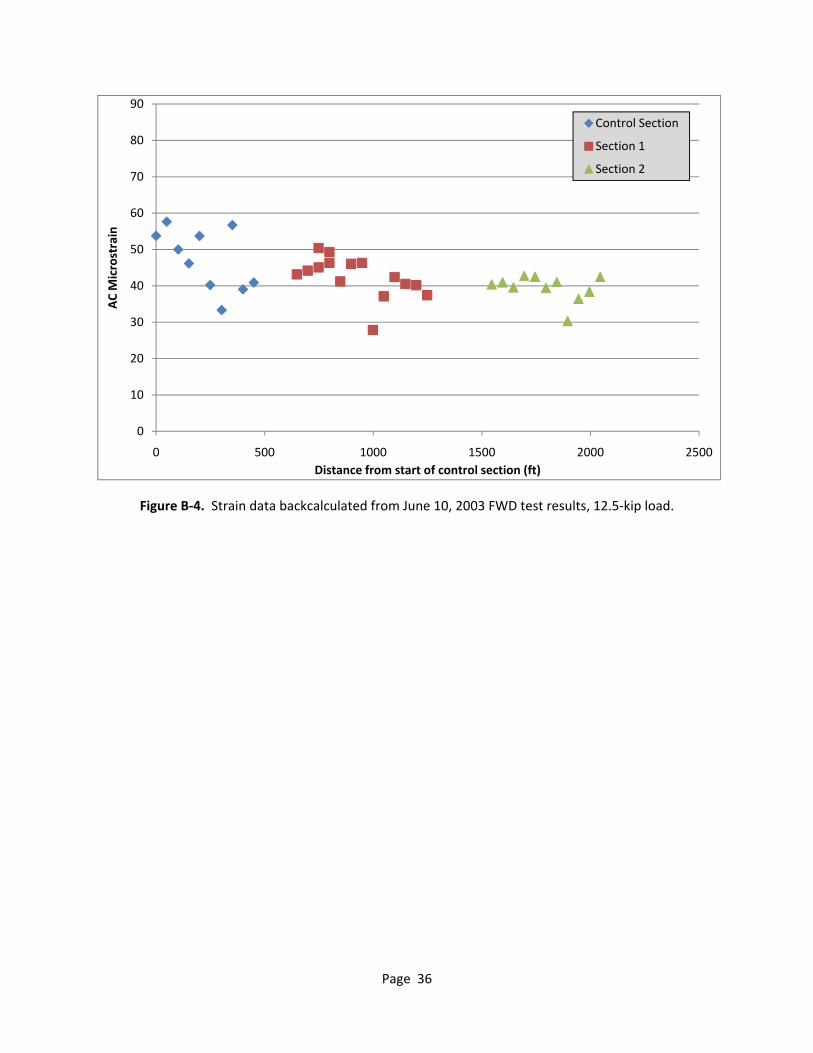
Figure B‐4. Strain data backcalculated from June 10, 2003 FWD test results, 12.5‐kip load.
Page 36

Appendix C Backcalculated Strain Values, 20 kip Load Level
0
20
40
60
80
100
120
0 500 1000 1500 2000 2500
AC Microstrain
Distance from start of control section (ft)
Control Section
Section 1
Section 2
Figure C‐1. Strain data backcalculated from June 22, 2000 FWD test results, 20‐kip load.
Page 37

0
20
40
60
80
100
120
0 500 1000 1500 2000 2500
AC Microstrain
Distance from start of control section (ft)
Control Section
Section 1
Section 2
Figure C‐2. Strain data backcalculated from October 22, 2001 FWD test results, 20‐kip load.
0
20
40
60
80
100
120
0 500 1000 1500 2000 2500
AC Microstrain
Distance from start of control section (ft)
Control Section
Section 1
Section 2
Figure C‐3. Strain data backcalculated from September 4, 2002 FWD test results, 20‐kip load.
Page 38

0
20
40
60
80
100
120
0 500 1000 1500 2000 2500
AC Microstrain
Distance from start of control section (ft)
Control Section
Section 1
Section 2
Figure C‐4. Strain data backcalculated from June 10, 2003 FWD test results, 20‐kip load.
Page 39

Appendix D Backcalculated Pavement Layer Moduli
1000
10000
100000
1000000
10000000
0 500 1000 1500 2000 2500
Mod
ulus (p
si)
Distance from start of control section (ft)
HMA
Base
Subgrade
Figure D‐1. Moduli data backcalculated from June 22, 2000 FWD test results.
Page 40

1000
10000
100000
1000000
10000000
0 500 1000 1500 2000 2500
Mod
ulus (p
si)
Distance from start of control section (ft)
HMA
Base
Subgrade
Figure D‐2. Moduli data backcalculated from October 22, 2001 FWD test results.
1000
10000
100000
1000000
10000000
0 500 1000 1500 2000 2500
Mod
ulus (p
si)
Distance from start of control section (ft)
HMA
Base
Subgrade
Figure D‐3. Moduli data backcalculated from September 4, 2002 FWD test results.
Page 41

Page 42
1000
10000
100000
1000000
10000000
0 500 1000 1500 2000 2500
Mod
ulus (p
si)
Distance from start of control section (ft)
HMA
Base
Subgrade
Figure D‐4. Moduli data backcalculated from June 10, 2003 FWD test results.