Embed Size (px)
Citation preview

7
Evaluation of Topguard Applied Before and After Planting for Control of Cotton Root Rot
Thomas Isakeit, Professor and Extension Plant Pathologist
Department of Plant Pathology and Microbiology Texas A&M AgriLife Extension Service, College Station, TX
Gaylon D. Morgan, Professor and State Cotton Agronomist
Dale A. Mott, Extension Program Specialist Department of Soil and Crop Sciences
Texas A&M AgriLife Extension Service, College Station, TX
Archie Abrameit, Farm Manager Department of Soil and Crop Sciences
Texas A&M AgriLife Extension Service, Thrall, TX
Introduction In 2015, the fungicide flutriafol, sold as “Topguard Terra”, received a label for control of cotton root rot, caused by the soilborne fungus, Phymatotrichopsis omnivora. This fungicide is labeled for at-plant applications only, either by a T-band or modified in-furrow technique. The modified in-furrow technique may perform better under conditions of low rainfall than the T-band technique. The T-band technique may be preferable with fields that are sprinkler irrigated. Ideally, irrigation or rain occurs shortly after crop emergence (several days to two weeks), to redistribute the fungicide. The crop should never be planted dry, then watered in, because of an enhanced risk of phytotoxicity. Unfortunately, phytotoxicity as delayed or reduced emergence may occur if there is rain before crop emergence. Additionally, we have observed performance problems caused by clogging of application orifices. With these concerns in mind, the objective of our experiments was to evaluate pre-plant and post-plant methods of application to improve efficacy and minimize phytotoxicity. Materials and Methods
The experiments were located in a field at the Stiles Farm in Thrall, Williamson County. The soil, a Burleson clay, was planted May 19, 2014 to Phytogen 499 using a 38” row spacing in a strip till system. The plant population was 37,000/A. Plots were established in an area of the field with a known history of cotton root rot. For the post-plant treatment, Topguard Terra (4.16 lb./gal. flutriafol), was applied with a CO2 sprayer at 18 psi in a volume of 6 gpa, using a Teejet XR80015 VS tip. A four-inch band was applied on the soil surface, directly above the seed, at a rate of 8 fl.oz./A. Applications were made at the cotyledon stage (May 25), two to three true leaves (June 7), and eight true leaves (June 26), which were followed by soil-saturating rains after two, two and seven days, respectively. Each rate was replicated four times and each replicate was two rows by 60 feet and there were two non-treated rows between treatments. For the pre-plant treatment, Topguard Terra was knifed into the seedbed on April 18 – about a month before planting – at a rate of 8 fl.oz./A in a volume of 6 gpa, at depths of 2, 4, and 6 inches.

8
There were heavy rains on May 8 and May 13 that packed the disturbed seedbed prior to planting. Each depth was replicated four times and each replicate was two rows by 100 feet and there were two non-treated rows between treatments. In both experiments, treatments were arranged in a randomized complete block design. Both experiments also included a T-band application, which was done with a XR 8002 VS Teejet nozzle, using a volume of 5 gpa. Diseased plants were counted during the season. Defoliants were applied on September 11 and September 25 and the plots were harvested October 10 using a picker. Results and Discussion All three timings of post-plant application of 8 fl.oz./A Topguard Terra significantly (P=0.05) reduced disease, in comparison with the control (Table 1). The disease control of these applications was similar to the T-band application at planting. However, the 31-52% yield increases of the treatments were not significantly (P=0.05) different from the control (Table 1). Table 1. Effect of At-Plant and Post-Plant Topguard Terra Treatments on Cotton Root Rot and Seed Cotton Yield at the Stiles Farm in Thrall, TX.
Topguard Terra Treatment (8 fl.oz./A) Diseased plants (%)* Yield (bale/A)* None (control) 55 a 0.8 a T-band, at planting 8 b 1.3 a Surface band, cotyledon 21 b 1.1 a Surface band, 2-3 true leaves 13 b 1.3 a Surface band, 8 true leaves 16 b 1.1 a
*Mean of four replicates. Means followed by different letters are significantly (P=0.05) different. Two-row plots, 60 ft long. Evaluated Sept. 27. Harvested Oct. 10.
A pre-plant application of 8 fl.oz./A into the planting furrow one month before planting significantly (P=0.05) reduced the incidence of root rot and significantly (P=0.05) increased yield (Table 2). The disease control and yield response was comparable to a 8 fl.oz./A T-band application at planting. The highest yield and disease control was with the 24 fl.oz./A rate of Topguard Terra, which is not a labeled rate. Table 2. Effect of At-Plant and Pre-Plant Topguard Terra Treatments on Cotton Root Rot and Seed Cotton Yield at the Stiles Farm.
Treatment Diseased plants (%)* Yield (bale/A)* Control 75 a 0.4 c Pre-plant, 8 fl.oz./A, 2 inches deep 28 cd 0.8 b Pre-plant, 8 fl.oz./A, 4 inches deep 48 b 0.7 b Pre-plant, 8 fl.oz./A, 6 inches deep 43 bc 0.7 b T-band, 8 fl.oz./A 18 de 0.6 bc T-band, 24 fl.oz./A 3 e 1.1 a *Mean of four replicates. Means followed by different letters are significantly (P=0.05) different. Two-row plots, 100 ft long. Evaluated Sept. 27. Harvested Oct. 10.

9
In this pre-plant knifing experiment, the seedbed was restored by rains that occurred between the application of Topguard Terra and planting. This requirement might make such an application risky under dryland conditions. Although very encouraging, the results of this experiment need to be confirmed in other locations, reflecting variations in rainfall, soil types, and the practices of growers, before any changes in the current procedures for applying Topguard Terra can be recommended. Additionally, from a legal standpoint, a change in the label would also be necessary. Acknowledgements We thank Michael C. Spiegelhauer for assistance with planting and Drs. Wayne Smith and Steve Hague for providing access to gins. This work was supported by the Texas State Support Committee and Cheminova, Inc.

10
CORN RESPONSE TO CARRYOVER SOIL NITROGEN
Dr. Dennis Coker, Extension Program Specialist, College Station Dr. Mark McFarland, Extension State Soil Fertility Specialist, College Station
Ryan Collett, Extension Agent-AG/NR, Hill County Marty Jungman, Extension Agent-IPM, Hill/McLennan Counties
Objective This trial was implemented to confirm statewide research showing producers may be able to utilize available, residual nitrate-N within the top 24 inches of the soil profile. The goal was to evaluate how producers may be able to take advantage of this residual nitrate-N in the following season’s corn crop. Materials and Methods In the fall of 2013, soil samples were taken in the cooperators field east of Covington, TX. Samples were taken with a deep sampling probe mounted on the back of a pickup truck down to 4 ft. For the purpose of this trial, residual Nitrate-N was only calculated from 0-24 inches of the soil profile. It is possible for producers to reach this depth using only a hand probe for soil sampling. The Texas A&M Agrilife Soil Testing Laboratory ran the samples stratified at the following depths: 0-6 in, 6-12 in, and 12-24 in. These results are giving as parts per million (ppm) Nitrate-N which is converted to actual lbs. of residual Nitrate-N per acre by multiplying by 2 for each six inch increment. The following table displays the results by the depth of the soil sample column. The total residual Nitrate-N in the field was 62 lbs./ac. Soil sample column depth Residual Nitrate-N (parts per
million) Residual Nitrate-N (lbs./acre)
0-6 inches 0 ppm 0 lbs./acre 6-12 inches 8 ppm 16 lbs./acre 12-24 inches 11.5 ppm 46 lbs/acre Total 0-24 inches 19.5 ppm 62 lbs/acre The field was planted by the producer on Marc 7th 2014 with the corn variety Golden Acres GA 6641. According to the standard soil sample, the recommended amount of Nitrogen needed to meet the full yield goal of 120 bu/acre was 130 lbs N/acre. The treatment area of the field was flagged off and received no additional nitrogen applications by the producer after the fall of 2013. Four treatments were made and replicated in a randomized complete block design. Plots were 4-rows wide and 20 feet long with 5 foot alleys between replications. The rows were planted on 30” spacing. Nitrogen treatments were made on May 22, 2014 when the corn was at the V10 stage. Treatments were applied by distributing granular urea by hand into a two-inch furrow made with a hoe, then back filled with topsoil using a garden rake. Each of the four treatments equaled the full yield goal recommendation of 130 lbs. of actual Nitrate-N. The treatments were as follows:

11
Treatments: Treatment 1: Control, no additional N applied Treatment 2: Credit N to 24 inches deep, applied 68 lbs. N/ac Treatment 3: Credit N to 12 inches deep, applied 114 lbs. N/ac Treatment 4: Full yield goal rate of N, applied 130 lbs. N/ac Results and Discussion There were no statistical differences among nitrogen treatments for corn grain test weight or grain yield. Grain yields ranged from 193 to 209 bu/acre. Fully crediting carryover N to two feet produced a yield of 204 bu/acre, with an N fertilizer savings of 62 lbs/acre compared to the nitrogen fertilizer rate of 130 bu/acre based on yield goal. Treatments %
moisture Test weight
(lb/bu) Yield
(bu/ac)
1. No additional N 13.00% a 58.4 a 193 a 2. 68 lb N/ac, Credit to 24 in 12.80% a 57.9 a 204 a 3. 114 lb N/ac, Credit to 12 in 12.70% a 58.2 a 209 a 4. Yield goal N, 130 lb N/ac 12.70% a 58.4 a 208 a * Means not connected by the same letter are significantly different *All yields adjusted to 15% moisture Conclusion With the high cost of nitrogen fertilizer and a trending lower value of grain, it is vital producers make their fertility applications as efficient and cost effective as possible. The results of this study have been seen by in many areas of Texas. Producers can utilize a deep profile soil sample and credit the nitrogen found in the top two to four feet of the soil. Depending on weather conditions, previous crop, and cultural pracices, different fields may hve different levels of residual nitrogen. Therefore it is vital that producers refer to a soil sample when crediting residual nitrogen. Acknowledgements Appreciation is extended to Rodney and Derek Schronk for generously donating their time, land, and equipment to conduct this result demonstration. Special thanks is also extended to all the seed companies for furnishing the seed as well as to Apex grain for running the moisture and test weight analysis. Thanks also to Drs. Calvin Trostle and Tony Provin for the oil content and crop valuation, and to Troy Sinkule for volunteering as a possible second location for this study.

12
Field Evaluation of AgraBurstTM for Corn and Cotton Production
in the Central Texas Blacklands
Dennis L. Coker, Program Specialist II – Soil Fertility Mark L. McFarland, Regents Fellow, Professor and Associate Head
Gaylon D. Morgan, Professor and State Cotton Specialist Ronnie W. Schnell, Assistant Professor and State Cropping Systems Specialist
Dale A. Mott, Program Specialist II – Cotton Production Department of Soil and Crop Sciences, College Station
Archie H. Abrameit, Program Specialist and Former Stiles Farm Manager, Thrall
Texas A&M AgriLife Extension Service
Introduction
AgraBurstTM is a liquid product sold by GroGenesis which claims to increase the natural surfactant properties of plant foliage, enabling more rapid and efficient absorption of light, water, and nutrients at the cellular level. Cotton and corn are major crops in Texas, historically grown annually on approximately 6 million and 2.5 million acres, respectively. The purpose of this project was to evaluate the potential use of AgraBurst to improve yields and/or quality of these important crops. Materials and Methods Field studies were conducted on both corn and cotton at the Stiles Farm Foundation near Thrall, in Williamson County, Texas in 2014. Background soil samples were collected at study sites prior to treatment application and again following crop harvest, and analyzed for pH, conductivity, and primary, secondary, and micronutrients by the Texas A&M AgriLife Extension Soil, Water and Forage Testing Laboratory in College Station, Texas. Regionally appropriate cultivars of each crop were selected and planted. Soil-applied nitrogen and phosphorus were subsurface, side-dress banded before planting or soon after emergence at both study sites using recommended rates based on soil test results. Corn Individual plots were four rows wide and 70 feet in length. Intra-row spacing was 38 inches. The study was designed as randomized complete blocks with six replications. Corn hybrid Pioneer P1395HR was planted on April 22 into a Burleson clay (Fine, smectitic, thermic Udic Haplusterts). The planting population was 32,000 seeds per acre. Gravimetric soil moisture at planting (to 6-inch depth) averaged 16.4 percent. In-season cultural practices, pest control, and defoliation were managed according to current Extension recommendations. Treatments were initiated as follows:
1. 6 oz. AgraBurst/A in-furrow and 6 oz. AgraBurst/A foliar applied at V-5 stage

13
2. 10 oz. AgraBurst/A foliar applied at 2-3 leaf and V-5 stages 3. 10 oz. AgraBurst/A foliar applied at 2-3 leaf, V-5, and pre-tassel stages 4. 5 oz. AgraBurst/A foliar applied at 2-3 leaf and V-5 stages 5. 20 oz. AgraBurst/A foliar applied at 2-3 leaf and V-5 stages 6. No AgraBurst (control)
The in-furrow treatment was applied using 6 gallons/acre of water, and all foliar treatments were applied using 10 gallons/acre of water. A ground-driven, planter-mounted CDS-John Blue piston pump was used for the in-furrow treatment and a backpack sprayer with CO2 pressure source was used to apply the foliar treatments. In-season data collection included emergence/stand counts, plant height at two growth stages, and ear leaf chlorophyll (SPAD 502) readings at flowering. Plots were harvested mechanically using a combine with capability to determine plot weight, test weight, and grain moisture. Plots were combined on August 14. All data were statistically analyzed using analysis of variance and means separated using Fisher’s Protected LSD, where appropriate. Cotton Individual plots were four rows wide and 40 feet in length, with 40-inch row spacing. Study design was a randomized complete block with six replications. Phytogen 499WRF was planted on April 22 into a Burleson clay (Fine, smectitic, thermic Udic Haplusterts). In-season cultural practices, pest control, and defoliation were managed according to current Extension recommendations. Treatments were initiated as follows:
1. 10 oz. AgraBurst/A foliar applied each at a) 2nd true leaf, b) squaring, and c) 21 days after 2nd application.
2. 5 oz. AgraBurst/A foliar applied each at a) 2nd true leaf, b) squaring, and c) 21 days after 2nd application.
3. 20 oz. AgraBurst/A foliar applied each at a) 2nd true leaf, b) squaring, and c) 21 days after 2nd application.
4. 10 oz. AgraBurst/A foliar applied each at a) 2nd true leaf, and b) squaring. 5. 10 oz. AgraBurst/A foliar applied each at a) 2nd true leaf, and b) 21 days after squaring. 6. No AgraBurst (control)
In-season data collection included emergence/stand counts, plant height, total node counts, and number of nodes above white flower. The two center rows of each plot were mechanically harvested on September 30. For each plot, a 150 g subsample of seedcotton was ginned to determine lint yield and gin turnout. Additionally, loan value was calculated on a pound basis and lint value on an acre basis for each harvested seedcotton sample. Afterward, a 50 g subsample of fiber was removed and submitted to the Texas Tech Fiber & Biopolymer Research Institute for fiber quality analysis. All data were statistically analyzed using analysis of variance and means separated using Fisher’s Protected LSD, where appropriate.

14
Results and Discussion Corn In-furrow application of AgraBurst had no effect on stand counts of emerged corn at 10 or 18 days after planting (Table 1). In addition, corn plant height at V8 and pre-tassel stages and SPAD readings of ear leaf chlorophyll at flowering were not different across treatments (Table 2). Table 1. Effect of in-furrow-applied AgraBurst on emergence of rain-fed corn at the Stiles Farm, Williamson County, TX. Treatment Application Plant Stand Counts
Rate Timing 10 Days After Planting 18 Days After Planting
oz/A
-----------#/20 row feet------------
0 N/A 32§ 33
6 In-furrow 34 34
P>(F)
0.2213 0.2354
CV
5 2.5 §Means within a column were not different according to ANOVA (P≤0.05). Table 2. Effect of in-furrow and foliar-applied AgraBurst on plant height and uppermost unfolded leaf chlorophyll of rain-fed corn, Stiles Farm, Williamson County, TX. Treatment Application In-Season Measurements‡
Rate Timing Plant Height at
V6 Plant Height at
Pre-tassel
Ear Leaf Chlorophyll at
Flowering
oz/A
------------cm------------ (SPAD)
0 Na 17§ 189 58.9
6, 10 In furrow, V5 17 189 59.2
5 V2 and V5 17 188 59.6
10 V2 and V5 16 187 59.5
20 V2 and V5 17 188 60
P>(F)
0.6019 0.9785 0.4019
CV
5.8 3 2.2 ‡Plant height is the mean of six plants and leaf chlorophyll is the mean of eight plants per replication. §Means within a column were not different according to ANOVA (P≤0.05).

15
Grain yield, test weight, and moisture of grain were statistically the same in untreated and AgraBurst-treated plots (Table 3). Grain yields ranged from 135 to 141 bu/acre and were average to above average for that area. Table 3. Grain yield, test weight, and moisture response of rain-fed corn to applied rates of AgraBurst at the Stiles Farm, Williamson County, TX. Treatment Application Harvest Measurements
Rate Timing Grain Yield‡ Test Weight Moisture
oz/A
bu/A lb/bu % 0 None 140§ 58 11.9 6, 10 In furrow, V5 141 57.9 11.9 5 V2 and V5 141 57.8 11.8 10 V2 and V5 135 57.8 11.9 10 V2, V5, and Pre-tassel 140 57.9 11.9 20 V2 and V5 141 57.9 11.9
P>(F)
0.8293 0.6313 0.5243 CV
6.38 0.44 1.14
‡Grain yield corrected to 15.5% moisture. §Means within a column were not different according to ANOVA (P≤0.05). To enable treatment comparisons, soil test data were normalized using the difference between pre-treatment and after harvest analyses. No differences in soil test parameters were observed (Tables 4 and 5). Table 4. Soil test results for pre-treatment samples collected from control plots and the 10 oz./acre foliar AgraBurst treatment applied at V2, V5, and pre-tassel for corn production, Stiles Farm, Williamson County, TX. Parameter Units Treatment Control AgraBurst† pH 8 8 Conductance µmhos/cm 415 437 NO3-N ppm 26 26 P ppm 20 20 K ppm 225 233 Ca ppm 8565 8817 Mg ppm 144 145 S ppm 6 6 Na ppm 12 11 Fe ppm 6.4 6.7 Zn ppm 0.5 0.5 Mn ppm 7.9 7.4 Cu ppm 0.4 0.4

16
Table 5. Soil test results for post-harvest samples from control plots and 10 oz./acre foliar AgraBurst treatment applied at V2, V5, and pre-tassel for corn production, Stiles Farm, Williamson County, TX. Parameter Units Treatment Control AgraBurst† pH 8‡ 8 Conductance µmhos/cm 210 217 NO3-N ppm 8 8 P ppm 13 14 K ppm 198 201 Ca ppm 8062 8209 Mg ppm 125 126 S ppm 7 8 Na ppm 11 11 Fe ppm 6.3 6.6 Zn ppm 0.3 0.4 Mn ppm 3.2 3.9 Cu ppm 0.3 0.3 †Represents 10 oz. AgraBurst/acre application at V2, V5 and pre-tassel stages of corn growth. Cotton There were no differences between treatments in early-season stand counts, mid-bloom plant height, total nodes, and late-bloom nodes above white flower (Table 6). Table 6. Effect of foliar-applied AgraBurst on cotton, Stiles Farm, Williamson County, TX. Treatment Application In-Season Measurements†
Rate Timing Stand Counts,
June 17
Plant Height, July 1
Total Nodes July 1
Nodes Above White Flower
oz/A
(#/0.001 A) (inches) (#) (#) 0 Na 38‡ 21 11 3
10 2nd TL, Squaring, Squaring + 21 days 37 20 11 3
5 2nd TL, Squaring, Squaring + 21 days 35 21 11 3
20 2nd TL, Squaring, Squaring + 21 days 40 20 14 3
10 2nd TL, Squaring 39 20 11 3
10 2nd TL, Squaring + 21 days 36 20 11 3
P>(F)
0.266 0.864 0.3547 0.8961 CV
10.5 8.6 24.1 11.9

17
Cotton lint yield, gin turnout, and loan and lint values were not affected by treatment (Table 7). Lint yields ranged from 531 to 570 lbs/acre and were typical for the area. Likewise, fiber micronaire, length, strength, and uniformity were not affected by treatment (Table 8). Table 7. Effect of foliar-applied AgraBurst on lint yield, gin turnout percentage, and loan and lint values of rain-fed cotton, Stiles Farm, Williamson County, TX. Treatment Application Yield Measurements
Rate Timing Lint Yield Gin Turnout Loan Value Lint Value
oz/A
(lb./A) (%) (cents/lb.) ($/A)
0 Na 564† 43.4 54 304
10 2nd TL, Squaring, Squaring + 21 days 564 43.8 53 301
5 2nd TL, Squaring, Squaring + 21 days 531 43.3 54 286
20 2nd TL, Squaring, Squaring + 21 days 551 43.4 54 298
10 2nd TL, Squaring 552 43.8 54 297
10 2nd TL, Squaring + 21 days 570 43.9 54 306
P>(F)
0.8412 0.8462 0.4651 0.8945
CV
9.7 2.2 0.9 9.9 †Means within a column were not different according to ANOVA (P≤0.05).

18
Table 8. Effect of foliar-applied AgraBurst on the fiber quality of rain-fed cotton, Stiles Farm, Williamson County, TX. Treatment Application Fiber Quality Measurements
Rate Timing Micronaire Length Strength Uniformity
oz/A
(units) (inches) (g/tex) (ratio)
0 N/A 4.1† 1.1 32 84
10 2nd TL, Squaring, Squaring + 21 days 4.2 1.1 32 83
5 2nd TL, Squaring, Squaring + 21 days 4.2 1.1 32 84
20 2nd TL, Squaring, Squaring + 21 days 4.1 1.1 32 84
10 2nd TL, Squaring 4.1 1.1 33 84
10 2nd TL, Squaring + 21 days 4.2 1.1 32 84
P>(F)
0.743 0.5613 0.6645 0.108
CV
3.8 1.2 2.9 0.7 †Means within a column were not different according to ANOVA (P≤0.05). Results of laboratory analyses on soil samples collected pre-treatment and after harvest from the cotton study sites are presented in Tables 9 and 10. Table 9. Soil test results for pre-treatment samples collected from control plots and the 20 oz./acre foliar AgraBurst treatment for cotton production, Stiles Farm, Williamson County, TX. Parameter Units Treatments Control AgraBurst† pH 7.8 7.7 Conductance µmhos/cm 321 330 N ppm 13 17 P ppm 11 12 K ppm 208 205 Ca ppm 8695 8509 Mg ppm 103 115 S ppm 7 9 Na ppm 10 11 Fe ppm 8.8 8.4 Zn ppm 0.3 0.3 Mn ppm 11.9 13.2 Cu ppm 0.5 0.4 †Represents 20 oz. AgraBurst/acre application at 2nd true leaf, squaring, and 21 days after second application.

19
Table 10. Soil test results for post-harvest samples collected from control plots and the 20 oz./acre foliar AgraBurst treatment for cotton production, Stiles Farm, Williamson County, TX. Parameter Units Treatments Control AgraBurst† pH 8.1 8 Conductance µmhos/cm 355 340 NO3-N ppm 7 7 P ppm 13 14 K ppm 198 196 Ca ppm 8374 8136 Mg ppm 97 105 S ppm 9 8 Na ppm 9 9 Fe ppm 4.4 4.6 Zn ppm 0.3 0.3 Mn ppm 4.3 4.2 Cu ppm 0.3 0.3 †Represents 20 oz. AgraBurst/acre application at 2nd true leaf, squaring, and 21 days after second application. As with treatment comparisons in the corn study, data were normalized using the difference between pre-treatment and after harvest analyses in the cotton study. No significant changes were observed.
Conclusions Neither soil nor foliar applications of AgraBurst significantly improved yields of corn or cotton grown in the Central Blacklands of Texas during the first year of study. Additionally, the emergence, growth and leaf color of corn, and emergence and growth of cotton did not respond to soil- and foliar-applied AgraBurst. Observed differences in the change in soil test values over the growing season due to AgraBurst application were limited and not considered to be biologically significant. A second year of testing this product was warranted to evaluate potential temporal as well as spatial variations in crop response. Studies have been continued in 2015 at the Stiles Farm in Williamson County and at the TAMU Research Farm in Burleson County. Acknowledgements Funding for this research was provided by GroGenesis. Assistance with land preparation, use of equipment, and pesticide and irrigation inputs provided by Archie Abrameit at the Stiles Farm Foundation are greatly appreciated.

20
Malt Barley Variety Performance in Central Texas
Clark Neely, Small Grains and Oilseed Extension Specialist Daniel Hathcoat, Small Grains and Oilseed Program Specialist
Russell Sutton, Small Grains Research Scientist Introduction At one point in time, barley was grown on nearly 600,000 acres in Texas, but acres have steadily decreased since then to under 20,000 acres by 1999 (final year reported by NASS). As acres decreased in the state, so did active barley research, breeding and new varietal development in Texas. The last variety released by Texas A&M AgriLife was ‘TAMbar 501’ in 2004. Recent interest by producers and consumers in locally grown ingredients has revealed a need for the continuation of barley research in Texas. Until now, Texas has not been considered a malting barley region, but the development of a local malting facility and interest by in-state breweries for local ingredients provides a possible market for locally grown malting barley. Therefore, variety testing of new barley cultivars under Texas environments is needed to identify adapted varieties. Methods and Materials In 2012-13 and 2013-14, a multi-location malting barley trial was planted at Castroville, McGregor, and Thrall (Stiles Farm), TX to evaluate commercial malting barley varieties. Both spring and winter 2-row and 6-row varieties were evaluated for yield and test weight. Malt quality was assessed from plots harvested in 2014. In 2012, both spring and winter barley types were planted simultaneously in November at Thrall while in 2013 winter types were planted October 24 and spring planted on December 5. Both winter and spring barleys were harvested on May 23 and June 3 in spring of 2013 and 2014, respectively. Results There were no statistical differences among the spring varieties for yield in 2013 except that Conlon was significantly lower than CDC Meredith and CDC Copeland. Because of an early harvest, Endeavor yielded the best of the winter lines in 2013 due to its early maturity. TAMbar 501, a winter feed barley variety, topped the trial for yield (95.5 bu a-1) in 2014 (Figure 1). Statistically, Craft, Hays, Pinnacle, KSW Joy, and Violetta all were in the next highest yielding group along with a wheat check in 2014. Interestingly, the spring types yielded very comparatively to winter types in 2014. CDC Kindersley, Pinnacle, and Endeavor all had consistently lower protein content compared to other varieties in both years. TAMbar 501 had the lowest protein of the winter lines in 2014; however the winter lines tended to have higher protein content compared to the spring lines. Based on measured quality parameters (data not shown), an overall malting quality score index was determined. Conlon numerically had the highest quality score, although Craft, Pinnacle, and Hocket all were in the top scoring group statistically along with Conlon. The spring types tended to have better malting quality overall compared to the winter types.

21
Bird-cherry oat aphids were the primary pest observed in barley plots in both years. In addition to physical plant injury from aphid feeding, these insects can vector barley yellow, which can significantly reduce yields, particularly if early fall infestations occur. Early season scouting and control of these pests is advised. Fungal diseases such as barley leaf, stripe, and stem rust were largely absent from trials in 2012-13, but leaf rust was observed in 2013-14. These diseases have been known to reach economic thresholds in Texas. Discussion Malt barley commands a much better price than feed grade barley and is quite competitive with wheat prices. Considering that yields of many of the barley varieties were comparable or exceeded the wheat check in the trial, this crop could be economically viable assuming a market develops. Results are encouraging in the first two years, however, the consistency of yield and especially quality under Texas environments needs to be confirmed before malters and brewers invest in Texas malting barley. This project is on-going and additional years of data will shed light on the best adapted barley varieties for this region. Successful malting barley varieties could diversify cropping systems and meet a niche market that could provide economic benefits for producers, malters, and brewers in the state of Texas.
Figure 1. Malt barley variety trial yield and test weight results at Thrall, TX (Stiles Foundation Farm) harvested in 2013 and 2014.

22
Acknowledgements The authors would like to thank Archie Abrameit and others at the Stiles Farm Foundation for their participation in land preparation and cooperation in making this a successful trial. Funding was provided by Blacklands Malt.

23
Wheat and Oat Variety Performance in Central Texas
Clark Neely, Small Grains and Oilseed Extension Specialist Daniel Hathcoat, Small Grains and Oilseed Program Specialist
Introduction The Texas A&M AgriLife Extension Service has overseen the wheat and oat variety trial in Williamson County for four consecutive years. Local variety trials are important in testing adaptation of new variety releases and comparing them to already established lines used by producers. Data collection for multiple years and multiple sites is critical for appropriate variety selection. Environmental conditions vary each year and certain characteristics may be advantageous under certain conditions, but are not representative of the site on average. New varieties can offer better yield and more disease and insect resistance options for producers as well. Many producers use this information to decide which varieties to plant each season. Variety selection not only influences yield potential, but also other management practices such as grazing, fertility, and insecticide and fungicide applications. Methods and Materials In 2015, this trial included 20 hard red winter wheat (HRWW) and six oat varieties. Wheat and oats were planted on November 13 and harvested on May 28, 2015. Oat plots were lost due to excessive rainfall and lodging in 2015. Grain yield, seed moisture, and test weight data were collected and analyzed as a four replicate, randomized complete block design in SAS 9.2 using ANOVA and LSD for mean separation. Results Summarized data for the HRWW and oat varieties are presented in Tables 1 and 2, respectively. Tables include recorded yields from data collected from 2012 through 2015 along with test weights from the most recent year harvested. Moderate and severe stripe rust levels were present in 2014 and 2015, respectively, and likely impacted yield of susceptible varieties both years. TAM 401, Gallagher, Cedar, WB4458, Doans and CJ were statistically all top yielding varieties in 2015. TAM 304, Billings, TAM 401, and Duster were all statistically top yielders based on the 4 year average. Doans and Ruby Lee had the highest test weights in 2015 while TAM 204 exhibited the lowest test weight. Of the varieties with only a 3 year average, Gallagher and Cedar were in the top yielding group. TAMO 411 is a new oat variety release that has consistently performed well at this location the past three years. Statistically, TAMO 411, Horizon 270, and RAM 99016 all yielded the best in 2014. Bob and Big Mac yielded the lowest. Test weights were consistently low among all entries in 2014, but no differences were detected. Discussion This information is important in highlighting yield-stability of varieties over years. When developing small grains management practices, selection of multiple varieties is a recommended practice in order to spread out risk due to inherent environmental variability. For more

24
information on variety performance across the state, please visit our website at http://varietytesting.tamu.edu/wheat. Acknowledgements The authors would like to thank Archie Abrameit and others at the Stiles Farm Foundation for their participation in land preparation and cooperation in making this a successful trial.
Variety 4-year‡ 3-year 2-year 2015TAM 304 53.0 50.9 48.8 48.5 51.8Billings 51.9 45.1 40.5 46.9 51.0TAM 401 49.6 45.2 50.1 51.6 51.8Duster 48.6 49.9 47.4 48.0 55.5Greer 46.4 41.8 44.4 40.6 47.8Fannin 46.4 42.7 37.6 34.8 53.8Coronado 36.6 30.6 35.7 30.5 53.4Jackpot 34.5 33.0 36.3 27.0 50.9Gallagher 52.2 51.4 55.4 55.0Cedar 51.8 54.7 56.2 54.1TAM 305 44.9 46.0 43.6 55.3WB4458 44.3 48.2 54.3 54.6Doans 44.2 50.3 54.2 56.9Iba 43.7 45.9 40.5 54.7Ruby Lee 43.4 41.5 36.6 56.1Armour 41.2 37.7 28.9 52.7Redhawk 43.1 38.8 54.8TAM 114 42.3 34.3 52.6TAM 204 41.7 35.1 46.4CJ 53.5 53.5LSD 5.4 4.1 4.2 7.5 1.1CV 16.6 11.3 9.3 11.9 1.4Mean 45.9 44.0 44.4 42.7 53.1
Test Wt (lb/bu)
†Varieties ranked according to 4-year, 3-year, 2-year, then 2015 yield averages.‡Green indicates highest yield and red indicates lowest yield within each column.
Yield (bu/a) †
Table 1. Hard red winter wheat variety yields from data collected at the Stiles Farm from 2012 through 2015.
Variety 3-year‡ 2-year 2014TAMO 411 91.0 92.5 91.0 31.5Horizon 270 83.9 81.7 90.8 30.8RAM 99016 77.1 79.1 91.0 31.5TAMO 606 64.3 74.0 78.3 30.1Bob 55.9 60.7 55.9 30.7Big Mac 58.4 58.4 30.3LSD 7.0 7.9 11.1 1.5CV 11.1 9.1 9.2 3.1Mean 74.7 76.2 77.0 30.8
Table 2. Oat variety yields from data collected at the Stiles Farm from 2012 through 2014.
†Varieties ranked according to 3-year, 2-year, then 2014 yield averages.‡Green indicates highest yield and red indicates lowest yield within each column.
Yield (bu/a) † Test Wt (lb/bu)

25
Effect of Deep Carryover Nitrogen on Corn Production
Dennis Coker, Program Specialist II Mark McFarland, Regents Fellow, Professor and Associate Head
Department of Soil and Crop Sciences, College Station
Ryan Collett, Stiles Farm Manager Marty Jungman, Agent-IPM, Hill/McLennan Counties
Texas A&M AgriLife Extension Service
Introduction Corn is widely rotated with cotton annually on approximately 2.5 million acres in Texas and is the most important crop grown for feed and bio-fuel feedstock in the United States. Improved management of nitrogen (N) fertilizer for corn production is necessary from both economic and environmental standpoints. Applied N in cropping systems is subject to biological interactions, and loss through leaching, runoff, and volatilization. Additional information was needed about how effectively corn grown in Hill County could utilize deep, residual N, particularly N underutilized and carried over from the previous season. Objective This study was implemented in 2014 to confirm multi-year, statewide research results that demonstrated producers of corn for grain may be able to utilize carryover, residual nitrate-nitrogen (NO3-N) within the top 24 inches of the soil profile. Materials and Methods Cotton was grown in 2013 in a cooperators field located east of Covington, TX which included the 2014 study site. During fall of 2013, soil samples were collected to four feet with a hydraulically-operated probe mounted on the back of a pickup truck. Two sets of soil cores were composited from incremental soil depths for each of four sites that represented 0.7 acres. For the purpose of this study, only residual NO3-N to 24 inches of the soil profile was utilized as a “credit” toward treatment applications of N. Under conditions of adequate moisture, it is possible for producers to reach this depth using a hand probe to collect soil samples. The Texas A&M Agrilife Extension Soil, Water and Forage Testing Laboratory analyzed individual samples from each of the following depths: 0-6, 6-12, and 12-24 inches, respectively. These results are given as parts per million (ppm) with NO3-N converted to actual pounds of residual NO3-N per acre by multiplying by two for each six-inch depth increment (Table 1). Average, total residual NO3-N to 24 inches across the study area was 62 pounds per acre.

26
Table 1. Average amount of residual NO3-N present in soil samples at incremental soil depths, Hill County, 2014. Depth of Soil Sample Residual Nitrate-N Residual Nitrate-N (inches) (parts per million) (lb/A) 0-6 0 0 6-12 8 16 12-24 11.5 46 Total 0-24 19.5 62 Corn variety GA 6641 was planted by the producer on March 7, 2014. According to a yield goal estimate of 120 bushels per acre and the standard six-inch soil sample, the recommended amount of additional N needed was 130 pounds per acre. The study area of the field was flagged and received no additional N applications by the producer after the fall of 2013. Treatments were replicated four times and arranged in a randomized complete block design. Plots were four rows wide and 20 feet long with 5 foot alleys between replications. Row spacing was 30 inches. Nitrogen treatments were initiated on May 22, 2014 when the corn was at the V10 stage. Treatments were subsurface, side-dress applied by hand distributing granular urea into a two-inch furrow made with a hoe before covering with topsoil. Treatments: Treatment 1: Control, no additional N applied Treatment 2: Credit N to 24 inches deep, applied 68 lb N/ac Treatment 3: Credit N to 12 inches deep, applied 114 lb N/ac Treatment 4: Full yield goal rate of N, applied 130 lb N/ac Based on soil residual and applied NO3-N amounts, treatments two and three were equivalent to treatment five or the full yield goal recommendation of 130 pounds of actual NO3-N per acre. Results and Discussion There was no statistical difference between any of the nitrogen treatments (Table 2). The untreated check had the lowest numerical yield at 193 bushels per acre. Corn yields of 204, 209, and 208 bushels per acre were observed in treatments crediting NO3-N to 24 and 12 inches, as well as those receiving a full rate of N, respectively. Table 2. Effect of deep profile, residual N management on grain moisture, test weight and yield of corn, Hill County, TX, 2014. Treatments† Moisture Test Weight Yield‡ (%) (lb/bu) (bu/A) 1. No additional N 13.0§ 58.4 193 2. 68 lb N/ac, Credit to 24 inches 12.8 57.9 204 3. 114 lb N/ac, Credit to 12 inches 12.7 58.2 209 4. Yield goal N, 130 lb N/ac 12.7 58.4 208 †Grower and agent saw no visual differences between plots throughout the growing season. §Means within a column were not significantly different according to ANOVA F Test (P≤0.05)

27
Conclusions With the high cost of N fertilizer and a trending lower value of grain, it is vital producers manage their fertility applications as efficiently and cost effectively as possible. The results of this study have been confirmed by 29 previously-conducted studies representing the Central Blacklands and Upper Gulf Coast Regions of Texas. Utilizing deep profile soil samples to credit carryover NO3-N found in the top two feet of soil, growers will not only improve their production economics for corn but also minimize potential environmental impacts. Depending on climatic conditions, occurrence of drought, previous crops, and cultural practices, different fields will likely have varying levels of residual NO3-N present in the soil profile. Therefore, it is vital that producers refer to a representative soil samples collected annually in order to properly credit residual NO3-N. Acknowledgements Appreciation is extended to Rodney and Derek Schronk for generously donating their time, land, and equipment to conduct this result demonstration. Special thanks is also extended to all the seed companies for furnishing the seed as well as to Apex grain for analyzing moisture and test weights of samples. Thanks also to Troy Sinkule for volunteering as a possible second location for this study.

28
Evaluation of Cotton Yield, Quality, and Plant Growth Response to Soil-Applied Potassium
Michael C. Spiegelhauer, Extension Graduate Assistant
Gaylon D. Morgan, Professor and State Cotton Agronomist Mark L. McFarland, Professor and State Soil Fertility Specialist
Dennis L. Coker, Extension Program Specialist Dale A. Mott, Extension Program Specialist Tony L. Provin, Professor and State Chemist
Department of Soil and Crop Sciences Texas A&M AgriLife Extension Service, College Station, TX
Mike Stewart International Plant Nutrition Institute
Southern and Central Great Plains Director San Antonio, TX
Introduction For the past decade, Texas has continued to dominate U.S. cotton production. Much of the state’s cotton is produced on clay soils in the Blacklands of Texas and Gulf Coast. Although K deficiencies have been reported in these regions in various years over the past 20 years, the frequency of reported K deficiency symptoms seems to be on the rise, and the geographic occurrence seems to be increasing as more K is mined from the soils. Additionally, under deficient K levels, cotton plants are more prone to foliar diseases that can further reduce the yield potential. Previous research has shown a two bale cotton crop will remove 30 lbs K/acre. While a 2 bale rainfed crop is generally considered strong, increased yield potential in new varieties and better pest management have pushed cotton yields to 3-4 bales, and even exceeding 5 bales on irrigated land. As K demand continues to increase, deep profile soil samples indicate a reduced level of plant available K in some production areas. The objective of the research was to evaluate the effect of K application rates and methods on cotton growth, development, yield, and fiber quality.
Materials and Methods Studies were initiated at two field sites with a previous history of K deficiency, one in Williamson County in the Blacklands region and one in Wharton County in the Upper Gulf Coast region. Based on soil test results, 0 and 60 lbs K2O/acre were recommended for the Wharton and Williamson sites, respectively, and soil test K (ammonium acetate) levels were 150 and 60 for the sites. Treatments were 0, 20, 40, 80, 120, and 160 lbs K2O/acre applied using liquid 0-0-15 as KCl, and 40, 80, 120, and 160 lbs of K2O/acre applied as a granular 0-0-60. The liquid K treatments were injected approximately four inches to the side of the row at a 6 inch depth. The dry treatments were broadcast by hand and incorporated with light tillage. Both K application methods occurred 2 - 3 weeks prior to planting. In early April, cotton cv. DP 0935B2RF was planted into a Lake Charles clay loam at the Wharton site. In mid-April, cv.

29
Phytogen 499WRF was planted into a Burleson clay at the Williamson county site. Phosphorous and nitrogen were applied according to soil test recommendations for 2 bale/acre cotton yield goal.
In-season plant measurements included stand counts, plant height, nodes to first fruiting branch, and total nodes. After harvest, yield was calculated, and samples sent to Cotton Inc. for HVI analysis. For return on investment calculations, a base value of 75 cents/lb of lint was used and then lint values calculated using the 2013 loan calculator provided by Cotton Inc. The return on investment calculations only include fertilizer costs and are presented relative to the untreated check. Fertilizer prices used were $520 per ton of 0-0-60 and $275 per ton of 0-0-15.
Results and Discussion Yield and other significant data for the 2013 crop are presented in Figures 1-4. There was below normal rainfall for most of the growing season at both locations, but good yields were obtained due to the timeliness of the rain. Visually, the biggest differences between treatments were the presence and severity of K deficiency symptoms in the leaves. Plots with higher rates of K, especially injected liquid K, showed fewer K deficiency symptoms. Higher rates of K had a small effect on plant height in the Wharton location but seemingly no effect at the Williamson location (Figure 1). Near the end of the season, weather conditions were conducive for some foliar disease, and disease symptoms were observed in the K deficient treatments. Overall, there appears to be a positive correlation with amount of K applied, and the impact on yield and plant health. Treatments with a high rate of liquid K had higher yields compared to a similar rate of dry K at both locations (Figure 2). This could be attributed to placement and mobility of K in the soil. The liquid K was placed in the active root zone while the dry K was less plant available due to dry soil surface conditions.
The highest rates of injected K had a slight positive effect on lint loan price at the Wharton location, while the dry K had no significant effect. At the Williamson location, there were mixed effects on loan price due to high micronaire (Figure 3). When the K rate and price factors are used to calculate the net return on investment, fewer significant differences were observed for both sites (Figure 4). Despite the highest injected rates being considered unrealistic for farmers, a significant return on investment was obtained from the higher injected rates. As with yield, the liquid treatments had a higher return on investment than the dry treatments of a similar rate.

30
A AB AB AB AB AB AB B AB AB
A A A A AB AB AB AB AB B
0
5
10
15
20
25
30
35in
ches
Figure 1: Plant Height
Williamson Co. Wharton Co.
A A AB AB
CD C BC CD CD D
A A AB
BC BCD BCD CD
BCD CD D
0
200
400
600
800
1000
1200
1400
lbs/
a
Figure 2: Yield
Williamson Co. Wharton Co.

31
Conclusions Applications of K had a positive effect on yield and fiber quality in soils with 150 ppm of soil K or less. Treatments with injected liquid K showed greater plant response than treatments with dry K and therefore a higher K use efficiency. Return on investment was higher, on average, for the injected treatments versus the dry treatments.
BCD
A
D BCD D D CD D
AB ABC
A AB ABC ABC ABC C ABC ABC ABC BC
636567697173757779
cent
s/lb
Figure 3: Net Loan Price
Williamson Co. Wharton Co.
A A
A
A
A A
A
A A
A A AB
ABC ABC
CD
BCD
D $0.00
$50.00
$100.00
$150.00
$200.00
$250.00
Figure 4: Return on Investment
Williamson Wharton

32
Acknowledgements We would like to thank the Stiles Farm Foundation for the use of their land and equipment, Mr. Glenn Emshoff for the use of his land: Cotton Inc. for providing fiber analysis and financial support: United Agricultural Cooperative, Inc. for donating the fertilizer; IPNI for partial support of this research.

33
Impact of Soil Applied Potassium on Cotton Yield, Quality, and Plant Growth in Texas
Gaylon Morgan, Professor and State Cotton Agronomist Chase Vasbinder, Graduate Assistant
Dale Mott, Extension Program Specialist II Dr. Dennis Coker, Extension Program Specialist II
Mark McFarland, Professor and State Soil Fertility Specialist Tony Provin, Professor and State Soil Chemist
Abstract
In recent years, various areas in the Texas Blacklands and Gulf Coast agricultural production regions have reported increased incidence of potassium (K) deficiencies in cotton. Cotton, specifically, is sensitive to low potassium levels reducing yields and fiber quality, as well as making the cotton plant more susceptible to some foliar diseases. In 2013 and 2014, eight locations were chosen to conduct trials on the rate of potassium applied to cotton, as well as the application methods. These sites ranged from low (60 ppm) to high (350 ppm) potassium levels in the soil. Treatments included four rates of granular (0-0-60) broadcasted and incorporated and five rates of liquid (0-0-15) injected fertilizer, as well as, untreated plots. In-season data collection included: plant height, nodes to first fruiting branch, total nodes, and leaf tissue sampling. The plots were harvested by various means, depending on the location. After harvesting was completed, samples were weighed and ginned. Lint samples were sent to Cotton Inc. to test fiber properties by HVI and AFIS analysis. The 2014 trials were non-responsive to the treatments at these two locations, unlike the 2013 trials which had a positive correlation between the amount of fertilizer and application method and yield.
Introduction
For the past decade, Texas has continued to become a larger percentage of the total U.S. cotton production. Much of the cotton production in Texas occurs on clay soils in the Blacklands of Texas and Gulf Coast production regions and potassium deficiencies have been reported in these regions in various years over the past 20 years. However, the frequency of the potassium deficiency symptoms seems to be on the rise, and the geographic occurrence seems to be increasing also as more potassium is mined from the soils. Additionally, under deficient potassium levels, cotton plants are more prone to foliar diseases that can further reduce the yield potential. Potassium is required in large amounts by cotton for normal growth and fiber development. Potassium plays a major role in photosynthesis, activation of protein enzymes, increases disease and drought resistance, and positively affects cotton fiber yield and quality. Previous research has shown a two bale cotton crop will remove 30 lbs/acre of potassium annually. However, increased yield potential in new varieties and better pest management have pushed cotton yields to 3-4 bales and can exceed 5 bales on irrigated land. As potassium demand

34
continues to increase, deep profile soil samples indicate a reduced level of plant available potassium in some production areas.
Objective
To evaluate the effect of K application rates and methods on cotton growth, development, yield, and fiber quality.
Materials and Methods
The 2013 and 2014 trials were carried out in two regions in the Blacklands region including Williamson County at the Torres, Poncho, and Gin sites, as well as, Hill County. Wharton County, in the Upper Gulf Coast, was also included in the trails in both years. The plots were arranged in a Randomized Complete Block Design with five replications. Plot dimensions at the Williamson, Hill, and Wharton sites were 4-6 rows wide and 50 feet long with an in-row spacing of 38, 30, and 40 inches, respectively. Soil samples were collected to a total depth of 48 inches from these locations and were analyzed at depth increments by the Texas A&M Soil Testing Laboratory. The soil analysis results from a Melich III extraction method and cotton varieties used in these trials are presented in Table 1. Table 2, shows the treatment data used for the trials. This data were analyzed in SAS using Fisher’s LSD means separation formula.
The granular treatments were broadcasted by hand and incorporated to an approximate depth of 2 inches with tillage. The liquid potassium fertilizer was injected approximately 6 inches deep and 4 inches to the side of the row. Approximately 2 weeks before planting the granular and liquid fertilizer treatments were applied to the plots. The recommended amount of nitrogen and
Site Year Recommended lbs K₂o/A Cotton VarietyWharton 13 0 DP 0935B2RFWharton 14 0 ST 6448GLB2
Williamson- Torres 13 60 Phytogen 499WRFWilliamson- Torres 14 20 Phytogen 499WRFWilliamson- Poncho 13 0 Phytogen 499WRF
Williamson- Gin 14 0 Phytogen 499WRFHill 13 0 DP 2570B2RFHill 14 0 DP 2570B2RF
Table 1. Soil recommendations and cotton varieties
FertilizerFormulation0-0-60 Granular untreated 40 80 120 1600-0-15 Liquid 20 40 80 120 160
Rates (lbs K₂0/A)Table 2. Treatmens used

35
phosphorous from the soil analysis were also applied to the plots to obtain 2 bale/acre yields. The Williamson and Hill County sites were planted in early April and the Wharton county site was planted in mid- April. In-season plant measurements included stand counts, plant height, nodes to first fruiting branch, and total nodes. After harvest the cotton was ginned with a table-top gin and fiber samples sent to Cotton Inc. for HVI and AFIS analysis.
Results and Discussion
Figure 1 represents soil potassium levels from 0- 48 inches over eight site years. The Williamson- Torres site was the only location where potassium levels were below the current soil test threshold of 125 ppm and in both years stayed relatively consistent throughout the profile. The Wharton site soil test in 2013 shows an increase in potassium with depth, while the 2014 soil test show a higher level of potassium in the shallow and deep ranges of soil with the lowest levels at 12-24”. The Hill county site in 2013 showed the highest levels of potassium in 0-6” at 390 ppm and tappers off throughout the profile, while in 2014 it drops down and remains at a consistent level in the profile. This is likely due to natural soil potassium variation and not soil mining. The Williamson- Gin location in 2014 shows high levels at 0-6”, but drops below the soil test threshold throughout the profile. The Williamson- Poncho site in 2013 remains consistent from 0-48”, ranging from 260 ppm to 300 ppm.
In 2013 the only locations to show a response to the potassium treatments were the Williamson- Torres, figure 2, and Wharton County sites, figure 3. Timely precipitation in 2013, along with response to applied treatments, allowed for good yields at the Williamson- Torres location. Williamson- Torres was unresponsive in 2014, with much lower yields than in 2013 likely due to unfavorable growing conditions. In the 2014 Wharton trial, cotton yield exceeded that of 2013 trial, but with no response to applied treatments. The Hill County locations, figure 4, in 2013 and 2014 yielded relatively well with a slight drop in yield from 2013 to 2014, but did not respond to the applied potassium. Figure 5 and 6 represent the yields at the Williamson- Gin and Poncho locations. The Williamson- Poncho site received adequate precipitation, which allowed it to yield well, but the Williamson-Gin site in 2014 suffered a loss in yields due to poorly timed rainfall throughout the growing season.
In 2013, treatments in soils containing less than 150 ppm showed a positive correlation in yield to the increasing rates of fertilizer, especially liquid injected treatments. In all cases in the 2014 trials, the yields varied little across treatments with no difference between high rates of fertilizer and the untreated check. Wharton county site had a higher soil potassium levels throughout the soil profile and was not responsive to the K rates or application method. Additionally, the ST 6448GLB2 is a later maturing variety with an extended fruiting period and thus placed less K demand from the soil.

36

37

38

39
Influence of Application Time of Day on Cotton Tolerance and Entireleaf Morningglory (Ipomoea hederacea) Control from Glufosinate
Paul Baumann, Professor and State Weed Scientist
Gaylon Morgan, Professor and State Cotton Agronomist Blake Baumann, Extension Assistant
Matt Matocha, Extension Program Specialist Dale Mott, Extension Program Specialist II
Introduction Phytogen Widestrike cotton varieties are widely planted throughout the cotton (Gossypium hirsutum) growing regions of the U.S., in part because of their relatively good tolerance to applications of Liberty (glufosinate) herbicide. Liberty has been shown to be an effective alternative to glyphosate herbicides for glyphosate-resistant Palmer amaranth (Amaranthus palmeri) and common waterhemp (Amaranthus rudis) control. However, cotton tolerance to glufosinate applications has been somewhat of an issue, depending largely on application timing in relation to stage of growth. Two field studies were conducted during 2014 to evaluate application time of day for glufosinate as it relates to cotton tolerance and entireleaf morningglory (lpomoea hederacea) control. Objectives
• Determine the influence of Liberty time of day of application on weed control and crop tolerance.
• Determine the influence of day versus night applications of Liberty at three rates on weed control.
Materials and Methods In one study, two rates of glufosinate were examined after applications employed at nine times of day (Figure 1.). Rates of 22 and 29 oz./A were chosen and AMS was added to ensure optimal weed management and also separation of any ill-effects on the cotton. The cotton was at the 6-8 node stage of growth during the first application and the morningglory ranged from cotyledon to 8 inch stage of growth. Visual ratings were made on weed control (percent control) and crop injury (percent necrosis plus chlorosis combined). Applications were made using a CO2 Backpack Sprayer calibrated to deliver 15 gal/A with XR8003 spray tips. In addition, a randomized complete block design was used and plots were 4 rows(40”) by 30 feet. An ANOVA was performed and means separated using Duncan’s New MRT, p=0.05. In the second study, applications were made to essentially solid infestations of morningglory (8-36 inch runners) and sporadic populations of smellmelon (Cucumis melo). Three application rates of glufosinate were applied in this study at two times of day (Figure 4). No AMS was added to the treatments in orderto separate the efficacy of the range of rates included in this study, and also due to observations from the previous experiment. Spray applications were made utilizing

40
the same spray equipment as in the first study; however, plots were 3 (40”) row by 30 feet. The same ANOVA and means separation was done as in the first study. Results and Discussion When the initial experiment was evaluated 7 DAT, applications made during darkness were numerically less injurious to cotton than those made during the daylight hours (data not shown). However, significantly less injury occurred at 22 and 29 oz./A where applications were made 3 hours after sunset, compared to those made 3 hours after sunrise. This trend was also observed at the 14 DAT rating date, along with other separations indicated in Figure 2. By the 27 DAT rating date (data not shown) injury was minor from all treatments applied, ranging from 4 to 7%. In this experiment, 0-2 inch morningglory was so effectively controlled that no differences in efficacy were observed (data not shown). Liberty at 22 and 29 oz/A (1hr. Before Sunset) and 29 oz/A (6 hrs. After Sunrise) were the only treatment timings that were statistically greater than 22 oz/A(3 hrs. After Sunrise)(86, 86, 86, and 77.5%, respectively, on 2-8 inch morningglory at 7 DAT. At 14 DAT, morningglory control increased in some cases, but no significant differences were observed among treatments with the exception of the untreated (data not shown). In the second study, evaluating control of mature entireleaf morningglory plants, midnight applications were significantly less effective at all rates examined when evaluated 7 and 42 DAT (data not shown). These day/night application differences are markedly illustrated. No translocation or absorption data was gathered from these studies. However, previous work by Eure, et.al. (2014) found that when glufosinate was applied at midnight or sunrise, substantially less herbicide was translocated out of the treated leaf, compared to applications made in the afternoon. Additionally, 29% less glufosinate was translocated below the treated leaf following applications at midnight or sunrise as compared to afternoon applications. Therefore, it is logical to assume that in the case of our studies, one explanation for increased morningglory control and cotton injury during daylight applications, could be due to increased translocation of the herbicide which increased efficacy. Conclusions Overall, applications of Liberty made after sunset resulted in less injury to cotton than those made after sunrise. Excellent control of 0-2 inch morningglory was observed by all treatments in the first study. Fair to good control was achieved on 2-8 inch morningglory with 22 and 29 oz/a rates with only three significant differences among the nine different time of day timings. In the day/night study, all rates of Liberty performed statistically better with the daytime application when compared to the nighttime on entireleaf morningglory control. References Eure, P.M., A.S. Culpepper, T.L. Grey, W.K. Vencill, S.M. Hauf, J.S. Richbourg, and K.S. Rucker. Herbicide Uptake and Translocation as Influenced by Application Time of Day. 2014 Proc. South. Weed Sci. Soc.: 279.

41
Replicated Agronomic Cotton Evaluation (RACE) South, East, and Central Regions of Texas, 2014
Dr. Gaylon Morgan1, Professor and Extension Cotton Specialist
Dale Mott1, Extension Program Specialist – Cotton John Grange13, County Extension Agent Jon Gersbach14, County Extension Agent Logan Lair15, County Extension Agent
2014 Highlights Variety selection is the most important decision made during the year. Unlike herbicide or insecticide decisions that can be changed during the season to address specific conditions and pests, variety selection is made only once, and variety selection dictates the management of a field for the entire season. Variety decisions should be based on genetics first and transgenic technology second. Attention should be focused on agronomic characteristics such as yield, maturity, and fiber quality when selecting varieties. Figure 1 illustrates the cotton production regions of Texas. From the latest data available, transgenic varieties accounted for 99% of the state acreage again in 2014. According to the USDA-Agricultural Marketing Service “Cotton Varieties Planted 2014 Crop” survey, the estimated percentage of upland cotton planted to specific Brands in Texas are as follows: Alltex had 2.5%, Americot/NexGen had 20%, Bayer CropScience – FiberMax had 39%, Bayer CropScience – Stoneville had 2.5%, Croplan Genetics had 0.5%, Delta Pine had 25%, Dyna-Grow had 3.5%, and Phytogen had 7%. Acknowledgements Appreciation is expressed to the cooperators that provided their land, equipment and time in assisting with prepping, planting, managing and harvesting of these plots throughout the year. All cooperators are listed in Table 1. In addition, we would like to extend our appreciation to Cotton Incorporated through the Texas State Support Committee, Americot/NexGen, Bayer CropScience, Croplan Genetics, Delta Pine, Dyna-Gro, and Phytogen for their partial funding of these trialsTable 1. Trial location, cooperator, planting date, harvest date, row spacing, plot dimensions and area of 2014 Texas A&M AgriLife Extension RACE Trials harvested.

42
County Cooperator
Planting Date
Harvest Date
Row Spacing (inches)
Plot Dimen-sions
Irrigated or Dryland
Area harvested/plot (acres)
Burleson
TX AgriLife Research Farm
Apr 8 Oct 2 40 2 rows x 525 ft Irrigated 0.08
Williamson Adam & Ricky Krueger
Apr 11 Sept 12 38 6 rows x 1630 Dryland 0.71
Milam Jay Beckhusen Apr 23 Sep 26 30
4 rows x 1710 ft
Dryland 0.39
Navarro Danny Ferrer Apr 25 Oct 2 36 6 rows
x 600 ft Dryland 0.26
Table 2. Variety ranking based on lint yield, Central Texas Blacklands, 2014.
Trial Variety Williamson Milam Navarro Mean PHY 333WRF 2 1 6 3.0 ST 6448GLB2 5 5 1 3.7 NG 1511B2RF 1 6 5 4.0 PHY 499WRF 3 2 7 4.0 DP 1219B2F 6 4 4 4.7 DPX 12R249B2F 4 3 8 5.0 ST 4946GLB2 7 7 3 5.7 CT 13464B2F 8 8 2 6.0 FM 1830GLT 9 9 9 9.0

43
Table 3. Burleson County RACE Trial, Snook, Texas. John Grange, CEA, Dr. G.D. Morgan, Extension Cotton Agronomist, DA. Mott, Extension Program Specialist, V. Saladino, Res. Ast.
Variety Yield (lbs/acre) Turnout (%) Microna
ire Length (inches)
Strength (g/tex)
Uniformity
Loan Value (¢/lbs)
Lint Value ($/Ac)2
ST
223
a 39.7 b-e 4
ab 1.17 d
3
bc
8
ab 54.
abc 1219 a PHY 499WRF
2234
a 42.2 a 4
b-e 1.20 cd
33
a 84
abc 54.57
a 1219 a DPX 12R224B2
2147
ab 38.4 e 3
e 1.23 ab
31
def 85
a 54.53
ab 1171 ab NG 1511B2RF
2114
ab 41.9 a 4
a 1.18 d 32
ab
84
ab 54.45
abc 1151 abc DG 2285B2F
2104
abc 39.5 cde 4
bc 1.22 b
30
f 85
a 54.23
d 1141 a-d PHY 333WRF
2085
a-d 41.1 ab 3
e 1.22 b
31
cd
84
a-d 54.55
a 1137 a-d DP 1219B2F
1940
b-e 39.1 de 4
cde 1.19 d 32
ab 83
cd 54.50
abc 1057 b-e DPX 12R249B2
1901
b-e 40.0 bcd 4
bcd 1.17 d
30
ef 83
d 54.30
cd 1033 b-e PHY 375WRF
1887
b-e 39.6 cde 4
de 1.17 d
30
f 83
bcd 54.33
bcd 1026 cde DP 1044B2F
1848
cde 39.7 b-e 4
b-e 1.15 e 30
ef 83
cd 54.30
cd 1003 de ST 6448GLB2
1838
de 38.3 e 4
b-e 1.23 ab
30
ef 84
a-d 54.33
bcd 998 de FM 1830GLT
1690
e 40.9 abc 4
de 1.26 a 31
de 84
abc 54.52
ab 921 e Mean 2002 40.0 4.2 1.20 31.5 84.2 54.42 1090 P>(F) 0.0037 0.0002 0.0014 0.0001 0.0001 0.0182 0.0232 0.0033 LSD (P 05)
262.64 1.526 0.313 0.029 1.051 1.119 0.2023 143.1 STD DEV 155.1 0.901 0.185 0.0171 0.62 0.661 0.1195 84.5 CV % 7.75 2.25 4.4 1.43 1.97 0.78 0.22 7.75 1 Indicates the location was irrigated. 2 Lint values calculated using 2014 Upland Cotton Loan Valuation Model from Cotton Incorporated. AT =AllTex, CG= Croplan Genetics, DP(X)=DeltaPine, DG= DynaGrow, FM=FiberMax, NG=NexGen, PHY=Phytogen, ST= Stoneville. Table 4. Williamson County RACE Trial, 2014. Cooperator: Adam and Ricky Krueger Dr. G. D. Morgan, Extension Cotton Agronomist, D.A. Mott, Extension Program Specialist II
Variety Yield (lbs/acre)
Turnout %
Micro-naire
Length (inches)
Strength (g/tex)
Uniform-ity
Loan Value (¢/lbs)
Lint Value ($/Ac)1
NG
148
a 42.
a 5.3 a 1.08 a 32.0 b 82.
bc
50.4
a 747 a PHY 333WRF
1425
ab 45.4
a 5.4 a 1.09 a 30.6 b
82.8
b 49.57
a 706 a PHY 499WRF
1420
ab 42.7
a 5.1 a 1.09 a 31.9 b 82.9
b 50.67
a 718 a DPX 12R249B
1313
ab
41.8
a 5.0 a 1.11 a 29.2 d 81.8
cd 51.40
a 675 a

44
ST 6448GLB
1310
ab
40.6
a 5.1 a 1.12 a 29.6 cd
82.4
bcd
51.08
a 669 a DP 1219B2F
1280
bc 42.8
a 4.8 a 1.10 a 31.4 b
81.4
d 52.72
a 675 a ST 4946GLB
1247
bc 41.8
a 4.9 a 1.14 a 32.4 b 82.5
bc 52.33
a 649 a CT 13464B2F
1220
c 39.6
a 4.9 a 1.16 a 34.5 a 84.2
a =53.450
a 651 a FM 1944GLB
840 e 31.8
d 4.7 cd
1.09 b 28.7 c 81.7
bc 53.02
ab 445 c Mean 1317 42.3 5.1 1.11 31.6 82.6 51.32 677 P>(F) 0.0459 0.0533 0.6522 0.4548 0.0018 0.0027 0.6436 0.0965 LSD (P 05)
197.3 3.07 0.63 0.0739 2.059 1.043 4.2781 89.32 STD DEV 114.00 1.77 0.36 0.04 1.19 0.60 2.47 51.60 CV % 8.66 4.19 7.18 3.84 3.77 0.73 4.79 7.63 1 Lint values were calculated using the 2014 Upland Cotton Loan Valuation Model from Cotton Incorporated. AT =AllTex, CG= Croplan Genetics, CT= Dyna-Gro, DP(X)=DeltaPine, DG= DynaGrow, FM=FiberMax, NG=NexGen, PHY=Phytogen, ST= Stoneville.

45
Table 5. Milam Co RACE Trial, 2014 Cooperator: Jay Beckhusen Jon Gershback, County Extension Agent Dr. Gaylon D. Morgan, Extension Cotton Agronomist Dale A. Mott, Extension Program Specialist II
Variety Yield (lbs/acre) Turnout % Micronaire
Length (inches)
Strength (g/tex) Uniformity
Loan (¢/lb
PHY 333WRF 1224 a 39.6 a 3.6 a 1.17 a 30.3 bc 82.3 a 53.45 PHY 499WRF 1101 a 38.4 a 3.7 a 1.14 b 31.6 ab 82.7 a 54.30 DPX
1065 a 37.9 a 3.5 a 1.15 b 30.4 bc 81.1 a 52.62
DP 1219B2F 1033 a 37.2 a 3.5 a 1.15 b 31.1 bc 81.7 a 52.8 ST 6448GLB2 1025 a 38.7 a 3.5 a 1.15 b 29.2 c 81.0 a 52.22 NG 1511B2RF 1015 a 39.6 a 4.0 a 1.12 c 30.9 bc 82.2 a 54.1 ST 4946GLB2 992 a 38.2 a 3.4 a 1.18 a 32.5 ab 83.3 a 52.67 CT 13464B2F 941 a 36.2 a 3.3 a 1.17 a 33.4 a 82.4 a 52.55 FM 1830GLT 891 a 38.0 a 3.8 a 1.18 a 31.9 ab 82.4 a 54.3 Mean 1032 38.2 3.6 1.16 31.3 82.1 53.25 P>(F) 0.1478 0.1069 0.0585 0.0001 0.0418 0.3127 0.236 LSD (P=.05) 212.63 2.272 0.393 0.0176 2.297 1.902 2.079 STD DEV 122.84 1.31 0.23 0.01 1.33 1.10 1.20 CV % 11.90 3.43 6.34 0.88 4.24 1.34 2.26
1 Lint values were calculated using the 2014 Upland Cotton Loan Valuation Model from Cotton Incorporated. AT =AllTex, CG= Croplan Genetics, CT= Dyna-Gro, DP(X)=DeltaPine, DG= DynaGrow, FM=FiberMax, NG=NexGen, PHY=Phytogen, ST= Stoneville.
46
Table 6. Navarro County RACE Trial, 2014 Cooperator: Danny Ferrer Logan Lair, County Extension Agent Dr. Gaylon D. Morgan, Extension Cotton Agronomist Dale A. Mott, Extension Program Specialist II
Variety Lint (lbs/acre) Turnout % Micronaire Length
(inches) Strength (g/tex) Uniformity Loan Va
(¢/lb)
ST 6448GLB2 849 a 42.8 a 4.0 a 1.0
a 30.2 a 82.0 a 52.93
CT 13464B2F 835 a 40.7 a 3.9 a 1.0
a 28.9 a 81.6 a 52.55 ST 4946GLB2 816 a 40.0 a 3.7 a 1.0
a 29.7 a 81.7 a 52.65
DP 1219B2F 814 a 42.6 a 3.9 a 1.1
a 30.4 a 82.4 a 53.98 NG 1511B2RF 806 a 40.9 a 3.6 a 1.1
a 30.0 a 82.4 a 53.58
PHY 333WRF 799 a 42.2 a 3.9 a 1.0
a 30.1 a 81.7 a 52.03 PHY 499WRF 771 a 40.5 a 3.7 a 1.0
a 27.1 a 80.9 a 51.28
DPX
754 a 39.2 a 3.8 a 1.1
a 32.2 a 83.4 a 54.00 FM 1830GLT 716 a 41.6 a 3.9 a 1.1
a 29.2 a 81.9 a 53.78
Mean 789 41.0 3.8 1.10 29.7 82.0 52.98 P>F 0.9433 0.1024 0.5993 0.4963 0.2774 0.198 0.4456 LSD (P=.05) 228.77 2.494 0.486 0.065 3.526 1.626 2.8071 STD DEV 128.58 1.40 0.28 0.04 2.00 0.92 1.59 CV% 16.16 3.41 7.24 3.36 6.72 1.12 3.00 1 Lint values were calculated using the 2014 Upland Cotton Loan Valuation Model from Cotton Incorporated. AT =AllTex, CG= Croplan Genetics, CT= Dyna-Gro, DP(X)=DeltaPine, DG= DynaGrow, FM=FiberMax, NG=NexGen, PHY=Phytogen, ST= Stoneville.

47
Evaluation of Dupont INZEN Z Sorghum
Technology for Control of Grass Weeds in Sorghum Paul A. Baumann, Ph.D., Professor and State Extension Weed Specialist
Matt E. Matocha, M.S., Extension Program Specialist, Weed Science Department of Soil and Crop Sciences, College Station, TX
Joshua A. McGinty, Ph.D., Assistant Professor and Area Agronomist,
Department of Soil and Crop Sciences AgriLife Research and Extension Center, Corpus Christi, TX
During 2014 and in previous years, we have evaluated a new concept of weed management in grain sorghum that will provide growers with remedial, postemergence, selective herbicide options capable of controlling Johnsongrass and many other grass and broadleaf weed species. This concept is being developed by Dupont/Pioneer and seems very close to fruition. It focuses generally on the use of nicosulfuron herbicide (known by many as Accent) that will be formulated as a liquid, and called Zest. Varieties of sorghum have been developed that will tolerate this herbicide which will allow for planting this crop possibly in areas previously unsuitable because of pernicious weed problems. Along with this is the possibility of using sorghum as a rotational crop in a resistant weed management scheme. This is likely because sorghum tolerates several herbicides that will provide control of glyphosate resistant pigweed species and is a crop not suitable for “over the top” glyphosate use. Data presented on the next three pages indicates two appropriate rating dates (out of four total) that represent the efficacy and crop tolerance to several herbicide combinations that included Zest. Applications were made preemergence to the crop (PRE, A), and twice postemergence (POST B, C) at 4-5 inch and 9-11 inch tall sorghum. Results indicate that control of Johnsongrass was excellent (>95%) from all early POST (B) applications where Zest was included. The addition of atrazine, Clarity, Ally or 2,4-D did not improve or antagonize Johnsongrass control. Negligible injury resulted from the early applications, except where either 2,4-D or Clarity was added where some degree of lodging occurred (data not shown). Marginal control (48-60%) of either Texas panicum or browntop panicum was observed, largely due to the size of some of these plants at treatment, outside recommended treatment stage of less than 3 inches tall for the POST applications. The application C timing was made to 9-11” tall Johnsongrass 6 days after the B timing and resulted in greater than 93% control of this species, while at the same time the earlier applications showed improved efficacy as well. This study, as well as previous studies, have proven the value that this technology will bring to sorghum growers in Texas, who currently have few options for selective postemergence grass weed control. In addition, this program offers the added benefit of broadleaf control and glyphosate resistant weed management.

48
Texas A&M AgriLife Extension Service Texas A&M University
Dupont INZEN Z Sorghum Study
Experiment #:
PB14-13 Crop: Sorghum
Location: Stiles Crop variety: ALS-Tolerant Experimental design:
Randomized Complete Block
Sand/Silt/Clay Percent:
17/38/45
Plot size: 12.67’ x 30’ Planting Date: 5-23-14 Number of reps: 3 Fertility: Good Row width: 38” pH: 7.2 Soil type: Branyon Clay % OM: 1.75 APPLICATION CODE
A B C Timing PRE POST POST Date applied: 5-23-14 6-6-14 6-13-14 Time: 4:30 PM 8:30 PM 1:30 PM Air Temp. [°F]: 89°F 83°F 91°F Soil 4” Temp[°F]: 80°F 84°F 88°F R. Humidity [%]: 31% 49% 56% Wind [mph]: S @ 6 mph SE @ 4 mph SE @ 1 mph Cloud Cover: 95% 5% 5% Dew Presence: No No No Soil Surface: Dry Dry Dry Soil Moisture: Good Good Good Sprayer Type: Backpack CO2 Backpack CO2 Backpack CO2 Nozzle Size/Type: TTI 110015 TTI 110015 TTI 110015 Boom Height: 19” 19” 19” Nozzle Spacing: 19” 19” 19” GPA/PSI: 15/54 15/54 15/54 Speed [MPH]:
3.0 3.0 3.0 Weed/Crop A
(Size/Density) B
(Size/Density) C
(Size/Density)
Sorghum (SORHA)
4-5” 9-11”
Browntop Panicum (PANFA) Texas Panicum (PANTE) Johnsongrass (SORHA)
1-5”(avg 3”)/ 1-5/ft2
1-5”(avg 3-4”)/
1/ft2
5-17”(avg 8”)/
1/ft2
2-5”(avg 3”)/ 1-2/ft2
2-5”(avg 4”)/ 1/ft2
3-17”(avg 11”)/ 1/ft2

49
W Weed W Weed W Weed PANFA PANTE SORHA Dupont Inzen Z Sorghum Study Brachiaria fas> Brachiaria tex> Sorghum halepe> Browntop panic> Texas panicum Johnson grass Grain sorghum Jun-20-2014 Jun-20-2014 Jun-20-2014 Jun-20-2014 PHYCHL Control Control Control Percent Percent Percent Percent Trt Treatment Form Form Rate Growth Appl No. Name Conc Type Rate Unit Stage Code 9 6 7 8
1 ZEST (SC 40 GL) 40 SC 0.50 oz ai/a POST B 20.0 a 45.0 ab 50.0 a 90.0 a ATRAZINE 90DF (WG) 90 WG 12.00 oz ai/a POST B COC (SL 99 PC) 99 EC 1.00 % v/v POST B AMSUL (GR 100 PC) 100 GR 2.00 lb/a POST B 2 ZEST (SC 40 GL) 40 SC 0.50 oz ai/a POST B 21.7 a 40.0 b 47.5 ab 90.0 a HUSKIE (EC 2.08 LG) 2.08 EC 13.00 fl oz/a POST B ATRAZINE 90DF (WG) 90 WG 12.00 oz ai/a POST B COC (SL 99 PC) 99 EC 1.00 % v/v POST B AMSUL (GR 100 PC) 100 GR 2.00 lb/a POST B 3 ZEST (SC 40 GL) 40 SC 0.50 oz ai/a POST B 21.7 a 43.3 ab 45.0 b 85.0 a CLARITY (4SL) 480 SL 8.00 fl oz/a POST B ATRAZINE 90DF (WG) 90 WG 12.00 oz ai/a POST B COC (SL 99 PC) 99 EC 1.00 % v/v POST B AMSUL (GR 100 PC) 100 GR 2.00 lb/a POST B 4 ZEST (SC 40 GL) 40 SC 0.50 oz ai/a POST B 20.0 a 50.0 a 47.5 ab 90.0 a 2,4-D ESTE (EC 4.00 LG) 4 EC 8.00 fl oz/a POST B ATRAZINE 90DF (WG) 90 WG 12.00 oz ai/a POST B COC (SL 99 PC) 99 EC 1.00 % v/v POST B AMSUL (GR 100 PC) 100 GR 2.00 lb/a POST B 5 ZEST (SC 40 GL) 40 SC 0.50 oz ai/a POST B 21.7 a 48.3 a 50.0 a 91.7 a ALLY (60WG) 60 WG 0.05 oz/a POST B 2,4-D ESTE (EC 4.00 LG) 4 EC 8.00 fl oz/a POST B ATRAZINE 90DF (WG) 90 WG 12.00 oz ai/a POST B COC (SL 99 PC) 99 EC 1.00 % v/v POST B AMSUL (GR 100 PC) 100 GR 2.00 lb/a POST B 6 CINCH ATZ (5.5 EC) 5.5 EC 3.20 pt/a PRE A 11.7 b ZEST (SC 40 GL) 40 SC 0.50 oz ai/a MIDPOST C 2,4-D ESTE (EC 4.00 LG) 4 EC 8.00 fl oz/a MIDPOST C ATRAZINE 90DF (WG) 90 WG 12.00 oz ai/a MIDPOST C COC (SL 99 PC) 99 EC 1.00 % v/v MIDPOST C AMSUL (GR 100 PC) 100 GR 2.00 lb/a MIDPOST C 7 CINCH ATZ (5.5 EC) 5.5 EC 3.20 pt/a PRE A 13.3 b ZEST (SC 40 GL) 40 SC 0.50 oz ai/a MIDPOST C HUSKIE (EC 2.08 LG) 2.08 EC 13.00 fl oz/a MIDPOST C ATRAZINE 90DF (WG) 90 WG 12.00 oz ai/a MIDPOST C COC (SL 99 PC) 99 EC 1.00 % v/v MIDPOST C AMSUL (GR 100 PC) 100 GR 2.00 lb/a MIDPOST C 8 CINCH ATZ (5.5 EC) 5.5 EC 3.20 pt/a PRE A 13.3 b ZEST (SC 40 GL) 40 SC 0.50 oz ai/a MIDPOST C CLARITY (4SL) 480 SL 8.00 fl oz/a MIDPOST C ATRAZINE 90DF (WG) 90 WG 12.00 oz ai/a MIDPOST C COC (SL 99 PC) 99 EC 1.00 % v/v MIDPOST C AMSUL (GR 100 PC) 100 GR 2.00 lb/a MIDPOST C 9 CINCH ATZ (5.5 EC) 5.5 EC 3.20 pt/a PRE A 0.0 c

50
Dupont Inzen Z Sorghum Study W Weed W Weed W Weed
PANTE SORHA PANFA Brachiaria tex> Sorghum halepe> Brachiaria fas> Texas panicum Johnson grass Browntop panic> SORVU BGRM Sorghum bicolor Grain sorghum Plant P Plant P Plant C Plant C Jul-3-2014 Jul-3-2014 Jul-3-2014 Jul-3-2014 Control Control PHYCHL Control Percent Percent Percent Percent Trt Treatment Form Form Rate Growth Appl No. Name Conc Type Rate Unit Stage Code 17 18 19 16
1 ZEST (SC 40 GL) 40 SC 0.50 oz ai/a POST B 56.7 ab 98.3 a 1.7 a 51.7 b ATRAZINE 90DF (WG) 90 WG 12.00 oz ai/a POST B COC (SL 99 PC) 99 EC 1.00 % v/v POST B AMSUL (GR 100 PC) 100 GR 2.00 lb/a POST B 2 ZEST (SC 40 GL) 40 SC 0.50 oz ai/a POST B 57.5 ab 100.0 a 0.0 a 48.3 b HUSKIE (EC 2.08 LG) 2.08 EC 13.00 fl oz/a POST B ATRAZINE 90DF (WG) 90 WG 12.00 oz ai/a POST B COC (SL 99 PC) 99 EC 1.00 % v/v POST B AMSUL (GR 100 PC) 100 GR 2.00 lb/a POST B 3 ZEST (SC 40 GL) 40 SC 0.50 oz ai/a POST B 60.0 a 100.0 a 0.0 a 53.3 b CLARITY (4SL) 480 SL 8.00 fl oz/a POST B ATRAZINE 90DF (WG) 90 WG 12.00 oz ai/a POST B COC (SL 99 PC) 99 EC 1.00 % v/v POST B AMSUL (GR 100 PC) 100 GR 2.00 lb/a POST B 4 ZEST (SC 40 GL) 40 SC 0.50 oz ai/a POST B 60.0 a 98.3 a 0.0 a 53.3 b 2,4-D ESTE (EC 4.00 LG) 4 EC 8.00 fl oz/a POST B ATRAZINE 90DF (WG) 90 WG 12.00 oz ai/a POST B COC (SL 99 PC) 99 EC 1.00 % v/v POST B AMSUL (GR 100 PC) 100 GR 2.00 lb/a POST B 5 ZEST (SC 40 GL) 40 SC 0.50 oz ai/a POST B 60.0 a 98.3 a 0.0 a 55.0 b ALLY (60WG) 60 WG 0.05 oz/a POST B 2,4-D ESTE (EC 4.00 LG) 4 EC 8.00 fl oz/a POST B ATRAZINE 90DF (WG) 90 WG 12.00 oz ai/a POST B COC (SL 99 PC) 99 EC 1.00 % v/v POST B AMSUL (GR 100 PC) 100 GR 2.00 lb/a POST B 6 CINCH ATZ (5.5 EC) 5.5 EC 3.20 pt/a PRE A 55.0 abc 93.3 b 0.3 a 53.3 b ZEST (SC 40 GL) 40 SC 0.50 oz ai/a MIDPOST C 2,4-D ESTE (EC 4.00 LG) 4 EC 8.00 fl oz/a MIDPOST C ATRAZINE 90DF (WG) 90 WG 12.00 oz ai/a MIDPOST C COC (SL 99 PC) 99 EC 1.00 % v/v MIDPOST C AMSUL (GR 100 PC) 100 GR 2.00 lb/a MIDPOST C 7 CINCH ATZ (5.5 EC) 5.5 EC 3.20 pt/a PRE A 52.5 bc 96.7 ab 0.7 a 55.0 b ZEST (SC 40 GL) 40 SC 0.50 oz ai/a MIDPOST C HUSKIE (EC 2.08 LG) 2.08 EC 13.00 fl oz/a MIDPOST C ATRAZINE 90DF (WG) 90 WG 12.00 oz ai/a MIDPOST C COC (SL 99 PC) 99 EC 1.00 % v/v MIDPOST C AMSUL (GR 100 PC) 100 GR 2.00 lb/a MIDPOST C 8 CINCH ATZ (5.5 EC) 5.5 EC 3.20 pt/a PRE A 50.0 c 96.7 ab 0.3 a 55.0 b ZEST (SC 40 GL) 40 SC 0.50 oz ai/a MIDPOST C CLARITY (4SL) 480 SL 8.00 fl oz/a MIDPOST C ATRAZINE 90DF (WG) 90 WG 12.00 oz ai/a MIDPOST C COC (SL 99 PC) 99 EC 1.00 % v/v MIDPOST C AMSUL (GR 100 PC) 100 GR 2.00 lb/a MIDPOST C 9 CINCH ATZ (5.5 EC) 5.5 EC 3.20 pt/a PRE A 0.0 a 81.7 A

51
Grain Sorghum Seeding Rate Study
Dr. Ronnie Schnell, Extension Corn & Grain Sorghum Specialist, Department of Soil and Crop Sciences, College Station, TX
Ryan Collett, Extension Agent – CEA-AG/NR, Hill County
Marty Jungman, Extension Agent-IPM, Hill/McLennan Counties
Summary Optimum seeding rates have been investigated and discussed extensively in the High Plains and Gulf Coast of Texas. Yet, many producers in the central and northern Blacklands of Texas are using plant populations above optimum levels. This can exacerbate soil moisture limitations and result in lower yields, stalk rot diseases and lodging. Selection of optimum seeding rates is further complicated by spatial and temporal variability of pre-season soil moisture and in-season precipitation. We utilized large, replicated strip trials in collaboration with multiple growers throughout the Texas Blacklands to evaluate grain sorghum seeding rates in response to variation climate conditions. Grain sorghum has the ability to compensate for yield across a wide range of seeding rates and subsequent plant populations and moisture scenarios. Yield compensation with low plant populations under favorable conditions is accomplished through adjustments in grain head numbers per acre (tillering) and increased head size. Grain head size combined with seed size generally had greater influence on yield compared to heads per acre. Grain sorghum populations differ in their sensitivity to variability in precipitation during the growing season. High populations are much more sensitive to less than optimum and greater than optimum precipitation amounts. Under favorable conditions, the optimum seeding rate was between 65,000 and 80,000 seeds/acre. However, lower plant populations, achieved by seeding rates less than 65,000 seeds/acre demonstrated the ability to maintain yield potential across a wide range of precipitation amounts, including below normal precipitation. If precipitation is expected to be below normal (> 10%), seeding rates should be reduced to 50,000-65,000 seeds/acre. Introduction Advancements in meteorological and hydrological forecasting create an opportunity for producers to anticipate future growing conditions and decide which management practices are best for expected conditions (Wood, 2002). Yet, uncertainty exists about environmental and hydrologic thresholds that mandate specific changes to agronomic inputs. Crop inputs, such as seed, could be optimized to maximize grain sorghum yields in the Blacklands of Texas. Within the Blacklands region of Texas, variation in topsoil depth, stored soil moisture and in-season precipitation creates challenges for managing seeding rates for grain crops within the region. Similar challenges exist in other production regions of Texas. While growers recognize grain sorghums ability to withstand heat and drought stress compared to other crops, improper seeding rates often results in poor grain yield due to insufficient soil moisture, disease and

52
lodging issues. Current AgriLife recommendations for grain sorghum seeding rates in the Blacklands are from 70,000 to 80,000 seeds per acre. However, this could be too high for certain soil and weather conditions. Growers are advised to reduce seeding rates when poor soil moisture conditions are present or when below average rainfall is expected during the current growing season. Yet, decisions about altering seeding rates based on current soil moisture levels and projected weather patterns are largely subjective. Soil moisture and weather data will be an important component of models used to describe grain sorghum yield response to increasing seeding rates. Knowledge of current soil conditions coupled with seasonal or long-range precipitation outlooks could be used for more precise adjustments to seeding rates. Using advanced models to develop decision-making tools for growers to select seeding rates will be useful for producers in the Blacklands as well as other regions affected by variability in soil and weather conditions. Goals and Objectives 1. Measure grain sorghum yield in response to increasing seeding rates and compare optimum
seeding rates to soil and weather conditions in the central and northern Blacklands of Texas. 2. Increase awareness of grain sorghum and sorghum management through Extension and
outreach activities. Materials and Methods Grain sorghum seeding rate trials were imposed at multiple field sites in collaboration with local growers in five areas of the central and northern Blacklands (Thrall, Buckholts, Abbott, Malone, and Farmersville, TX). At each field, treatments were arranged in a randomized complete block design with three replications of five treatments. Treatments comprised five seeding rates (35,284, 51,455, 65,340, 81,675 and 94,090 seeds per acre) planted using a John Deere Max Emerge plus vacuum seeder with grain sorghum hybrid Pioneer 84P80. Plots were four rows wide with 30 inch row spacing at Buckholts (Beckhusen Farm), Abbott (Kaska Farm), Malone (Birdwell Farm), and Farmersville (Wright Farm) and 38 inch spacing at Thrall. Plot length extended the entire length of row for each selected field (from 600-1300 ft). Planting dates were from March 14 through April 11. Prior to planting, deep soil samples (12, 24, 36, 48 inch depth) were collected from each block to quantify soil moisture at planting. Soil moisture sensors and tipping rainfall buckets were connected to a data logger and installed at each site. Due to intermittent disruptions in rainfall data collection, radar estimates for precipitation by month were extracted for each location from NOAA - National Weather Service precipitation website. Following planting, plots were maintained according to AgriLife recommendations for the duration of the project. Within 6 weeks after planting, plant populations were measured by counting the number of plants in 40 ft of row (4, 10 ft subsamples). Sub-plots were harvested by hand for 20 ft of row, heads counted, threshed using a stationary thresher, weighed and seed numbers per pound determined on a sub sample. Hand harvest data was used to estimate yield components, including heads per acre, seeds per head, seed size and seed weight. Yield was measured for each strip-plot by harvesting the center 2-rows using a John Deere 3300 modified plot combine. The plot
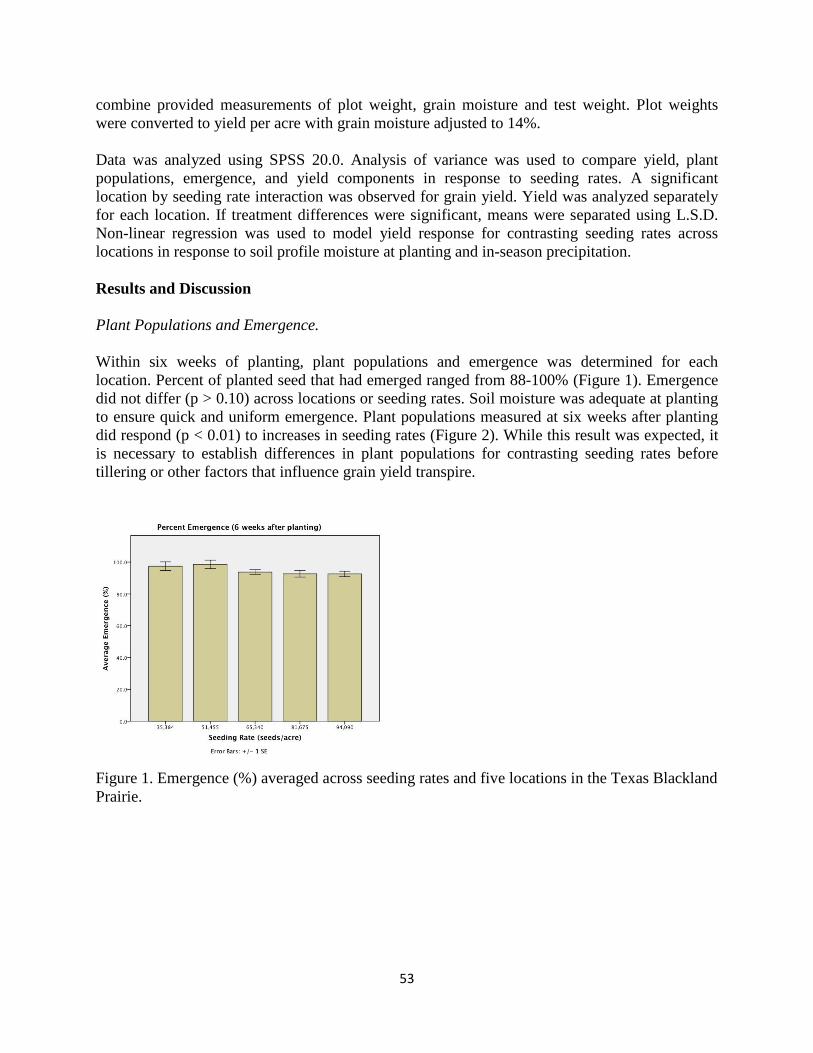
53
combine provided measurements of plot weight, grain moisture and test weight. Plot weights were converted to yield per acre with grain moisture adjusted to 14%. Data was analyzed using SPSS 20.0. Analysis of variance was used to compare yield, plant populations, emergence, and yield components in response to seeding rates. A significant location by seeding rate interaction was observed for grain yield. Yield was analyzed separately for each location. If treatment differences were significant, means were separated using L.S.D. Non-linear regression was used to model yield response for contrasting seeding rates across locations in response to soil profile moisture at planting and in-season precipitation. Results and Discussion Plant Populations and Emergence. Within six weeks of planting, plant populations and emergence was determined for each location. Percent of planted seed that had emerged ranged from 88-100% (Figure 1). Emergence did not differ (p > 0.10) across locations or seeding rates. Soil moisture was adequate at planting to ensure quick and uniform emergence. Plant populations measured at six weeks after planting did respond (p < 0.01) to increases in seeding rates (Figure 2). While this result was expected, it is necessary to establish differences in plant populations for contrasting seeding rates before tillering or other factors that influence grain yield transpire.
Figure 1. Emergence (%) averaged across seeding rates and five locations in the Texas Blackland Prairie.

54
Figure 2. Plant populations in response to increasing seeding rates averaged across five locations in the Texas Blackland Prairie.
Grain Yield Despite differences in plant populations, grain yield did not differ (p > 0.05) across seeding rates at three of the five locations. Average grain yield by location ranged from 4,834 lbs/acre (Birdwell Farm) to 7,832 lbs/acre (Kaska Farm). Grain yields for contrasting seeding rates did differ (p = 0.035) at Birdwell Farm ranging from 3,864 lbs/acre to 5,522 lbs/acre. This was primarily due to lodging that resulted from fusarium stalk rot, which is associated with early season moisture stress. Grain yield significantly (p < 0.05) declined with seeding rates greater than 81,675 (Figure 3). Grain yields were negatively correlated (r2 = 0.55) with lodging (%) scores. In contrast, grain yields at Wright Farm planted at 35,384 seeds/acre were lower (p = 0.015) than yields achieved with greater than 65,340 seeds/acre.

55
Figure 3. Grain yield and lodging (%) for contrasting seeding rates in grain sorghum near Malone, TX.
Figure 4. Grain yield by seeding rate for grain sorghum near Farmersville, TX.

56
For three of the five locations, grain yields did not differ across seeding rates. This included Abbott with an average yield of 7,833 lbs/acre, Buckholts averaged 6,756 lbs/acre and Thrall that averaged 6,712 lbs/acre. These three locations along with the Farmersville location all illustrated the ability of grain sorghum to compensate for variations in plant population. The compensation is achieved through adjustments in tillering and head size. Tillering alters the number of heads per plant to reduce differences in the number of heads per acre for contrasting seeding rates (Figure 6). While the number of heads per acre was significantly different (p < 0.000) for contrasting seeding rates, the range was from 55,056 heads/acre to 80,192 heads per/acre in contrast to the range in plant populations (Figure 2).
Figure 5. Grain yield by seeding rate for grain sorghum at Abbott, Buckholts and Thrall, TX.

57
Figure 6. Impact of seeding rate on the number of grain heads per acre averaged across five locations.
The second component that contributed to yield compensation for lower seeding rates was variation in head size (measured as seeds per head). Grain head size generally increased as seeding rates decreased (Figure 7). Principle component analysis of yield components (heads/acre, head size, seed size, and seed weight) indicated that head size combined with seed size/weight accounted for 60% of yield while heads/acre account for only 38% of yield. The combination of tillering to maintain levels of grain heads per acre and increase in head size resulted in grain yields that did not differ across a broad range of seeding rates and subsequent plant populations.

58
Figure 7. Response of grain head size to increasing seeding rates at 5 locations.
Hydrologic Conditions and Grain Yield Similar to average yield by location, hydrologic conditions differed at each location when accounting for soil profile moisture to a 4 ft depth at planting and in-season precipitation. Figure 8 shows variation in volumetric water content by depth for each location. Variation was greatest within the 0-12 inch depth although profile moisture was considered to be near field capacity or above at planting for all locations and soil depths. Soil water content (0-12 inch depth) was greatest (p < 0.01) at Farmersville and lowest at Buckholts (p < 0.01) compared to other locations. Given all locations were at field capacity or greater throughout the soil profile, in-season precipitation was expected to have a greater influence on grain yield.

59
Figure 8. Volumetric water content (%) measured by depth for each of five locations.
For three of the five locations, soil moisture sensors monitored volumetric water content at two depths, 6 and 18 inches. Rodents destroyed wiring at two locations, limiting data collection and reliability. These two stations are not reported. Figure 9 displays the volumetric water content measured at Malone, Abbott and Buckholts over approximately 110 days. Profile moisture at a 6 –inch depth remained relatively unchanged for at least 30 days. Beyond 30 days after planting, plant size and leaf area increased in combination with higher air temperatures increasing crop evapotranspiration. Cycles of depletion of soil moisture and replenishment by rainfall were observed throughout the growing season. For clay soils in this study, volumetric water content of 27% would be near permanent wilting point for plants and cause significant stress. This threshold was surpassed several times throughout the growing season at each location.

60
Figure 9. Volumetric water content (%) at a 6-inch depth for three locations beginning at planting and recorded through approximately physiological maturity.
The timing and duration of each moisture stress period differed by locations (Figure 10). The Abbott location had the fewest days of moisture stress at 15 total days with all 15 days occurring after flowering. The Buckholts and Malone location each endured significantly longer periods of moisture stress, although at different points during the growing season. At Malone, 50% of the moisture stress days occurred pre-flowering with a total of 40 days. Buckholts sustained 44 days of moisture stress although the majority, 29 days, was post-flowering. The timing and duration of moisture stress is expected to have significant implications on grain yield and could result in other complications such as stalk rot, which was present at Malone. While total stress was greater at Buckholts, early season stress and associated lodging had greater indirect impact on yield (reduced harvest efficiency).

61
Figure 10. Total, pre-flowering and post-flowering moisture stress in days (volumetric water content < 27%) for three locations.
Although ANOVA did not reveal significant differences in grain yield in response to increasing seeding rates, precipitation received during the growing season (April, May, June, July) did influence grain yield. Moreover, response of grain yield to in-season precipitation varied across seeding rates (Figure 11). The optimum, in-season precipitation amount staring with full profile moisture at planting was estimated to be 15 inches. Yields declined significantly with precipitation amounts above or below 15 inches. However, higher plant populations (seeding rates) were much more sensitive to precipitation amounts above or below optimum. This is evident when comparing the coefficient of correlation (r2) across seeding rates for the various quadratic functions. The relationship was strongest (r2 = 0.885) between precipitation and grain yield for the highest seeding rate (94,090 seeds/acre) compared to 35,384 (r2 = 0.485). The reduction in sensitivity of low populations to variation in available moisture provides justification for reduction in seeding rates.

62
Figure 11. Regression analysis of grain yield and in-season, cumulative monthly precipitation (April, May, June, July) by seeding rate.
To further illustrate the sensitivity of grain sorghum yield to seeding rates/plant populations and precipitation, grain yields were compared to the cumulative departure from normal precipitation during April, May, June and July (Figure 12). Departures from normal ranged from -1.59 inches at the Birdwell Farm to +2.33 inches at Stiles Farm. A dramatic difference in quadratic response curves was observed for contrasting seeding rates. Seeding rates less than 65,340 seeds/acre demonstrated the ability to maintain yield as precipitation dropped to near or below normal rainfall. Higher seeding rates (>65,340) were sensitive to below normal and above normal precipitation amounts, evident by grain yields that continued to decline as precipitation declined rather than stabilizing as observed in lower seeding rates. A similar trend was observed with greater than normal precipitation amounts.

63
Figure 12. Departure from normal precipitation and grain sorghum yield across five locations for increasing seeding rates.
The optimum seeding rate should be adjusted based on current and anticipated hydrologic conditions. Provided soil profile moisture is adequate at planting and normal precipitation is expected, seeding rates should be between 65,000 and 80,000 seeds per acre (60,000-75,000 plants/acre). This range will enable maximum grain yield and reduce the risk for lodging and other factors that could reduce yield. However, if in-season precipitation is expected to be below normal (>10%), the optimum seeding rate would decrease to 50,000 and 65,000 seeds/acre. Conclusions Grain sorghum has the ability to compensate for yield across a wide range of seeding rates and subsequent plant populations. Yield compensation with low plant populations under favorable conditions is accomplished through adjustments in grain head numbers per acre (tillering) and increased head size. Grain sorghum populations differ in their sensitivity to variability in precipitation during the growing season. High populations are much more sensitive to less than optimum and greater than optimum precipitation. In contrast, lower plant populations obtain by seeding rates < 65,000 seeds/acre are much less sensitive to reduced precipitation amounts, yet will adjust and yield well when greater precipitation amounts occur. Moreover, when

64
precipitation amounts are below normal, lower populations (<51,000) have demonstrated the ability to maintain yield when yield reductions would be expected for higher populations.
Acknowledgments
Appreciation is extended to Chad Kaska and Josh Birdwell for generously donating their time, land, and equipment to conduct these result demonstrations in Hill County.