Embed Size (px)
Citation preview
In ternationa lScholarsJourna ls
African Journal of Environmental Economics and Management ISSN 2375-0707 Vol. 8 (3), pp. 001-012, March, 2020. Available online at www.internationalscholarsjournals.org © International Scholars Journals
Author(s) retain the copyright of this article.
Full Length Research Paper
Evaluation of three classifiers in mapping forest stand
types using medium resolution imagery: A case study
in the Offinso Forest District, Ghana
Baatuuwie, N. B and Ir. Louise Van Leeuwen*
1Faculty of Renewable Natural Resources, University for Development Studies, P. O. Box TL 1882, Tamale, Ghana.
2International Institute for Geo-Information Science and Earth Observation, Enschede, The Netherlands.
Accepted 12 December, 2019
Loss of Ghana’s natural forests has been counteracted by plantation establishment and development. As at 2003, Ghana had a plantation area of about 97,000 hectares comprising different tree species. With the rapid expansion of plantations in the country, it is anticipated that major managerial challenges will arise due to insignificant technical personnel for monitoring and management. The application of GIS and remote sensing will be a powerful intervention and tool for monitoring and managing these forest resources in the area. The aim of this study was to determine a suitable method of mapping the different forest stand types using medium resolution images in the study area. Three classifiers were examined for their suitability in mapping the different forest stand types in the area (maximum likelihood, spectral angle mapper and decision tree). The results showed that using maximum likelihood classifier and ASTER imagery, different forest stand types can be accurately mapped with an overall accuracy of 88.50%.
Key words: Geo-referenced, classification, algorithm, spectral, mapper.
INTRODUCTION Ghana’s total land area of 238,500 km
2 is made up of
savanna (56%); closed forest (35%) and the remaining represents other land cover. All the vegetation types in Ghana, except for those comprising the savanna, are considered tropical forests and located in the southern belt of the country (Blay et al., 2007). These forests play very vital roles in supporting the livelihood of the inhabitants of Ghana in various ways. Trading in non-timber forest products (NTFPs: chewing sticks, pestles, canes, nuts, fruits, bush meat, fodder, artifacts and medicine extracted from the forest) are economically important within all areas of the high forest zone (Blay, 2004) . The forest also serves as haven for numerous species of flora and fauna, and generally helps maintain the biological diversity of the area (Abeney and Owusu, 1999). It also contains many genetic materials of known
and yet to be discovered species of importance (Blay, 2004).
*Corresponding author. E-mail: [email protected].
Regardless of the substantial contribution of the forest resources to the economy, degradation of Ghana’s forest resources is assuming an alarming proportion. It is estimated that about 60% of the reserved forests are degraded (TED, 1997; FAO, 2000). It was reported that 26% of the forest cover was lost between 1990 and 2005 (Mongabay.com, 2006).
Like many other tropical countries, the loss of Ghana’s natural forests has been counteracted by comprehensive reform programmes in the forestry sector (MLF, 2004). Key among the reforms was the Government’s initiative in establishing plantation in the country. Plantation forestry can be used as a tool not only to halt forest degradation but also to catalyze important native forest flora restoration after long period of anthropogenic and non-anthropogenic disturbances (Lemenih and Teketay, 2004).
Ghana by 2003 had a plantation area of about 97,000
ha (MLF, 2004). With the rapid expansion of plantations
in Ghana, it is anticipated that major managerial
challenges will arise due to insignificant technical personnel for monitoring and management. The application of Geographic Information System (GIS) and remote sensing will be a powerful intervention and tool for monitoring and managing these forest resources in the area.
GIS and remote sensing have been utilized in many regions over the past few decades for both mapping and monitoring forest resources. Maintenance of ecosystem integrity and protection of forest diversity are essential processes to achieve sustainable forest management (Jensen and Everett, 1994). To achieve these multiple objectives, remote sensing techniques have the capability of providing multi-scale, spectral, spatial, and temporal information in a consistent format to help forest managers meet their management objectives (Huggins, 2006).
It was acknowledged at the environmental conferences in Rio de Janeiro and Kyoto that satellite imagery will offer the most promising and is most likely the only feasible way for a detailed mapping and monitoring of forests resources over large geographical areas per unit time (De Carvalho et al., 2004). Remote sensing data and other supplementary data that is being produced on regular basis allow researchers to study natural forest processes, such as forest succession, encroachment and regeneration, which were previously limited to small geographical areas and often times impracticable (Huggins, 2006). Thus remote sensing may be considered the only viable option for monitoring forest succession in a timely and cost effective manner (Song and Woodcock, 2002).
Extracting this information from the data is however
accomplished by image classification (Lillesand and Kiefer, 2000). There are several techniques and
variations exist between these techniques for extracting thematic information from an image (Huggins, 2006).
Each technique is superior over the other depending on how accurately it identifies and maps the resource/feature, its
cost and time effectiveness (Franklin, 2001). Mapping accuracy will depend on the spectral characteristics of the
resource/feature to be mapped. In this study, the different forest cover types in the study area are mapped.
The forest stand types in the study area differ from the standpoint of tree species composition. However there are no definite and explicit boundaries between these forests stand types and other vegetation types in the area. In a nutshell, these vegetation types are seen as the same forest cover type on the satellite data due to their similar species composition. There is need to identify an effective classification/mapping procedure that will discriminate between these forest cover types with least cost and human intervention (Franklin, 2001), if reliable estimates of forest cover are to be made frequently over large geographical areas over time for strategic forestry planning and decision making (Dees et al., 2003). This study was therefore conducted to
determine a suitable method for mapping forest stand types in the study area using medium resolution images. Three image classification algorithms were then con-
sidered and used for this research: Maximum likelihood classifier, spectral angle mapper and decision tree classifier.
MATERIALS AND METHODS Description of the study area The study was conducted in the Afram Headwaters Forest Reserve (Figure 1) located in the Offinso District of Ashanti Region of Ghana. The Reserve lies between longitude 1º 32’W and 1º 48W and 6º 45’N and 7º 25’N. It covers 20,100 hectares, comprising both natural and plantation forests. The reserve is fringed by eight villages, with their inhabitants depending heavily on the reserve for sustenance. Each of the communities has a population size of not less than 600 people (Ghana Statistical Service, 2000). Due to heavy dependency of this populace around the reserve, it has consequently subjected the forest reserve to various forms of human activities leading to its fragmentation and degradation. Consequently, there are ongoing restoration programmes in the reserve through plantation establishment by the government and private developers. Plantation establishment methods employed are mainly monoculture of exotic tree species such as Cedrela odorata (Cedrela) and Tectona grandis (Teak) and mixed stands of local tree species.
Land covers data collection An iPAQ (handheld computers) equipped with an internal Global Positioning System receiver was used to capture coordinates of pre-determined land cover samples which were used as training set for image classification and testing data for the accuracy assessment of the classification. It is recommended that 50 points be collected per land cover for image classification and accuracy assessment (Curran, 1985). However due to time constrain, 219 points were collected for all land cover types.
Image processing and classification A geo-referenced and atmospherically corrected ASTER February 24, 2008 image was obtained from ITC geo-database. The image was re-projected from geographic coordinate system (WGS84) to the Ghana local coordinate system in Erdas image processing software.
The ASTER image was classified using the three classifiers: Maximum likelihood, spectral angle mapper and decision tree. The main aim was to assess the performance of the three classification algorithms using medium resolution data acquired from the ASTER sensor in the study area. Their performance was based on the ability to identify different forest stand types accurately based on ground truth data (Mohd, 2007) with minimum time and cost (Franklin, 2001) . Overall classification accuracies as well as the Kappa statistics were calculated for each of the classifiers used and their results compared.
The maximum likelihood classifiers Supervised classification using maximum likelihood algorithm was
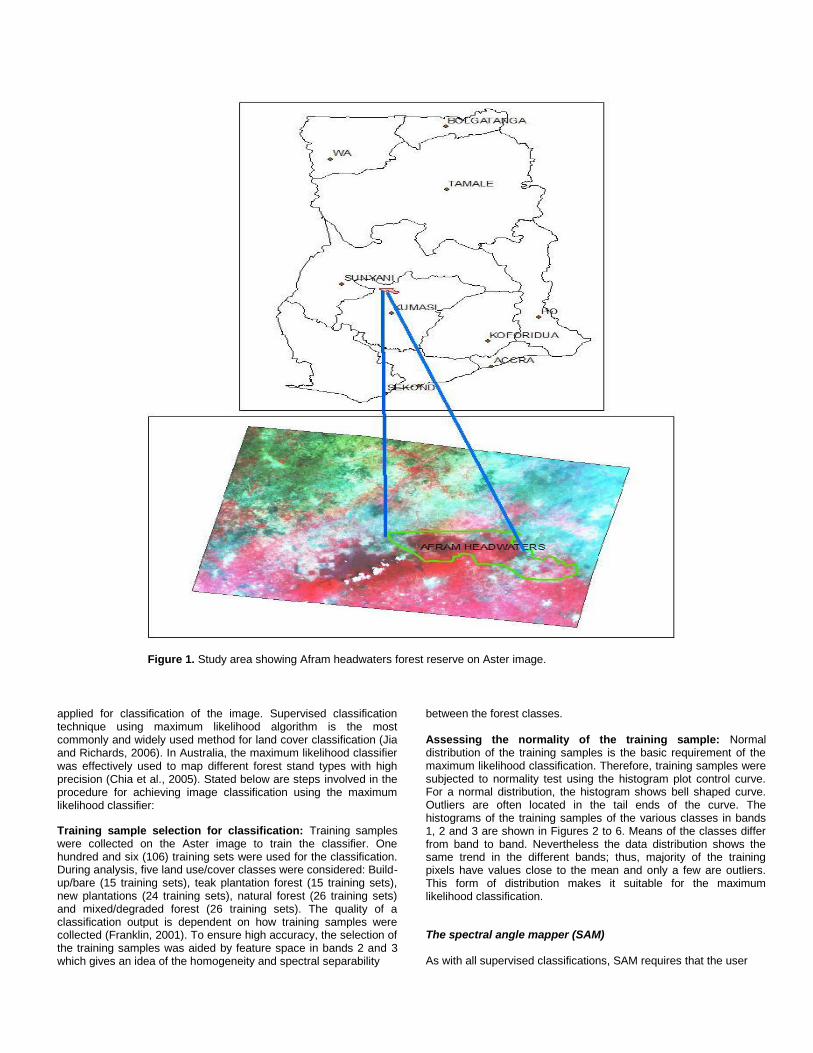
Figure 1. Study area showing Afram headwaters forest reserve on Aster image. applied for classification of the image. Supervised classification technique using maximum likelihood algorithm is the most commonly and widely used method for land cover classification (Jia and Richards, 2006). In Australia, the maximum likelihood classifier was effectively used to map different forest stand types with high precision (Chia et al., 2005). Stated below are steps involved in the procedure for achieving image classification using the maximum likelihood classifier: Training sample selection for classification: Training samples were collected on the Aster image to train the classifier. One hundred and six (106) training sets were used for the classification. During analysis, five land use/cover classes were considered: Build-up/bare (15 training sets), teak plantation forest (15 training sets), new plantations (24 training sets), natural forest (26 training sets) and mixed/degraded forest (26 training sets). The quality of a classification output is dependent on how training samples were collected (Franklin, 2001). To ensure high accuracy, the selection of the training samples was aided by feature space in bands 2 and 3 which gives an idea of the homogeneity and spectral separability
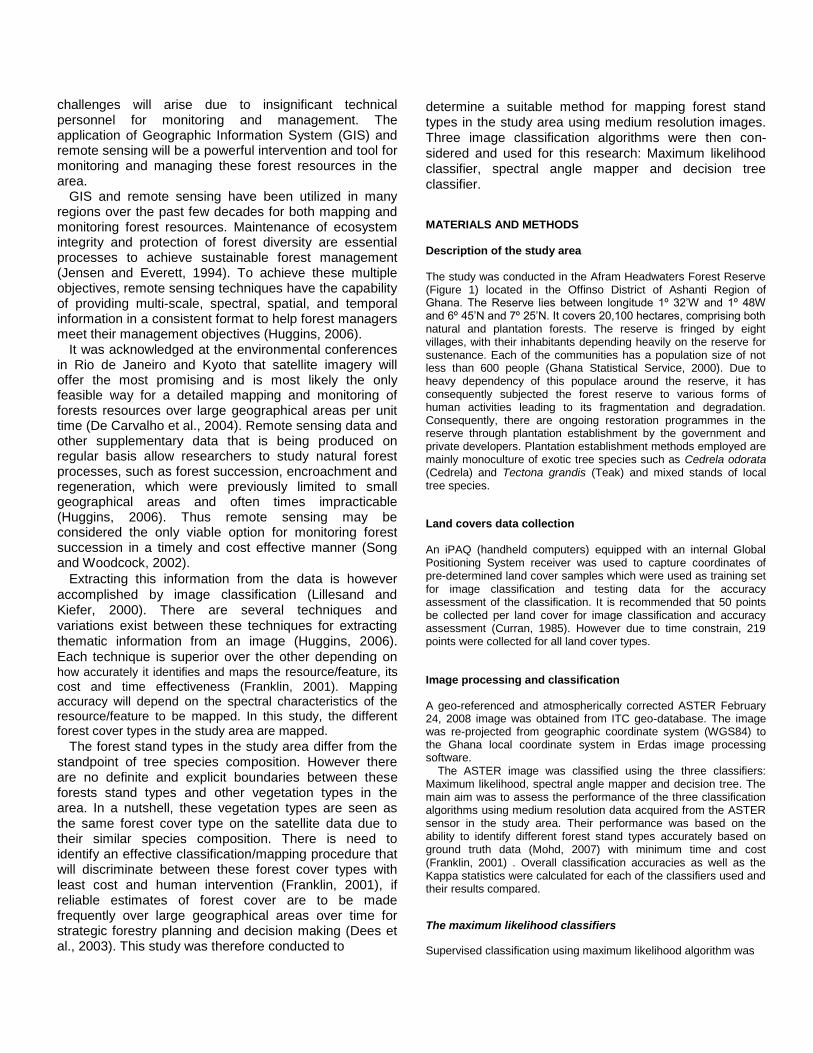
between the forest classes. Assessing the normality of the training sample: Normal distribution of the training samples is the basic requirement of the maximum likelihood classification. Therefore, training samples were subjected to normality test using the histogram plot control curve. For a normal distribution, the histogram shows bell shaped curve. Outliers are often located in the tail ends of the curve. The histograms of the training samples of the various classes in bands 1, 2 and 3 are shown in Figures 2 to 6. Means of the classes differ from band to band. Nevertheless the data distribution shows the same trend in the different bands; thus, majority of the training pixels have values close to the mean and only a few are outliers. This form of distribution makes it suitable for the maximum likelihood classification.
The spectral angle mapper (SAM) As with all supervised classifications, SAM requires that the user

Teak Teak Teak
Band number 1 Band number 2 Band number 3
Histogram
Histogram
Histogram
Figure 2. Histogram of class teak plantation.
Figure 3. Histogram of class build-up/bare.
Band number 1 Band number 2 Band number 3
Histogram
Histogram
Histogram
Figure 4. Histogram of class mixed/degraded forest.
Figure 5. Histogram of class natural forest.
Figure 6. Histogram of class new plantations.
defines the training classes and training spectra for the classification. The mean measurement vector for a training class is the vector representation of its mean spectrum. The creation of training classes can be accomplished in one of several ways in ENVI. One way is to define a set of regions/area of interest (ROIs) for pixels in the image for which you have ground truths. The mean measurement vector for a given ROI training class is simply the mean measurement vector for all the pixels in that class. A second way of defining training classes is to import spectra from spectral libraries. For this study, the former method was used to create the class training set. ROIs here designate the spectral signatures of the five classes (bare, mixed/degraded forest, teak forest, natural forest and new plantations). In all, 77 ROIs were used to train the classifier for the classification.
Decision tree The decision tree is made up of a series of binary decisions that are used to categorized pixels into classes. The decisions can be based on any characteristic of the dataset that is available.
For current research, image DN values were extracted and used to create the decision tree. Based on the ground truth, regions of interest of the various land use/cover were obtained and the spectral values extracted for inputs in the decision tree. With the exception of the build-up/bare, maximum and minimum DN values of bands 2 and 3 of the image were used to develop the expressions for the forest stand types (Table 1). Band one was used to develop an expression for the build-up/bare. Even though the decision tree classifier is not commonly employed within
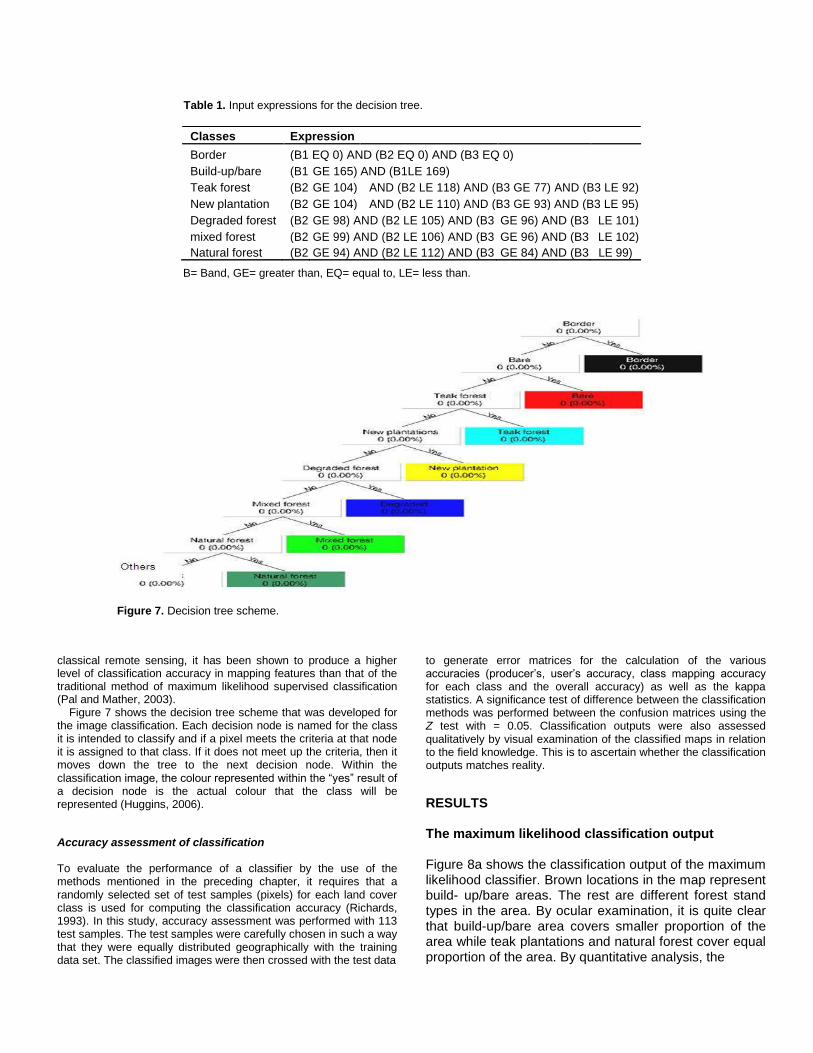
Table 1. Input expressions for the decision tree.
Classes Expression
Border (B1 EQ 0) AND (B2 EQ 0) AND (B3 EQ 0)
Build-up/bare (B1 GE 165) AND (B1LE 169)
Teak forest (B2 GE 104) AND (B2 LE 118) AND (B3 GE 77) AND (B3 LE 92)
New plantation (B2 GE 104) AND (B2 LE 110) AND (B3 GE 93) AND (B3 LE 95)
Degraded forest (B2 GE 98) AND (B2 LE 105) AND (B3 GE 96) AND (B3 LE 101)
mixed forest (B2 GE 99) AND (B2 LE 106) AND (B3 GE 96) AND (B3 LE 102)
Natural forest (B2 GE 94) AND (B2 LE 112) AND (B3 GE 84) AND (B3 LE 99) B= Band, GE= greater than, EQ= equal to, LE= less than.
Figure 7. Decision tree scheme.
classical remote sensing, it has been shown to produce a higher level of classification accuracy in mapping features than that of the traditional method of maximum likelihood supervised classification (Pal and Mather, 2003).
Figure 7 shows the decision tree scheme that was developed for the image classification. Each decision node is named for the class it is intended to classify and if a pixel meets the criteria at that node it is assigned to that class. If it does not meet up the criteria, then it moves down the tree to the next decision node. Within the classification image, the colour represented within the “yes” result of a decision node is the actual colour that the class will be represented (Huggins, 2006).
Accuracy assessment of classification To evaluate the performance of a classifier by the use of the methods mentioned in the preceding chapter, it requires that a randomly selected set of test samples (pixels) for each land cover class is used for computing the classification accuracy (Richards, 1993). In this study, accuracy assessment was performed with 113 test samples. The test samples were carefully chosen in such a way that they were equally distributed geographically with the training data set. The classified images were then crossed with the test data
to generate error matrices for the calculation of the various accuracies (producer’s, user’s accuracy, class mapping accuracy for each class and the overall accuracy) as well as the kappa statistics. A significance test of difference between the classification methods was performed between the confusion matrices using the Z test with = 0.05. Classification outputs were also assessed qualitatively by visual examination of the classified maps in relation to the field knowledge. This is to ascertain whether the classification outputs matches reality.
RESULTS
The maximum likelihood classification output
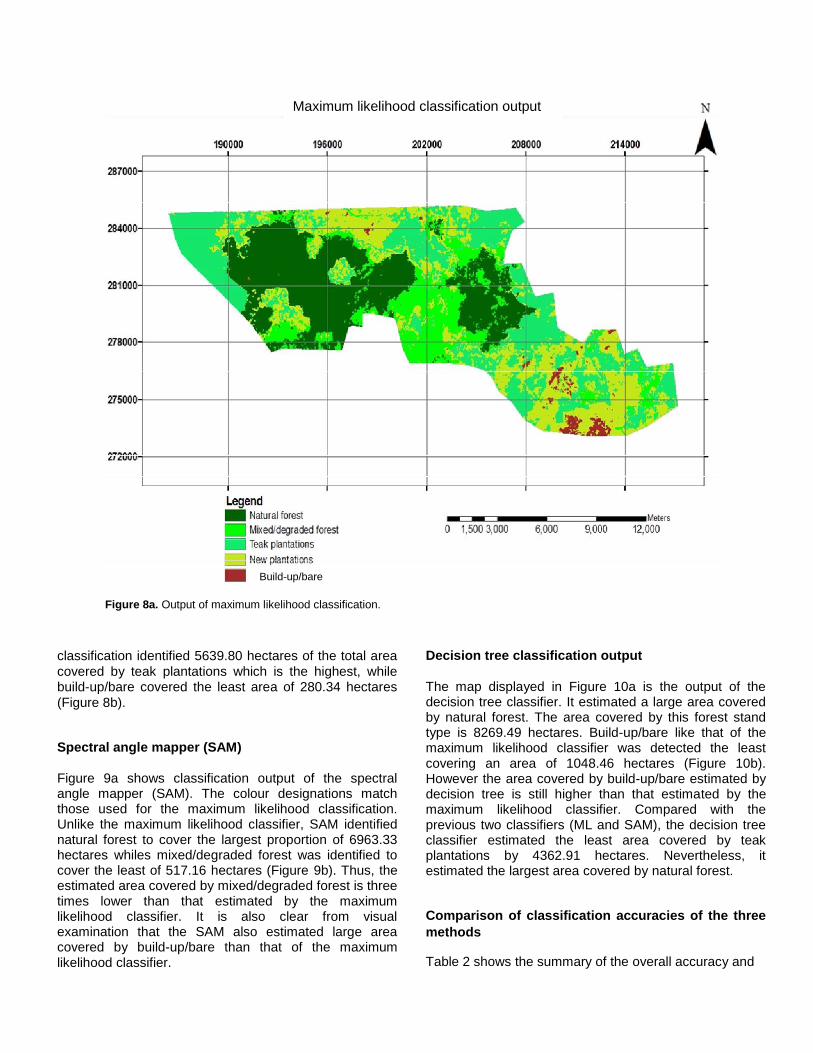
Figure 8a shows the classification output of the maximum likelihood classifier. Brown locations in the map represent build- up/bare areas. The rest are different forest stand types in the area. By ocular examination, it is quite clear that build-up/bare area covers smaller proportion of the area while teak plantations and natural forest cover equal proportion of the area. By quantitative analysis, the
Maximum likelihood classification output
Build-up/bare
Figure 8a. Output of maximum likelihood classification.
classification identified 5639.80 hectares of the total area
covered by teak plantations which is the highest, while build-up/bare covered the least area of 280.34 hectares
(Figure 8b).
Spectral angle mapper (SAM)
Figure 9a shows classification output of the spectral angle mapper (SAM). The colour designations match those used for the maximum likelihood classification. Unlike the maximum likelihood classifier, SAM identified natural forest to cover the largest proportion of 6963.33 hectares whiles mixed/degraded forest was identified to cover the least of 517.16 hectares (Figure 9b). Thus, the estimated area covered by mixed/degraded forest is three times lower than that estimated by the maximum likelihood classifier. It is also clear from visual examination that the SAM also estimated large area covered by build-up/bare than that of the maximum likelihood classifier.
Decision tree classification output
The map displayed in Figure 10a is the output of the decision tree classifier. It estimated a large area covered by natural forest. The area covered by this forest stand type is 8269.49 hectares. Build-up/bare like that of the maximum likelihood classifier was detected the least covering an area of 1048.46 hectares (Figure 10b). However the area covered by build-up/bare estimated by decision tree is still higher than that estimated by the maximum likelihood classifier. Compared with the previous two classifiers (ML and SAM), the decision tree classifier estimated the least area covered by teak plantations by 4362.91 hectares. Nevertheless, it estimated the largest area covered by natural forest.
Comparison of classification accuracies of the three
methods Table 2 shows the summary of the overall accuracy and

Figure 8b. Area representation of the different land use/cover classes.
Spectral angle mapper classification output
Build- up/bare
Figure 9a. Classification output of spectral angle mapper.

Are
as in h
ecta
res
Land use/cover type
Figure 9b. Area representation of the different land use/cover classification.
Figure 10a. Output of decision tree classification.
kappa statistics of the three classifiers. The Maximum likelihood classifier had the highest classification accuracy of 88.50% while the spectral angle mapper had the lowest of 69.03%. The maximum likelihood classifier again had the highest kappa value of 0.85 and the spectral angle mapper had the lowest value of 0.62. The significance of this difference was tested using the Z-test. The Z-test showed that the maximum likelihood classifier
is significantly higher than the spectral angle mapper (Z-test: Z= 3.5, P= 0.0004). There is no significant difference between the accuracies of the maximum likelihood and the decision tree classifier (Z-test: Z= 1.46, P= 0.144). Decision tree and spectral angle mapper differ significantly in the accuracies at (Z-test: Z= 2.10, P= 0.029)
Apart from the overall accuracy and the kappa

Figure 10b. Area representation of the different land use/cover classes.
Table 2. Summary of accuracy results of the three classifiers.
Classifier Overall accuracy (%) Kappa coefficient
Maximum likelihood 88.50 0.85
Decision tree 81.74 0.77
Spectral angle mapper 69.03 0.62
Table 3. Comparison of user’s and producer’s accuracies of the three classifiers.
Class Producer©s accuracy (%) User’s accuracy (%)
ML DT SAM ML DT SAM
Teak forest 89.66 79.31 86.21 83.87 85.19 83.33
Build-up/bare 76.92 84.62 92.31 100 91.67 75
Mixed/degraded 100 94.29 37.14 87.5 89.19 100
Natural forest 94.12 94.12 94.12 100 72.73 42.11
New plantations 68.42 52.38 63.16 81.25 78.57 75
statistics, producer’s and user’s accuracy were also examined to determine the accuracy of the different classification methods. User’s and producers accuracies are necessary for this study as the main aim is to map the forest categories. The user’s and producer’s accuracies when compared (Table 3) revealed that the maximum likelihood has a maximum producer accuracy of 100% for mixed forest with user accuracy of 87.5% , decision tree recorded 94.29% as a maximum producer accuracy for mixed/degraded forest with user’s accuracy of 89.19%. Spectral angle mapper recorded its maximum producer accuracy of 94.12% for natural forest with it counterpart user’s accuracy of 42.11%. The least producer’s accuracy of maximum likelihood, decision tree
classification and the spectral angle mapper are; 68.42, 52.38 and 37.14% respectively (Table 3). The least user’s accuracies for the three classifications methods included: maximum likelihood (81.25), decision tree classification (72.73) and spectral angle mapper (42.11). Based on the confusion matrix, it was also clear that some classes were confused with others. This may be due to the spectral heterogeneity of these features in the landscape of the study area and thereby become a hindrance to excellent mapping. In addition, out of the 113 reference pixels, Maximum likelihood classifier accurately classified 100 pixels whiles spectral angle mapper and decision tree classifiers accurately classified 75 and 94 pixels respectively.

DISCUSSION
Comparison of image classification methods
The forest cover mapping using image classification will be incomplete if the classification accuracies are not known. Thus accuracy assessment is a fundamental principle in assuring the quality of thematic maps for their intended application (Stehman and Czaplewski, 1998). This principle determines how useful and applicable a particular classification method is (Huggins, 2006; Campbell, 2002). It is also the surest way to compare different classification methods. However, cost-effectiveness and technical uncomplicatedness are also key factors determining the usability and applicability of the method (Franklin, 2001). Methods that are less expensive and technically simple will always be opted if the classification accuracies are not significantly different (Congalton and Green, 1999). All these factors however will depend on the purpose and financial value of the resources (Hussin and Atmopawiro, 2004).
Comparison of the accuracies between the three classifiers indicated that the maximum likelihood classifier has the highest classification accuracy of 88.50%, followed by the decision tree with classification accuracy of 81.74%, and the spectral angle mapper recorded the lowest of 69.03%. An overall accuracy of 85% is considered standard for land cover mapping (Campbell, 2002). With reference to this overall accuracy, only the maximum likelihood classification has met this standard while the other two classifiers (decision tree and spectral angle mapper) have overall accuracies lower than this standard value recommended by Campbell (2002). This means that the maximum likelihood classification technique is a better method in mapping the forest cover types in the study area than both spectral angle mapper and decision tree classifiers when using medium resolution images.
Further comparison of the mapping accuracies of the
three classifiers by their kappa statistics (KHAT) showed that the maximum likelihood classifier still performed better in mapping the forest cover types in the study area than the two classifiers with a kappa value of 0.85 while the decision tree recorded 0.77 and the spectral angle mapper had the lowest value of 0.62.
Apart from the overall accuracy and the kappa statistics, class-wise mapping accuracy measurement such as producer’s accuracy and user’s accuracy also revealed that the maximum likelihood classification method did better in mapping the different forest cover types in the study area than the other two methods. Spectral angle mapper relatively has poorer performance in mapping various categories of forest cover. This result is not in divergence with that found by Mohd (2007) who used the same methods in mapping Malayan tropical forest.
The variation in the classification accuracies however might have been due to the method of training the classifier. This is because all the three methods have different approaches in selecting the training samples for the classification and this may have an influence on the classification accuracies. According to Lillesand and Kiefer (2000), the classification accuracies of any land cover maps will depend largely on the quality of the training set used. So any variation in training sample selection is likely to influence the classification results.
The superior performance of the maximum likelihood classifier over the others may be due to the thorough examination of the spectral signatures separability of the different forest stand types in the area using the spectral feature space curve. Difficulty in determining the precise DN values for the various forests stand types due to the spectral heterogeneity of their reflectance may have caused the decision tree classifier to have performed below standard. The performance of SAM however showed that more than the direction of a vector is required in order to separate the tropical forest stand types, which are spectrally difficult to separate.
In terms of technical simplicity and accessibility, the maximum likelihood classifier has been used for many years and is one of the inbuilt extensions of many GIS and RS based software such as ILWIS, ENVI, and ERDAS etc. Spectral angle mapper and decision tree classifiers are restricted to specific image analysis software such as ENVI. Execution of maximum likelihood classification technique is also straight forward and simple. Thus its implementation is less laborious and requires relatively low technical know-how before exe-cution. On the other hand, Spectral angle mapper and decision tree techniques are more complex, time consuming and require expert knowledge in signature derivation and decision rule setting before final classifica-tion is attempted. The maximum likelihood classification method even though the oldest and traditional method, still may be considered to be the suitable method for mapping forest stand types in the study area than the other two methods especially when medium resolution images are employed.
Conclusions and recommendations
The classification accuracy of the three classifiers was used as the determining factor for identifying the suitable mapping method. From the finding of this work, it may be concluded that the maximum likelihood classification method is a suitable method in mapping the different forest stand types in the area in comparison with the other two methods.
In a nutshell, we may conclude that using maximum
likelihood classifier and medium resolution imagery
(ASTER), different forest stand types can be accurately
mapped with an overall accuracy of 88.50% in the study area.
With regard to mapping forest stand types in the study area, the maximum likelihood classification method is recommended because of its high accuracy, technically simplicity and being available in many remote sensing data analysis softwares.
REFERENCES Abeney EA, Owusu JGK (1999). Workshop for media personnel on
forestry and wildlife reporting proceedings, Institute of Renewable Natural Resources, UST, Ghana, p. 95.
Blay D, Appiah M, Damnyag L, Dwomoh KF, Ari PLO (2007). Involving local farmers in rehabilitation of degraded tropical forests: some lessons from Ghana.
Blay D (2004). Rehabilitation of degraded forests through the collaboration of local communities in the Dormaa District of Brong Ahafo Region of Ghana, pp. 31–35.
Campbell JB (2002). Introduction to remote sensing. The Guilford Press Chia J, Caccetta PA, Furby SL, Wallace JF (2005). Mathematical and Information Sciences, Private Bag 5 PO Wembley Western Australia
6913. Congalton RG, Green K (1999). Assessing the accuracy of remotely
sensed data: principles and practices. Boca Raton: Lewis Publishers. Curran PJ (1985). Principles of Remote Sensing. Longman Scientific
and Technical Group, Essex, England. De Carvalho LMT, Clevers JGPW, Skidmore AK, Jong SM (2004).
Selection of imagery data and classifiers for mapping Brazilian semi-deciduous Atlantic forests.
Dees M, Asan U, Yesil A (2003). Ideas and options for a national forest inventory for Turkey. Advances in forest inventory for sustainable forest management and biodiversity. Kluver Academic Publishers, For. Sci. pp. 375-395.
FAO (2000). Global forest resources assessment main report. FAO Forestry Paper, pp. 140,479.
Franklin SE (2001). Remote Sensing for Sustainable Forest Management. CRC Press, p. 7.
Ghana Statistical Service (2000). Summary of the 2000 Population Census Report. Accra; Ghana: Ghana Statistical Service.
Huggins NJ (2006). Remote sensing classification methods for
monitoring eastern red cedar. MSc. Thesis, Missouri State University. Hussin A, Atmopawiro VP (2004). Sub-pixel and maximum likelihood
classification of Landsat ETM+ images for detecting illegal logging and mapping tropical rain forest cover types in Berau, East Kalimantan, Indonesia. The International Institute for Geoinformation Science and Earth Observation (ITC), Enschede, Netherlands.
Jia X, Richards JA (2006). Remote sensing digital image analysis, an introduction, Taylor and Industrial Arts.
Jensen ME, Everett R (1994). An overview of ecosystems management principles. Ecosystem Management Principles and Applications, Eastside Forest Ecosystem Health Assessment, USDA Forest Service, Pacific Northwest Research Station, General Technical Report. PNW-GTR-318.
Lillesand TM, Kiefer RW (2000). Remote sensing and image interpretation (4th ed.). New York: John Wiley and Sons.
Lemenih M, Teketay D (2004b). Restoration of native forest flora under plantation forests established on abandoned degraded agricultural sites in Ethiopia. Environ. Manage.
MLF (2004). Criteria and Indicators for Sustainable Management of Natural Tropical Forests. Ghana.
Mohd SHZ (2007). Remote Sensing & GIS Programme, Dept. of Civil Eng., UPM, 43400 Selangor, Malaysia.
Mongabay.com (2006). Forest protection could earn tens of millions for Ghana http://news.mongabay.com/2006/1106-ghana.html.
Pal M, Mather PM (2003). An assessment of effectiveness of decision tree methods for land cover classification, Remote Sens. Environ., 86: 554-565
Richards JA (1993). Remote sensing digital image analysis: an introduction. Springer-Verlag, Berlin.
Song C, Woodcock CE (2002). The spatial manifestation of forest succession in optical imagery. The potential of multi-resolution imagery, Remote Sensing Environ., 82: 271-284.
Stehman SV, Czaplewski LR (1998). Design and analysis of thematic map accuracy assessment: fundamental principles. Remote Sensing Environ., 64: 331-344.
TED (1997). Ghana Forest Loss. Case Studies
http://www.american.edu/TED/ghana. htm