Embed Size (px)
Citation preview
IOSR Journal of Applied Chemistry (IOSR-JAC)
e-ISSN: 2278-5736. Volume 3, Issue 5 (Jan. – Feb. 2013), PP 67-78 www.iosrjournals.org
www.iosrjournals.org 67 | Page
Evaluation of the Speciation Patterns of Some Heavy Metals
along the Major Roads of Owerri Industrial Layout
H. O. Abugu1, P.A.C. Okoye
2 and P. E. Omuku
2
2 (Pure & Industrial Chemistry Department, Nnamdi Azikiwe University, Awka, Anambra State, Nigeria) 1 (Department of Quality Control, KSL Investment Ltd Owerri, Imo State, Nigeria)
Abstract: Topsoil samples were collected along the major roads within Owerri industrial layout for the period
of April to July. The pH and the moisture content were determined by pH meter and difference in wet and dry
weight method respectively. The pH of the soil had a range of 6.1 to 6.7 while moisture content had a range of
5.177 to 13.572%. The highest metal concentration (832.830mg/kg) was Fe found in the Gmicord Road (RX2),
while the metal with the least concentration (0.067mg/kg) was Cd. The observed trend in the concentration of
the metals was Fe > Ca > Mn > Zn > Cr > Pb > Ni > Co > Cu > Cd. There were no significant differences
between the pH and the concentration of the soil samples. Most of the metals in the soil samples were
distributed within the residual fraction which is an indication of geochemical sources.
Key Words: Bioavailability, Concentration, Metal, Speciation, Soil.
I. Introduction Human evolution has led to immense scientific and technological progress. Global development
(industrialization), however, raises new challenges, especially in the field of environmental protection and
conservation [1]. Nearly every government around the world advocates for an environment free from harmful
contamination for their citizens. However, the demand for a country’s economic, agriculture and industrial
development outweigh the demand for a safe, pure and natural environment. Ironically, it is the economic, agricultural and industrial developments that are often linked to polluting the environment [2]. Since the
beginning of the industrial revolution, soil pollution by toxic metals has increased dramatically. According to
report, about 90% of the anthropogenic emissions of heavy metals have occurred since 1900AD [3]; it is now
well recognized that human activities lead to a substantial accumulation of metals in soils on a global scale. A
number of chemicals, heavy metals and other industrial wastes have resulted in significant discharge of
industrial effluents into the nearby water bodies and soils and environment at large. These effluents which
contain toxic metals or substances are released into the environment which contributes to a variety of toxic
effects on living organisms in the food chain by bioaccumulation and bio-magnification. Heavy metals, such as
cadmium, copper, lead, chromium, zinc, and nickel are important environmental pollutants, particularly in areas
with high anthropogenic pressure [4] such as Owerri industrial layout. The soil has been traditionally the site for
disposal for most of the metal wastes which need to be treated. Sources of anthropogenic metal contamination
include industrial effluents, fuel production, mining, smelting processes, military operations utilization of agricultural chemicals, small-scale industrial (including battery production, metal products, metal smelting and
cable coating industries) brick kilns and coal combustion [5]. One of the prominent sources contributing to
increased load of soil contamination is disposal of municipal waste. These wastes are either dumped on
roadsides or used as landfills, while sewage is used for irrigation. These wastes, although useful as a source of
nutrients, are also sources of carcinogens and toxic metals.
Around the world several studies have evaluated the metal concentration in the soils [6, 7, 8, 9, 10]. In
Owerri industrial layout, such studies are non-existent to date and therefore, very little are known about the
distribution of such elements. At present, it is widely recognized that the distribution, mobility and
bioavailability of heavy metals and radionuclide in the environment depends not only on their total
concentration but also on the association form in the solid phase to which they are bound. Some variations of the
chemical or physical conditions in the environment can accelerate to some extent the release of toxic metals into it, thus causing contamination.
Bioavailability of metals depends greatly on the characteristics of the particle surface, on the kind of
strength of the bond and on the properties of the solution in contact with the solid samples. Metal ions in soils
and sediments are partitioned between the different phase’s present i.e. organic matter, oxyhydoxides of iron,
aluminum and manganese, phyllosilicate minerals, carbonates and sulfides. In addition, metal ions are retained
on these solid phases by different mechanisms (ion exchange, outer and inner-sphere surface complexation
(adsorption), precipitation or co-precipitation). Sediment samples have been found as a carrier of most metals
and some elements may be recycled through biological and chemical reactions within the water column. In soil,
Evaluation Of The Speciation Patterns Of Some Heavy Metals Along The Major Roads Of Owerri
www.iosrjournals.org 68 | Page
there is a concern to know the metal bioavailability and toxicity to plants, animals and man, the efficiency of the
soil as a sink for metals and the potential capacity of a metal to be mobilized from the soil [11].
Natural and anthropogenic environmental changes greatly influence the behaviour of metallic pollutants as the association form in which they occur can be changed. Such external influences can include pH,
temperature, redox potential, organic matter decomposition, leaching and ion exchange processes and
microbial activities. Thus, the exchangeable fractions corresponds to the form of metals that is most available
for plant uptake and can be released by merely changing the ionic strength of the medium, the metal content
bound to carbonates is sensitive to pH changes and can become mobilisable when pH is lowered. The metal
fraction bound to Fe-Mn oxides and organic matter can be mobilized with increasing, reducing or oxidizing
conditions in the environment. Finally the metal fractions associated with the residual fraction e.g. silicate can
only be mobilized as a result of weathering which can only cause long term effects [12].
II. Materials And Methods Soil samples were collected in the vicinity of Owerri Industrial layout between April and July. The
sampling site comprised of five major roads, Raycon road (road 1), Gmicord road (road 2), Coca-cola road (road
3), Modern Home Aluminum road (road 4) and Assumpta Press road (road 5) covering the whole length of the
area. A total of 5 samples were collected from each road and merged to form a composite sample, a
representative of each road using a plastic scoop into a polythene bag well labelled. The sampling site is
surrounded by industries. A residential estate (Graceland/Egbeada Estate) is located north – east of the estate.
Also to the south – east of the industrial layout is located another estate (Umuguma Housing Estate) and on the
north – east is a highway (Onitsha – Owerri Road).
In the laboratory, samples were dried at room temperature and sieved through a 200mesh before
analysis. Drying sediments at higher temperature was avoided to ensure that organic matter content and the metal binding properties of the sediments remained intact. Care was also taken while sieving the sediments to
prevent excess loss of the fine particles. All chemicals and acids used were of Analytical Reagent Grade (ARG),
and were used without further purification.
2.1 Procedure for Moisture Content Determination
The moisture content of the samples was determined using the dry-weight-difference method.
2.2 Procedure for pH Determination
5g of the soil sample was weighed into 250ml Beaker and 20ml of deionized water added. It was
agitated for about 20minutes and allowed to equilibrate. Finally, a standardized pH meter was used to read the
pH by dipping the electrode into the 250ml Beaker containing the solution.
2.3 Procedure for Determination of Total Metal Content
About 5g of the soil sample was weighed into sample rubber and 5ml of Hydrofluoric acid (HF) added.
Also 10ml Aqua Regia was added and the mixture heated over water bath for 1hour, 30minutes. Then, it was
allowed to cool. The process was repeated again and 20ml boric acid was added. Thereafter, the solution was
filtered and made-up to 50ml with deionized water. Finally, analysis of the extracts was carried out by Flame
Atomic Absorption Spectrometry (Analyst 200).
2.4 Sequential Extraction
Sequential extraction protocol for analysis of heavy metal speciation in soil and sediments (modified
from Tessier et al., 1979) were used to establish the association of the total concentration of the metals in the
soil samples with their contents in the water soluble, exchangeable, carbonate, reducible (Fe/Mn oxide), oxidisable (organic and sulfide bound) and residual fraction [13].
III. Results And Discussion The moisture contents and the pH of the various soil samples collected from the five major roads are as
shown below (Table 1). The pH of the soil is an important parameter that directly influences mineral mobility.
The soil pH of the sampling sites varied on the average from 6.1 to 6.7 in water indicating of slight acidity to
neutrality. The moisture contents fell within the range of 5.177% to 13.572%. Looking at table 1, it showed that
sample RX1 – RX5 had relatively low values of moisture contents.
Evaluation Of The Speciation Patterns Of Some Heavy Metals Along The Major Roads Of Owerri
www.iosrjournals.org 69 | Page
TABLE 1: Percentage Moisture Content and the pH of the Soil Samples.
Sample code % Moisture Content pH
R1X 5.177 6.6
R2X 5.398 6.1
R3X 6.099 6.4
R4X 6.084 6.3
R5X 13.572 6.7 NOTE: R is referring to as road were the sample was collected, Numbers 1 – 5 represent the road
numbers, X means the topsoil sample
TABLE 2: Total Metal Concentration (mg/kg). Samp
le
code
Cu Ca Mn Pb Ni Fe Co Zn Cr Cd Total Mean
RX1 0.422
±0.0
11
4.880
±0.0
12
3.135
±0.0
16
1.004
±0.0
01
1.582
±0.006
4.100
±0.002
1.053
±0.004
1.813
±0.006
2.911
±0.0
11
0.123
±0.0
14
21.023 2.102
3
RX2 0.292
±0.0
03
6.226
±0.1
18
3.640
±0.0
69
1.041
±0.0
07
1.274
±0.020
832.83
0
±0.038
1.158
±0.065
2.709
±0.012
1.392
±0.0
11
0.139
±0.0
05
850.66
1
85.06
6
RX3 0.357
±0.0
02
2.672
±0.0
07
2.791
±0.0
45
0.482
±0.0
08
0.734
±0.009
350.07
0
±0.196
0.583
±0.004
1.602
±0.006
0.858
±0.0
32
0.067
±0.0
03
360.66
1
36.02
2
RX4 0.663
±0.0
06
59.38
8
±0.0
02
3.589
±0.0
66
4.162
±0.0
06
0.980
±0.021
750.21
0
±0.152
0.931
±0.013
2.730
±0.005
1.447
±0.0
18
0.627
±0.0
19
824.72
7
82.47
3
RX5 0.332
±0.0
01
3.220
±0.0
01
2.196
±0.0
04
0.591
±0.0
41
1.349
±0.011
4.500
±0.015
0.792
±0.002
2.510
±0.013
4.210
±0.0
13
0.090
±0.0
00
19.790 1.979
Total 2.066 76.38
6
15.35
1
7.280 5.919 1941.7
10
4.517 11.634 10.77
8
1.046 2076.4
26
Mean 0.413 15.27
7
3.070 1.456 1.184 388.34
2
0.903 2.273 2.156 0.209 415.28
3
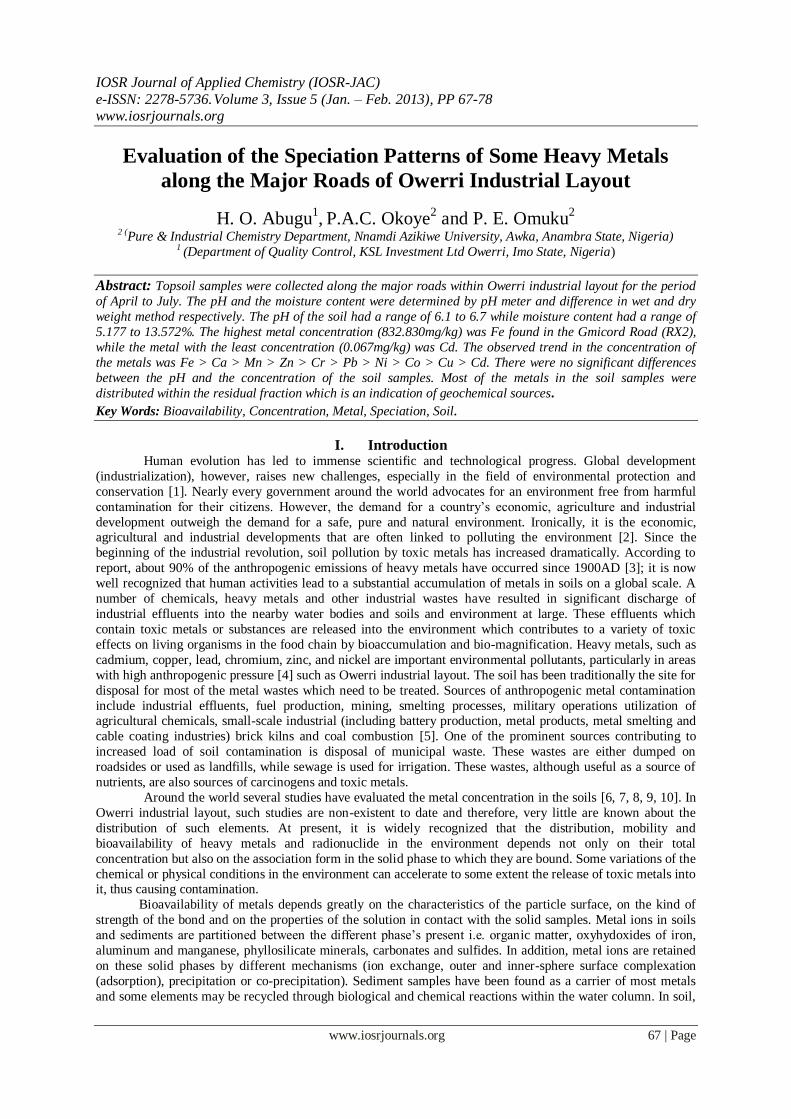
Table 2 and figure 1, indicate the total metal concentration. The result indicated that the occurrence of Fe was at
relatively higher concentration (832.830mg/kg) in the soil sample (RX2). This may be as a result of auto rust,
motor spare parts and other human activities found around the industrial layout.
Figure 1: Total Metal Concentration
It also showed that Cd had the least concentration (0.067mg/kg) as found in sample RX3. The observed trends
with various soil samples for the heavy metal concentration are as follows: for RX1 it was Ca > Fe > Mn > Cr >
Zn > Ni > Co > Pb > Cu > Cd, while for RX2 it was Fe > Ca > Mn > Zn > Cr > Ni > Co > Pb > Cu > Cd.
TABLE 3: Percentage Total Metal Concentration Sample
code
Cu Ca Mn Pb Ni Fe Co Zn Cr Cd
RX1 2.007 23.217 14.912 4.776 7.525 19.502 5.009 8.624 13.847 0.585
RX2 0.034 0.732 0.428 0.122 0.150 97.904 0.136 0.218 0.159 0.016
RX3 0.099 0.742 0.772 0.134 0.204 97.183 0.162 0.445 0.238 0.019
RX4 0.080 7.201 0.435 0.505 0.119 90.965 0.113 0.331 0.175 0.076
RX5 1.678 4.036 11.097 2.986 6.817 22.739 4.002 12.683 21.273 0.455
Evaluation Of The Speciation Patterns Of Some Heavy Metals Along The Major Roads Of Owerri
www.iosrjournals.org 70 | Page
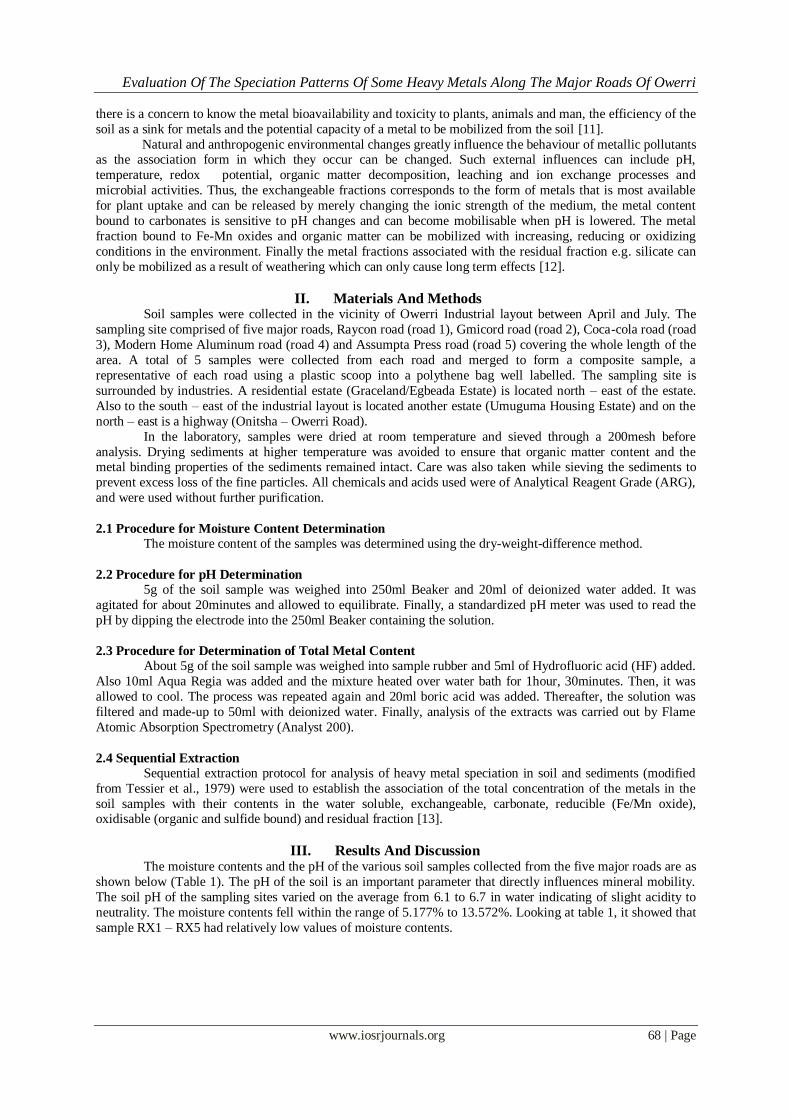
Figure 2: Percentage Total Metal Concentration
The trend Fe > Mn > Ca > Zn > Cr > Ni > Co > Pb > Cu > Cd, Fe > Ca > Pb > Mn > Zn > Cr > Ni > Co > Cu >
Cd and Fe > Cr > Zn > Mn > Ni > Ca > Co > Pb > Cu > Cd are for RX3, RX4 and RX5 samples respectively.
Cd had the least total concentration and Fe had the highest total concentration except for RX1 where Ca had the
maximum value in the soil samples.
TABLE 4: Fractional Concentration of Cu in the Various Soils Samples (mg/kg). Sample
code
F1 F2 F3 F4 F5 F6 Total Mean BAF % BAF
RX1 0.092
±0.000
0.070
±0.001
0.166
±0.001
0.088
±0.001
0.112
±0.002
0.315
±0.009
0.843 0.141 0.328 38.909
RX2 0.651
±0.152
ND
0.107
±0.003
0.059
±0.001
0.150
±0.014
0.311
±0.003
1.278 0.213 0.758 59.311
RX3 ND 0.076
±0.004
0.132
±0.000
0.079
±0.003
0.104
±0.001
0.211
±0.003
0.602 0.100 0.208 34.551
RX4 ND 0.076
±0.002
0.193
±0.004
0.143
±0.003
0.244
±0.004
0.086
±0.001
0.742 0.124 0.269 36.253
RX5 0.099
±0.0012
0.023
±0.001
0.112
±0.000
0.091
±0.002
0.149
±0.000
0.289
±0.003
0.763 0.127 0.234 30.668
Total 0.842 0.245 0.708 0.460 0.759 1.212 4.366 0.728 1.795 199.692
Mean 0.164 0.049 0.142 0.092 0.152 0.242 0.841 0.140 0.355 39.938
F1 = Water soluble Fraction, F2 = exchangeable metal fraction, F3 = carbonate fractions, F4 = reducible Fractions, F5 = oxidizable and F6 = residual fractions. ND = not detected.
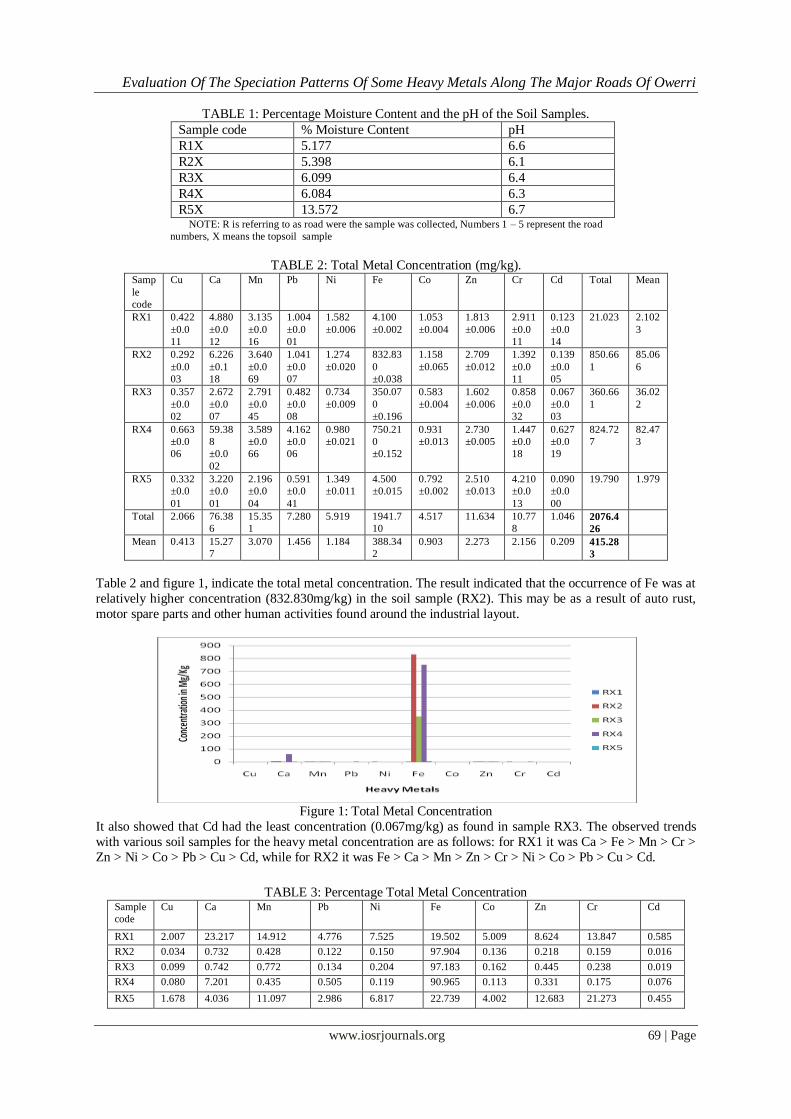
In the soil samples, much of the copper was associated with residual fractions with a mean value of 0.242mg/kg
(Table 4). The observed trend in the range of copper concentration in the various fractions was F6 > F1 > F5 >
F3 > F4 > F2. Also the trend in the percentage bioavailability of the samples was RX2 > RX1 > RX4 > RX3 >
RX5. The water soluble fractions of samples RX3 and RX4 was at non-detectable level of the FAAS. So also it
was for the exchangeable fraction of the RX2 sample. The highest fraction of Cu was found in sample RX2
(0.651mg/kg) in the water soluble fraction (F1), and this contributed to the high value of the %BAF of Cu
(59.311%) more than every other sample in the study area.
Figure 3: Fractional Concentration of Cu in the Various Topsoil Samples (mg/kg).
0
20
40
60
80
100
120
Cu Ca Mn Pb Ni Fe Co Zn Cr Cd
% T
ota
l Me
tal C
on
cen
tra
tio
n
Heavy Metals
RX1
RX2
RX3
RX4
RX5
0
0.1
0.2
0.3
0.4
0.5
0.6
0.7
F1 F2 F3 F4 F5 F6Fra
ctio
nal
Co
nce
ntr
ati
on
in
Mg/
Kg
Fractions of Copper
RX1
RX2
RX3
RX4
RX5

Evaluation Of The Speciation Patterns Of Some Heavy Metals Along The Major Roads Of Owerri
www.iosrjournals.org 71 | Page
TABLE 5: Fractional Concentration of Ca in the Various Soil Samples (mg/kg). Sample
code
F1 F2 F3 F4 F5 F6 Total Mean BAF % BAF
RX1 3.210
±0.015
4.966
±0.008
2.166
±0.019
5.446
±0.052
1.332
±0.019
0.689
±0.049
17.809 2.968 10.342 58.072
RX2 2.415
±0.016
5.259
±0.012
2.949
±0.041
3.948
±0.016
1.477
±0.001
6.992
±0.055
23.040 3.840 10.623 46.107
RX3 1.575
±0.041
2.793
±0.047
1.693
±0.017
1.866
±0.084
0.954
±0.018
0.417
±0.001
9.298 1.550 6.061 65.186
RX4 1.220
±0.011
3.809
±0.171
2.746
±0.015
8.213
±0.219
18.963
±0.053
8.225
±0.200
43.176 7.196 7.775 18.008
RX5 2.330
±0.033
3.298
±0.062
1.220
±0.012
2.386
±0.016
1.168
±0.005
0.455
±0.001
10.857 1.810 6.848 63.075
Total 10.750 20.125 10.774 21.859 23.894 16.778 104.180 17.363 41.649 250.448
Mean 2.150 4.025 2.155 4.372 4.779 3.356 20.837 3.473 8.330 50.089
In the soil samples, much of the Ca was associated with the oxidisable fractions with a mean value of
4.779mg/kg. The observed trend in the range of Ca concentration in the various fractions was F5 > F4 > F2 > F6
> F3 > F1. Also the trend in the percentage bioavailability of the samples was RX3 > RX5 > RX1 > RX2 >
RX4. The least fractional concentration of Ca was found in sample RX3 (0.417mg/kg) also at the residual
fraction.
Figure 4: Fractional Concentration of Ca in the Various Soil samples (mg/kg).
From fig. 4, we can see that Road 4 (RX4) recorded the most fractional concentration of Ca (18.963mg/kg) at
the oxidizable fractions. The mean % BAF of Ca is 50.089%, which is slightly above average and it shows that
Ca is potentially bioavailable for organism’s uptake in the studied area.
TABLE 6: Fractional Concentration of Mn in the Various Soil Samples (mg/kg). Sample
code
F1 F2 F3 F4 F5 F6 Total Mean BAF % BAF
RX1 0.221
±0.013
0.681
±0.003
1.021
±0.000
0.886
±0.012
0.945
±0.005
2.311
±0.019
6.065 1.010 1.923 31.707
RX2 0.024
±0.006
0.992
±0.002
1.044
±0.032
0.879
±0.018
1.232
±0.005
2.477
±0.065
6.648 1.108 2.060 30.987
RX3 0.106
±0.003
0.653
±0.021
0.673
±0.013
0.652
±0.017
0.759
±0.017
2.070
±0.084
4.913 0.818 1.432 29.147
RX4 0.139
±0.005
0.388
±0.005
0.856
±0.031
1.047
±0.023
0.849
±0.018
0.465
±0.007
3.744 0.624 1.383 36.939
RX5 0.142
±0.062
0.728
±0.011
1.001
±0.000
0.924
±0.062
0.681
±0.036
1.677
±0.029
5.203 0.867 1.921 36.921
Total 0.682 3.442 4.595 4.388 4.466 9.000 26.573 4.429 8.719 165.701
Mean 0.136 0.688 0.919 0.878 0.893 1.800 5.314 0.886 1.743 33.140
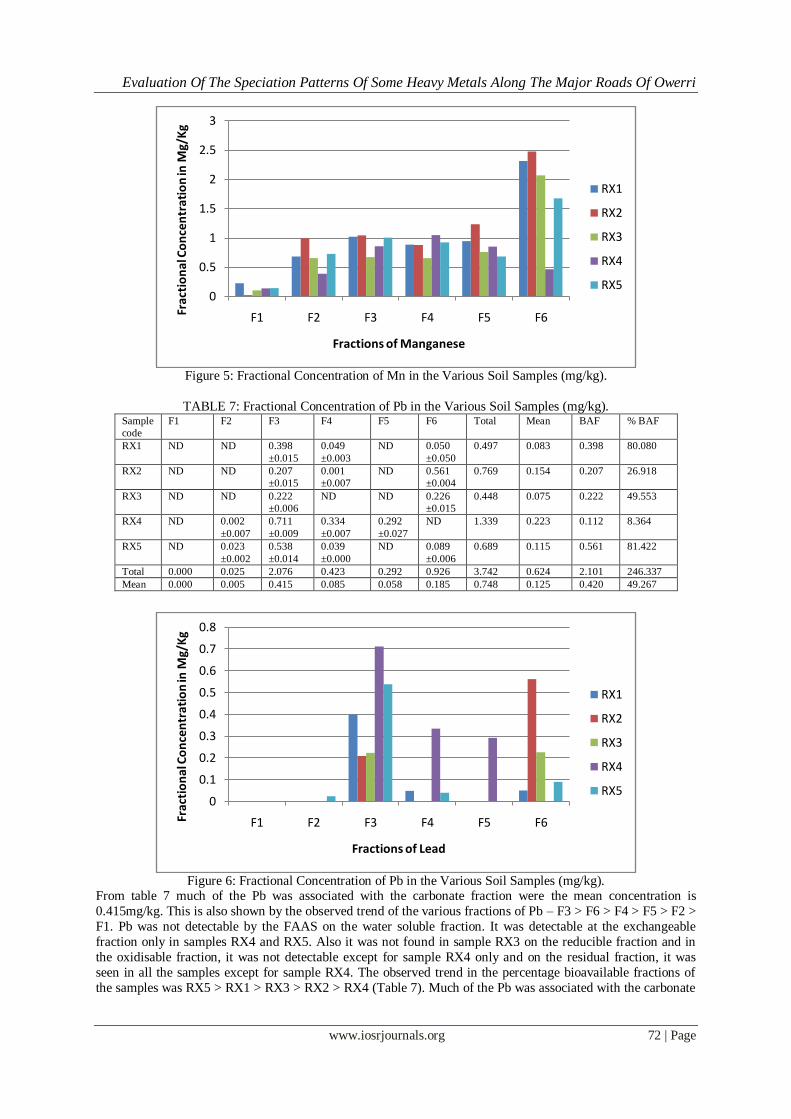
The mean %BAF of Mn is 33.140% which is below average and so Mn has a high non-bioavailable fraction in the studied area (Table 6). This is also supported by the observed trend in the concentration of Mn in the various
fractions – F6 ˃ F3 ˃ F5 ˃ F4 ˃ F2 ˃ F1. The trend in the percentage bioavailability of Mn in the soil samples is
RX4 > RX5 > RX1 > RX2 > RX3. Much of the Mn fractions were associated with the residual fraction (F6)
with mean value of 1.800mg/kg.
0
5
10
15
20
F1 F2 F3 F4 F5 F6Fra
ctio
nal
Co
nce
ntr
ati
on
in
Mg/
Kg
Fractions of Calcium
RX1
RX2
RX3
RX4
RX5
Evaluation Of The Speciation Patterns Of Some Heavy Metals Along The Major Roads Of Owerri
www.iosrjournals.org 72 | Page
Figure 5: Fractional Concentration of Mn in the Various Soil Samples (mg/kg).
TABLE 7: Fractional Concentration of Pb in the Various Soil Samples (mg/kg). Sample
code
F1 F2 F3 F4 F5 F6 Total Mean BAF % BAF
RX1 ND ND 0.398
±0.015
0.049
±0.003
ND 0.050
±0.050
0.497 0.083 0.398 80.080
RX2 ND ND 0.207
±0.015
0.001
±0.007
ND 0.561
±0.004
0.769 0.154 0.207 26.918
RX3 ND ND 0.222
±0.006
ND ND 0.226
±0.015
0.448 0.075 0.222 49.553
RX4 ND 0.002
±0.007
0.711
±0.009
0.334
±0.007
0.292
±0.027
ND 1.339 0.223 0.112 8.364
RX5 ND 0.023
±0.002
0.538
±0.014
0.039
±0.000
ND 0.089
±0.006
0.689 0.115 0.561 81.422
Total 0.000 0.025 2.076 0.423 0.292 0.926 3.742 0.624 2.101 246.337
Mean 0.000 0.005 0.415 0.085 0.058 0.185 0.748 0.125 0.420 49.267
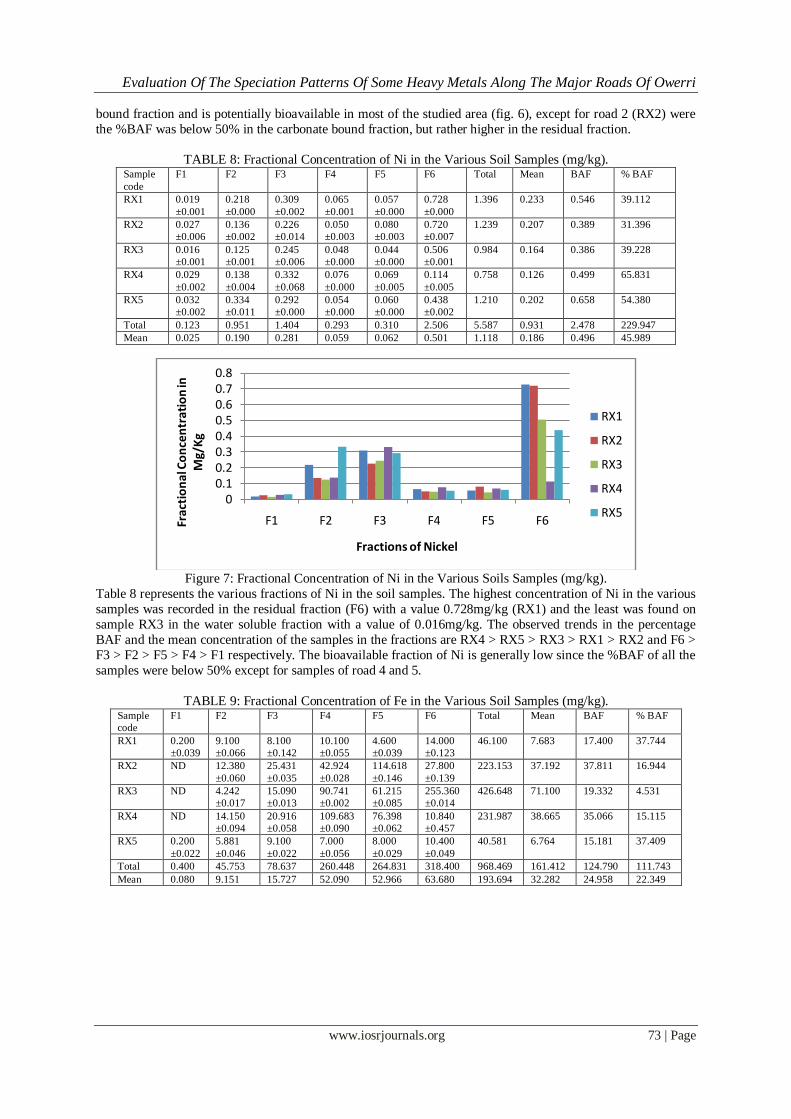
Figure 6: Fractional Concentration of Pb in the Various Soil Samples (mg/kg).
From table 7 much of the Pb was associated with the carbonate fraction were the mean concentration is
0.415mg/kg. This is also shown by the observed trend of the various fractions of Pb – F3 > F6 > F4 > F5 > F2 >
F1. Pb was not detectable by the FAAS on the water soluble fraction. It was detectable at the exchangeable
fraction only in samples RX4 and RX5. Also it was not found in sample RX3 on the reducible fraction and in
the oxidisable fraction, it was not detectable except for sample RX4 only and on the residual fraction, it was
seen in all the samples except for sample RX4. The observed trend in the percentage bioavailable fractions of
the samples was RX5 > RX1 > RX3 > RX2 > RX4 (Table 7). Much of the Pb was associated with the carbonate
0
0.5
1
1.5
2
2.5
3
F1 F2 F3 F4 F5 F6Fra
ctio
nal
Co
nce
ntr
ati
on
in M
g/K
g
Fractions of Manganese
RX1
RX2
RX3
RX4
RX5
0
0.1
0.2
0.3
0.4
0.5
0.6
0.7
0.8
F1 F2 F3 F4 F5 F6Fra
ctio
nal
Co
nce
ntr
ati
on
in M
g/K
g
Fractions of Lead
RX1
RX2
RX3
RX4
RX5
Evaluation Of The Speciation Patterns Of Some Heavy Metals Along The Major Roads Of Owerri
www.iosrjournals.org 73 | Page
bound fraction and is potentially bioavailable in most of the studied area (fig. 6), except for road 2 (RX2) were
the %BAF was below 50% in the carbonate bound fraction, but rather higher in the residual fraction.
TABLE 8: Fractional Concentration of Ni in the Various Soil Samples (mg/kg).
Sample
code
F1 F2 F3 F4 F5 F6 Total Mean BAF % BAF
RX1 0.019
±0.001
0.218
±0.000
0.309
±0.002
0.065
±0.001
0.057
±0.000
0.728
±0.000
1.396 0.233 0.546 39.112
RX2 0.027
±0.006
0.136
±0.002
0.226
±0.014
0.050
±0.003
0.080
±0.003
0.720
±0.007
1.239 0.207 0.389 31.396
RX3 0.016
±0.001
0.125
±0.001
0.245
±0.006
0.048
±0.000
0.044
±0.000
0.506
±0.001
0.984 0.164 0.386 39.228
RX4 0.029
±0.002
0.138
±0.004
0.332
±0.068
0.076
±0.000
0.069
±0.005
0.114
±0.005
0.758 0.126 0.499 65.831
RX5 0.032
±0.002
0.334
±0.011
0.292
±0.000
0.054
±0.000
0.060
±0.000
0.438
±0.002
1.210 0.202 0.658 54.380
Total 0.123 0.951 1.404 0.293 0.310 2.506 5.587 0.931 2.478 229.947
Mean 0.025 0.190 0.281 0.059 0.062 0.501 1.118 0.186 0.496 45.989
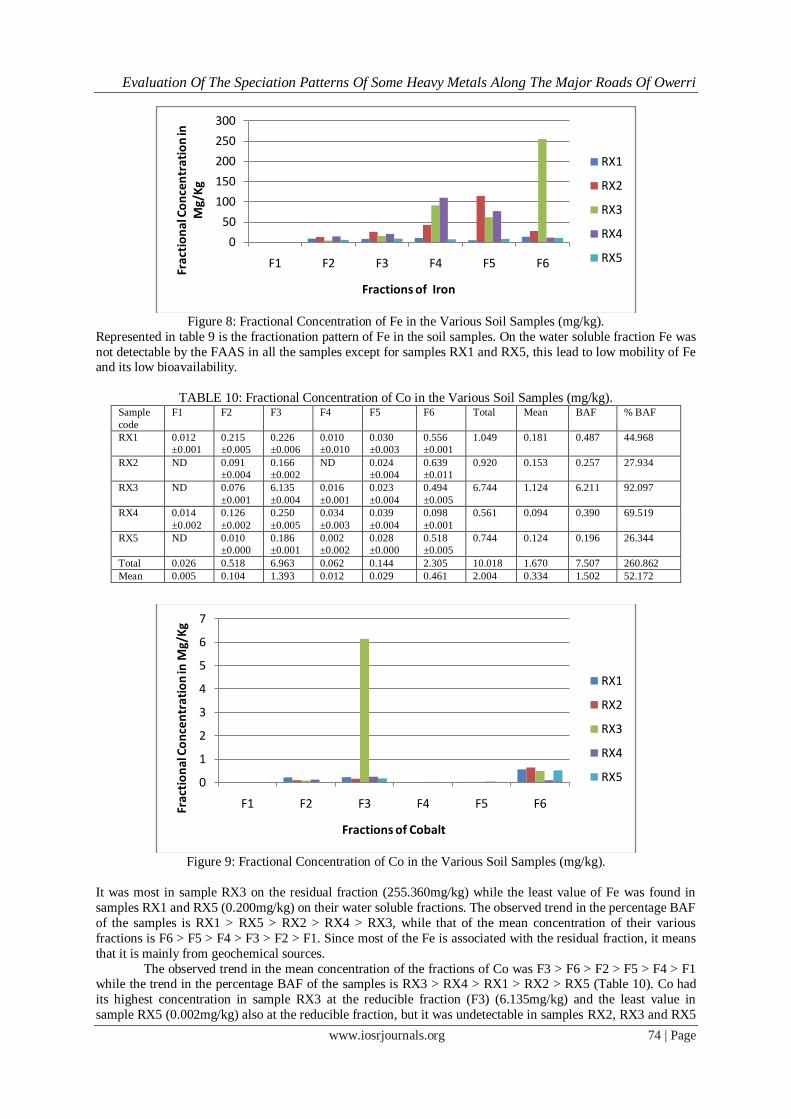
Figure 7: Fractional Concentration of Ni in the Various Soils Samples (mg/kg).
Table 8 represents the various fractions of Ni in the soil samples. The highest concentration of Ni in the various
samples was recorded in the residual fraction (F6) with a value 0.728mg/kg (RX1) and the least was found on
sample RX3 in the water soluble fraction with a value of 0.016mg/kg. The observed trends in the percentage
BAF and the mean concentration of the samples in the fractions are RX4 > RX5 > RX3 > RX1 > RX2 and F6 >
F3 > F2 > F5 > F4 > F1 respectively. The bioavailable fraction of Ni is generally low since the %BAF of all the
samples were below 50% except for samples of road 4 and 5.
TABLE 9: Fractional Concentration of Fe in the Various Soil Samples (mg/kg). Sample
code
F1 F2 F3 F4 F5 F6 Total Mean BAF % BAF
RX1 0.200
±0.039
9.100
±0.066
8.100
±0.142
10.100
±0.055
4.600
±0.039
14.000
±0.123
46.100 7.683 17.400 37.744
RX2 ND 12.380
±0.060
25.431
±0.035
42.924
±0.028
114.618
±0.146
27.800
±0.139
223.153 37.192 37.811 16.944
RX3 ND 4.242
±0.017
15.090
±0.013
90.741
±0.002
61.215
±0.085
255.360
±0.014
426.648 71.100 19.332 4.531
RX4 ND 14.150
±0.094
20.916
±0.058
109.683
±0.090
76.398
±0.062
10.840
±0.457
231.987 38.665 35.066 15.115
RX5 0.200
±0.022
5.881
±0.046
9.100
±0.022
7.000
±0.056
8.000
±0.029
10.400
±0.049
40.581 6.764 15.181 37.409
Total 0.400 45.753 78.637 260.448 264.831 318.400 968.469 161.412 124.790 111.743
Mean 0.080 9.151 15.727 52.090 52.966 63.680 193.694 32.282 24.958 22.349
00.10.20.30.40.50.60.70.8
F1 F2 F3 F4 F5 F6Fra
ctio
nal
Co
nce
ntr
ati
on
in
Mg/
Kg
Fractions of Nickel
RX1
RX2
RX3
RX4
RX5
Evaluation Of The Speciation Patterns Of Some Heavy Metals Along The Major Roads Of Owerri
www.iosrjournals.org 74 | Page
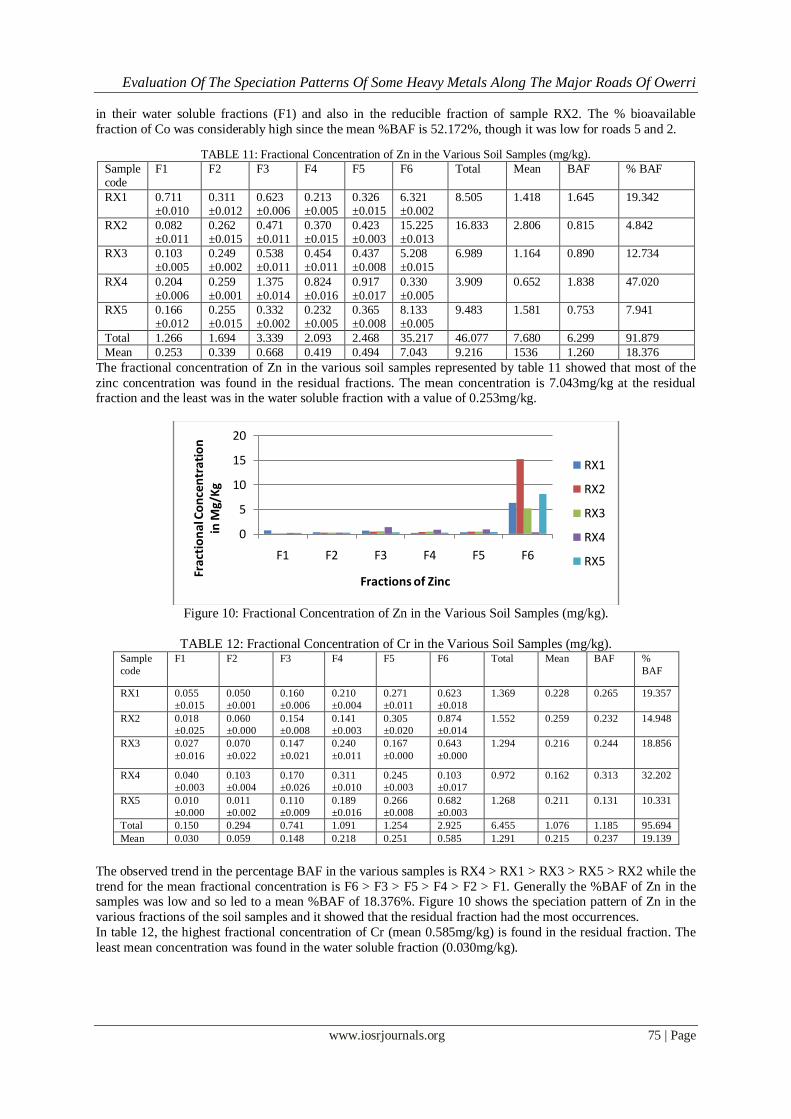
Figure 8: Fractional Concentration of Fe in the Various Soil Samples (mg/kg).
Represented in table 9 is the fractionation pattern of Fe in the soil samples. On the water soluble fraction Fe was
not detectable by the FAAS in all the samples except for samples RX1 and RX5, this lead to low mobility of Fe and its low bioavailability.
TABLE 10: Fractional Concentration of Co in the Various Soil Samples (mg/kg). Sample
code
F1 F2 F3 F4 F5 F6 Total Mean BAF % BAF
RX1 0.012
±0.001
0.215
±0.005
0.226
±0.006
0.010
±0.010
0.030
±0.003
0.556
±0.001
1.049 0.181 0.487 44.968
RX2 ND 0.091
±0.004
0.166
±0.002
ND 0.024
±0.004
0.639
±0.011
0.920 0.153 0.257 27.934
RX3 ND 0.076
±0.001
6.135
±0.004
0.016
±0.001
0.023
±0.004
0.494
±0.005
6.744
1.124 6.211 92.097
RX4 0.014
±0.002
0.126
±0.002
0.250
±0.005
0.034
±0.003
0.039
±0.004
0.098
±0.001
0.561 0.094 0.390 69.519
RX5 ND 0.010
±0.000
0.186
±0.001
0.002
±0.002
0.028
±0.000
0.518
±0.005
0.744 0.124 0.196 26.344
Total 0.026 0.518 6.963 0.062 0.144 2.305 10.018 1.670 7.507 260.862
Mean 0.005 0.104 1.393 0.012 0.029 0.461 2.004 0.334 1.502 52.172
Figure 9: Fractional Concentration of Co in the Various Soil Samples (mg/kg).
It was most in sample RX3 on the residual fraction (255.360mg/kg) while the least value of Fe was found in
samples RX1 and RX5 (0.200mg/kg) on their water soluble fractions. The observed trend in the percentage BAF
of the samples is RX1 > RX5 > RX2 > RX4 > RX3, while that of the mean concentration of their various
fractions is F6 > F5 > F4 > F3 > F2 > F1. Since most of the Fe is associated with the residual fraction, it means
that it is mainly from geochemical sources.
The observed trend in the mean concentration of the fractions of Co was F3 > F6 > F2 > F5 > F4 > F1 while the trend in the percentage BAF of the samples is RX3 > RX4 > RX1 > RX2 > RX5 (Table 10). Co had
its highest concentration in sample RX3 at the reducible fraction (F3) (6.135mg/kg) and the least value in
sample RX5 (0.002mg/kg) also at the reducible fraction, but it was undetectable in samples RX2, RX3 and RX5
0
50
100
150
200
250
300
F1 F2 F3 F4 F5 F6
Fra
ctio
nal
Co
nce
ntr
ati
on
in
Mg/
Kg
Fractions of Iron
RX1
RX2
RX3
RX4
RX5
0
1
2
3
4
5
6
7
F1 F2 F3 F4 F5 F6Fra
ctio
nal
Co
nce
ntr
ati
on
in M
g/K
g
Fractions of Cobalt
RX1
RX2
RX3
RX4
RX5
Evaluation Of The Speciation Patterns Of Some Heavy Metals Along The Major Roads Of Owerri
www.iosrjournals.org 75 | Page
in their water soluble fractions (F1) and also in the reducible fraction of sample RX2. The % bioavailable
fraction of Co was considerably high since the mean %BAF is 52.172%, though it was low for roads 5 and 2.
TABLE 11: Fractional Concentration of Zn in the Various Soil Samples (mg/kg).
Sample code
F1 F2 F3 F4 F5 F6 Total Mean BAF % BAF
RX1 0.711 ±0.010
0.311 ±0.012
0.623 ±0.006
0.213 ±0.005
0.326 ±0.015
6.321 ±0.002
8.505 1.418 1.645 19.342
RX2 0.082 ±0.011
0.262 ±0.015
0.471 ±0.011
0.370 ±0.015
0.423 ±0.003
15.225 ±0.013
16.833 2.806 0.815 4.842
RX3 0.103 ±0.005
0.249 ±0.002
0.538 ±0.011
0.454 ±0.011
0.437 ±0.008
5.208 ±0.015
6.989 1.164 0.890 12.734
RX4 0.204 ±0.006
0.259 ±0.001
1.375 ±0.014
0.824 ±0.016
0.917 ±0.017
0.330 ±0.005
3.909 0.652 1.838 47.020
RX5 0.166 ±0.012
0.255 ±0.015
0.332 ±0.002
0.232 ±0.005
0.365 ±0.008
8.133 ±0.005
9.483 1.581 0.753 7.941
Total 1.266 1.694 3.339 2.093 2.468 35.217 46.077 7.680 6.299 91.879
Mean 0.253 0.339 0.668 0.419 0.494 7.043 9.216 1536 1.260 18.376
The fractional concentration of Zn in the various soil samples represented by table 11 showed that most of the
zinc concentration was found in the residual fractions. The mean concentration is 7.043mg/kg at the residual fraction and the least was in the water soluble fraction with a value of 0.253mg/kg.
Figure 10: Fractional Concentration of Zn in the Various Soil Samples (mg/kg).
TABLE 12: Fractional Concentration of Cr in the Various Soil Samples (mg/kg). Sample
code
F1 F2 F3 F4 F5 F6 Total Mean BAF %
BAF
RX1 0.055
±0.015
0.050
±0.001
0.160
±0.006
0.210
±0.004
0.271
±0.011
0.623
±0.018
1.369 0.228 0.265 19.357
RX2 0.018
±0.025
0.060
±0.000
0.154
±0.008
0.141
±0.003
0.305
±0.020
0.874
±0.014
1.552 0.259 0.232 14.948
RX3 0.027
±0.016
0.070
±0.022
0.147
±0.021
0.240
±0.011
0.167
±0.000
0.643
±0.000
1.294 0.216 0.244 18.856
RX4 0.040
±0.003
0.103
±0.004
0.170
±0.026
0.311
±0.010
0.245
±0.003
0.103
±0.017
0.972 0.162 0.313 32.202
RX5 0.010
±0.000
0.011
±0.002
0.110
±0.009
0.189
±0.016
0.266
±0.008
0.682
±0.003
1.268 0.211 0.131 10.331
Total 0.150 0.294 0.741 1.091 1.254 2.925 6.455 1.076 1.185 95.694
Mean 0.030 0.059 0.148 0.218 0.251 0.585 1.291 0.215 0.237 19.139
The observed trend in the percentage BAF in the various samples is RX4 > RX1 > RX3 > RX5 > RX2 while the
trend for the mean fractional concentration is F6 > F3 > F5 > F4 > F2 > F1. Generally the %BAF of Zn in the samples was low and so led to a mean %BAF of 18.376%. Figure 10 shows the speciation pattern of Zn in the
various fractions of the soil samples and it showed that the residual fraction had the most occurrences.
In table 12, the highest fractional concentration of Cr (mean 0.585mg/kg) is found in the residual fraction. The
least mean concentration was found in the water soluble fraction (0.030mg/kg).
0
5
10
15
20
F1 F2 F3 F4 F5 F6
Frac
tio
nal
Co
nce
ntr
atio
n
in M
g/K
g
Fractions of Zinc
RX1
RX2
RX3
RX4
RX5

Evaluation Of The Speciation Patterns Of Some Heavy Metals Along The Major Roads Of Owerri
www.iosrjournals.org 76 | Page
Figure 11: Fractional Concentration of Cr in the Various Soil Samples (mg/kg).
Figure 11, indicated that, the concentration was on the increase from F1 through F6. The observed trend in the
mean concentration of Cr in the various fractions is F6 > F5 > F4 > F3 > F2 > F1. The speciation followed a particular pattern and the %BAF of Cr in all the soil samples was generally low with a mean 19.139% (Table
12).
TABLE 13: Fractional Concentration of Cd in the Various Soil Samples (mg/kg). Sample
code
F1 F2 F3 F4 F5 F6 Total Mean BAF % BAF
RX1 ND 0.021
±0.002
0.033
±0.001
ND ND 0.042
±0.001
0.096 0.016 0.054 56.250
RX2 ND 0.023
±0.003
0.049
±0.002
ND ND 0.061
±0.004
0.133 0.022 0.072 54.135
RX3 ND 0.026
±0.001
0.050
±0.001
ND ND 0.057
±0.000
0.133 0.022 0.076 57.143
RX4 ND 0.041
±0.006
0.034
±0.001
ND 0.007
±0.000
0.025
±0.006
0.107 0.018 0.075 70.093
RX5 ND 0.011
±0.002
0.033
±0.001
ND 0.001
±0.000
0.085
±0.000
0.130 0.022 0.044 33.845
Total ND 0.122 0.199 ND 0.008 0.270 0.599 0.100 0.321 271.466
Mean ND 0.024 0.040 ND 0.002 0.054 0.120 0.020 0.064 54.293
Figure 12: Fractional Concentration of Cd in the Various Soil Samples (mg/kg).
Cd was undetectable at the water soluble fraction and at the reducible fraction in all the samples (Table 13), so
also it is in the oxidisable fraction except on samples RX4 and RX5. The trend in the mean concentration of Cd
was F6 > F3 > F2 > F5 > F4 > F1. Figure 27, indicated that the speciation was more in the residual fraction followed by the carbonate fraction. Even though Cd was undetectable at the water soluble fraction, its %BAF
was still high with a mean of 54.293%, suggesting that Cd is potentially bioavailable in the studied area.
0
0.2
0.4
0.6
0.8
1
F1 F2 F3 F4 F5 F6
Fact
ion
al C
on
cen
tra
tio
n in
M
g/K
g
Fractions of Chromium
RX1
RX2
RX3
RX4
RX5
0
0.02
0.04
0.06
0.08
0.1
F1 F2 F3 F4 F5 F6Fra
ctio
nal
Co
nce
ntr
ati
on
in
Mg/
Kg
Fractions of Cadmium
RX1
RX2
RX3
RX4
RX5
Evaluation Of The Speciation Patterns Of Some Heavy Metals Along The Major Roads Of Owerri
www.iosrjournals.org 77 | Page
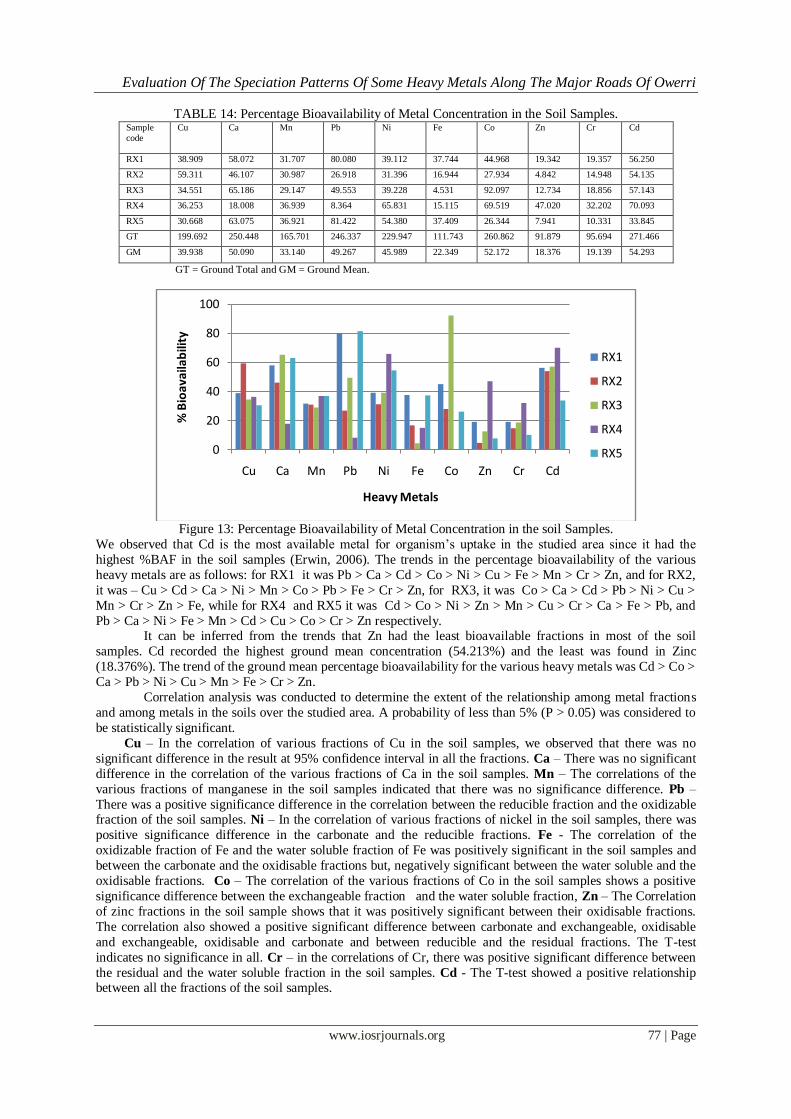
TABLE 14: Percentage Bioavailability of Metal Concentration in the Soil Samples. Sample
code
Cu Ca Mn Pb Ni Fe Co Zn Cr Cd
RX1 38.909 58.072 31.707 80.080 39.112 37.744 44.968 19.342 19.357 56.250
RX2 59.311 46.107 30.987 26.918 31.396 16.944 27.934 4.842 14.948 54.135
RX3 34.551 65.186 29.147 49.553 39.228 4.531 92.097 12.734 18.856 57.143
RX4 36.253 18.008 36.939 8.364 65.831 15.115 69.519 47.020 32.202 70.093
RX5 30.668 63.075 36.921 81.422 54.380 37.409 26.344 7.941 10.331 33.845
GT 199.692 250.448 165.701 246.337 229.947 111.743 260.862 91.879 95.694 271.466
GM 39.938 50.090 33.140 49.267 45.989 22.349 52.172 18.376 19.139 54.293
GT = Ground Total and GM = Ground Mean.
Figure 13: Percentage Bioavailability of Metal Concentration in the soil Samples.
We observed that Cd is the most available metal for organism’s uptake in the studied area since it had the
highest %BAF in the soil samples (Erwin, 2006). The trends in the percentage bioavailability of the various
heavy metals are as follows: for RX1 it was Pb > Ca > Cd > Co > Ni > Cu > Fe > Mn > Cr > Zn, and for RX2,
it was – Cu > Cd > Ca > Ni > Mn > Co > Pb > Fe > Cr > Zn, for RX3, it was Co > Ca > Cd > Pb > Ni > Cu >
Mn > Cr > Zn > Fe, while for RX4 and RX5 it was Cd > Co > Ni > Zn > Mn > Cu > Cr > Ca > Fe > Pb, and
Pb > Ca > Ni > Fe > Mn > Cd > Cu > Co > Cr > Zn respectively. It can be inferred from the trends that Zn had the least bioavailable fractions in most of the soil
samples. Cd recorded the highest ground mean concentration (54.213%) and the least was found in Zinc
(18.376%). The trend of the ground mean percentage bioavailability for the various heavy metals was Cd > Co >
Ca > Pb > Ni > Cu > Mn > Fe > Cr > Zn.
Correlation analysis was conducted to determine the extent of the relationship among metal fractions
and among metals in the soils over the studied area. A probability of less than 5% (P > 0.05) was considered to
be statistically significant.
Cu – In the correlation of various fractions of Cu in the soil samples, we observed that there was no
significant difference in the result at 95% confidence interval in all the fractions. Ca – There was no significant
difference in the correlation of the various fractions of Ca in the soil samples. Mn – The correlations of the
various fractions of manganese in the soil samples indicated that there was no significance difference. Pb –
There was a positive significance difference in the correlation between the reducible fraction and the oxidizable fraction of the soil samples. Ni – In the correlation of various fractions of nickel in the soil samples, there was
positive significance difference in the carbonate and the reducible fractions. Fe - The correlation of the
oxidizable fraction of Fe and the water soluble fraction of Fe was positively significant in the soil samples and
between the carbonate and the oxidisable fractions but, negatively significant between the water soluble and the
oxidisable fractions. Co – The correlation of the various fractions of Co in the soil samples shows a positive
significance difference between the exchangeable fraction and the water soluble fraction, Zn – The Correlation
of zinc fractions in the soil sample shows that it was positively significant between their oxidisable fractions.
The correlation also showed a positive significant difference between carbonate and exchangeable, oxidisable
and exchangeable, oxidisable and carbonate and between reducible and the residual fractions. The T-test
indicates no significance in all. Cr – in the correlations of Cr, there was positive significant difference between
the residual and the water soluble fraction in the soil samples. Cd - The T-test showed a positive relationship between all the fractions of the soil samples.
0
20
40
60
80
100
Cu Ca Mn Pb Ni Fe Co Zn Cr Cd
% B
ioav
aila
bili
ty
Heavy Metals
RX1
RX2
RX3
RX4
RX5
Evaluation Of The Speciation Patterns Of Some Heavy Metals Along The Major Roads Of Owerri
www.iosrjournals.org 78 | Page
IV. Conclusion The ANOVA indicates that Ca had a significant mean difference in the water soluble fractions of the
soil samples and so also it is in the exchangeable fractions of the soil samples. Fe was also significance in the
exchangeable fraction. But in the carbonate bound, reducible, oxidisable and residual fractions, it was only Fe
that had a significance mean difference at 95% confidence interval in the soil samples. This suggests that there
are several location (sites) having greater Ca and Fe concentration and the soil have been contaminated more
severely by these metals, Though Ca and Fe are among the micronutrient elements. This means that the human
activities in and around the area have significant effects on the level of almost all metals in the soils over this
studied area. The speciation of Ca was different as the concentration was evenly distributed in all the fractions
of the soil samples and speciation of Cu showed higher concentration in the water soluble fraction in the soil
samples.
Further work is recommended in the area with reference to the heavy metal speciation some centimetres (about 30cm) below the soil surface so as to determine the solubility as well as the bioavailability of
these metals.
References [1] L.E. Bennett, J.L. Burkhead, K.L. Hale, N. Terry, M. Pylons, and Pilon-smits, Analysis of Transgenic Indian mustard Plants for
Phytoremediation of Metals Contaminated Mine Tailings. J. of Environmental Quality, 32, 2003, 432-440.
[2] E.U. Ikhuoria, and F.E. Okieimen, Scavenging Cadium, copper, lead, Nickel and Zinc ions from aqueous solution by modified
cellulosic sorbent. Intl. J. of Environ. Studies. 57(4), (2000), 4010.
[3] J.O. Nriagu, The biochemistry of Pb in the environment. (Elsevier, Amsterdam 2000).
[4] United States Protection Agency Reports, Introduction to phytoremediation. 2000, EPA 600/R.99/107.
[5] S. Zhen-Guo, L. Xian-Dong, W. Chun-Chun, Ch. Huai-Man and Ch. Hong, Lead Phytoextraction from contaminated soil with high
biomass plant species. J. Environ. Qual., 31, 2002, 1893-1900.
[6] M. Pueyo, and E. Sastre, Prediction of trace element mobility in contaminated soils by sequential extraction. Journal of
Environmental Quality Spain, 32, 2003, 2054-2066.
[7] J.J.K. Erwin, Chemical Speciation and Bioavailability of Heavy Metals in Soil and Surface Water. (Wageningen University,
Wageningen, Netherlands. 2006), p.10.
[8] M.A. Nwachukwu, H. Feng, and J. Alinnor, Assessment of heavy metal pollution in soil and their implication within and around
mechanic villages. Intl. J. Environ. Sci. Tech., 7(2) , 2010, 347-358.
[9] P.C. Onianwa, O.M. Jaiyeola and R.N. Egekenze, Heavy metal contamination of topsoil in the vicinities of auto repair workshop, gas
stations and motor parks in Nigeria city. Toxicol. Environ. Chem., 84(1-4), 2001, 33-39.
[10] P. E. Omuku, P. A. C. Okoye, A. C Okoye,. and H. A. Onwumelu, Partitioning of Selected Heavy Metals in Nnewi, A busy city in
Anambra State, Nigeria. J. Int. Env. Application and Sci. Turkey 5(5), 2010, 713-719.
[11] A.M. Ure, and C.M. Davidson, Chemical Speciation in The Environment. Blackie, Glasgow. 2001, 265-321.
[12] J.O. Duruibe, M.O.C Ogwuegbu and J.N. Egwuruegwu, Heavy Metal Pollution and Human Biotoxic Effects. International Journal
of Physical Sciences, 2(5), 2007, 112-118.
[13] A., Tessier, P.G.C Campbell,. and M. Blsson. Sequential Extraction Procedure for the Speciation of Particulate Trace Metals.
Analytical Chemistry, 51(7), 1979, 844-845.