Embed Size (px)
Citation preview

Evaluation of the
Predictive Analytics
Project

Contents
1. Background ............................................................................................................................ 1
1.1. Mental Health Crisis ......................................................................................................... 1
1.2. Risk Prediction Model ...................................................................................................... 2
1.3. Clinical Risk Stratification Tool and Feedback Platform ................................................ 2
1.4. Implementation of the Risk Prediction Model ............................................................... 3
2. Methodology ......................................................................................................................... 5
2.1. Aim of the Study .............................................................................................................. 5
2.2. Study Design and Participants ........................................................................................ 5
3. Results ..................................................................................................................................... 7
3.1. Engagement of participants ............................................................................................ 7
3.2. Clinicians’ feedback ......................................................................................................... 8
3.3. Qualitative views on implementation and use of the Predictive Risk Stratification
Model ........................................................................................................................................ 10
4. Discussion and Conclusions ............................................................................................... 17
Clinician engagement ........................................................................................................... 17
Risk Perception ...................................................................................................................... 17
Usefulness of Risk Prediction Model .................................................................................... 18
4.1. Strengths and limitations of study ............................................................................... 19
4.2. Conclusions .................................................................................................................... 19
References .................................................................................................................................... 20
Annexes ........................................................................................................................................ 21

1
1. Background
The NHS is currently dealing with an escalating demand for urgent care services and mental
health issues play a significant role in this. With the dual pressures of increasing demand and
financial constraints, there is a policy drive to improve quality of care while reducing costs. As
part of the NHS England Test Bed, Birmingham and Solihull Mental Health NHS Foundation
Trust collaborated with core partners Telefonica Alpha, Birmingham Community Healthcare
Trust, West Midlands Police, West Midlands Academic Health Science Network and the
Midlands and Lancashire Commissioning Support Unit. The Test bed was focused in
Birmingham and Solihull where 1.3million people are resident and around 25,000 people
experience a mental health crisis every year.
The purpose of the collaboration was to create a streamlined and efficient system for mental
health service users by introducing predictive technology and digital interface solutions to
reduce both the incidence and intensity of mental health crisis, while improving the system’s
response to crisis. The Predictive Analytics project started as a part of the Test bed and
continued following the Test bed closure with support of The Health Foundation through
their Advancing Analytics Programme.
The aim of the Predictive Analytics project was to develop a risk prediction model that
predicts the likelihood of a patient experiencing a mental health crisis which could be used
to reduce the intensity and/or incidence of crisis. Telefonica Alpha (our digital innovation
partner) used four years of pseudonymised Trust historical health data to capture potentially
robust predictors that would inform a model to identify patients at risk of experiencing a
mental health crisis.
1.1. Mental Health Crisis
A mental health crisis is an adverse event for a patient with mental health problems and it is
often described as the stage where a person is no longer feeling able to cope or be in
control of their mental health situation and it impacts their wellbeing (1). Mental health crisis
cannot be easily defined and has previously been defined using varied approaches including
‘self’ or risk-focused definition but these are subjective and are hard to quantify.
In this project, mental health crisis (and/or acute spell) is measured using an informatics
derived definition that defines the crisis or acute spell as a period of time in which a service
user is considered to be in ongoing crisis or acute psychiatric need based on the services he
or she has contact with. Each crisis spell encompasses an initial crisis presentation and all
subsequent activity until the service user’s level of need has ‘stabilised’ at a level below that
requiring support from crisis or acute services. The end of a crisis spell is reached when the

2
patient is no longer in receipt of crisis or acute psychiatric care for more than 28 days. Crisis
& Acute Spells will always start with a ‘Crisis Episode’, and may include multiple ‘Crisis
Episodes’ if there are repeat new presentations to crisis services before the person has had a
28-day period without any acute or crisis activity. This objective and measurable definition
supports predictive modelling to identify people within the general service user population
who are at risk of experiencing an acute mental health crisis, with a view to intervening in
advance to prevent a crisis developing. Please refer to Annex 1 for more information.
The number of crisis services across Birmingham and Solihull now includes the Rapid,
Assessment, Interface and Discharge Team (Liaison psychiatry) in A&E, Street Triage, Place of
Safety, Psychiatric Decision Unit, Home Treatment teams, mental health inpatient beds and
Crisis Houses. These services are more tailored to manage mental health crises but are only
available once a patient is experiencing a crisis. There is no mechanism to predict a crisis and
intervene before a patient’s condition escalates.
1.2. Risk Prediction Model
Telefonica Alpha used 5 years of pseudonymised Trust historical health data and
sociodemographic information to develop different models to identify those with the best
predictive power. XGBOOST, a supervised machine learning algorithm that belongs to the
family of Boosted Tree algorithms (2), was adopted for feature selection and model
construction as it demonstrated better predictive power than other machine learning
techniques and deep learning methods.
This algorithm was tested using Stratified 5-Fold Cross Validation with ROC-AUC score as
metric. It is a well-known metric used for binary classification problems that is robust in case
of having a large unbalance between the two classes as found in this data (i.e. the number of
no-crisis outcomes in one week greatly outnumbers the number of crises encountered in one
week for the entire sample). The gradient boosting model had an area under the curve (AUC)
of 0.77, which indicates a good predictive power. The algorithm uses a wide range of
variables (167) to make a prediction at a weekly basis of whether a patient will experience a
crisis event during the following four weeks but it does not identify the responsible risk
indicators for a given patient.
1.3. Clinical Risk Stratification Tool and Feedback Platform
Prior to prospectively testing the Risk Prediction Model, a pre-pilot study was conducted to
ensure that there was viability to continue to the pilot phase (Annex 2). This included input
from several clinicians from two community mental health teams (CMHTs) who looked at
retrospective data generated by the risk prediction model and assessed the use of the tool
and whether the outputs were considered operationally useful. The findings suggested that

3
while the clinician’s found the tool useful in practice and there was some insight gained from
using it. It was difficult to gauge the effectiveness of the algorithm in its current form
because of the time taken to review a patient’s record when only provided with a patient ID
number. Additionally, due to the high number of false positives on the list, a step up process
was required which after further stratification highlighted the most ‘at risk’ patients and
provided any important information about a patient that would reduce the time spent on a
case. In addition, there were also some recommendations shared with Telefonica to refine
the algorithm to reduce the high number of false positives. The pre-pilot also highlighted the
need to reduce the predictions presented to clinicians from a weekly to a bi-weekly basis due
to workload commitments. The pre-pilot also emphasised the importance of establishing
strong clinical engagement with the project to ensure a robust implementation of the tool.
As a result of the retrospective testing of the risk prediction model with clinicians, a risk
stratification ‘tool’ was developed that encompassed the recommendations of having the key
clinical information highlighted. This tool ranked the cases predicted as ‘at risk’ of crisis using
information from their health record data and takes into account several factors such as the
patient’s recent medical history, care level and whether their risk assessment/care plan is up
to date. Adding this additional tool was integral to implementation and clinical buy-in as it
provided the clinicians with context on their cases and presented some of the risk factors in a
structured format.
The risk prediction model’s output was stratified further using a risk stratification tool scoring
system to rank the cases from the highest to lowest risk of crisis. This combined system of
the risk prediction model and risk stratification tool is referred to as the Risk Prediction Tool.
The Risk Prediction Tool was used in the pilot phase and was presented to clinicians via a
feedback platform which was developed to allow clinicians to receive/use the list of flagged
patients and to provide feedback after reviewing them. Further detail on the approach to
developing the tool and an example of the feedback platform can be found in Annex 3.
1.4. Implementation of the Risk Prediction Model
As highlighted by the pre-pilot findings, clinical engagement would be crucial to successful
implementation of the Risk Prediction Tool. Effective engagement with clinicians started prior
to implementation and involved engaging the Team managers and selected Clinical Leads
from the pilot CMHTs to be involved in the development stages of the pilot study including
the development of the risk stratification tool and the feedback platform.
All the pilot teams had designated ‘digital champions’, of which there were at least two per
team. They were supported by the predictive analytics Clinical Lead to have a more in-depth
understanding of the project and were given more responsibilities from being the first line of
contact when there were any issues to allocating cases to individual clinicians. The tangible
presence of a champion who could respond to queries and encourage uptake and

4
engagement was established to create a sense of partnership and ownership in the project,
on a localised team level.
The Risk Prediction Tool was introduced to each team via training sessions; these were
provided for all clinicians who would be involved in the project. The sessions included a
presentation on the project, explaining the project aims, how the prediction tool works and
what is expected from them in using the tool. The feedback platform was also presented to
them in these sessions with a demonstration on how to use it and the opportunity to
practice using it provided. They were also given access to a shared drive which contained all
the training resources, including an electronic guide and background information. This
included contact information on how to liaise with the project team and especially the
clinical lead for support on using the platform.
Prior to the start of the pilot study, once all the teams were trained, the feedback platform
was tested out with the teams to ensure any technical difficulties or problems were
addressed. This allowed for some modifications based on the feedback received from the
clinicians before the start of the study.
Service User Engagement also formed an integral part of the project with drop-in sessions
arranged prior to implementation and ongoing throughout the project. Service users were
provided with information on the project including the intended benefits and improvements
it could generate for their care. They were updated on the progress of the project and
feedback was collated through questionnaires and group discussion. Any issues or
suggestions were addressed and used to inform the project when appropriate. Please see
Annex 4 for further information.

5
2. Methodology
2.1. Aim of the Study
The implementation of the Risk Prediction Tool was accompanied by a formative evaluation
that assessed the clinicians’ perception of usefulness and value of the tool as a clinical
decision support tool in identifying people who are at risk of experiencing a mental health
crisis. The evaluation also aimed to explore their views on the implementation of the Risk
Prediction Tool.
2.2. Study Design and Participants
The pilot study was a mixed method study in four community mental health teams (CMHTs)
in Birmingham and Solihull Mental Health NHS Foundation Trust. The CMHTs were chosen
based on their capacity to adopt the Risk Prediction Tool although consideration was also
taken in ensuring the pilot teams covered a variety of demographic and variance in caseload.
The pilot teams were Erdington and Kingstanding CMHT, Warstock Lane CMHT, Sutton
CMHT and Orsborn House CMHT (Ladywood and Handsworth team). Clinicians (or
participants) were recruited from each CMHT to take part in the pilot study to test the
outputs of the Risk Prediction Tool as a decision support tool in identifying patients at risk of
mental health crisis.
The Risk Prediction Model was run by the Trust’s Information Team on the Trust’s patient
administration data every two weeks. The predictive model output was further stratified
using the risk stratification tool and ranked from highest to lowest risk of crisis. The top 25
patients that were identified as being at high risk of a mental health crisis from each CMHT’s
list were then selected and presented on the feedback platform. The model outputs
contained a list of patient names, patient identifier, risk score and relevant clinical and
demographic information (Annex 3).
The clinical lead would then conduct a check of the list of patients to ensure that the data
being presented was up to date; they would then contact the designated digital champions
and managers/clinical leads of the relevant team to inform them that the list was available to
view. The patients on the list are allocated to clinicians by the digital champions and/or
managers and were then given two weeks to complete the feedback on the platform. Upon
reviewing the list they would complete F1 feedback form where they provide their estimation
of the patient’s risk level and specify their intended action as result of the prediction. A week
after the initial review, clinicians were asked to record, on the F2 feedback forms, if they had
changed their assessment of the patient’s risk level upon further assessment and feedback
on how useful the information provided to them was in either preventing a crisis or
identifying a patient deteriorating to provide support or in managing their caseload priority.
See Annex 5 for more information.

6
In addition, some clinicians were selected for follow up interviews to gain a better
understanding of the usefulness of the tool and its effect on clinical decision making and to
gauge their perspective on the implementation of the tool. The semi-structured interviews
featured questions on perception of the participants on the use of the tool. In particular
these were:
- Views on implementation and training
- Usefulness of the Risk Prediction Tool in practice
- Facilitators and Barriers to the use of the tool
7
3. Results
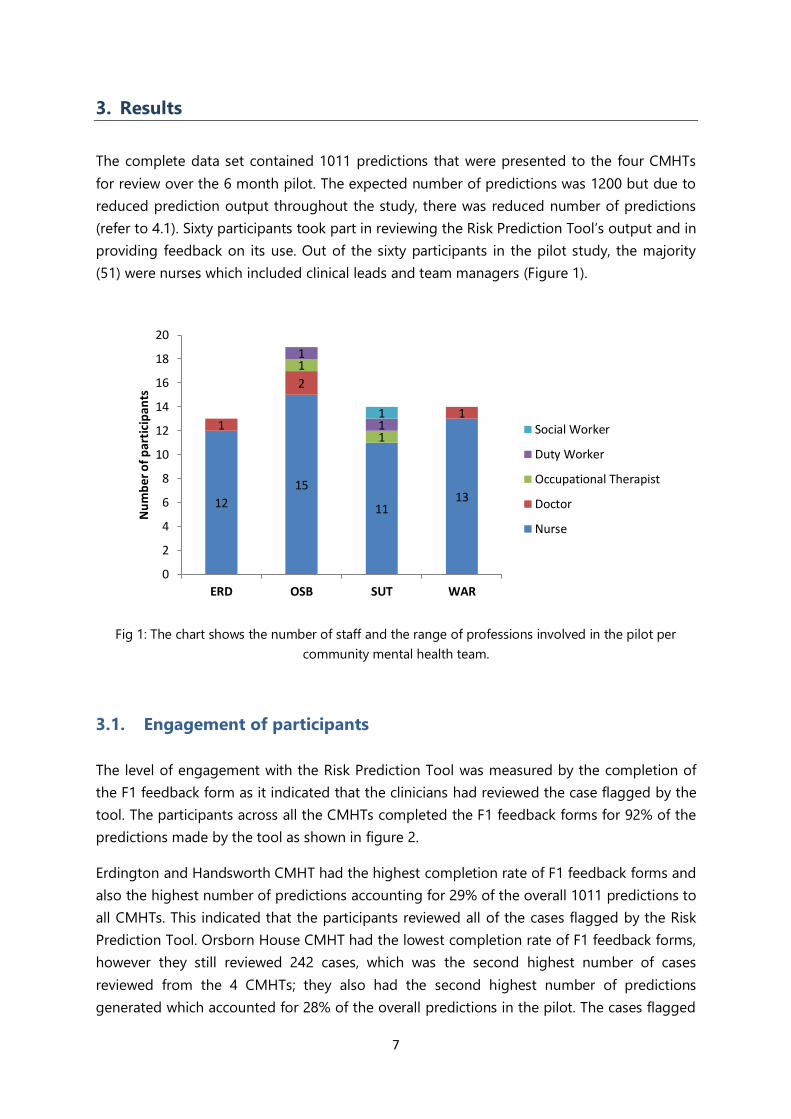
The complete data set contained 1011 predictions that were presented to the four CMHTs
for review over the 6 month pilot. The expected number of predictions was 1200 but due to
reduced prediction output throughout the study, there was reduced number of predictions
(refer to 4.1). Sixty participants took part in reviewing the Risk Prediction Tool’s output and in
providing feedback on its use. Out of the sixty participants in the pilot study, the majority
(51) were nurses which included clinical leads and team managers (Figure 1).
Fig 1: The chart shows the number of staff and the range of professions involved in the pilot per
community mental health team.
3.1. Engagement of participants
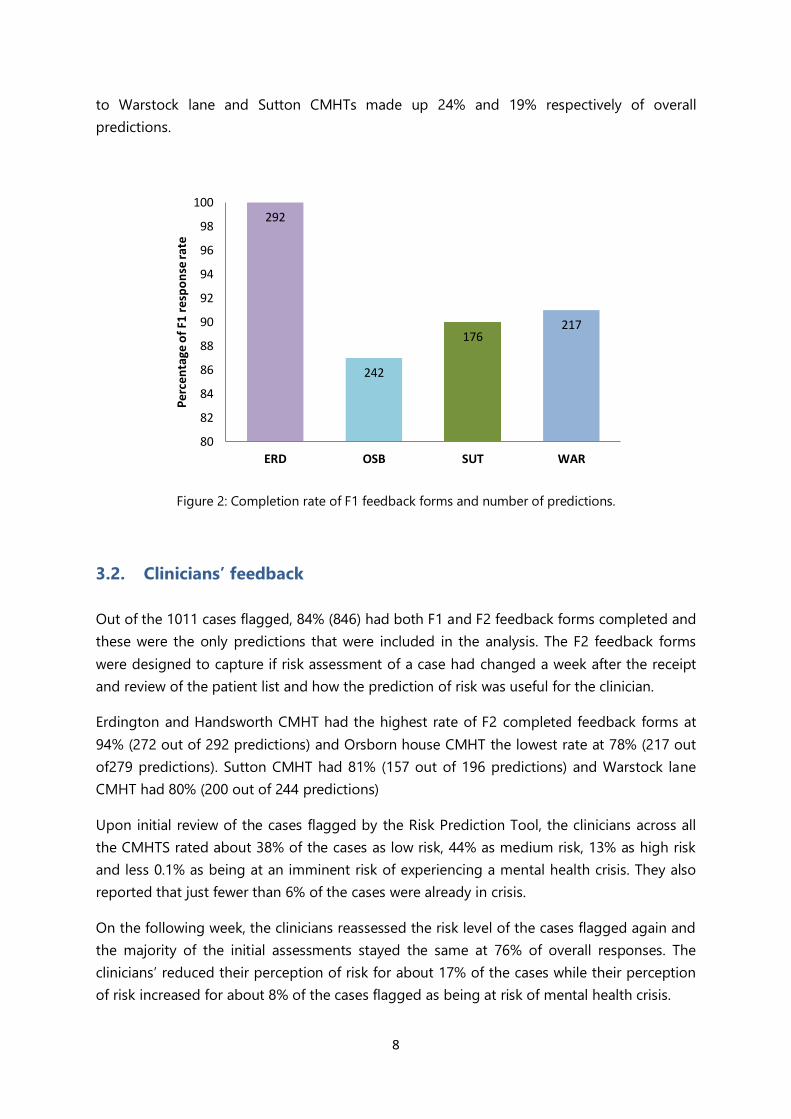
The level of engagement with the Risk Prediction Tool was measured by the completion of
the F1 feedback form as it indicated that the clinicians had reviewed the case flagged by the
tool. The participants across all the CMHTs completed the F1 feedback forms for 92% of the
predictions made by the tool as shown in figure 2.
Erdington and Handsworth CMHT had the highest completion rate of F1 feedback forms and
also the highest number of predictions accounting for 29% of the overall 1011 predictions to
all CMHTs. This indicated that the participants reviewed all of the cases flagged by the Risk
Prediction Tool. Orsborn House CMHT had the lowest completion rate of F1 feedback forms,
however they still reviewed 242 cases, which was the second highest number of cases
reviewed from the 4 CMHTs; they also had the second highest number of predictions
generated which accounted for 28% of the overall predictions in the pilot. The cases flagged
12
15
1113
1
2
1
1
1
1
11
0
2
4
6
8
10
12
14
16
18
20
ERD OSB SUT WAR
Nu
mb
er o
f p
arti
cip
ants
Social Worker
Duty Worker
Occupational Therapist
Doctor
Nurse
8
to Warstock lane and Sutton CMHTs made up 24% and 19% respectively of overall
predictions.
Figure 2: Completion rate of F1 feedback forms and number of predictions.
3.2. Clinicians’ feedback
Out of the 1011 cases flagged, 84% (846) had both F1 and F2 feedback forms completed and
these were the only predictions that were included in the analysis. The F2 feedback forms
were designed to capture if risk assessment of a case had changed a week after the receipt
and review of the patient list and how the prediction of risk was useful for the clinician.
Erdington and Handsworth CMHT had the highest rate of F2 completed feedback forms at
94% (272 out of 292 predictions) and Orsborn house CMHT the lowest rate at 78% (217 out
of279 predictions). Sutton CMHT had 81% (157 out of 196 predictions) and Warstock lane
CMHT had 80% (200 out of 244 predictions)
Upon initial review of the cases flagged by the Risk Prediction Tool, the clinicians across all
the CMHTS rated about 38% of the cases as low risk, 44% as medium risk, 13% as high risk
and less 0.1% as being at an imminent risk of experiencing a mental health crisis. They also
reported that just fewer than 6% of the cases were already in crisis.
On the following week, the clinicians reassessed the risk level of the cases flagged again and
the majority of the initial assessments stayed the same at 76% of overall responses. The
clinicians’ reduced their perception of risk for about 17% of the cases while their perception
of risk increased for about 8% of the cases flagged as being at risk of mental health crisis.
292
242
176217
80
82
84
86
88
90
92
94
96
98
100
ERD OSB SUT WAR
Pe
rce
nta
ge o
f F1
re
spo
nse
rate

9
Figure 3: The graph shows the responses by clinicians given on whether they intend on taking action
based on a prediction and the type of action.
As shown in figure 3, the clinicians across the entire pilot CMHTs only disagreed an average
of 7% of the predictions presented indicating that patient was at risk of going into crisis. The
disagreement with the prediction varied across the CMHTs with Warstock lane CMHT
demonstrating the highest prevalence at 12% and Sutton CMHT the lowest, whereby they
only disagreed with the crisis prediction on 3% of all cases presented to them.
Upon reviewing the cases flagged by the tool, the clinicians on average responded that they
would make contact, based on the prediction, either by telephone or face to face in about
5% and 8% of the cases respectively. In the majority of the cases, it was considered that no
further action was required as the clinicians deduced that the risk was already being
managed and/or that a recent contact was made that would address the risk.
3% 6% 6% 4%4%
15%
6% 5%
16%
11%
23%13%
69%63%
61% 66%
8%
4%
3%
12%
0
50
100
150
200
250
300
ERD OSB SUT WAR
Nu
mb
er
of
case
s
No – do not agree with assessment
No – risk already acknowledged and being managed
No – contact made recently –within 7 days
Yes – contact to be made Face to Face
Yes – contact to be made by Telephone

10
Figure 4: The graph show the responses provided by clinicians on how the Risk Prediction Tool’s
output was useful in practice.
When asked how the information provided by the Risk Prediction Tool was useful in practice
clinicians responded that they used it to prevent a patient experiencing a crisis in 19% of the
cases presented and identified the deterioration in a patient’s condition in 17% of the cases
as shown in figure 4. Clinicians reported that the Risk Prediction Tool’s output was used to
manage caseload priorities in 28% of the cases flagged. On average across all the CMHTs,
the clinicians reported that they did not find value in the information provided by the Risk
Prediction Tool in 36% of the predictions, however, when comparing responses between the
teams, Warstock Lane CMHT reported that they did not find the information useful in 71% of
their cases compared to25%, 27%, and 29% of the other CMHTs (Figure 4). Overall, the
clinicians found the Risk Prediction Tool’s output useful in some manner in about 64% of the
cases flagged.
3.3. Qualitative views on implementation and use of the Predictive Risk
Stratification Model
There were five respondents in the qualitative interviews from three out of the four CMHTs
which included a range of professions such as managers, doctors and nurses. The interviews
were held 5 months after the start of the pilot to allow sufficient exposure of the participants
to the Risk Predictive Tool.
0%
10%
20%
30%
40%
50%
60%
70%
80%
ERD OSB SUT WAR
Pe
rce
nta
ge o
f ca
ses
Trying to prevent thepatient from experiencingan imminent crisis
Identifying deterioration in the patient’s condition
Managing caseloadpriorities
Nothing – did not find this information useful

11
Five themes were identified: 1) Views on implementation and the use of the Risk Predictive
Tool; 2) How the Risk Predictive Tool affected the work of the participants and how they
responded to patient needs; 3) Perceived relevance and value of the Risk Predictive Tool; 4)
Facilitators and barriers affecting the use of the Risk Predictive Tool; 5) Suggestions for ways
to improve the Risk Predictive Tool. These themes are elaborated below and evidenced by
key quotations embedded within the text.
Views on implementation and the use of the Risk Predictive Tool
All the respondents were in consensus that the implementation including the training
received on the use of the Risk Prediction Tool was very well executed and useful. The tool
was straightforward to use and easier to use than they expected.
“It was very useful and I had no problems after I left the (training) in terms of using it as I felt
very confident and able to use it”
“The training didn’t take long at all and it was quick, informative and much easier to do than I
assumed it was going to be”
“It was very helpful and I had no problems after I left there in terms of doing it as I felt very
confident and able to use it”
The feedback platform was perceived to be easy to use and navigate by all respondents with
some respondents mentioning that there were some early technical difficulties in using its
such as the system (SharePoint) disabling, information not being saved, inability to open a
shared document due to multiple logins or misunderstanding on how to correctly open the
feedback platform by few individuals. However, they felt that these issues were addressed
promptly when mentioned to the project’s clinical lead and the project manager. A
respondent mentioned that it helped that participants knew who to contact in times of need
and that they had direct access to a clinical lead and champions for assistance and support.
“There were a few kind of small technical issues with it…whilst things got up and running but
they were quickly resolved and it was easy to use”
“The tool is not complicated which is good as it would put people off it if there was too much to
do”
How the Risk Predictive Tool affected the work of the participants and how they
responded to patient needs
Respondents said they used the tool as an additional resource in their workflow and that it
had not required extensive additional work in its current form. However, they believed that if
the workload or number of cases being flagged increased, this may be harder to manage.
“It is manageable as it is but if the cases reviewed increased from the four every two weeks,
people would be annoyed and would likely have less time to spend on cases”
12
Others welcomed the increase in the cases flagged every two weeks but believed more
clinicians from other disciplines needed to participate in the project to allow for distribution
of workload.
“If that would be increased, I think that is fine but other disciplines need to be involved in this,
it doesn’t need to be just nurses but doctors, psychologist, OTs, Students and support workers. I
think a lot more people can be a part for this and they are not”
Most of the respondents mentioned that the feedback platform was very easy to navigate
and that the scoring criteria and the information given was useful but mainly to highlight
some key points and that they still needed to access the notes to get a better understanding
of the situation. Additionally, almost all of the respondents didn’t attribute much value to the
overall risk score received by an individual patient in assessing their risk.
“If the scoring criteria weren’t displayed, we have to go into different places to draw that
information and it is drawn together for you so it saves time when assessing a patient”
The respondents said that the tool had not influenced how they perceived risk but that it had
highlighted interesting features in some cases that they wouldn’t have known about or cases
that would have gone unnoticed.
“It has not changed how I view risk and I don’t think more of about risk, as I think of risk all the
time, It is part of my job to have that mind set where as some of the other roles may feel
differently, such as in a care coordinators role but as a clinical lead I am continuously thinking
about how to reduce the risk to someone. I think we would lose, if we didn’t have this in place,
a lot of people who would slip through the net and get lost in the system”
Respondents described types of actions they took in response to a patient being flagged by
the Risk Predictive Tool. They contacted many patients by telephone, they made home visits,
rearranged visits, brought forward outpatient appointments and/or reviewed patients in
multidisciplinary meetings. Some of the examples included:
“There has been a few times when the patients that come up have been a bit of a surprise and
then I thought I should be more alert to them and making sure I see them a bit more regularly
or see them as soon as I can by moving appointments”
“Sometimes I have asked GPs to give them a telephone call or taken cases to MDTs for
discussion… which is always a good place to put them in as medics will bring the outpatients
appointments forward or put them on the care coordinators waiting list which is positive”
One respondent mentioned that there were instances when they didn’t understand after
reviewing cases why some of the patients were on the list therefore they didn’t follow up and
the patient subsequently went into crisis which made them realise that they needed to be
more thorough in their reviewing process.

13
“There was a patient that was allocated to me that is in hospital now but when I reviewed her, I
didn’t understand why she was on there so did not act on this but on my next follow up with
her, I had to call an ambulance”
“There has been many times when patients have been missed in the service, maybe they didn’t
turn up for their doctors appointment and another appointment wasn’t sent out or when there
has been contact with our duty team where there were signs of relapse but this hasn’t been
picked up on or escalated, the tool is very helpful to identify these cases which would have
otherwise been followed up on”
Perceived relevance and value of the Risk Predictive Tool
Some respondents mentioned that the information presented in the feedback platform could
sometimes be out of date and that they had to refer back to the patient’s notes to get more
up to date information of patient’s status.
“The scoring criteria used pulls information that can sometimes be out of date”
“The scoring criteria hasn’t always been helpful as it hasn’t always been accurate and I know
sometimes that is the only thing available to use but sometimes it is a patient you know and
you know that there has been other progress notes…but obviously there is the ability to check
patient notes (RiO) if you wanted to check further”
The respondents said that the patients being flagged included a lot of patients already
having continued contact for whom they were aware of them being high risk based on their
own clinical judgement and in those instances they didn’t find much value in it. However,
some questioned how it should be used, whether it was more suited to bringing up patients
on care support as they tend to know the risk level for patients on care coordination.
“We have found a lot of value in some of the cases…but a lot of the cases we are coming
across, we know about especially those with care coordinators as that care coordinator would
be seeing them regularly and will have very up to date information on what is going on … so
the tool telling us they are at risk doesn’t particularly add any value…the people most at risk
are the ones that aren’t having any contact with any service”
“It highlights people that would otherwise, in my opinion, fall through the net and get lost in
the system”
“The tool is more useful for patients not under care coordination as patients on care support
tend to see a doctor every 3 to 4 months and in between they do not see anyone and we are
relying on them making contact if they are unwell”
“For patients on CPA, the nurses and CPNs tend to know if their patients are bubbling and
becoming unwell and this is more beneficial for care support patients that don’t get as much of

14
a look in as these CPA patients who are seen every two weeks or so. The nurses are good as
they look at the notes and they know if they presented somewhere or they have something
happen in their lives that could put them at risk of crisis but care support patients see medics
every 6 months if they are lucky and often longer so I think it would be more beneficial for
them”
Overall, the respondents said that they believed the Risk Prediction Tool added value as, they
believed, it identified patients that otherwise would have been lost in the system and that it
sometimes acted as a reminder for clinicians with busy schedules. It also identifies any cases
that have been lost due to miscommunication or gaps in the system.
“I think it is good in terms of a manager’s perspective, it helps care coordinators look more
thoroughly at their cases and as you know with busy jobs, it is easy to forget things at times
and it acts as a reminder , such as so and so’s anniversary is coming up, so I probably should
visit them next week. It just makes people more on the ball”
“There was a patient of mine that came up and I didn’t know she had been on the home
treatment team and there wasn’t an appointment in place for her because we weren’t alerted
that she had been discharged”
“Sometimes even if the information of a patient should be related to us there sometimes are
communication issues because people are busy… so we may lose that one person in crisis and
nobody remembered to tell another person about it…this is sometimes picked up by the tool”
All respondents believed that the tool should be embedded in their everyday working
practice and expressed that they would like the use of the tool to carry on as business as
usual.
“I definitely think it should be incorporated as part of our normal working practice because I
think it has shown, and everyone I have looked at I found informative, and of course there are
some that I think I know this person and they won’t go into crisis and they will be fine but
others where I have reviewed and I thought oh my goodness, I can’t believe this person has
never had any contact and we would never have known and so I believe that it should be used
in everyday practice”
“The tool is useful in flagging up people who need help that have gone missed or unnoticed or
haven’t made contact themselves before going into crisis”
Facilitators and barriers affecting the use of the tool
Most respondents mentioned that the ability to have a digital champion and a clinical lead
for the project helped support the participants and aided in the engagement with the tool as
concerns were directly addressed.

15
“It was helpful to have (clinical lead) to better explain things that we didn’t understand and
also to relay issues to when there were issues with the system like logging in and saving
responses”
“The training was very helpful and then having the (clinical lead) was helpful as he is on site at
least once or twice a week to help people if they need it so if there has been any questions I can
ask him then or email him and he will get back to me quickly so that kind of resolved any
issues quickly”
Some respondents voiced concerns that they had during the initial phases of the project
about where the responsibility of using the tool lies and they believe if this was going to be
rolled out needs to be addressed.
“I think initially it was just what if we don’t call the patient that we have been allocated to... if
we don’t see or speak to them and if anything happened to them, whether that would be seen
as the fault of the clinician because that was one of the patients we were looking at that week
and if this is rolled out, and not just a trial, that was going be like an everyday practice worry”
One concern raised was the time constraints of the participants to be able to fully review all
the patients, especially new patients that are not on their existing caseload as it identified
unmet need that would need to be addressed in addition to their workload.
“I know of care coordinators who have struggled to do it just because of our time constraints
and if the patient is somebody you are already care coordinating, they are on your case load
anyway which is fine but if it is not, then you end up having to make calls to people or seeing
them face to face and following up which takes a lot of time”
“I do find value in it but I will admit that sometimes when I am really busy because of the time
frame to get things done I feel like I am rushing it more than other times so probably not
getting as much value of it when I’m rushing it. But when I can take the time, not that it’s very
time consuming, it’s just the nature of the job that it’s so busy sometimes you can’t even use
the toilet, which is typical. So it is not that I feel this is time consuming in any way and it is very
easy to use. But when I use it properly I find it very beneficial”
Respondents also mentioned that the tool flagged a lot of patients who were already in
crisis, either in home treatment or in hospital. The concern was raised that this might cause
clinicians to be “dismissive of it (the tool)” which meant that they were less inclined to follow
up on flagged patients in the future.
Suggestions for ways to improve the Risk Predictive Tool in practice
The respondents suggested some ways that they believed would be useful in addressing the
barriers of a lack of capacity and integration to workflow. There was a fairly consistent theme

16
running through the responses that the future use of the Risk Prediction Tool would depend
on time capacity within their practice and being able to access resources and support to
meet identified needs.
“We have a dashboard that alerts us if our patients have had contact with out of hours or
haven’t been seen in 28 days and that sort of thing, I don’t know whether it would be possible
for something to be on there to alert you that within the predictive analytics section, that your
patient is showing up with a high score or something like that”
“Maybe having a nominated person have a look at the list and assess it initially and then go to
the relevant person such as the care coordinator and say this person has been flagged and may
need reviewing”
“I think it is fine to be incorporated in every day practice but other disciplines need to be
involved in this as it doesn’t need to be just nurses but doctors, psychologists, occupational
therapists, student and support workers too must be a part of this project”
“There should be a way to remove patients that we are already aware about, either if they are
already in crisis or we have put in place interventions as there is not much we can do about
those cases”

17
4. Discussion and Conclusions
Clinician engagement
The F1 feedback form response rate indicates that the clinicians found value in maintaining
the usage of the Risk Prediction Tool’s output by reviewing the cases flagged. While there
was a certain level of variability in the usage level of the tool’s output between CMHTs, the
overall average across all teams was still very high at 92% which demonstrates that the
clinicians accepted the use of the tool in their clinical practice. However, as stated this does
not indicate that they agreed with the prediction of individual cases presented, more the
buy-in of the use of the tool in assessing individual cases flagged by the Risk Prediction Tool.
The variability in usage between the CMHTs is unlikely to be a result of the implementation
of the Risk Prediction Tool given that each team received the same input of training,
technical support and project resources. This shows that the difference with engagement is
more likely due to internal factors that could be studied further to inform future
implementations.
The qualitative component of the project also highlighted that the clinicians were engaged in
using the tool despite their time constraints and increasing workloads. Engagement with the
tool was affected during some weeks due to high levels of annual leave and the Christmas
period but the teams still tried to review most of the cases and provide feedback.
Risk Perception
The clinicians found 13% of flagged patients at high risk of experiencing a mental health
crisis while about 6% of flagged patients already being in crisis. The majority of the cases
flagged were classed as low risk or medium risk with only 6% of those cases where the
perception of risk was increased. This indicates that the risk prediction model could have
picked up on risk markers that clinicians didn’t initially capture from reviewing a case but
that was highlighted upon further review with the support of the clinical decision support
tool. Additionally, this could have been due to further interaction with the patients which
provided more information. This would also apply to the cases where perception of risk level
was decreased.
It is important to consider how clinicians will interact with the tool when integrated into
routine practice and whether clinicians revisit cases or decide on what action to take based
on their initial assessment. The responses show that clinicians in general do not tend to
change their original assessment of risk as a result of using the tool and therefore it would
be more clinically effective to review flagged cases once. Furthermore, all the clinicians
interviewed responded that the introduction of the tool has not changed how they perceive
or assess risk but that it had been useful in highlighting new cases or in helping to prioritise
existing caseloads.

18
Usefulness of Risk Prediction Model
Clinicians found the information provided by the Risk Prediction Tool useful in either
preventing a crisis, identifying a patient’s condition deteriorating or managing caseload
priorities in about 64% of the cases flagged by the algorithm across all the CMHTs. This is
even higher at over 70% in three out of the four CMHTs with Erdington and Handsworth at
75%. This demonstrates that in the majority of the cases, the clinicians found usefulness in
the Risk Prediction Tool’s output which is also reflected in the continuing engagement of
clinicians with the Risk Prediction Tool in their practice.
While about 36% of the completed responses indicated that the clinicians did not find value
in the information provided, it is important to note that the clinicians only disagreed with 7%
of the prediction. This is very positive as it indicates that they did agree with the risk flagged
by the Risk Prediction Tool but that it did not add value to their working practice for other
reasons besides disagreeing with the prediction. For instance, one interviewee suggested
that the clinicians had sometimes already identified the risk of a patient in their caseload and
put measures in place to mitigate the risk so the information did not add any new insight.
This was also reflected in the feedback received where 65% of overall predictions, the
clinicians responded that they didn’t need to take action as the risk was already being
managed.
The high number of predictions where clinicians have responded that they are proactively
managing the risk is backed up by statements made by participants in the interviews. These
responses indicate that the Risk Prediction Tool is more effective to the patients on care
support as care coordinators tend to be more aware of when patients on their caseload
(CPA). However, some clinicians did indicate that it was useful as a reminder to review some
cases on their caseload and therefore, it is important to consider how the predictions are
distributed to clinicians and whether the alerting method should be the same for all patients.
This could be further explored with the clinicians to develop a more informed and
collaborative output mechanism that is both efficient and useful to clinicians in their practice.
Additionally, the clinicians who were interviewed found value in most of the information
provided by the tool, whether it was to identify at risk patients that were not being picked
up, to encourage them to intervene with identified high risk patients sooner or as a case
management tool to prioritise some of their cases as flagged by the tool. They also
mentioned that while it is very useful that there were concerns that the sometimes the teams
did not have the time to review cases thoroughly or did not have the resources to respond
efficiently. They believed having more disciplines and team members involved in using the
tool would result in a collaborative response that was not resource intensive. Finally, these
clinicians wanted to better understand the accuracy of the tool in preventing crisis in clinical
practice and how this would translate into their own working practice.

19
4.1. Strengths and limitations of study
The introduction of the project and the tool to the teams was conducted gradually and in
collaboration with team managers and digital champions. This approach ensured ownership
of the project and encouraged participation which was integral to the engagement in the
pilot study. Several digital champions were recruited to drive implementation of the tool to
advocate the work of the project and to provide localised support within the teams.
The study looked at the acceptability of the tool by CMHTs in their clinical practice only and
did not look at whether the clinicians agreed with the prediction. Identifying this would be
helpful to allow further analysis of their perception of the information provided and to
understand other factors that may influence how they use the information.
During the course of the pilot, there was a gradual decline in the number of predictions
generated for each 14 day cycle. The cause of this was traced back to July 2018 when there
was a coding error accidentally introduced. This became more impactful over time and
resulted in a reduced number of crises being predicted over the course of the pilot. This was
identified and resolved but not until mid-way through the pilot study. While the model was
still generating numbers of valid predictions for clinical teams to continue to use the tool,
this could have had an impact on their perception of its usefulness as the output generated
included patients already in crisis which affected the value they found in the information
provided. The issue of flagging patients already in crisis was also highlighted by some
clinicians in the qualitative component of the study.
4.2. Conclusions
This evaluation sought to assess the clinicians’ perception on the usefulness of the Risk
Prediction Tool including implementation, engagement and their use of the tool. We
conclude that the clinicians in the CMHTs included in the pilot study found the Risk
Prediction Tool beneficial and felt that it fitted into their workflows and clinical practice. They
also appear to have found value in receiving the predictions to improve their proactive
engagement with patients at risk of experiencing mental health crisis. This clearly shows
potential that this predictive clinical decision support tool could become a part of routine
clinical care and can be used as a resource by clinicians in order to identify which of their
patients are at risk of experiencing an imminent mental health crisis or to identify patients
who may benefit from case management/intervention to avoid them going into crisis.
To aid better proactive management of cases, it is recommended that wider ranges
healthcare professionals are engaged in the project across the CMHTs. The process of
iterative implementation prior to full rollout of the Risk Prediction Tool to teams was
identified to enable favourable clinical engagement in addition the clinical lead and digital
champions to promote a seamless integration of the digital tool into practice.

20
References
1. Paton, F., Wright, K., Ayre, N., Dare, C., Johnson, S., Lloyd-Evans, B., & Meader, N.
(2016). Improving outcomes for people in mental health crisis: a rapid synthesis of
the evidence for available models of care. Health Technologyl Assessment, 20(3).
2. Tianqi Chen and Carlos Guestrin (2016). XGBoost: A Scalable Tree Boosting System.
In Proceedings of the 22nd ACM SIGKDD International Conference on Knowledge
Discovery and Data Mining (KDD '16). ACM, New York, NY, USA, 785-794.

21
Annexes
Annex 1: Definition of Mental Health Crisis
Annex 2: Retrospective testing of the risk prediction model
Annex 3: Risk Stratification Tool development and feedback platform example
Annex 4: Service User Engagement Report
Annex 5: Feedback Questionnaire

22

1
Annex 1 – Definition of Mental Health Crisis
A mental health ‘Crisis & Acute Spell’ is a period of time in which a service user is considered to
be in ongoing crisis or acute psychiatric need based on the services he or she has contact with.
Each Spell encompasses an initial crisis presentation and all subsequent activity until the service
user’s level of need has ‘stabilised’ at a level below that requiring support from crisis or acute
services. The Spell’s end is defined by the start of a period with no acute or crisis mental health
service activity for at least 28 days.
‘Crisis & Acute Spells’ will always start with a ‘Crisis Episode’, and may include multiple ‘Crisis
Episodes’ if there are repeat new presentations to crisis services before the person has had a 28-
day period without any acute or crisis activity.
Beginning of a ‘Crisis & Acute Spell’ – the initial crisis event based on presentation to one of the
following crisis services:
1. Liaison Psychiatry assessment in A&E and Medical Assessment Units
2. Home Treatment Team assessment (to become/include Crisis Teams)
3. Street Triage Referral
4. Place of Safety referral
5. Psychiatric Decision Unit referral
6. Bed management referral
7. Inpatient admission (excluding Neuropsychiatry)
8. Out of area inpatient admission
Continuation of a ‘Crisis & Acute Spell’ – further crisis/acute psychiatric care as follows
1. Liaison Psychiatry assessments in Accident and Emergency and Medical Assessment
Units
2. Home Treatment Team contacts during acute phase of a person’s care
3. Street Triage referrals – each referral is counted as a crisis event
4. Place of Safety admissions – all time spent on a unit
5. Psychiatric Decision Unit admission – all time spent on a unit
6. Bed management – all time open to bed management
7. Inpatient admissions – all time in inpatient service
8. Out of area inpatient admissions – all time in inpatient service
End of a ‘Crisis & Acute Spell’ – no further crisis/acute psychiatric care:
1. When no further crisis/acute psychiatric care is provided for more than 28 days, then the
Spell is considered to have ended with the last recorded crisis/acute care activity.
1
Annex 2: Predictive Analytics – Retrospective Sampling Exercise Findings
Predictive Work Stream Overview
BSMHFT’s Test Bed programme is focusing in 2018-19 on further refinement and testing of a
predictive algorithm that is able to a) identify patients at risk of experiencing a crisis in the near
future and b) thereby help staff reduce the rate of presentation at urgent care. In order to realise
the objectives of this work stream, the Trust partnered with Telefonica Alpha to develop a
predictive model using historical Trust data spanning five years.
It was envisaged that Telefonica would produce an algorithm that outputs a list of service users
at risk of going into crisis in a given period. The Information team would then make a risk
stratified caseload list (based on risk of presenting to our urgent care services) available to our
Community Mental Health Teams (CMHT’s) on a regular basis. This list is intended to be used as
a decision support tool (like how Risk Stratification is used in Primary Care) to help CMHT’s
prioritise their caseload. Over the longer term we would hope to see this have an impact on
reducing the number of patient presenting in to a crisis service.
Progress since January 2018
Telefonica Alpha completed the latest iteration of the algorithm in January of this year with a
view to the Trust testing the output. The main objective was for the Trust to engage with the
host clinical teams to determine the algorithm’s practical usefulness, and to feedback on any
features that were either missing or could be used differently. Prior to this, it was agreed at the
Clinical Reference Group (CRG) in 2017 that the Community Mental Health Teams (CMHTs) were
the most appropriate setting to host the predictive algorithm as the patients cared for by these
teams were, generally speaking, not currently experiencing a mental health crisis, and were
usually living at home, and seen on a regular basis by their care coordinator. The Trust operates
13 such Community Mental Health teams, but it was agreed with NHS England that during the
pilot phase (June 2018 - March 2019), we would operate the algorithm in 6 teams in a phased
approach. The results would then be evaluated by comparing the rate of crises in the 6 pilot
CMHTs (cases) against the remaining 7 CMHTs (controls).
In anticipation of the formal pilot phase in June 2018, it was agreed within the project team to
pre-pilot the algorithm within 2 teams (Warstock Lane CMHT and Erdington & Kingstanding
CMHT). The purpose of this pre-pilot was;
1. To ensure that there is viability to continue to the Pilot phase
2. To gauge the effectiveness of the algorithm in its current form
3. To consider whether it is operationally useful i.e. does it flag service users that were not
already on the team’s radar.

2
4. To use this opportunity to identify any additional features that could be included in
future iterations.
The Trust has also taken the opportunity to investigate what the impact might be of providing
CMHTs with a more limited subset of the cases predicted by the full model, if applying further
filtering to try and minimise ‘false positives’(based on “step change criteria”, more detail below) .
The Algorithm
A set of predictions were generated for the weeks leading up to [and including] the first week of
January 2018, based on predicting whether service users were likely to experience a crisis in the
following 4 weeks. The chosen machine learning methods for the algorithm (Long Short Term
Memory (LSTM) and XGBoost) are not able to determine the responsible risk indicators for a
given service user’s risk profile. However, the modelling process generates an ordered list of the
most predictive indicators (“features”) – in order of influence (top 22 included in Appendix 1) –
A “feature” is a characteristic that relates to a service user and can be identified within the
anonymised dataset that has been made available for model development. In the context of the
algorithm, the features were chosen based on analysis of how well they correlate with crisis
activity.
The algorithm achieved very high levels of predictive power in distinguishing between people
likely to experience a crisis in the next 4 weeks and those not. However, there remains a concern
that accurate predictions are substantially outweighed by ‘false positives’, and that this may limit
the model’s practical application. The Trust Informatics team have therefore been studying the
outputs over the last few months to understand the predictions in more detail, and also where
possible to “group” service users based on diagnoses and other factors to see if that has any
bearing on the predictive strength. “step change” features was explored following discussions
with CMHTs in December 2017 and January 2018to try and stratify or segment service users
based on recurrent themes identified when reviewing a list of people predicted to go into crisis
(Appendix 2).
Sampling Method
The sample study used the latest algorithm output (prediction date: 31 Dec 2017), and limited
the cohort to service users that were on the selected two community team caseloads on the
prediction date. The samples were limited to 30 Service users per team (total = 60) in agreement
with the respective service managers of both teams that agreed to take part in this study. Table
1 shows how the sample number corresponds with the total predictions for each team.

3
Table 1.
Erdington & Kingstanding Warstock Lane
Total
Predicted 149 79
Sample 30 30
% of Total 20% 38%
The samples were not chosen completely at random. Fifteen out of the thirty for each team were
chosen at random from within the full set of predictions, but up to a further fifteen were chosen
based on a step change criteria. As neither team had fifteen such service users that met these
criteria, the shortfall was made up of service users that did not have a contact with the
community team in the 28 days following the prediction date, to try and ensure that there were
at least some records in the samples where the course of events without clinical intervention
following the prediction could be reviewed. This resulted in the following sample breakdown:
Analysis
Once the cohorts were identified, the teams were contacted and 2-3 meetings were arranged
with each team to go through the list, and took place between 8th and 25th May 2018. A set of
questions were identified and signed off with approvals from the Trust Information Team lead,
the participating community team managers and respective service managers, as well as
Telefonica Alpha. The questions have been included in Appendix 3.
Summary of Findings
In summary, 59 out of 60 service users were eligible. 1 was excluded because there were no
notes on the service user as he had recently been transferred over from a young adults’ service
provided by another Trust.
Of the 59, more than half were deemed to be a reasonable inclusion (n=34) – i.e. the clinical
team agreed that the person was at high risk of crisis at the time of the prediction; and in 13 of
these cases their inclusion was also deemed to be adding a new insight or at least serving as a
new prompt for the CMHT to intervene.
CMHT Adult Warstock Lane
a. ‘Step Up’ Cohort - 9 Service Users
b. ‘Full Sample’ Cohort – 21 Service Users
a. Random – 16
b. No Contact Group - 5
Erdington & Kingstanding
a. ‘Step Up’ Cohort - 10 Service Users
b. ‘Full Sample’ Cohort – 20 Service Users
a. Random – 15
b. No Contact Group – 5

4
11 of the people overall in the sample actually went on to use crisis services in the following 4
weeks, of which all were recognised by the CPNs as being a reasonable inclusion on the list, and
4/11 were also deemed to be a new insight. Of those that were not deemed to be a new insight
(n=7), CPNs acknowledged in 4 instances that a different intervention may have averted the
crisis. On the remaining 3 instances, they noted that either an intervention would not have
helped (n=1), there was no engagement (n=1) or that there was regular contact and the service
user has presented well (n=1).
25/59 service users were not considered to be a reasonable inclusion on the list. The main
reasons/feedback for these includes:
- The clinical notes suggest the service user had been presenting well
- There was vulnerability (e.g. severe post-natal depression), but that did not equate to
potential crisis where there is a care coordinator involved, and regular contact.
- Discharge from HTT should not itself be an indicator for a potential crisis. The service
user may be risky, but if the follow up procedures are adhered to, this should by
definition be the end of a crisis not the beginning of a new one.
- Service users in care homes are very unlikely to go into crisis as they are in 24 hour care.
- DNAs are indicative, but where there is a successful follow up after the DNA, that risk is
reduced.
Diagram 1
Team Level Findings
5
Narrative
-
Narrative
-
-
-
Narrative
-
-
-
-
None of the above 3 service users went on to have an actual crisis in the 28 day period.

All 7 were deemed suitable to be on the list
- 4 out of the 7 were seen to be adding “new insight”.
o One of these was a Service User who had recent suicidal thoughts (December)
and was not followed up regularly whilst the Service User’s Care Coordinator was
on annual leave for 2 weeks.
- Of the 3 that were not deemed to be adding new insight:
o 1 service user was not engaging with the service – and was well known within
the team
o Another was recently with home treatment, and was contacted by the CMHT for
follow up but was a physical health inpatient at the time. It was acknowledged by
the CPN that a prompt to follow up could have potentially averted the crisis.
o The third Service User passed away within the crisis period. Although there was
some contact with the CMHT early in January, there was not further information
until the service user attended a private clinic 2 days before passing away. It was
acknowledged by the CPN that perhaps a different approach may have averted a
crisis.

7
Conclusion and Recommendation
Although a lot of ‘false positives’ were identified, the algorithm does seem to be identifying high
risk/vulnerable service users. Additionally, it also does provide insight or at least a prompt to
intervene in some cases – so there is value being added. There were exceptional cases where
staff could not identify why the service user was included on the list – but in all cases, the
information that the CPN was using to determine risk was the most recent progress notes – and
unstructured data has not yet been included in the algorithm so there is scope for some
refinement in this regard.
The main area of concern from a practical point of view is the amount of time it took to get
through 30 sets of notes with each CPN (2-3 visits, 3 - 3.5 hours in total or around 6-7 minutes
per person on average); in practice this would be very difficult if this depth of review were
needed for each person included on the predictions list before a decision to make contact with
the person as the CMHTs are already stretching their resources. On the other hand, this concern
may be mitigated by the fact that the churn rate is very small, so only a handful of service users
will be “newly added” to the list each week.
A number of potential refinements to the algorithm were identified during the pre-pilot which
will be shared with Telefonica Alpha in the hope that this further reduces the number of service
users incorrectly identified (“false positives”). Additionally, the frequency in which the lists are
shared with the CMHTs, as well as including key data to support decision making will be scoped
to further reduce the amount of time spent on each case.
Recommendation
Notwithstanding the practical difficulties outlined above, due to the number of reasonable
inclusions (58%) and the additional insights (22%) that the algorithm has provided, it is
recommended that the project move in to the pilot phase to test the algorithm across the 6
CMHTs.

8
Appendix 1.
Below is a list of the top 22 features that were included in the predictive model. Using statistical
techniques, the Telefonica Alpha team were able to identify these features as having the most
“predictive power” i.e. these features (in combination and/or isolation) seemed to correlate most
to a service user having a mental health crisis.
Rank Importance Description
Appendix 2.
Step Change Criteria
The step change criteria is an attempt to further segment service users in to groups based on
criteria identified as a result of meetings that took place between the Informatics team and two
community teams in December and January this year. The following features were raised as
possible risk factors:
- Changes in the number of contacts
- Change in Care Level from CPA to Care Support
- Change in diagnosis
- Negative change in employment
- Negative change in accommodation

9
- Recent DNAs
- Whether the service user is a frequent attender or not
- A recent eclipse
The Informatics team applied the above criteria to the Telefonica algorithm output, and service
users that were flagged as “crisis predicted” and a “Step Up” according to the above criteria
were flagged as a “Step Up”.
Criteria in More Detail

10
Appendix 3.
Below is the questionnaire that was used to evaluate the 60 samples. Questions one and two are
pre-populated through RiO so were used to add context for the clinician to answering the
remaining 6 questions.
From RiO:
1. Did the person actually have a crisis in the next 28 days (or since)? If so, when and
where
2. Was the person seen in the next 28 days without having a crisis presentation first?
If so, when and in what context?
From the CMHT:
3. Based on what was known as at 31st December, does including this person on the
List seem reasonable? If not, why not?
4. Would it have provided your team with any new insight? i.e. was this service user
already on your radar as being at high risk at the time? Please provide details
5. Why would you have thought at the time that the service user WOULD/WOULD
NOT be at high risk of going into crisis in the next 28 days? Please provide a brief
description, referring to past events and/or observations at the time.
6. Please answer one of the following depending on what actually happened in the
28 days:
a. If crisis without another contact first – do you think having followed the person up
based on the algorithm could have helped avoid the crisis presentation?
b. If contact(s) and then a crisis – do you think anything could have been done
differently to avoid the crisis presentation?
c. If contact(s) and no crisis – do you think the contacts helped prevent a potential
crisis presentation?
d. If no contacts and no crisis – any comments?
7. What are the Key Risk Indicators for this Service User?
8. Any Other Comments
11
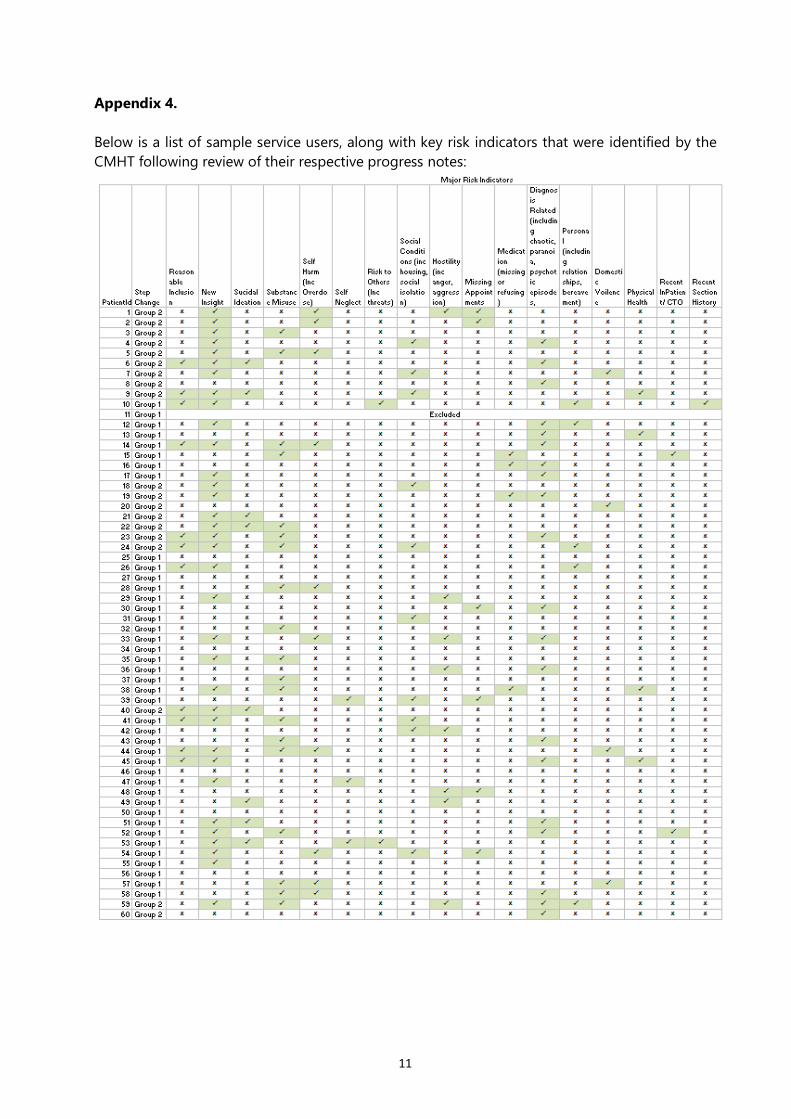
Appendix 4.
Below is a list of sample service users, along with key risk indicators that were identified by the
CMHT following review of their respective progress notes:

1
Annex 3: Risk Stratification Tool Development and feedback platform example
This documentation explains the principles and purpose of the bespoke Risk Stratification
element of the Predictive Analytics Pilot (November 2019 to June 2020) developed by the
project team in consultation with the clinicians involved in the pilot.
Two Community Mental Health Teams (CMHTs) were engaged in the pre-pilot phase (Erdington
& Kingstanding and Warstock Lane). For this testing, a ‘step-up’ model was used in order to
split the predicted crises into those to be reviewed by the clinical teams and those not, based on
specified criteria. This was to consolidate the list to 30 patients per team. When the project
moved towards the pilot testing phase, lessons learned from the pre- pilot suggested several
issues were going to be present during the pilot:
1. The first issue was the large number of crises being predicted per team. Initial analysis
suggested that for the larger teams, more than 100 patients would be predicted for crisis
every week. Through prior experience and feedback directly from clinical teams it was
suggested that on top of already-stretched workloads, this would not be manageable for
teams to work with.
2. The second issue was that algorithm outputs provided no context for the prediction being
made, i.e. it couldn’t state why a patient might go into crisis, only that they were likely to.
The project team identified this as a unique problem and was concerned that a flat list of
patient names only would be both impersonal and difficult to review efficiently.
3. The third issue was related to how much work reviewing each patient predicted for crisis
would entail, i.e. working through a list and revising RiO for relevant information, which
would be required in order to make a sensible judgement as to risk of crisis. It was thought
and confirmed by clinicians that an overly burdensome review and feedback process would
severely limit the ability of CMHTs to engage with the pilot. As the central point of the pilot
was to test the applicability of patient-level crisis predictions, failure to engage was a
fundamental risk to success of the project.
This instigated the development of the Risk Stratification tool. It was decided, in conjunction
with team managers that 100+ patients would indeed constitute too much additional work for
teams, especially for a pilot operating on a voluntary basis. 25 patients, refreshed every second
Monday was deemed to be an acceptable number for each team to work with and still generate
enough feedback data to allow for meaningful analysis of results over the course of the pilot.
To narrow a fortnightly list of 100+ predictions to 25 required a logical, consistent and
automated approach. Initially the project team worked on a logic sequence of criteria with
yes/no answers to dictate whether a patient would be included in the 25 or not. However, this
approach was found to be difficult to automate and could not be relied upon to reduce a list to
the appropriate number.
2
Using this as a basis, the project team therefore developed a ‘scorecard’ of clinical characteristics
which could be applied to every patient and be used to ‘order’ them high to low, with the ‘top’
25 being those released to the relevant team for review.
The characteristics applied, after consultation between the project clinical lead and CMHT
managers were broadly: recent inpatient status; recent medical contact; recent non-medical
contact; PD or dual diagnosis status; care level; up-to-date care plan; up-to-date risk
assessment; DNA without follow-up; an FTB or FEP patient; aged 65 or above; mental health act
with appropriate scores for each of those characteristics applied. These categories and the
scores applied make up the Risk Stratification tool. These characteristics align to the established
risk assessment parameters reflected in the trust’s risk management policy and the ICR
(integrated care records) risk assessment tool in RiO.
The included characteristics were developed over time (e.g. the age of the patient was included
at a later stage, after the project team met with an external organisation that had developed a
similar approach). The exact weighting (score range) of each characteristic was revised
following review with clinicians, so to promote some parameters more than others. As well as
allowing for ordering of patients and applying a consistent method of identifying the top 25,
this approach enabled some easy-to-understand context for clinicians, and a logical place for
their review to begin.
As part of the pilot review, an assessment on the value of the risk stratification as a standalone
tool for predicting crisis will be carried out, though the matrix was developed purely in response
to the barriers to engagement described above. Should it be determined that the risk
stratification could be utilised further across the trust, the project team would undertake a
review of the risk categories and weighting scores applied to ensure these are underpinned by a
sound clinical evidence base. Sources to be drawn upon include the national confidential inquiry
and NICE/Department of Health clinical guidance.
Supporting Literature
- NATIONAL CONFIDENTIAL INQUIRY into Suicide and Safety in Mental Health Annual Report
2018. https://www.hqip.org.uk/resource/national-confidential-inquiry-into-suicide-and-
safety-annual-report-2018/
- BSMHFT Clinical Risk Assessment Policy (November 2017)
http://connect/corporate/governance/Policies/Clinical%20%20Risk%20Assessment%20Policy
- BSMHFT The Reporting, Management & Learning from Incidents Policy (May 2018)
http://connect/corporate/governance/Policies/Incident%20Policy.pdf
- BSMHFT Care Management & CPA/Care Support Policy (April 2019)
http://connect/corporate/governance/Policies/Care%20Programme%20Approach%20and%2
0Care%20Support%20Policy.pdf
3
BSMHFT Predictive Analytics Risk Stratification Tool Example
Document contains dummy patient data.

4
Annex 4: Service User Feedback Report: ‘You Said, We Did’
Background
This report provides an extension to the initial summary report completed in response to the
Service User drop-in sessions held in Sept/Oct 2018, prior to the pilot testing phase of Predictive
Analytics.
The project team proposed to take a ‘You said, We did’ approach following the sessions to
ensure that service user perspectives are upheld and actioned as far as possible, as the research
of predictive analytics approaches the testing phase.
Captured below is a more detailed collation of the responses received and questions asked
during discussions with service users and carers. A questionnaire was provided to participants
(where possible), which included the questions 1-6 below. Where service users felt unable to
complete the questionnaire, discussions were centred on the topics covered within the
questionnaire. All written/verbal feedback has been formulated below.
Questions/Comments & Associated Responses
1. Do you feel that the risk predictive tool will be helpful to your mental health team
to identify whether you could be/are at risk of crisis?
You Said We Did/ Our Response and Actions
1. ‘Will this replace what my
CPN does?”
Service User was reassured that the tool was not
designed to override clinical decision making and is
designed to support clinicians only.
Action: This is documented within the operational and
research protocol for Predictive Analytics
2. “Prevention is always better
than cure”
It was relayed that the overall aim of the tool was to
identify and predict crisis and that armed with this
information, clinicians may be able to act proactively to
prevent a crisis.
3. “I think it is good if the
nurses have a technology
that can help them do their
job”
It was agreed that the tool is not intended to ‘override’
clinicians standard practice/ decision making but the use
of technology has the potential to generate new insights
and enhance how clinicians manage caseloads and
mitigate the risk of crisis episodes.
4. “It would help the service
users get the allocated
support they need”
Like other public sector organisations, there is the
challenge of providing high quality care with limited
resources. In order to not compromise on the quality of
care, innovation provides a significant role in maintaining
quality in line with the resource available. Hopefully the
tool will help manage and prioritise the allocation of
existing resources more efficiently and effectively.
5. “With some conditions, a It was acknowledged that at times service users find it

5
patient is not always in the
mood to discuss their
problems or feelings”
difficult to discuss how they are feeling and equally will
not contact mental health services for support on their
own volition.
Action: It is anticipated that this tool we will be able to
predict impending crises and staff can act proactively by
contact the service user, therefore initiating dialogue.
2. Would you feel comfortable with your care co-ordinator/ mental health team
following up with you if the tool indicated potential risk of crisis? (For example
making a telephone call to you or arranging an outpatient appointment?)
You Said We Did/ Our Response and Actions
1. “Yes, because many people,
including myself feel
uncomfortable asking for
help directly”
The proactive nature of the tool means that, at times,
clinicians will be contacting people and initiating
conversations around potential risk and management of
this risk. This potentially alleviates anxiety for those who
wouldn’t ordinarily seek help on their own accord.
2. “It would be nice if people
know I am in a crisis and
give me a call as I don’t like
to call and ask for help”
The tool has potential to transform the way CPN’s work
in terms of prioritising clients most at risk and averting
incidences of crises.
3. “It will be helpful… we will
have a piece of mind that
the help is there rather than
going to the GP to request
for help”
A longer term benefit of the predictive tool is that it can
direct care in the areas where it is most urgently needed.
4. “ Someone that I am
familiar with and has seen
me in the past would be
the best person to contact
me. It would need to be
someone to make you feel
immediately comfortable”
Service user was thanked for sharing their experience.
Gaining trust is important in the recovery process.
Action: Nurses will always try to build rapport and trust
with the service user and follow up interventions
resulting from the predictive tool will be patient centred
and where possible, executed by someone the service
user is familiar with.
5. “I feel reassured due to the
Data Protection Act”
How we use information is governed by various laws
including The Data Protection Act, Information
Governance, and GDPR. The way in which data has been
processed within the research of Predictive Analytics was
explained to the service user.

6
3. Do you feel reassured by the data usage regulations and protocols that are in place
to ensure that patient health data is kept anonymous?
You Said We Did/Our Response
1. “How will my information
be used?”
Historical health data of BSMHFT service users has been
used in the development of the algorithm but has been
completely pseudonymised within this process. The
information has been very helpful in creating the
algorithm and learning patterns in crisis presentations of
service users, in order to help us prevent further crisis
episodes.
2. “No concerns regarding
this”
Key principles of data protection and risk assessments
undertaken within the data processing of the research to
ensure service user data has been utilised anonymously
and ethically, was relayed.
3. “Just concerned with the
potentials of hacking as it
happens to big businesses,
but the potential of
someone accessing my
medical data is a bit
worrying”
It was acknowledged that these are valid concerns and
therefore discussed the various systems/processes in
place including pseudonymisation and regulatory
procedures undertaken to ensure data has been utilised
safely and securely.
4. “My GP uses my data to
send to the hospital if I have
to do a test, so I guess you
will use it similarly”
Agreed that in much the same way that a GP uses service
user information to provide the appropriate care and
interventions based on health history, the algorithm uses
information from historical data to predict the
occurrence of a mental health crisis.
5 “I don’t know much about
data protection, however I
assume that you guys will
protect my personal
information “
This is reassuring to understand that service users have
trust in staff in the context of data protection. It was
explained that staff adhere to policy and procedures to
protect service users data/information as far as possible.
This has been upheld throughout the development of
the predictive tool and will be maintained during the
testing phase.
4. What benefits of the Crisis Prevention Support Tool can you identify? (If any)
You Said We Did/ Our Response
1. “I think it is good if the
nurses have a technology
that can help them do their
job”
Action: Feedback provided to the project team, Service
user engagement and recovery team as well as all
clinicians supporting with the testing of the technology
2. “To help reducing any crises
that may occur”
Action: This is the overall aim of the tool and this will be
continually evaluated during the testing phase
3. “It will help me cope with
my mental health as I know
someone will contact me
The predictive aspect of the tool will potentially allow
CPN’s to prioritise their caseload. It will not necessarily
change existent care plans but will provide an additional

7
when I become unwell” insight and identification into those at risk of crisis
4. “At least I will be on the
mental health services radar
and wont be overlooked”
The tool provides an additional mechanism for teams to
identify and prioritise those most at risk of crisis which
potentially alleviates concerns of being ‘overlooked’.
5. “To prevent suicides and
breakdowns which can lead
to even greater strain on
the NHS Mental health
Services”
The tool aims to allow for a proactive approach to
prevent crisis episodes in place of reactive intervention
when incidences of crises do occur. It was acknowledged
that the prevention of suicide and increasing the
provision of support for people with mental health issues
is a significant and prioritised area for the NHS on both a
local and national level.
4. What challenges/disadvantages of the Crisis Prevention Support Tool can you
identify?
You Said We Did/ Our Response
1. “People not cooperating
and using the tool wisely”
Training for staff is being provided on how to use the
tool and the overall objectives of the predictive analytics
research.
Action: Staff will continuously be supported by the
project team to test/utilise this in the most effective way
possible.
2. “It might not be accurate
and you may be dragged in
for an appointment you
don’t need”
The predictive accuracy cannot be fully guaranteed
although the algorithm is currently expected to generate
80-85% accuracy within its predictions. In many
instances a telephone call will normally precede an
appointment and should an appointment be offered, the
service user is obligated to decline if felt to be
unnecessary.
3. “People do not always go
into a crisis at the same
time every year. There may
be identifiable patterns but
this will not always be the
case”
It is accepted that this may be the case, however the tool
is not solely reliant on yearly/seasonal patterns and
utilises additional risk filters to try and accurately predict
the likely occurrence of a crisis episode.
4. “If the help provided is not
correct/sufficient it could
add more stress to the
individual. For example
contact being made by
someone you don’t know or
who doesn’t know your
history “
Clinicians will have access to historical records so should
have knowledge of your diagnoses, involvement with
services, medication etc.
Action: A team approach in supporting service users in
the most person centred way will be upheld throughout
the research period, aiming for follow up interventions to
be carried out by those that have seen or have familiarity
of the individual.
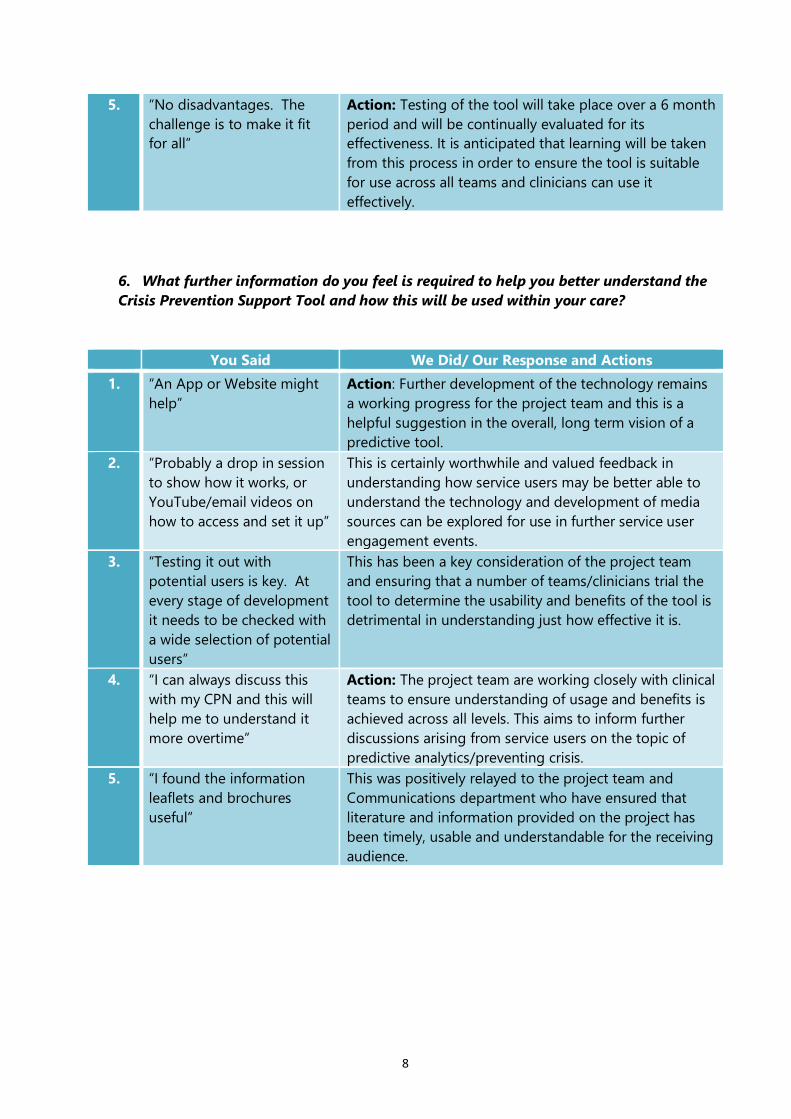
8
5. “No disadvantages. The
challenge is to make it fit
for all”
Action: Testing of the tool will take place over a 6 month
period and will be continually evaluated for its
effectiveness. It is anticipated that learning will be taken
from this process in order to ensure the tool is suitable
for use across all teams and clinicians can use it
effectively.
6. What further information do you feel is required to help you better understand the
Crisis Prevention Support Tool and how this will be used within your care?
You Said We Did/ Our Response and Actions
1. “An App or Website might
help”
Action: Further development of the technology remains
a working progress for the project team and this is a
helpful suggestion in the overall, long term vision of a
predictive tool.
2. “Probably a drop in session
to show how it works, or
YouTube/email videos on
how to access and set it up”
This is certainly worthwhile and valued feedback in
understanding how service users may be better able to
understand the technology and development of media
sources can be explored for use in further service user
engagement events.
3. “Testing it out with
potential users is key. At
every stage of development
it needs to be checked with
a wide selection of potential
users”
This has been a key consideration of the project team
and ensuring that a number of teams/clinicians trial the
tool to determine the usability and benefits of the tool is
detrimental in understanding just how effective it is.
4. “I can always discuss this
with my CPN and this will
help me to understand it
more overtime”
Action: The project team are working closely with clinical
teams to ensure understanding of usage and benefits is
achieved across all levels. This aims to inform further
discussions arising from service users on the topic of
predictive analytics/preventing crisis.
5. “I found the information
leaflets and brochures
useful”
This was positively relayed to the project team and
Communications department who have ensured that
literature and information provided on the project has
been timely, usable and understandable for the receiving
audience.

9
Summary
The feedback received from service users has been highly valuable for the project team in
understanding their perspectives on the use of digital technology to reduce incidences of
mental health crisis.
The project team plan to hold further engagement sessions during the testing period in the
form of focus groups, to further explore in more detail, some of the key topics that arose during
these discussions, for example:
- What follow up interventions to expect as a result of being ‘flagged’ by the algorithm
and how these will be best received from a service user perspective
- How data has been used and will continued to be used throughout the testing period
- How service users feel about the use of digital technology as part of their care and
whether benefits can be derived from such innovations.
The support of the Trust’s Service User Governor will be maintained in further sessions as this
continues to be an imperative component in engaging and upholding service user perspectives
within the predictive analytics research. Continued collaboration with the Trust’s Service User
engagement and recovery team will also continue as further events are planned.

1
Annex 5: Feedback Questionnaire
How useful is a risk stratification tool/Predictive Analytics tool at supporting timely and effective
clinical decision making?
Q1. What was your recent assessment of this patient’s condition? Please select one option.
1a. Low risk of crisis
1b. Medium risk of crisis
1c. High risk of crisis
1d. Imminent risk of crisis
1e. Patient in crisis
Q2. Have you taken /do you intend to take any actions as a result of this notification?
Please select one option.
2a. Yes – contact to be made
Option – Telephone or Face to Face
2b. No – contact made recently – within 7 days
2c. No – risk already acknowledged and being managed
2d. No – do not agree with assessment
Q3. What is your current assessment of this patient’s condition? Please select one option.
3a. Low risk of crisis
3b. Medium risk of crisis
3c. High risk of crisis
3d. imminent risk of crisis
3e. Patient in crisis
Q4. Do you think that this additional information has helped you with..? Tick any/all
options
4a. Trying to prevent the patient from experiencing an imminent crisis
4b. Identifying deterioration in the patient’s condition
4c. Managing caseload priorities
4d. Nothing – did not find this information useful