Embed Size (px)
Citation preview

Evaluation of the Performance of Activated
Carbon and Titanium Dioxide Composites
for Pharmaceutical Adsorption and
Photocatalysis in Water
Ph.D.
David Keane B.Sc.
Supervisors
Dr. Anne Morrissey
Dr. Kieran Nolan
Dr. John Tobin
School of Biotechnology
Dublin City University
Dublin 9
Ireland

ii
Declaration
I hereby certify that this material, which I now submit for assessment on the programme of
study leading to the award of Ph.D. is entirely my own work, that I have exercised
reasonable care to ensure that the work is original, and does not to the best of my
knowledge breach any law of copyright, and has not been taken from the work of others
save and to the extent that such work has been cited and acknowledged within the text of
my work.
Signed: _______________
ID No.: 58120441
Date: ________________

iii
TABLE OF CONTENTS
TABLE OF CONTENTS .................................................................................................. iii ACKNOWLEDGEMENTS .............................................................................................. vi ABSTRACT ..................................................................................................................... vii
LIST OF FIGURES ........................................................................................................ viii LIST OF TABLES .......................................................................................................... xiv ABBREVIATIONS ......................................................................................................... xv PUBLICATIONS, POSTERS AND ORAL PRESENTATIONS ................................ xviii
Chapter 1 Literature Review .................................................................................................. 1
1.1 Pharmaceuticals in natural waters, drinking water and wastewater - approaches for
their removal ...................................................................................................................... 2 1.1.1 Removal of pharmaceuticals from drinking water ................................................ 4 1.1.2 Removal of pharmaceuticals from wastewater ................................................... 11
1.2 TiO2 photocatalysis .................................................................................................... 22 1.3 Origin and structure of activated carbon .................................................................... 27
1.4 Integrated photocatalytic adsorbents .......................................................................... 33 1.4.1 Photocatalyst choice for IPCAs .......................................................................... 37
1.4.2 Adsorbent types ................................................................................................... 41 1.4.3 Wet methods for preparation of IPCAs ............................................................... 43
1.4.3.1 Sol-gel .......................................................................................................... 43
1.4.3.2 Other wet methods ....................................................................................... 45 1.4.4 Dry methods of preparation ................................................................................ 46
1.4.4.1 Chemical Vapour Deposition ....................................................................... 46 1.4.4.2 Mechanofusion: Theta composer ................................................................. 47
1.4.5 Substrate for photodegradation ........................................................................... 48
1.4.6 Regeneration/reuse of IPCAs .............................................................................. 51 1.4.7 IPCAs and photocatalytic reactor design ............................................................ 54
1.5 Conclusions ................................................................................................................ 55 1.6 Project aims ................................................................................................................ 55
1.7 Project objectives ....................................................................................................... 56 Chapter 2 Materials and Methods ........................................................................................ 57
2.1 Materials ..................................................................................................................... 58
2.2 Methods: ..................................................................................................................... 59 2.2.1 IPCA preparation ................................................................................................ 59
2.2.1.1 Initial IPCA preparation method. ................................................................. 59 2.2.1.2 IPCA prepared for heat treated IPCAs ......................................................... 60 2.2.1.3 Improved IPCA preparation method ............................................................ 60
2.2.2 Characterisation methods for P25, AC and IPCAs ............................................. 61 2.2.2.1 Scanning electron microscopy ..................................................................... 61 2.2.2.2 Field emission scanning electron microscopy ............................................. 61 2.2.2.3 X-ray diffraction........................................................................................... 61
2.2.2.4 Fourier Transform Infrared Spectroscopy .................................................... 62 2.2.3 Analytical methods for famotidine and solifenacin ............................................ 62 2.2.4 Sorption studies ................................................................................................... 63
2.2.4.1 General adsorption method .......................................................................... 63 2.2.4.2 Adsorption kinetic studies ............................................................................ 64 2.2.4.3 Effect of initial pH ....................................................................................... 64

iv
2.2.4.4 Effect of initial concentration....................................................................... 65 2.2.4.5 Desorption studies ........................................................................................ 65
2.2.5 Models used for adsorption analysis ................................................................... 66 2.2.5.1 Intraparticle diffusion model ........................................................................ 66 2.2.5.2 Bangham equation ........................................................................................ 67
2.2.6 Models used for isotherm studies ........................................................................ 67 2.2.6.1 Langmuir ...................................................................................................... 67 2.2.6.2 Freundlich .................................................................................................... 67 2.2.6.3 Temkin isotherm .......................................................................................... 68 2.2.6.4 Redlich–Peterson (R-P) isotherm ................................................................. 68
2.2.6.5 Error checking of isotherm studies .............................................................. 69 2.2.7 Method for photodegradation studies ................................................................. 70
Chapter 3 Characterisation of AC and IPCAs...................................................................... 72 3.1 Introduction ................................................................................................................ 73
3.2 Scanning electron microscopy / energy dispersive X-ray of AC and IPCAs. ........... 73 3.3 Field emission scanning electron microscopy of AC and IPCAs .............................. 77
3.4 X-ray diffraction......................................................................................................... 84 3.5 Conclusions ................................................................................................................ 89
Chapter 4 Adsorption Studies .............................................................................................. 90 4.1 Introduction ................................................................................................................ 91
4.1.1 Pharmaceuticals under investigation ................................................................... 91
4.2 TiO2 adsorption .......................................................................................................... 93 4.2.1 Famotidine adsorption ......................................................................................... 93
4.2.1.1 Kinetics of TiO2 adsorption ......................................................................... 93 4.2.1.2 Effect of initial concentrations on adsorption .............................................. 94 4.2.1.3 Effect of pH on adsorption ........................................................................... 96
4.2.2 Solifenacin adsorption ......................................................................................... 97 4.2.2.1 Adsorption kinetics of TiO2 ......................................................................... 97
4.2.2.2 Effect of initial concentration on adsorption ................................................ 98 4.2.2.3 Effect of pH on solifenacin adsorption ........................................................ 99
4.3 AC adsorption .......................................................................................................... 101 4.3.1 Famotidine ........................................................................................................ 101
4.3.1.1 Adsorption kinetics of AC ......................................................................... 101
4.3.1.2 Effect of initial pH on famotidine adsorption ............................................ 105 4.3.1.3 Effect of initial concentration on adsorption onto AC ............................... 106
4.3.2 Solifenacin......................................................................................................... 108 4.3.2.1 Adsorption kinetics of AC ......................................................................... 108 4.3.2.2 Effect of pH on solifenacin adsorption ...................................................... 109
4.3.2.3 Effect of initial concentration on solifenacin adsorption ........................... 110 4.4 IPCA adsorption ....................................................................................................... 111
4.4.1 Famotidine ........................................................................................................ 111 4.4.1.1 Adsorption kinetics of 1:10 IPCA .............................................................. 111
4.4.1.2 Effect of initial concentration on adsorption .............................................. 118 4.4.1.3 Effect of initial pH on adsorption............................................................... 120
4.4.2 Solifenacin......................................................................................................... 121 4.4.2.1 Adsorption kinetics of the 1:10 IPCA ........................................................ 121 4.4.2.2 Effect of initial concentration on adsorption .............................................. 125 4.4.2.3 Effect of initial pH on adsorption............................................................... 126
4.5 Isotherm modelling of adsorption onto IPCAs and AC ........................................... 127
v
4.5.1 Famotidine ........................................................................................................ 127 4.5.2 Solifenacin......................................................................................................... 133
4.6 Desorption of famotidine and solifenacin from AC ................................................. 136 4.7 Conclusions .............................................................................................................. 141
Chapter 5 Photodegradation Studies .................................................................................. 142
5.1 Introduction .............................................................................................................. 143 5.2 Baseline photodegradation studies ........................................................................... 143
5.2.1 Photolysis studies .............................................................................................. 144 5.2.2 Photocatalysis studies........................................................................................ 145
5.2.2.1 Photocatalysis catalyst concentration optimisation .................................... 145
5.2.2.2 Photocatalysis studies for famotidine and solifenacin ............................... 146 5.3 Initial IPCA photodegradation studies ..................................................................... 148 5.4 Optimisation of IPCA photodegradation of famotidine ........................................... 153 5.5 Photodegradation studies of famotidine using 1:10 IPCA and AC control ............. 158
5.6 Photodegradation studies of solifenacin using 1:10 IPCA and AC control ............. 162 5.7 Conclusions .............................................................................................................. 165
Chapter 6 Evaluation of Findings ...................................................................................... 166 6.1 Introduction .............................................................................................................. 167
6.2 Critical assessment of synergy claims in IPCA literature ........................................ 167 6.3 Molecules investigated for IPCA photodegradation ................................................ 175 6.4 Reasons for success or failure of molecules to be photodegraded by IPCAs .......... 180
6.5 Future work to confirm mechanism ......................................................................... 182 6.6 Conclusion ............................................................................................................... 185
Chapter 7 Conclusions and Recommendations .................................................................. 186 7.1 Conclusions .............................................................................................................. 187 7.2 Recommendations for future work .......................................................................... 188
References .......................................................................................................................... 189 Appendix A, IPCAs Prepared by Wet Methods ................................................................ 211
Appendix B, IPCAs Prepared by Dry Method ................................................................... 228 Appendix C Emission Spectra of UV lamps ...................................................................... 231
vi
ACKNOWLEDGEMENTS
I would like to thank the EPA under the Science, Technology, Research and Innovation for
the Environment (STRIVE) Programme 2007–2013 (project number 2008-S-ET) and DCU
for funding.
I would like to thank my lab colleagues Mark, Ann Marie, Sharon, Nora, Ross, Basha,
Cecilia and Zahra for their help, support and kindness.
I would like to thank all the technical staff in the School of Biotechnology, Chemical
Sciences, Mechanical Engineering and the NCSR. A special thanks to David Cunningham
for all his help.
Thanks to Astellas Ireland Ltd, ENVA Environmental Ltd, Activated Carbon Technologies
PTY Ltd and Degussa for the free samples and technical support.
I would like to acknowledge the hard work and dedication of my supervisors, Anne, John,
Kieran and from Australia, Michael. Thank you for your guidance and support.
Thanks to my family and friends for their encouragement.

vii
ABSTRACT
In this project the adsorptive properties of activated carbons (AC) are coupled with
the photocatalytic properties of titanium dioxide (TiO2) to create a synergistic composite -
an integrated photocatalytic adsorbent (IPCA) - that can adsorb and photodegrade
pollutants better than the two materials separately. Two active pharmaceutical ingredients,
famotidine and solifenacin succinate, were chosen as model pollutants in this study. Active
pharmaceutical ingredients are an important group of organic environmental contaminants
that have the potential to cause health risks for humans as well as biota. An ultrasonication
preparation method was used to combine the AC and TiO2 to prepare the IPCA.
Characterisation of the IPCA using SEM, EDX and FESEM analysis revealed that
TiO2 particles approximately 25 nm in diameter were dispersed across the AC surface.
XRD analysis provided information on the molecular structure of the IPCAs and TiO2.
Adsorption studies indicated that TiO2 has limited adsorption capacity. The AC and IPCA
have higher adsorption capacity but require long equilibrium times due to rate limiting
intraparticle diffusion.
IPCA photodegradation studies at an initial concentration of 100 mg/L can remove
more solifenacin from solution than either TiO2 or AC separately; however for famotidine
removal the IPCAs showed no improvement compared to AC or TiO2 controls. The
contrast is postulated to be the high adsorption strength of famotidine compared to
solifenacin, which retards migration from the adsorption sites on the AC to the TiO2 on the
IPCA surface. This lowers the photodegradation rate for famotidine but not solifenacin.
These results suggest that substrate desorption is required to prepare effective IPCAs.
Future work would involve IPCA photodegradation studies of compounds similar to
famotidine to confirm this hypothesis.
viii
LIST OF FIGURES
Figure 1-1 Flow chart of pharmaceutical entry into the environment. .................................. 3 Figure 1-2 Diagram of a GAC bed gradually becoming saturated leading to break through
(Moreno-Castilla, 2004). ........................................................................................................ 8
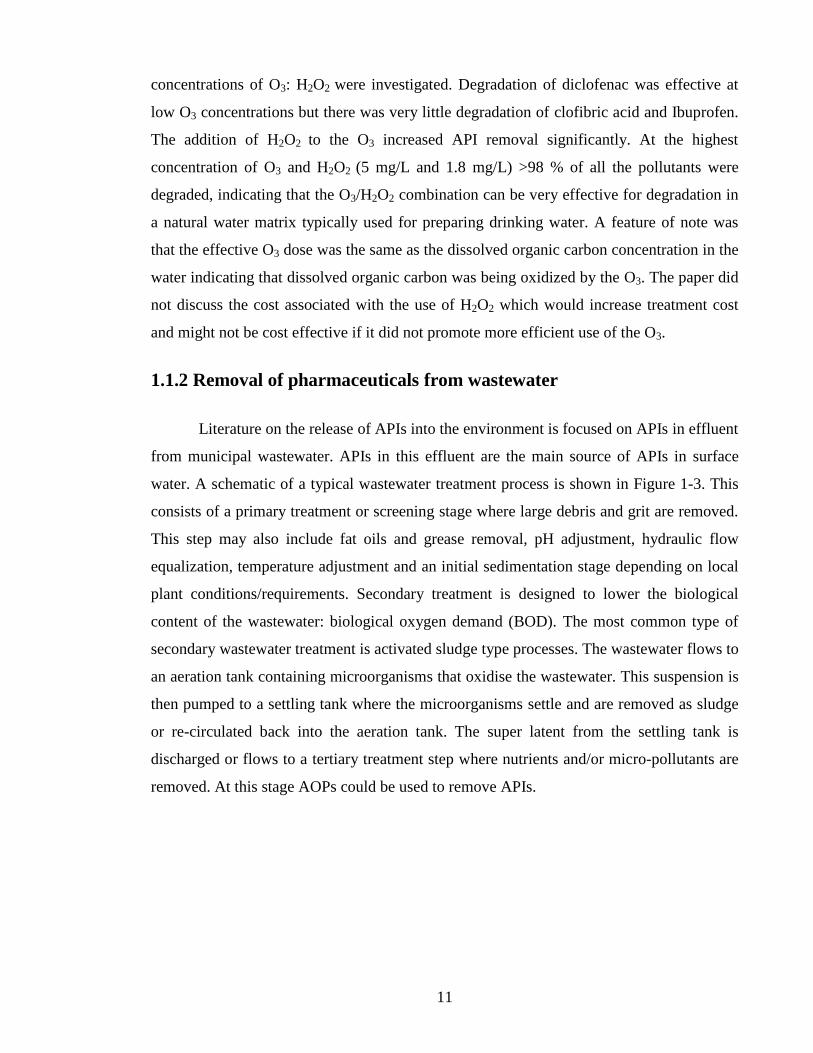
Figure 1-3 Diagram of typical activated sludge WWTP process with treatment stages
indicated (Grover et al., 2011). ............................................................................................ 12 Figure 1-4 Typical solar spectrum at Plataforma Solar de Almería in Spain and the optical
density (O.D., optical path length 1cm) of a Fe2(SO4)3 solution (0.25mM as Fe) and TiO2
powder (Malato et al., 2002). ............................................................................................... 20
Figure 1-5 Primary steps in the photoelectrochemical mechanism (Hoffmann et al., 1995,
Peralta-Hernández et al., 2007). ........................................................................................... 23 Figure 1-6 TiO2 polymorphs (a) rutile, (b) anatase, (c) brookite (Foo and Hameed, 2010a).
.............................................................................................................................................. 26
Figure 1-7 Schematic mechanism of doped TiO2 photocatalysis. hν1: pure TiO2; hν2: metal-
doped TiO2 and hν3: nonmetal-doped TiO2 (Zaleska, 2008). .............................................. 27
Figure 1-8 Comparison of three-dimensional crystal lattice of graphite (a) and the less
ordered structure typical of AC (b) (Bansal and Goyal, 2005). ........................................... 28
Figure 1-9 Unmodified activated carbon (Baup et al., 2000, Marsh and Rodríguez-Reinoso,
2006d). ................................................................................................................................. 30 Figure 1-10 Diagram of Surface Oxygen Functionalities (SOF) on the edges of the aromatic
sheets of an AC surface (Shen et al., 2008). ........................................................................ 30 Figure 1-11 Four step model of AC adsorption in this case a GAC (Baup et al., 2000). .... 32
Figure 1-12 Number of surveyed AC/TiO2 IPCA (degrading water pollutants) studies
published per year 1996- December 2011. .......................................................................... 34 Figure 1-13 Activated carbon modified with TiO2: an IPCA. ............................................. 35
Figure 1-14 Diagram of IPCA photodegradation mechanisms. (1) Transfer of the substrate
to the adsorption sites close to the TiO2. (2) Diffusion of the substrate from the ACs pores
to the TiO2 surface. (Devipriya and Yesodharan, 2005). ..................................................... 36 Figure 1-15 Photocatalyst used for preparing IPCAs. ......................................................... 37
Figure 1-16 AC type and number used in IPCA studies. ..................................................... 42 Figure 1-17 Number of substrates (numbers on the inside of the graph) used for
photodegradation in the 104 surveyed studies (some studies use more than one substrate).48
Figure 2-1 A) Schematic of photochemical reactor, B) Photograph of photochemical reactor
using 1:10 IPCA during illumination. .................................................................................. 71 Figure 3-1 SEM image of the 1:2 IPCA surface. ................................................................. 74 Figure 3-2 SEM - EDX spectrum of 1:2 IPCA. ................................................................... 74 Figure 3-3 SEM micrograph of Aqua 2k AC. ...................................................................... 75
Figure 3-4 SEM micrograph of 1:10 IPCA. ......................................................................... 76 Figure 3-5 EDX analysis of titanium on the 1:10 IPCA surface.......................................... 76 Figure 3-6 EDX spectrum and elemental composition of the 1:10 IPCA surface. .............. 77 Figure 3-7 Simplified diagram of the emission of X-rays from rough and flat surfaces in
EDX. .................................................................................................................................... 77 Figure 3-8 FESEM image of a small grain of 1:10 IPCA. ................................................... 78 Figure 3-9 FESEM image showing the diameter of TiO2 particles on the IPCA shown in
Figure 3-8. ............................................................................................................................ 79 Figure 3-10 FESEM image of a section of 1:10 IPCA. ....................................................... 79 Figure 3-11 Magnified FESEM image of an area of the 1:10 IPCA covered in TiO2. ........ 80

ix
Figure 3-12 FESEM image of a grain of unmodified AC. ................................................... 81 Figure 3-13 High magnification FESEM image of an area of the AC surface. ................... 81
Figure 3-14 FESEM “Site A” of 1:10 IPCA. “Area of IPCA” is in the centre while “spot of
carbon at 20k” is in the top right hand corner. ..................................................................... 82 Figure 3-15 FESEM EDX spectrum of “Area of IPCA”...................................................... 83
Figure 3-16 FESEM Site B “Spot of carbon”. ..................................................................... 83 Figure 3-17 FESEM spectrum of "Spot of carbon". ............................................................ 83 Figure 3-18 XRD spectra of glass slide (with silts) and glass slide covered with petroleum
jelly (with sollor slot). .......................................................................................................... 85 Figure 3-19 XRD spectra of P25 adhered to a glass slide with petroleum jelly with solid
slits and a sollor slot. ............................................................................................................ 86 Figure 3-20 XRD spectra of P25 adhered to a glass slide with petroleum jelly with solid
slits and a sollor slot. The vertical lines indicate crystalline phase. ..................................... 87 Figure 3-21 XRD spectra of 1:10 IPCA. The vertical lines indicate the crystalline phase.. 88
Figure 3-22 XRD spectra of 1:10 IPCA heat treated at 700°C. The vertical lines indicate the
crystalline phase. .................................................................................................................. 88
Figure 3-23 XRD spectra of activated carbon. The vertical lines indicate the crystalline
phase. .................................................................................................................................... 89
Figure 4-1 Structure of famotidine. ...................................................................................... 92 Figure 4-2 Structure of solifenacin succinate....................................................................... 93 Figure 4-3 Famotidine concentration (mg/L) vs. time (days) for P25 TiO2 adsorption.
Average results shown (N=2), error bars are standard deviation. ........................................ 94 Figure 4-4 Adsorption loading (q) of famotidine onto TiO2 vs. famotidine concentration
after 22 h (C22h). Initial concentrations were 20 mg/L, 30 mg/L, 40 mg/L, 50 mg/L, 60
mg/L, 80 mg/L and 100 mg/L. Average results shown (N=2), error bars are standard
deviation. .............................................................................................................................. 95
Figure 4-5 Adsorption loading (q) of famotidine onto TiO2 vs. Initial pH (pHi). pHi studied
were 4, 6, 6.9 and 7.7. Average results shown (N=2), error bars are standard deviation. ... 96
Figure 4-6 Famotidine concentration after 22 h (C22h) vs. initial pH (pHi) of adsorbent free
controls. Initial concentration: 100 mg/L. Average results shown (N=2), error bars are
standard deviation. ............................................................................................................... 97 Figure 4-7 Solifenacin concentration (mg/L) vs. time (hours) for P25 TiO2 adsorption.
Average results shown (N=2), error bars are standard deviation. ........................................ 98
Figure 4-8 Adsorption loading (q) of TiO2 vs. solifenacin concentration after 22 h (C22h).
Initial concentrations studied were 20 mg/L, 30 mg/L, 40 mg/L, 50 mg/L, 60 mg/L, 80
mg/L and 100 mg/L and 150 mg/L. Average results shown (N=2), error bars are standard
deviation. .............................................................................................................................. 99 Figure 4-9 Adsorption loading (q) of solifenacin onto TiO2 vs. initial pH (pHi). pHi studied
were 2.1, 4.1, 4.8, 6 and 8.1. Average results shown (N=2), error bars are standard
deviation. ............................................................................................................................ 100 Figure 4-10 Solifenacin concentration after 22 h (C22h) vs. initial pH (pHi) of adsorbent free
controls. Initial concentration: 100 mg/L. Average results shown (N=2), error bars are
standard deviation. ............................................................................................................. 100 Figure 4-11 Famotidine concentration (mg/L) vs. time (days) for AC. Adsorbent free
control is also shown. Average results shown (N=2), error bars are standard deviation. .. 101 Figure 4-12 Famotidine concentration (mg/L) vs. time (days) for AC. Adsorbent free
control is also shown. Average results shown (N=2), error bars are standard deviation. .. 102

x
Figure 4-13 Famotidine adsorption (q) loading (mg/g) vs. time (days) for AC for first and
second stage famotidine adsorption studies. Average results shown (N=2), error bars are
standard deviation. ............................................................................................................. 103 Figure 4-14 Adsorption loading (q) of famotidine onto Aqua 2k vs. initial pH (pHi). pHi
studied were 4.0, 5.8, 6.0 and 8.0. Average results shown (N=2), error bars are standard
deviation. ............................................................................................................................ 105 Figure 4-15 Adsorption loading (q) of famotidine on Aqua 2k vs. concentration after 22 h
adsorption (C22h). Initial concentrations studied were 20 mg/L, 40 mg/L, 50 mg/L, 60 mg/L,
80 mg/L and 100 mg/L and 150 mg/L. Average results shown (N=2), error bars are
standard deviation. ............................................................................................................. 107
Figure 4-16 Average solifenacin concentration (mg/L) vs. time (day) for AC. Average
results shown (N=2), error bars are standard deviation. .................................................... 108 Figure 4-17 Solifenacin adsorption loading (mg/g) vs. time (day) for AC. Average results
shown (N=2), error bars are standard deviation. ................................................................ 109
Figure 4-18 Adsorption loading (q) of solifenacin onto Aqua 2k vs. pHi. pHi studied were
2.1, 4.0, 4.9, 6.0 and 8.0. Average results shown (N=2), error bars are standard deviation.
............................................................................................................................................ 110 Figure 4-19 Adsorption loading (q) of solifenacin on Aqua 2k vs. concentration after 22 h
adsorption (C22h). Initial concentrations studied were 20 mg/L, 30 mg/L, 40 mg/L, 50 mg/L,
60 mg/L, 80 mg/L and 100 mg/L and 150 mg/L. Average results shown (N=2), error bars
are standard deviation. ....................................................................................................... 111
Figure 4-20 Famotidine concentration (mg/L) vs. time (days) for AC and IPCA. Average
results shown (N=2), error bars are standard deviation. .................................................... 112
Figure 4-21 Famotidine concentration (mg/L) vs. time (days) for AC and IPCA. Average
results shown (N=2), error bars are standard deviation. .................................................... 112 Figure 4-22 Famotidine adsorption (q) loading (mg/g) vs. time (days) for AC and 1:10
IPCA for first and second stage famotidine adsorption studies. Average results shown
(N=2), error bars are standard deviation. ........................................................................... 113
Figure 4-23 Fractional uptake diagram for adsorption of famotidine onto AC and 1:10
IPCA for 1st stage studies. .................................................................................................. 114
Figure 4-24 Fractional uptake curve for adsorption of famotidine onto AC and 1:10 IPCA
for 2nd
stage studies. ........................................................................................................... 115 Figure 4-25 Bangham’s plot of Log Log (Ci/Ci −qt) vs. Log t for famotidine adsorption. 117
Figure 4-26 Adsorption loading (q) of famotidine on various IPCAs and AC vs.
concentration after 22 h adsorption (C22h). Initial concentrations studied were 20 mg/L, 40
mg/L, 50 mg/L, 60 mg/L, 80 mg/L and 100 mg/L and 150 mg/L. Average results shown
(N=2), error bars are standard deviation. ........................................................................... 119 Figure 4-27 Adsorption loading (q) of famotidine onto Aqua 2k and 1:10 IPCA vs. initial
pH (pHi). pHi studied were 4.0, 5.8, 6.0 and 8.0. Average results shown (N=2), error bars
are standard deviation. ....................................................................................................... 120 Figure 4-28 Average solifenacin concentration (mg/L) vs. time (day) for AC and IPCA.
Average results shown (N=2), error bars are standard deviation. ...................................... 121
Figure 4-29 Solifenacin adsorption loading (mg/g) vs. time (day) for various adsorbents.
Average results shown (N=2), error bars are standard deviation. ...................................... 122 Figure 4-30 Fractional uptake curve of solifenacin for 1:10 IPCA and AC. ..................... 123 Figure 4-31 lnC (concentration) vs. t for IPCA and AC. ................................................... 123 Figure 4-32 Bangham equation for solifenacin. ................................................................. 124 Figure 4-33 Adsorption loading (q) of solifenacin vs. concentration after 22 h (C22h) of
adsorption onto Aqua 2k and 1:10 IPCA. Initial concentrations studied were 10 mg/L, 20

xi
mg/L, 30 mg/L, 40 mg/L, 50 mg/L, 60 mg/L, 80 mg/L and 100 mg/L and 150 mg/L.
Average results shown (N=2), error bars are standard deviation. ...................................... 126
Figure 4-34 Adsorption loading (q) of solifenacin onto Aqua 2k and 1:10 IPCAs vs. initial
pH (pHi). pHi studied for ACs were 2.1, 4.0, 4.9, 6.0 and 8.0. pHi studied for IPCAs were
2.1, 4.2, 4.9, 6.3 and 7.7. Average results shown (N=2), error bars are standard deviation.
............................................................................................................................................ 127 Figure 4-35 Experimental values (q(exp)) and calculated isotherm values of adsorption
loading for famotidine adsorption onto AC vs. concentration after 22 h of adsorption (C22h).
Average q(exp) results shown (N=2), error bars are standard deviation. .......................... 131 Figure 4-36 Experimental values (q(exp)) and calculated isotherm values of adsorption
loading for famotidine adsorption onto 1:200 IPCA vs. concentration after 22 h of
adsorption (C22h). Average q(exp) results shown (N=2), error bars are standard deviation.
............................................................................................................................................ 132 Figure 4-37 Experimental values (q(exp)) and calculated isotherm values of adsorption
loading for famotidine adsorption onto 1:10 IPCA vs. concentration after 22 h of adsorption
(C22h). Average q(exp) results shown (N=2), error bars are standard deviation. ............... 132
Figure 4-38 Experimental values (q(exp)) and calculated isotherm values of adsorption
loading for solifenacin adsorption onto AC vs. concentration after 22 h of adsorption (C22h).
Average q(exp) results shown (N=2), error bars are standard deviation. .......................... 135 Figure 4-39 Experimental values (q(exp)) and calculated isotherm values of adsorption
loading for solifenacin adsorption onto 1:10 IPCA vs. concentration after 22 h of
adsorption (C22h). Average q(exp) results shown (N=2), error bars are standard deviation.
............................................................................................................................................ 136
Figure 5-1 Concentration of famotidine vs. time for photolysis studies, t < 0 is the period
where famotidine was present in the reactor without illumination. Average results shown
(N=2), error bars are standard deviation. ........................................................................... 144
Figure 5-2 Concentration of solifenacin vs. time for photolysis studies, When t < 0 the
solifenacin was in the reactor without illumination. Average q(exp) results shown (N=2),
error bars are standard deviation. ....................................................................................... 145 Figure 5-3 Concentration of famotidine vs. time for different P25 catalyst concentrations
and photolysis control. ....................................................................................................... 146 Figure 5-4 Concentration of famotidine vs. time for 0.4g/L P25 photocatalysis studies, t < 0
is the period where famotidine was present in the reactor without illumination. Average
q(exp) results shown (N=3), error bars are standard deviation. ......................................... 147 Figure 5-5 Concentration of solifenacin vs. time for 0.4g/L P25 TiO2 photocatalysis studies,
t < 0 is the period where solifenacin was present in the reactor without illumination.
Average q(exp) results shown (N=3), error bars are standard deviation. .......................... 148 Figure 5-6 Famotidine concentration vs. time of IPCAs prepared by ultrasonication using
Aqua 2k with TiO2 loadings from 1:10 to 1:1. Catalyst concentration 0.4 g/L IPCA. t = -15
to 0 is the dark adsorption phase. ....................................................................................... 149 Figure 5-7 1L photoreactor after photodegradation using 1:1 IPCA, loose TiO2 is visible in
solution as a grey cloud. A pH probe is also present in the solution. ................................ 150
Figure 5-8 Famotidine concentration vs. time of IPCAs prepared by ultrasonication using
Aqua 2k with TiO2 loadings ranging from 1:2 to 1:100. t = -15 to 0 is the dark adsorption
phase. .................................................................................................................................. 150 Figure 5-9 Pseudo reaction rates vs. time of IPCAs prepared by ultrasonication using Aqua
2k with P25 TiO2 loadings from 1:100 to 1:2. ................................................................... 152 Figure 5-10 Famotidine concentration vs. time of IPCAs with the similar TiO2
concentrations at 0.4 g/L and 1.5 g/L catalyst concentrations. .......................................... 153

xii
Figure 5-11 Famotidine concentration vs. time for 1:200 IPCA to 1:10 IPCAs including
TiO2, dark adsorption and photolysis controls. .................................................................. 154
Figure 5-12 Famotidine (%) remaining in solution (100 % at t = 0) using various IPCAs.
Non illuminated 1:10 IPCA, TiO2 and photolysis controls are also shown. ...................... 155 Figure 5-13 Famotidine (%) remaining in solution (100 % at t = 0) using heat treated 1:10
IPCAs. P25 and photolysis controls are included. ............................................................. 155 Figure 5-14 Kinetics of famotidine photodegradation (linear transform ln(C0/C) vs. t) in
photocatalytic experiments using various IPCAs. ............................................................. 156 Figure 5-15 Kinetics of famotidine photodegradation (linear transform ln(C0/C) vs. t) in
photocatalytic experiments using heat treated IPCAs. ....................................................... 156
Figure 5-16 Famotidine concentration vs. time for 1:10 IPCAs, AC, P25 and photolysis
studies. “Light” studies were illuminated; “Dark” studies were not. Average results shown
(N=3), error bars are standard deviation. ........................................................................... 159 Figure 5-17 Average % remaining of famotidine concentration vs. time for photolysis, P25,
illuminated and not illuminated IPCAs and ACs. Average results shown (N=3), error bars
are standard deviation. ....................................................................................................... 160
Figure 5-18 FTIR spectra of (a) virgin 1:10 IPCA, (b) 1:10 IPCA after famotidine
adsorption and (c) 1:10 IPCA after photodegradation of famotidine. ............................... 161
Figure 5-19 Solifenacin concentration vs. time for photolysis, P25 photocatalysts and
IPCAs (average results shown). Average results shown (N=2), error bars are standard
deviation. ............................................................................................................................ 163
Figure 5-20 Solifenacin concentration vs. time for photolysis, P25 photocatalysts, IPCAs
and ACs (average results shown). Average results shown (N=3), error bars are standard
deviation. ............................................................................................................................ 164 Figure 6-1 “(a) Kinetics of phenol disappearance (b) kinetic curves [sic] of phenol
disappearance” (Matos et al., 1998). .................................................................................. 169
Figure 6-2 “Phenol concentration decay curves of the investigated catalysts under dark
adsorption and UV irradiation” “Q” refers to the AC and “QTi” refers to the IPCA (Velasco
et al., 2010b). ..................................................................................................................... 170 Figure 6-3 “Evolution of phenol decomposition intermediates upon UV irradiation on
various materials investigated. (A) commercial titania and (B) carbon/titania composite”
(Velasco et al., 2010b). ...................................................................................................... 171 Figure 6-4 Adapted from Ao et al., (2008b): Diagram of degradation of 4-chlorphenol. (The
dark adsorption time (black line) of the IPCA is not shown in the original version). Initial
concentration of 100 mg/L is stated in the method section. ............................................... 173 Figure 6-5 “Degradation of phenol in aqueous solutions” (Ao et al., 2008a). .................. 174 Figure 6-6 Structure of famotidine. .................................................................................... 176 Figure 6-7 3D structure of famotidine. .............................................................................. 176
Figure 6-8 Structure of solifenacin. ................................................................................... 177 Figure 6-9 3D structure of solifenacin. .............................................................................. 177 Figure 6-10 Structure of amoxicillin. ................................................................................. 178 Figure 6-11 3D structure of amoxicillin. ........................................................................... 178
Figure 6-12 Photodegradation and removal of amoxicillin using AC, TiO2 and IPCAs.
Initial concentration 150 mg/L, catalyst concentration 1.5 g/L, 3 h dark adsorption time not
shown (Basha et al., 2011). ................................................................................................ 178 Figure 6-13 Structure of indomethacin. ............................................................................. 179 Figure 6-14 3D structure of indomethacin. ........................................................................ 179

xiii
Figure 6-15 Dark adsorption of indomethacin, followed by visible-light photocatalysis
kinetic plots for various IPCAs. Initial concentration at t = 0, 0.25 mmol, catalyst
concentration is 1.2 g/L. Data from Basha et al., (2010). .................................................. 180 Figure 6-16 Structure of cimetidine. .................................................................................. 183 Figure 6-17 3D structure of cimetidine. ............................................................................. 184
Figure 6-18 Structure of ranitidine. .................................................................................... 184 Figure 6-19 3D structure of ranitidine. .............................................................................. 184 Appendix C-0-1 Emission Spectra of UV-C (15 W) lamp ................................................ 232 Appendix C-0-2 Emission Spectra of UV-A/B (400 W) lamp .......................................... 232 Appendix C-0-3 Test certificate provided by the manufacture for the medium pressure Hg
lamp (TQ-150) used for all studies. ................................................................................... 233 Appendix C-0-4 Relative spectral energy distribution of Hg lamps. ................................. 234 Appendix C-0-5 Low pressure Hg. .................................................................................... 234 Appendix C-0-6 Medium pressure Hg. .............................................................................. 234
Appendix C-0-7 Spectral Irradiance of Arc-Discharge Lamps using 100 W Hg and 75 W
Xe lamp .............................................................................................................................. 235

xiv
LIST OF TABLES
Table 1-1 Most common Advanced oxidation technologies evaluated for water and
wastewater treatment. ............................................................................................................. 5 Table 1-2 Removal of selected compounds by GAC filtration in two water treatment plants
(Snyder et al., 2007). .............................................................................................................. 9 Table 1-3 Removal of selected pharmaceuticals using activated sludge type processes. .... 15 Table 1-4 Redox potential for oxidizing agents in water. .................................................... 25 Table 2-1 Source and description of materials and apparatus used. .................................... 58 Table 2-2 Activated carbon specification provided by manufacturer. ................................. 59
Table 3-1 FESEM, EDX analysis. All elements analysed (Normalised). All results in
atomic%................................................................................................................................ 84 Table 4-1 Sample adsorption values for TiO2 reported in the literature .............................. 95 Table 4-2 Features of adsorption studies ........................................................................... 104
Table 4-3 Kinetic parameters for adsorption of famotidine onto AC and IPCAs (first and
second stage studies) .......................................................................................................... 118
Table 4-4 Kinetic parameters for adsorption of solifenacin onto AC and 1:10 IPCA. ...... 125 Table 4-5 Calculated isotherm parameters for famotidine adsorption onto various IPCAs
and AC. .............................................................................................................................. 129 Table 4-6 Calculated isotherm parameters for solifenacin adsorption onto various IPCAs
and AC. .............................................................................................................................. 134
Table 4-7 Famotidine desorption after 1 adsorption cycle (concentration (mg/L)). .......... 138 Table 4-8 Famotidine desorption, 3 adsorption cycles (concentration (mg/L))................. 139
Table 4-9 Solifenacin desorption, 1 adsorption cycle (concentration (mg/L)). ................. 139 Table 4-10 Solifenacin desorption, 3 adsorption cycles (concentration (mg/L). ............... 140 Table 5-1 kapp values for photodegradation of famotidine using 1:100-1:2 IPCAs. .......... 152
Table 5-2 kapp values for photodegradation of famotidine using various IPCAs. .............. 157 Table 6-1 Chemical properties of APIs in IPCA photodegradation studies. ..................... 181
Table 6-2 Chemical properties of APIs used in past and future IPCA photodegradation
studies. ................................................................................................................................ 183

xv
ABBREVIATIONS
α Bangham equation constant
β Redlich and Peterson isotherm constant
AC Activated carbon
ACC Activated carbon cloth
ACE inhibitor Angiotensin-converting enzyme inhibitor
ACF Activated carbon fibres
AOT/AOP Advanced oxidation technology/process
API Active pharmaceutical ingredient
Aqua 2k AquaSorb 2000
Ar-p Redlich and Peterson isotherm constant
ASTM American Society for Testing and Materials
B Temkin energy constant
b Variation of adsorption energy (Temkin isotherm)
BOD Biochemical oxygen demand
C Concentration (at specific t (time))
Ci Concentration initial
C22h: Concentration of sorbate in solution after 22 h, mg/L
Cf Concentration final (after a given length of time)
C0 Concentration at t = 0
COD Chemical oxygen demand
CVD Chemical vapour deposition
DEET N,N-Diethyl-meta-toluamide
DI Deionised (water)
DO Dissolved oxygen
DOC Dissolved organic carbon
EAC Extruded activated carbon
EDC Endocrine disrupting chemical
EDX Energy dispersive X-ray
E2 17β-estradiol
EE2 17 β-ethinylestradiol
FESEM Field emission scanning electron microscopy
FTIR Fourier transform infrared spectrometer
GAC Granular activated carbon
HOP Hazardous organic pollutant
HPLC High performance liquid chromatography
IPCA Integrated photocatalytic adsorbents
IUPAC International Union of Pure and Applied Chemistry
kapp Apparent pseudo first-order rate constant

xvi
kb Bangham equation constant
kint Intraparticle diffusion rate constant
KF: Freundlich isotherm constant, l/g
Kf External mass transfer coefficient
KL: Langmuir isotherm equilibrium binding constant, l/mg
Kr-p Redlich and Peterson isotherm constant
LCA Life cycle assessment
LOD Limit of detection (HPLC)
LOQ Limit of quantification (HPLC)
LC-MS Liquid chromatography tandem mass spectrometry
Log Dow Log distribution coefficient (Log P at pH 7)
Log Pow Log partition coefficient octanol water
LPCVD Low pressure chemical vapour deposition
m: Number of experimental data points
MB Methylene blue
MBR Membrane bioreactor
MCPA 2-methyl-4-chlorophenoxyacetic acid
Min Minute
MOCVD Metal organic chemical vapour deposition
n: Exponent in Freundlich isotherm
NSAID Non-steroidal anti-inflammatory drug
NOM Natural organic material
p: Number of parameters in the sorption isotherm
pKa Logarithmic acid dissociation constant
P25 AEROXIDE® P25
PAC Powdered activated carbon
PAH Polycyclic aromatic hydrocarbon
PCBs Polychlorobiphenyls
PE Population equivalent (60g BOD/day)
pHf Final pH
pHi Initial pH
PMR Photocatalytic membrane reactors
PPCP Pharmaceutical and personal care products
PZC Point of zero charge
q Adsorption loading (final)
qf Adsorption final
qt Adsorption at a given time
q22h: Amount of sorbate adsorbed after 22 h, mg/g
qm: Maximum sorption capacity, mg/g
R: Universal gas constant, 8.314 J/mol/K

xvii
RSSCT Rapid small-scale column test
R2: Correlation coefficient
ROS Reactive oxygen species
SD Standard deviation
SE: Standard error
SEM Scanning electron microscopy
SOF Surface oxygen functionalities
SRT Solid retention times
SSE: Sum of squares error
t Time
TOC Total organic carbon
UV Ultra violet (Light)
UV-vis Ultra violet and visible (Light)
VUV Vacuum UV
WTP Water treatment plant
WWTP Waste water treatment plant
XRD X-ray diffraction

xviii
PUBLICATIONS, POSTERS AND ORAL PRESENTATIONS
Print publications
1) Keane, D., Basha, S., Nolan, K., Morrissey, A., Oelgemöller, M., Tobin, J. (2012)
“Overview of the development of Integrated PhotoCatalytic Adsorbents (IPCAs) for
water treatment using titanium dioxide (TiO2) and activated carbon” IN Griesbeck,
A., Oelgemoeller, M., Ghetti, F (eds.) CRC Handbook of Organic Photochemistry
and Photobiology, Third Edition. ed. Boca Raton, Florida, USA. CRC Press Llc
935-962.
Journal publications
1) Basha, S., Colin, B., Keane, D., Nolan, K., Morrissey, A., Oelgemöller, M., and
Tobin, J. M. (2011) On the adsorption/photodegradation of amoxicillin in aqueous
solutions by an integrated photocatalytic adsorbent (IPCA): experimental studies
and kinetics analysis. Photochemical and Photobiological sciences. 10, 1014-1022.
2) Keane, D., Basha, S., Nolan, K., Morrissey, A., Oelgemöller, M., Tobin, J. (2010)
Photodegradation of famotidine by integrated photocatalytic adsorbent (IPCA) and
kinetic study. Catalysis Letters. 144, 300 - 308.
3) Basha, S., Keane, D., Nolan, K., Morrissey, A., Oelgemöller, M., Tobin, J. (2010)
Studies on the Adsorption and Kinetics of Photodegradation of Pharmaceutical
Compound, Indomethacin Using Novel Photocatalytic Adsorbents (IPCAs).
Industrial & Engineering Chemical Research. 49, 11302 - 11309.
Oral presentations
1) Development of novel integrated photocatalytic adsorbents (IPCAs) for hazardous
organics removal from water & wastewater. Photochemistry and Photochemical
Techniques in University College Dublin and Trinity College Dublin. 16-18th
May
2011.
2) Removal of famotidine from aqueous solutions by novel integrated photocatalytic
adsorbents (IPCAs). 3rd
School of Biotechnology research day in DCU. 28th
January
2011.
3) Removal of famotidine from aqueous solutions by novel integrated photocatalytic
adsorbents. Environ 2010 colloquium in Limerick I.T. 18th
February 2010.
Posters
1) IWA World Congress on Water, Climate and Energy 2012 in the Convention Centre
Dublin 13-18th
May 2012.
2) Environ 2012 colloquium in University College Dublin 7-9th
March 2012.
3) Environ 2011 colloquium in University College Cork 6-8th
April 2011.
4) EPA Post-graduate Seminar 2010 in Convention Centre, Dublin. 11th
November
2010.
5) EPA National Research Conference 2010 in Croke Park Conference centre, Dublin.
23rd
June 2010.
6) Environ 2009 colloquium in Waterford I.T. 19-21st
February 2009.
7) School of Biotechnology research day in DCU. 30th
January 2009.
8) EPA Fellowships & Scholarships Seminar 2008. 13th
November 2008.

1
Chapter 1 Literature Review

2
1.1 Pharmaceuticals in natural waters, drinking water and
wastewater - approaches for their removal
Pharmaceuticals in surface waters, wastewaters and drinking waters are an issue of
growing concern (Gültekin and Ince, 2007, Khetan and Collins, 2007, Oulton et al., 2010,
Parson, Jefferson and Christopher, 2007, von Gunten and Hoigne, 1994). This concern was
triggered after the occurrence of pharmaceuticals in river water was linked to feminisation
of fish living downstream of wastewater treatment plant (WWTP) outfalls (Ternes et al.,
1999). The overall impact of such discharges on fish populations is uncertain and the risks
to other biota are still being accessed (Mills and Chichester, 2005).
Sources of pharmaceuticals in the environment include municipal WWTPs,
WWTPs of pharmaceutical production facilities, hospital effluent, agricultural run-off, land
spreading of sewage sludge, aquaculture, landfills and even graveyards (Khetan and
Collins, 2007, Mompelat et al., 2009) (Figure 1-1). The metabolism of active
pharmaceutical ingredients varies greatly from 98 % for carbamazepine, diazepam and
propranolol to less than 25 % for valsartan, sotalol and amoxicillin (Mompelat et al., 2009).
The unmetabolised active pharmaceutical ingredients (APIs) is excreted in feces or urine
which is disposed via the sewer system. Hence the most investigated route of entry of
pharmaceuticals into the environment is through municipal wastewater treatment plants
where the APIs are the most concentrated. Human excretion of unchanged or slightly
transformed APIs, conjugated to polar molecules such as glucuronides enters WWTPs and
may be cleaved, releasing the original API into the environment (Heberer, 2002).
Consequently numerous studies have investigated the removal efficiencies of
pharmaceuticals at municipal WWTPs in particular activated sludge plants as it is the
dominant technology (Castiglioni et al., 2006, Kasprzyk-Hordern et al., 2009, Phillips et
al., 2010, Radjenović et al., 2009, Watkinson et al., 2007). Routine monitoring of the levels
of APIs released from WWTPs is largely neglected by regulatory authorities (Verlicchi et
al., 2012) as the importance of such releases for humans and biota has not been fully
established (Deegan, 2011, Enick and Moore, 2007).

3
Pharmaceutical production plantRelease to the environment
or municipal/industrial sewer
Environment
Waste water treatment plant
Active pharmaceutical ingredient
Aquaculture
Agricultural runoff
Human waste Improper pharmaceutical
disposal
Hospital waste
Figure 1-1 Flow chart of pharmaceutical entry into the environment.
One of the most cited examples of the dangers of pharmaceuticals in the
environment is the effect of diclofenac, a non-steroidal anti-inflammatory drug (NSAID) on
the populations of long-billed vulture (Gyps indicus), oriental white-backed vulture, (Gyps
bengalensis) and slender-billed vulture (Gyps tenuirostris) on the Indian subcontinent. In
the period 1992–2007 the populations of the former two declined by 96.8 % and 99.9 %
respectively (Markandya et al., 2008) and similar declines occurred in the slender-billed
vulture (Gyps tenuirostris). Post-mortem examinations on 259 adult and sub-adult oriental
white-backed vultures found that 85 % showed evidence of renal failure (Oaks et al., 2004).
Tests for diclofenac residue found concentrations of diclofenac (0.051 μg/g – 0.643 μg/g) in
the 100 % of the vultures that died of renal failure, while no diclofenac was found in
vultures that died from other causes. These concentrations were high enough to trigger
renal failure in vultures that were orally administered diclofenac in a control study.
Diclofenac was prescribed for veterinary use on livestock due to its analgesic, anti-
inflammatory and antipyretic properties.
The decline of the vulture populations is not just a loss for ecosystems. The human
health and economic losses resulting for the vulture population decline have been

4
investigated (Markandya et al., 2008). In India vultures are typically used to dispose of
animal carcasses. The vulture’s absence means that the animal remains become a breeding
ground for disease and are eaten (incompletely) by other scavengers such as dogs.
Markandya et al., uses a series of crude estimates to determine how many extra feral dogs
the uneaten carcasses could support. Based on the number of rabies cases from dog bites
per dog multiplied by the increase in the hypothetical dog population the author is able to
calculate the human health impact and resulting economic cost. The cost spread over the 14
years of vulture decline (1993–2006) would amount to about $34 billion, using the average
exchange rates during that time. The total number of human rabies cases remained constant
(or declining slightly) in this time period therefore this assessment is counterfactual to the
decline of vulture populations. This makes the projected economic cost speculative.
While the previous example is well characterised, accurately determining all the
hazards (hence risks) associated with APIs in the environment is difficult as it is impossible
to provide unequivocal safety data for every chemical, every chemical composition, every
specific situation and exposed species (Enick and Moore, 2007). With this in mind the
precautionary principal should be exercised and the exposure of humans and biota to APIs
limited. However, this approach lacks of scientific rigor as it can be evoked with a small or
nonexistent burden of proof. The advantages and limitations of the application of this
principle is discussed elsewhere (Enick and Moore, 2007).
1.1.1 Removal of pharmaceuticals from drinking water
Pharmaceuticals have been detected in drinking water but are not as well
documented as APIs in wastewater or natural waters (Mompelat et al., 2009). This is due to
lower quantities of APIs in the raw water used for drinking water abstraction (compared to
wastewater), more efficient removal by water treatment processes and the breakdown of
APIs caused by residual chlorine in the water distribution system (Gibs et al., 2007).
However some APIs are present in drinking water at detectable levels and the approaches
used to remove them are not without limitations. One solution to the removal of APIs from
drinking water and natural waters is the use of advanced oxidation technologies. Advanced
oxidation technologies are defined as the “in situ generation of highly reactive species”
(Gültekin and Ince, 2007) or “near ambient temperature treatment processes based on

5
highly reactive radicals, especially the hydroxyl radical (•OH), as the primary oxidant”
(Zhou and Smith, 2002). The promise of advanced oxidation technologies is that they will
deliver superior performance to conventional technologies and thus be able to clean water
to a higher standard. A brief list of the advanced oxidative technologies (also called
advanced oxidative processes) is contained in Table 1-1. It is not possible to review every
type of advanced oxidation technology for removal of APIs and/or other micro pollutants as
they are very diverse and can be combined with conventional and/or novel water treatment
techniques to yield optimum results. The advanced oxidation technologies listed in Table
1-1 can be used in isolation or they can be combined together e.g. UV/H2O2 and
photocatalysis.
Table 1-1 Most common Advanced oxidation technologies evaluated for water and
wastewater treatment.
Photochemical processes Non-photochemical processes
UV oxidative process O3, O3/H2O2
UV/H2O2 Fenton reagent
UV/O3 Ultrasound
UV/H2O2/O3 US/H2O2, US/O3, US/Fenton
UV/Ultrasound Electrochemical oxidation
Photo-Fenton Supercritical water oxidation
Photocatalysis Ionizing radiation
Sonophotocatalysis Electron-beam irradiation
Vacuum UV (VUV) Wet-air oxidation
Microwave Pulsed plasma
Source: (Gültekin and Ince, 2007). Combinations of the above processes are possible.
A study of raw water into a municipal water treatment plant (WTP) found 35 out of
55 pharmaceuticals investigated, at detectable concentrations (Huerta-Fontela et al., 2011).
The raw water was pre-chlorinated which was effective at removing >99 % of some
compounds (e.g. amlodipine and tamoxifen) particularly those with primary and secondary
amines. Other compounds such as atenolol were barely (<5 %) removed by this step. This
was followed by flocculation (poly-DADMAC), sand filtration and sedimentation. Of the
18 APIs remaining in the water at this stage the overall removal was <30 % and in other

6
cases (e.g. carbamazepine) it was negligible. Ozonation (5 mg/L) had effectiveness between
5 % and >99 % and the author notes that non-biodegradable carbamazepine was removed
by >99 %. The water was then passed through granular activated carbon (GAC) filtration.
Removal efficiencies of 55 % -75 % were influenced by the hydrophobicity of the molecule
with greater removal seen in more hydrophobic compounds. Post-chlorination removed
between 14 % and 72 % of the APIs in solution and the removal of individual compounds
corresponded to what occurred in pre-chlorination. Of the 35 APIs in the raw water only
five were found in the finished water at much lower concentrations. This indicates that
conventional water treatment can remove APIs from drinking water but the process is not
100 % effective and is complex, as ozonation, GAC filtration and two cycles of
chlorination were required. The paper does not discuss if the treatment processes could be
improved or if the current treatment configuration could be optimized. The GAC might
need frequent regeneration or require a longer hydraulic retention time to remove such low
concentrations of APIs.
In another study a river receiving effluent from agricultural sources as well as 12
WWTPs was passed through a pilot-scale WTP and the removal of APIs investigated
(Vieno et al., 2007). The WTP consisted of coagulation (ferric sulfate), flocculation,
vertical sedimentation, rapid sand filtration, ozonation and filtration through two GAC beds
and UV disinfection. Coagulation, flocculation, and sand filtration were found to reduce the
API concentration by 5 % to 35 % depending on the molecule. Ozonation (1 mg/L - 1.3
mg/L) was found to be very effective removing 75 % - 92 % of some APIs (naproxen and
ibuprofen) in solution, although due to its selective oxidation, ozone creates degradation
byproducts which may pose a problem. GAC filtration was found to be effective at API
removal both after ozonation and when the ozonation step was bypassed. Efficient GAC
performance required regular regeneration of the carbon. UV disinfection was used as a
final step; however, since most of the APIs were removed by the preceding steps it did not
give much insight into the overall performance of this method. Only ciprofloxacin was
found to pass almost unaffected through the WTP. The concentration of ciprofloxacin (20
ng/L) in drinking water over lifetime ingestion (2 L water/day for 70 years) would lead to
lifetime consumption of approximately one milligram of ciprofloxacin. This is 1000 times
lower than the 1000 mg oral daily therapeutic dose of ciprofloxacin. This calculation
ignores the effects caused by chronic exposure to low concentrations of pharmaceuticals
over a long period of time.

7
The previously reviewed studies used GAC for the removal of APIs; however
powdered activated carbon (PAC) is also an option for removing APIs. The use of PAC for
removing APIs and other micro-pollutants from spiked surface water has been investigated
using jar and column tests (Snyder et al., 2007). The pollutant removal was measured by 5
h jar tests of spiked surface water and a pilot plant using a 5 h contact time. In both cases it
was 4 h of contact time and 1 h of settling. Jar tests removed between 15 % (ibuprofen) to
>90 % (pyrene, a PAH) of the pollutants in solution indicating that PAC can remove APIs
but with the disadvantage of high contact time. At pilot scale, two PAC doses were selected
with 4 h contact time followed by coagulation. Five milligrams per litre of PAC removed 3
% (iopromide) to 80 % (oxybenzone) of the pollutants while a PAC dose of 35 mg/L
substantially increased the removal of some APIs e.g. iopromide removal increased from 3
% to 68 %. The enhanced removal at a 35 mg/L PAC dose was not as pronounced for other
APIs e.g. oxybenzone removal went from 80 % to 100 %. This highlights that the cost
effectiveness of this method depends on what pollutant was to be removed as this
requirement influences the PAC dosing rates. It is possible that the selection of a different
PAC might remove the pollutants more efficiently. An increased contact time might
increase effectiveness but the 5 h period is standard for this type of treatment. Cost can be
an issue as PAC is typically single use and consequently it is not recovered and
regenerated. The long contact times and possible need for a batch system / coagulation also
adds to system complexity which must be considered when using PAC compared to a fixed
bed GAC system. In addition to PAC several GACs were investigated using the rapid
small-scale column test (Snyder et al., 2007). This test used spiked influent which passed
through a column filled with GAC and then calculated how many bed volumes are filtered
effectively before there is 5 %, 10 % and 20 % break through (see Figure 1-2). For example
5 % breakthrough occurs when 5 % of the concentration in the influent is found in the
effluent. The influent treated before 5 % breakthrough occurred varied from 3090 bed
volumes (sulfamethoxazole) to >55,000 bed volumes (oxybenzone). This is important as a
particular AC may preferentially remove one API over another but the requirement for API
free drinking water and hence regeneration will be decided by the first compound to
breakthrough a GAC bed.
In combination with the above bench scale laboratory studies the API removal
performance of two WTPs employing GAC filtration was investigated (Snyder et al.,
2007). WTP1 was a surface water treatment facility while WTP2 was a water reuse

8
treatment facility. No information was given on the treatment steps preceding the GAC
beds; presumably it would have consisted of screening, flocculation and sand filtration. The
GAC in WTP1 was regularly regenerated while the GAC in WTP2 was not. The removal
rates for different pollutants and the results for each WTP are shown in Table 1-2. The
removal of pollutants was minimal for WTP2 even when influent concentrations were low,
although it is difficult to make a direct comparison as different pollutant and pollutant
concentrations occurred at each plant. In the case of atrazine (a pesticide) for WPT1 the
concentration was reduced from 182.5 ng/L to 72 ng/L while for WPT2 it was reduced
from 33 ng/L to 32 ng/L. This highlights the importance of regular regeneration of the AC
for efficient API removal.
Be
d d
ep
th
Equilibrium zone
(saturated)
Mass transfer
zone (area of
adsorption)
Unused
carbon
Influent
Effluent
Influent
Effluent
Breakthrough
Figure 1-2 Diagram of a GAC bed gradually becoming saturated leading to break
through (Moreno-Castilla, 2004).

9
Table 1-2 Removal of selected compounds by GAC filtration in two water treatment
plants (Snyder et al., 2007).
Group API GAC influent (ng/L) GAC effluent (ng/L)
Analgesic, antipyretic Acetaminophen WPT1 10,650 47
Analgesic, antitussive Hydrocodone WTP1 57 <25
NSAID Ibuprofen WTP1 1.1 <1
WTP2 8760 7325
Antibiotic Erythromycin-H2O WPT1 1.8 <1
WPT2 139 128
Analgesic, NSAID Diclofenac WPT2 3.2 <1
NSAID Naproxen WTP1 3545 3320
Antibiotic Sulfamethoxazole WTP1 6 <1
WTP2 426 69
WPT2 33 32
Antibiotic, antifungal Triclosan WTP2 3.8 4.2
Antibiotic Trimethoprim WTP2 135 48
Anticonvulsant Carbamazepine WPT1 2.2 <1
WPT2 199 168
WPT2 42,650 35,700
Antiepileptic Dilantin (Phenytoin) WPT1 1.8 <1
WPT2 110 85
Anxiolytic Meprobamate WTP 1 1.2 <1
WTP 2 226 196
Contrast medium (x-ray) Iopromide WTP1 3.3 <1
Fibrates (anti lipid) Gemfibrozil WPT1 1.2 <1
Herbicide Atrazine WPT1 650 6.1
WTP2 5 1.4
Herbicide Metolachlor WTP 1122 <10
Hormone Androstenedione WPT1 182.5 72
WTP2 3710 3405
Hormone Testosterone WTP2 150.5 39
Insect repellents DEET WTP1 1.8 <1
Phosphodiesterase
inhibitor
Pentoxifylline (improves
blood flow)
WTP2 34 <25
Stimulant Caffeine WPT1 17 <10
DEET: N,N-Diethyl-meta-toluamide

10
In a similar study to Snyder et al., (2007), APIs removal by laboratory studies and
in two full-scale WTP was investigated (Ternes et al., 2002). The APIs (bezafibrate,
clofibric acid, diclofenac, carbamazepine and primidone) were investigated for
biodegradation and sorption in bench scale studies. Only a small reduction in the
concentration of APIs occurred due to biodegradation and sorption in bench tests, although
in typical water treatment conditions higher removal might occur. Pilot and bench scale
tests for API removal sometimes worked better than full scale facilities due to lower
complexity of the bench scale systems.
Two full scale WTPs treating surface water were studied (Ternes et al., 2002).
WTP1 used pre-ozonation, flocculation, ozonation and GAC filtration while WPT2 used
flocculation and GAC filtration and separately performs artificial groundwater recharge
using bank filtration and slow sand filtration. In contrast to Snyder et al., (2007) the API
removal at each stage of the process was measured. Initial visits to WTP1 and WTP2
investigated the removal of clofibric acid (herbicide and metabolite clofibrate), diclofenac
and carbamazepine. Flocculation was ineffective for both WTPs as no observable removal
occurred. In WTP1 pre-ozonation removed >90 % carbamazepine, reduced diclofenac
below the limit of quantification (LOQ) but had no effect on clofibric acid. Main ozonation
reduced carbamazepine below the LOQ and halved the clofibric acid concentration. The
final GAC filtration removed any clofibric acid below the LOQ. In WTP2 the influent from
flocculation was filtered using GAC which reduced the carbamazepine and diclofenac
below the LOQ while the clofibric acid concentration was halved. This is significant as it
demonstrates that a GAC can achieve equivalent performance to ozonation (the DOC
values for WTP1 and WTP2 were similar). A subsequent test of WPT2 later in the year
showed API concentrations in the effluent twice that of the earlier study. The GAC
removed all of the diclofenac and >90 % removal of carbamazepine at this higher
concentration.
Perozonation (O3/H2O2) is an AOP for API removal. The H2O2 addition is intended
to increase the •OH production from O3 and thus act as an unselective oxidant to
complement the specific oxidation properties of O3 which target unsaturated hydrocarbons
and electron transfer reactions (e.g. reactions with phenolate ions). A comparison of O3 and
O3/H2O2 for API degradation (clofibric acid, ibuprofen and diclofenac) removal in surface
water has been studied (Zwiener and Frimmel, 2000). Both river and deionised water were
used to investigate the pollutant removal and different ratios and gradually rising
11
concentrations of O3: H2O2 were investigated. Degradation of diclofenac was effective at
low O3 concentrations but there was very little degradation of clofibric acid and Ibuprofen.
The addition of H2O2 to the O3 increased API removal significantly. At the highest
concentration of O3 and H2O2 (5 mg/L and 1.8 mg/L) >98 % of all the pollutants were
degraded, indicating that the O3/H2O2 combination can be very effective for degradation in
a natural water matrix typically used for preparing drinking water. A feature of note was
that the effective O3 dose was the same as the dissolved organic carbon concentration in the
water indicating that dissolved organic carbon was being oxidized by the O3. The paper did
not discuss the cost associated with the use of H2O2 which would increase treatment cost
and might not be cost effective if it did not promote more efficient use of the O3.
1.1.2 Removal of pharmaceuticals from wastewater
Literature on the release of APIs into the environment is focused on APIs in effluent
from municipal wastewater. APIs in this effluent are the main source of APIs in surface
water. A schematic of a typical wastewater treatment process is shown in Figure 1-3. This
consists of a primary treatment or screening stage where large debris and grit are removed.
This step may also include fat oils and grease removal, pH adjustment, hydraulic flow
equalization, temperature adjustment and an initial sedimentation stage depending on local
plant conditions/requirements. Secondary treatment is designed to lower the biological
content of the wastewater: biological oxygen demand (BOD). The most common type of
secondary wastewater treatment is activated sludge type processes. The wastewater flows to
an aeration tank containing microorganisms that oxidise the wastewater. This suspension is
then pumped to a settling tank where the microorganisms settle and are removed as sludge
or re-circulated back into the aeration tank. The super latent from the settling tank is
discharged or flows to a tertiary treatment step where nutrients and/or micro-pollutants are
removed. At this stage AOPs could be used to remove APIs.

12
Inle
t scree
n
Grid
removalAeration tank
Final
settlement
(Clarification)
Influent Effluent
Nutrient
removalEffluent
UV
disinfectionEffluent
GAC/AOTs Effluent
Primary treatment
(Solids removal)
Te
rtiary
trea
tme
nt
And/or
Secondary (biological) treatment
Waste activated sludge
Sludge treatment
Return AS
Figure 1-3 Diagram of typical activated sludge WWTP process with treatment stages
indicated (Grover et al., 2011).
A critical review of API removal by different water treatment technologies analysed
over 40 published studies on 100 pilot- and full-scale WWTPs or treatment configurations
Oulton et al., (2010). The review included 140 compounds with 1500 data points related to
site specific pharmaceutical and personal care products (PPCP) concentrations in the
influents and effluents of specific treatment processes. The analysis included plants that
used conventional activated sludge and other unconventional designs; membrane
bioreactors (MBRs), sand filtration, ultra-, micro-, and nano-filtration, reverse osmosis,
activated carbon, and chemical oxidation via ozonation for water treatment. Treatment
efficiencies varied for APIs, for example, in conventional treatment ibuprofen was removed
by greater than 1-log10 (90 %); in contrast antiepileptic carbamazepine is barely removed as
influent and effluent concentrations are almost identical. Removal efficiency also varies
between technologies. Conventional activated sludge demonstrated an average removal rate
of 61 % for all APIs. Proponents of MBR technology claim it offers significant
improvement compared to activated sludge with an average API removal rate of 86 %.
However these results vary significantly between studies and range of values of these
systems is the same as activated sludge (Verlicchi et al., 2012). Even if MBR does not
remove more APIs, they possess other advantages such as higher solids removal and high
solid retention times (SRT) within compact reactor volumes which improves pollutant
removal (Clara et al., 2005).

13
Technologies intended as a tertiary “polishing” step after primary and secondary
treatments were also reviewed by Oulton et al., (2010). Ozonation is effective for API
removal in a wastewater matrix and can degrade species such as carbamazepine which are
recalcitrant to conventional biological degradation. Activated carbon (AC) has not been
used for treating raw wastewater as it would become saturated very quickly with the
organic matter in the wastewater. The results surveyed were from a test facility treating
high total organic carbon (TOC) wastewater. AC was successful at removing APIs in this
matrix but performance hinged on the use of fresh AC with frequent regeneration. Removal
by membrane technologies varied depending on membrane type. Microfiltration
membranes outperformed ultrafiltration membranes, while nanofiltration and reverse
osmosis performed the best with average removal rates >98 %. The issue of membrane
fouling and the treatment of concentrates (the rejected water containing a higher
concentration of pollutants and minerals) were not investigated. In contrast, ultrafiltration
was found to have low effectiveness as studies using it removed on average >15 % of the
APIs in the influent as the pores of these membranes are too large to exclude APIs. The
results showing that microfiltration is better than ultrafiltration appear contradictory;
however, this is like due to the low number of studies for these technologies.
While Oulton et al., (2010) provides a broad overview it is necessary to look more
closely at specific studies to get an idea of the different levels of pharmaceutical removal in
a variety of settings and WWTPs. Table 1-3 details a selection of studies investigating
removal rates of APIs in WWTPs. In some cases the concentration of API in the effluent is
higher than the influent which can be caused by several effects, some of which are
described below. API loads into a WTTP will vary depending on the time of day, day to
day and season to season. Given that a WWTP may have a hydraulic retention time (HRT)
of many hours, an increase in APIs in the influent would not appear in the effluent for some
time and possibly not during the sampling period and vice versa. A composite sample
might reduce this risk but only if the flow of the API into the WWTP is constant over the
sampling period. Matrix effects can also influence the relative concentrations of compounds
in the influent and effluent. Most mass spectrometry studies use electrospray ionisation to
transfer the compound of interest into the gas phase and to charge the analyte if it is not
already in a charged state. Matrix effects “are the alteration of ionization efficiency by the
presence of coeluting substances” and cause signal suppression making the concentration
of analyte appear lower than it is (Taylor, 2005). The results will be affected by the

14
different matrix in the effluent compared to the influent. Sample treatment is also an issue.
The influent will contain a larger amount of solids than the effluent and filtering the
samples may remove API that is adsorbed onto the solids. A compound may not appear in
the influent because it has been conjugated during metabolism and can then be cleaved to
release the parent compound during the wastewater treatment process (Lacey et al., 2008).
The removal efficiencies of WWTPs vary between study and analyte. It is necessary
to consider the details of several studies to appreciate these differences (Table 1-3). Several
typical studies are discussed below. Six Italian activated sludge WWTPs were studied for
the removal of APIs using 24h composite samples (Castiglioni et al., 2006). An API load
was determined by analyzing for 26 APIs, normalisied and expressed as g/day/1000
inhabitants. Removal efficiencies varied from <0 i.e. the API load in the effluent was
higher than the influent - to 64 % removal, but were generally <40 %.
The treatment of influent by a pilot scale MBR and a municipal activated sludge
WWTP (WWTP1) with nitrification and denitrification capability was investigated (Clara
et al., 2005). Two other plants were included for comparison: a highly loaded plant used for
reducing carbonaceous (BOD) loading only (WWTP2) and a low-loaded plant designed for
nutrient removal (WWTP3). Comparable effluent API concentrations and removal rates
were observed in the conventional WWTPs and the MBR. The total removal rates varied
between APIs (Table 1-3). The carbamazepine concentration was not reduced while
ibuprofen and bezafibrate were reduced by greater than 90 % but this removal rate varied
between WWTPs.
In an Irish context APIs have been sampled in three municipal WWTPs in the
greater Dublin area with population equivalents (PE) of 60,000, 90,000 and 1.7 million
(Lacey et al., 2008). The range of APIs found in both the influent and effluent is reported in
Table 1-3. Of the 20 APIs investigated, 10 could be detected above the limit of
quantification (LOQ) in the influent and 9 in the effluent. Nimesulide, indomethacin,
gemfibrozil, trimethoprim and clotrimazole are detected in both the influent and effluent
while the other APIs appear either in the influent or the effluent but not both. This study
demonstrates that APIs are emerging pollutants in an Irish context and that biological
processes in the WWTP can alter APIs metabolites during wastewater treatment releasing
the parent (unmodified) APIs in WWTP effluent.

15
Table 1-3 Removal of selected pharmaceuticals using activated sludge type processes.
Pharmaceutical
class Pharmaceutical
Median influent
(ng/L)
Mean influent
(ng/L)
Median effluent
(ng/L)
Mean effluent
(ng/L) Reference
Antibiotics Amoxicillin 190 n.d. (Watkinson et al., 2007)
13 mg/d/1000 pop n.d. (Castiglioni et al., 2006)
Cefaclor 500 n.d. (Watkinson et al., 2007)
Cephalexin 4600 n.d. (Watkinson et al., 2007)
Ciprofloxacin 3800 640 (Watkinson et al., 2007)
259 mg/d/1000 pop 97 mg/d/1000 pop (Castiglioni et al., 2006)
Clarithromycin 21 mg/d/1000 pop 55 mg/d/1000 popa (Castiglioni et al., 2006)
Clindomycin 2 5 (Watkinson et al., 2007)
Enrofloxacin 10 10 (Watkinson et al., 2007)
Lincomycin 3.4 mg/d/1000 pop 5.4 mg/d/1000 popa (Castiglioni et al., 2006)
60 50 (Watkinson et al., 2007)
Monensin 10 25 a (Watkinson et al., 2007)
Nalidixic acid n.d. 55 a (Watkinson et al., 2007)
Norfloxacin 170 25 (Watkinson et al., 2007)
Ofloxacin 360 mg/d/1000 pop 233 mg/d/1000 pop (Castiglioni et al., 2006)
Penicillin V 50 30 (Watkinson et al., 2007)
Roxithromycin WWTP1: 69 31 (Clara et al., 2005)
WWTP2: 78 57 (Clara et al., 2005)
WWTP3: 25 45 (Clara et al., 2005)
Spiramysin 4.8 mg/d/1000 pop 35 mg/d/1000 pop (Castiglioni et al., 2006)
Sulfamethoxazole n.d. <166-<553 a
*(Lacey et al., 2008)
65 mg/d/1000 pop 10 mg/d/1000 pop (Castiglioni et al., 2006)
360 270 (Watkinson et al., 2007)
145 50 (Clara et al., 2005)
Sulphathiazole 2 n.d. (Watkinson et al., 2007)
Trimethoprim <171-< 57 <67-<360 *(Lacey et al., 2008)

16
Pharmaceutical
class Pharmaceutical
Median influent
(ng/L)
Mean influent
(ng/L)
Median effluent
(ng/L)
Mean effluent
(ng/L) Reference
Antibiotics Trimethoprim 340 50 (Watkinson et al., 2007)
Lipid regulators Gemfibrozil <26-<86 <32-<330 *(Lacey et al., 2008)
Bezafibrate WWTP1: 1960 n.d. (Clara et al., 2005)
WWTP2: 7600 4800
WWTP3: 1550 715
50 mg/d/1000 pop 29mg/d/1000 pop Castiglioni et al., 2006
Clofibric acid <222-<740 n.d. *(Lacey et al., 2008)
Antiepileptics Carbamazepine n.d. <163–<881a *(Lacey et al., 2008)
12 mg/d/1000 pop 28mg/d/1000 pop (Castiglioni et al., 2006)
WWTP1: 1850 1594 (Clara et al., 2005)
WWTP2: 670 690
WWTP3: 325 465
Pre-GAC 70ng/L 50ng/L (Grover et al., 2011)
Antiphlogistics Diclofenac n.d. <743-<2478 *(Lacey et al., 2008)
(NSAID) WWTP1: 3250 1536 (Clara et al., 2005)
WWTP2: 1400 1300
WWTP3: 905 780
Pre-GAC 12 ng/L <LOD (Grover et al., 2011)
Ibuprofen WWTP1: 1480 nd (Clara et al., 2005)
WWTP2: 2300 2400
WWTP3: 1200 24
< 760-3204 n.d. *(Lacey et al., 2008)
122 mg/d/1000 pop 28 mg/d/1000 pop (Castiglioni et al., 2006)
Antispasmodic Mebeverine Pre-GAC 38 ng/L 5 ng/L (Grover et al., 2011)
β-Blockers Atenolol 494 mg/d/1000 pop 281 mg/d/1000 pop (Castiglioni et al., 2006)
Propranolol Pre-GAC 50 ng/L 40 ng/L (Grover et al., 2011)
Keratolytic† Salicylic acid 351–9172 <115 *(Lacey et al., 2008)

17
Pharmaceutical
class Pharmaceutical
Median influent
(ng/L)
Mean influent
(ng/L)
Median effluent
(ng/L)
Mean effluent
(ng/L) Reference
Diuretic Furosemide <313–490 n.d. a
*(Lacey et al., 2008)
277 mg/d/1000 pop 195 mg/d/1000 pop (Castiglioni et al., 2006)
Hydrochlorothiazide 354 mg/d/1000 pop 415 mg/d/1000 pop (Castiglioni et al., 2006)
Statins Pravastatin <72–<239 n.d. a
*(Lacey et al., 2008)
NSAID Nimesulide <2–441 <3–450 *(Lacey et al., 2008)
Indomethcin <263–<877 <238–<792 *(Lacey et al., 2008)
Pre-GAC 8 ng/L <LOD (Grover et al., 2011)
Mefenamic n.d. 540–1050 a *(Lacey et al., 2008)
Antifungal Clotrimazole <34–232 34–475 *(Lacey et al., 2008)
ACE inhibitor Enalapril 31 mg/d/1000 pop 1.2 mg/d/1000 pop (Castiglioni et al., 2006)
Hormone Estrone 5.4 mg/d/1000 pop 6.4 mg/d/1000 pop (Castiglioni et al., 2006)
Estrone Pre-GAC 2 ng/L 1 ng/L (Grover et al., 2011)
17β-estradiol Pre-GAC 2 ng/L <LOD
17 β –
ethinylestradiol
Pre-GAC 1 ng/L
<LOD
H2 receptor
antagonists Ranitidine 188 mg/d/1000 pop
96 mg/d/1000 pop
(Castiglioni et al., 2006)
β2-adrenergic
receptor agonist Salbutamol 4.3 mg/d/1000 pop
4 mg/d/1000 pop
(Castiglioni et al., 2006)
Contrast medium Iopromide WWTP2: 3840 5060 (Clara et al., 2005)
WWTP3: 26 250
Concentrations of APIs in effluent greater than influent due to matrix and other effects.
n.d.: not detected, Pop: population.
*The values from Lacey et al. (2008) are maximum and minimum values. An “<” bracket indicates that the value is below the LOD, while a second “<”
bracket indicates that the concentration is below the LOQ.
† skin peeling agent

18
Pharmaceutical production facilities are a poorly investigated source of APIs
in the environment either from outlets at WWTPs attached to the production facility
or via discharges from the production facility into sewers which flow into municipal
WWTPs (Deegan, 2011, Enick and Moore, 2007, Phillips et al., 2010). This
wastewater presents a challenging composition as it can contain solvents, catalysts,
reactants, some intermediates, raw materials and APIs (Sreekanth et al., 2009). It
might also have high COD, high BOD and high COD: BOD ratio, extremes of pH and
the presence of toxic compounds e.g. cyanide (Suman Raj and Anjaneyulu, 2005).
Regulation of the production facility varies between countries and centred around the
quality of the wastewater before it is permitted to be released. In the US and Europe
the majority of discharge licences focus on BOD, COD, suspended solids and pH
without any control on the release of specific APIs, intermediates, raw materials or
other recalcitrant substances (Joakim Larsson and Fick, 2009). Ireland appears to be
the only jurisdiction where specific regulatory limits have been established for APIs
(estrogentic compounds) (Helmig et al., 2005). These regulatory licence limits
focused on endocrine disrupting chemicals (EDCs) such as estrone, ethinyl estradiol
and 17-β-estradiol. The presence of other APIs remains largely unmonitored.
An AS WWTP using GAC filtration as a polishing step has been investigated
(Grover et al., 2011). The presence of steroidal estrogens (17β-estradiol and 17 β-
ethinylestradiol) and five APIs was examined before and after treatment by a GAC
filter system. The concentrations of APIs in pre- and post-GAC treatment are shown
in Table 1-3. The removal of the estrogens was very effective; however the removal
of the APIs varied. Diclofenac and indomethacin were reduced by 98 % while
propranolol and carbamazepine were reduced by 17 % and 23 % respectively.
However, the study did have the opportunity to sample the river downstream of the
WWTP before and after the addition of the GAC plant. The concentration of
estrogens and APIs in the water downstream (after accounting for dilution) dropped in
the same proportions as they were removed by the GAC although there was a lag
(approximately three months) for some molecules e.g. estrone as they took a longer
time to degrade or be washed away.
The influent and effluent of a pharmaceuticals wastewater treatment plant
were sampled and analysed for the APIs manufactured in the pharmaceutical
production facility that it served: famotidine, solifenacin succinate and tamsulosin
hydrochloride (Deegan, 2011). Twice weekly samples were taken over a twenty six

19
week period and analysed for the three APIs. Famotidine, solifenacin succinate and
tamsulosin hydrochloride were detected in the 85 %, 65 % and 88 % of the influent
samples respectively. The average concentration of famotidine, solifenacin and
tamsulosin in the influent was 1.6 mg/L, 0.039 mg/L and 0.005 mg/L and effluent
concentrations were 2.6 mg/L, 0.004 mg/L and 0.028 mg/L respectively. The effluents
are discharged into the municipal sewer for further treatment at a municipal WWTP.
The treatment options for pharmaceutical industry wastewater are reviewed elsewhere
(Deegan et al., 2011).
The Fenton reaction has been studied extensively for wastewater treatment
(Comninellis et al., 2008, Sirtori et al., 2009). The Fenton process (Neyens and
Baeyens, 2003) consists of the generation of hydroxyl radicals (•OH) by the reaction
between ferrous ions and H2O2 (Fenton’s reagent), according to eq (1).
OHOHFeOHFe3
22
2 (1)
Light also reacts with H2O2 to create hydroxyl radicals:
2OHhν
OH 22 (2)
In a photo-Fenton reaction light adsorption aids the conversion of Fe3+
back to Fe2+
which also creates additional •OH.
OHHFehν
OHFe2
2
3 (3)
The additional •OH can degrade organic contaminants but it also allows the
Fe2+
to undergo additional reactions with H2O2. Fe2+
at low pH (2 - 4) absorbs light >
400nm and therefore allows a great proportion of the solar spectrum (Figure 1-4) to be
used removing the need for UV lamps (Malato et al., 2002). Fenton reactions operate
at or near room temperature and normal pressure. Intricate apparatus are not required
for its use, therefore it is claimed there will be a smooth transition from laboratory to
full scale wastewater treatment (Kavitha and Palanivelu, 2004). Disadvantages of
Fentons reagent include the need to remove the iron salts following treatment,
requirement for pH neutralisation, sludge disposal and reagent costs.

20
Figure 1-4 Typical solar spectrum at Plataforma Solar de Almería in Spain and
the optical density (O.D., optical path length 1cm) of a Fe2(SO4)3 solution
(0.25mM as Fe) and TiO2 powder (Malato et al., 2002).
Important factors in the optimisation of Fenton conditions include pH,
temperature, and concentration of hydrogen peroxide, iron salts and pollutant(s). The
ratio of iron to hydrogen peroxide is important. If the concentration of Fe2+
exceeds
the H2O2 concentration chemical coagulation will occur, resulting in the settling out of
iron salts and pollutants rather than chemical oxidation (Deegan, 2011).
Following detection of all three APIs in industrial wastewater at a
pharmaceutical production facility (Deegan, 2011) photo-Fenton oxidation was
investigated as a possible removal method. Fe2+
and H2O2 concentrations were
optimised and kinetic results evaluated. The reactant controls: photolysis, Fe2+
and
Fe2+
/light on the removal of the three APIs showed negligible removal. A H2O2
concentration of twenty micro molar degraded approximately 18 % of the famotidine
(0.1 mM) in solution, while tamsulosin and solifenacin showed no degradation at 5
mM H2O2 in the light or dark. Famotidine reduction using Fenton reagent (Fe2+
and
H2O2) was 32 % while photo-Fenton reduction was 38 %. Fenton reagent reduced the
tamsulosin concentration by 96 %, while photo-Fenton reduced the concentration by
99 % after 10min of contact time. Fenton reagent reduced the solifenacin

21
concentration by 100 % after 10 min of contact time. These studies used deionised
water rather than wastewater so studies in a wastewater matrix would be required to
develop the Fenton process for the treatment of pharmaceutical production facility
wastewater.
Olive mill wastewater has been treated by solar photocatalysis and solar
photo-Fenton (Gernjak et al., 2004). This wastewater is problematic because it has
high TOC, BOD, suspended solids and contains polyphenols which can be toxic to
bacteria in WWTPs. High suspended solids was reduced with a flocculation agent as a
pre-treatment step and this improved light transmission. Two photoreactor types were
used; a compound parabolic collector and a falling film reactor. The former was used
for TiO2 studies (see Section 1.2). It was found that 1 g/L TiO2 reduced the COD from
89 mg/L to 78 mg/L with no change in the phenol index compared to photo-Fenton
which reduced the COD from 81 mg/L to 21 mg/L and reduced the phenol index from
3.8 to 0.5. The concentration of Fe2+
was low at 5mM but the concentration of H2O2
was very high at 20 g/L which would make the system expensive to operate as H2O2
costs typically contribute 50 % of the cost of photo-Fenton. The falling film reactor
operated at a lower temperature which prevented the decomposition of the H2O2 but
the falling film did not remain homogeneous during strong wind. Wastewater from
the same facility was not used in both reactors simultaneously so a direct comparison
cannot be made.
Herbicides and APIs degradation using a mild (low Fe and TiO2 content)
photo-Fenton and TiO2 photodegradation in two compound parabolic collector solar
plants each with 11 L volume has been undertaken (Klamerth et al., 2009). Nine
compounds (100 μg/L) were dissolved using methanol which added a TOC of 12
mg/L. After Fenton the TiO2 was added and homogenized for 15 min before
illumination. In terms of initial reaction rates photo-Fenton performed significantly
better than TiO2 e.g. the initial caffeine reaction rate was 3.4 and >11.3 for TiO2 and
photo Fenton respectively. It may not be a suitable comparison as kinetic analysis of
this kind will favor Fenton. This study demonstrated that photo-Fenton can perform
well at normal pH in hard water.
Fenton and photo-Fenton has been used to regenerate AC that is saturated with
substrate in order to recover its adsorption capacity (Muranaka et al., 2010). The
process was intended to improve the removal efficiency of the Fenton process by
concentrating the pollutant (phenol) on the AC and then regenerating the AC to its
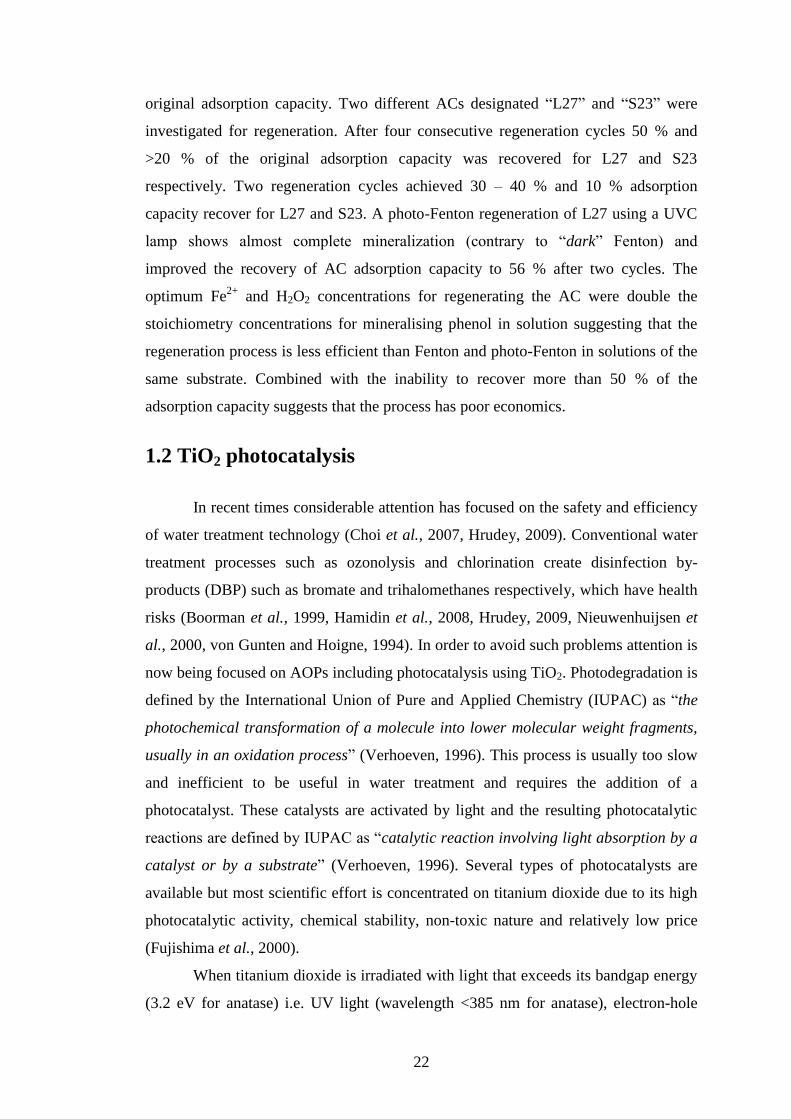
22
original adsorption capacity. Two different ACs designated “L27” and “S23” were
investigated for regeneration. After four consecutive regeneration cycles 50 % and
>20 % of the original adsorption capacity was recovered for L27 and S23
respectively. Two regeneration cycles achieved 30 – 40 % and 10 % adsorption
capacity recover for L27 and S23. A photo-Fenton regeneration of L27 using a UVC
lamp shows almost complete mineralization (contrary to “dark” Fenton) and
improved the recovery of AC adsorption capacity to 56 % after two cycles. The
optimum Fe2+
and H2O2 concentrations for regenerating the AC were double the
stoichiometry concentrations for mineralising phenol in solution suggesting that the
regeneration process is less efficient than Fenton and photo-Fenton in solutions of the
same substrate. Combined with the inability to recover more than 50 % of the
adsorption capacity suggests that the process has poor economics.
1.2 TiO2 photocatalysis
In recent times considerable attention has focused on the safety and efficiency
of water treatment technology (Choi et al., 2007, Hrudey, 2009). Conventional water
treatment processes such as ozonolysis and chlorination create disinfection by-
products (DBP) such as bromate and trihalomethanes respectively, which have health
risks (Boorman et al., 1999, Hamidin et al., 2008, Hrudey, 2009, Nieuwenhuijsen et
al., 2000, von Gunten and Hoigne, 1994). In order to avoid such problems attention is
now being focused on AOPs including photocatalysis using TiO2. Photodegradation is
defined by the International Union of Pure and Applied Chemistry (IUPAC) as “the
photochemical transformation of a molecule into lower molecular weight fragments,
usually in an oxidation process” (Verhoeven, 1996). This process is usually too slow
and inefficient to be useful in water treatment and requires the addition of a
photocatalyst. These catalysts are activated by light and the resulting photocatalytic
reactions are defined by IUPAC as “catalytic reaction involving light absorption by a
catalyst or by a substrate” (Verhoeven, 1996). Several types of photocatalysts are
available but most scientific effort is concentrated on titanium dioxide due to its high
photocatalytic activity, chemical stability, non-toxic nature and relatively low price
(Fujishima et al., 2000).
When titanium dioxide is irradiated with light that exceeds its bandgap energy
(3.2 eV for anatase) i.e. UV light (wavelength <385 nm for anatase), electron-hole

23
pairs are created. The electron-hole pairs degrade organic pollutants on the catalyst
surface either directly or indirectly in a water solution by creating hydroxyl and
superoxide radicals (Hoffmann et al., 1995). An energy diagram of the creation of
electron hole pairs is shown in Figure 1-5. This diagram demonstrates the various
steps in the photocatalysis process. The first step is the formation of charge carriers
(electron hole pairs) by a photon (1). The most likely next step is electron hole pair
recombination to liberate heat given that the quantum yield for the reaction is only
about 0.04–0.05. This means that the electron hole pair recombine 96 % of the time
(Zhou and Smith, 2002) (2); If recombination does not occur, an oxidative pathway
by a valence-band hole will occur (3); A reduction pathway by a conduction-band
electron to complement step (3) at (4); Further ROS and photocatalytic reactions yield
intermediates and potentially mineralisation products (5). It is also possible for the
trapping of a conduction-band electron in a surficial molecule to yield Ti(III) (6) and
trapping of a valence-band hole at a surficial titanol group (7).
1
e-
h+
2
4
3
Ox
Ox-
Red+
Red
6
7
OH
Ti
CO2, Cl2, H+, H2O
5
Valence-band
Conduction-band
Figure 1-5 Primary steps in the photoelectrochemical mechanism (Hoffmann et
al., 1995, Peralta-Hernández et al., 2007).
The chemical reactions occurring at the catalyst surface (steps 3 and 4 in
Figure 1-5) have been summarised (Benabbou et al., 2007, Kim et al., 2005). An
electron is extracted from the valence band (VB) to the conduction band (CB). This
process results in a positive region in the VB Hole (h+) and a free electron (e
-) in the
CB. (Eq. 4):
(VB)h(CB)eTiOhν
TiO 22 (4)

24
The hole at the catalyst surface reacts with hydroxyl ions (OH-) and adsorbs
water to form hydroxyl free radicals (•OH) (Eqs. 5 and 6):
OHTiOOH)(hTiO 22 (5)
HOHTiOOH)(hTiO 2ads22 (6)
The CB electron reduces oxygen to the superoxide ion: O2•- (Eq 7). This
reaction prevents the e-/h
+ recombination, in the absence of other electron acceptors
(pollutants).
22 OeO (7)
The further reduction of O2•- produces H2O2, as described in Eq. (8)
222 OH2HeO (8)
The superoxide ion and its protonated form subsequently dismute to yield
hydrogen peroxide or a peroxide anion (Eq’s. 9–11):
22 HOHO (9)
22222 OH3OOH24HOO (10)
2222 OHO2HO (11)
The addition of H2O2 can increase the photodegradation rate under certain
conditions, probably by the formation of •OH radicals via the Harber–Weiss reaction
(Eq. 12) or through the reduction of H2O2 by the CB e- (Eq. 15)
2222 OOHOHOHO (12)
OHOHeOH 22 (13)
Recombination of •OH radicals can also lead to the production of hydrogen
peroxide (Eq. 14):
22OHOHOH (14)
It is suggested that H2O2 production ceases in the absence of O2. Of all the
ROS generated the •OH radical is the most important oxidant species since it has the
most positive redox potential (see Table 1-4).

25
Table 1-4 Redox potential for oxidizing agents in water.
Oxidative species Redox potential (V) vs.
NHE
Redox potential relative to
chlorine
Fluorine (F-) 3.06 2.25
Hydroxyl radical (•OH) 2.80 2.05
Oxygen (atomic) 2.42 1.78
Ozone (O3) 2.08 1.52
Hydrogen peroxide (H2O2) 1.78 1.30
Permanganate (MnO4−) 1.69 1.24
Hypochlorite (ClO-) 1.49 1.1
Chlorine (Cl-) 1.36 1.00
Oxygen (molecular) 1.23 0.9
Source: (Al-Kdasi et al., 2004, Zhou and Smith, 2002).
The original research on the photocatalytic properties of TiO2 focused on solar
energy conversion using an electrochemical photocell with TiO2 and platinum
electrodes (Fujishima et al., 2000). Under illumination with near UV light
photoelectrolysis occurred resulting in the splitting of water into hydrogen and
oxygen. The hydrogen yield from this experiment was too low to be of practical use
although there are continuing developments in this field (Ni et al., 2007). In the late
1970s the ability of TiO2 to oxidise organic matter was applied to cyanide degradation
and this led to a substantial increase in research interest in the environmental
applications of photocatalysts (Fujishima and Zhang, 2006). This research focused on
air purification especially the photodegradation of volatile organic carbons (VOCs)
and nitrogen oxides (NOx), water pollutants and microorganisms (Hoffmann et al.,
1995). Photocatalysts were commercialised in several consumer and industrial
products, especially self-cleaning surfaces and air cleaning equipment/surfaces more
than a decade ago (Anpo, 2000).
Titanium dioxide offers a series of advantages over other semiconductor
photocatalysts: high catalyst stability, low toxicity and low cost. TiO2 has poor
adsorption of pollutants which can be considered a limitation if the concentration of
pollutant is very low (Hu et al., 2007, Molinari et al., 2008, Zhang et al., 2007).
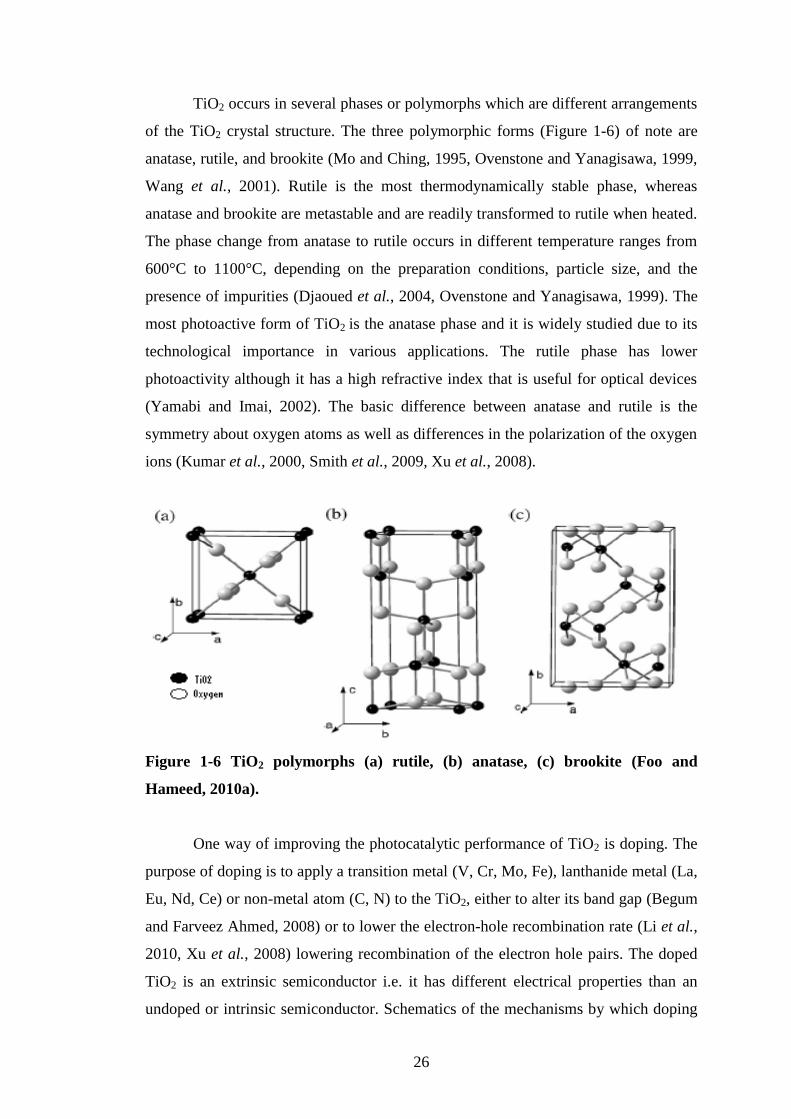
26
TiO2 occurs in several phases or polymorphs which are different arrangements
of the TiO2 crystal structure. The three polymorphic forms (Figure 1-6) of note are
anatase, rutile, and brookite (Mo and Ching, 1995, Ovenstone and Yanagisawa, 1999,
Wang et al., 2001). Rutile is the most thermodynamically stable phase, whereas
anatase and brookite are metastable and are readily transformed to rutile when heated.
The phase change from anatase to rutile occurs in different temperature ranges from
600°C to 1100°C, depending on the preparation conditions, particle size, and the
presence of impurities (Djaoued et al., 2004, Ovenstone and Yanagisawa, 1999). The
most photoactive form of TiO2 is the anatase phase and it is widely studied due to its
technological importance in various applications. The rutile phase has lower
photoactivity although it has a high refractive index that is useful for optical devices
(Yamabi and Imai, 2002). The basic difference between anatase and rutile is the
symmetry about oxygen atoms as well as differences in the polarization of the oxygen
ions (Kumar et al., 2000, Smith et al., 2009, Xu et al., 2008).
Figure 1-6 TiO2 polymorphs (a) rutile, (b) anatase, (c) brookite (Foo and
Hameed, 2010a).
One way of improving the photocatalytic performance of TiO2 is doping. The
purpose of doping is to apply a transition metal (V, Cr, Mo, Fe), lanthanide metal (La,
Eu, Nd, Ce) or non-metal atom (C, N) to the TiO2, either to alter its band gap (Begum
and Farveez Ahmed, 2008) or to lower the electron-hole recombination rate (Li et al.,
2010, Xu et al., 2008) lowering recombination of the electron hole pairs. The doped
TiO2 is an extrinsic semiconductor i.e. it has different electrical properties than an
undoped or intrinsic semiconductor. Schematics of the mechanisms by which doping

27
decreases the band-gap of anatase TiO2 (Serpone, 2006) is shown below (Figure 1-7).
It is claimed (Zaleska, 2008) that decreasing the band gap allows •OH to be created
with lower energy photons i.e. created by light with a longer wavelength (>400 nm).
CB
VB
O2
O2-
H2O2
OH-
OH•
OH•
-0.5V
+2.7V
e-/H
+
e-
h+
e-
e-
h+
h+
h+
e-
hv1 hv2 hv3
Figure 1-7 Schematic mechanism of doped TiO2 photocatalysis. hν1: pure TiO2;
hν2: metal-doped TiO2 and hν3: nonmetal-doped TiO2 (Zaleska, 2008).
1.3 Origin and structure of activated carbon
Activated carbon in the broadest sense is a wide range of heat treated, porous
carbon-based materials. Activated carbon (AC) is defined by IUPAC as:
“a porous carbon material, a char which has been subjected to
reaction with gases, sometimes with the addition of chemicals, e.g.
ZnCl2, before, during or after carbonization in order to increase its
adsorptive properties” (Fitzer et al., 1995).
Another definition is that “activated carbon is porosity (space) enclosed by
carbon atoms” (Marsh and Rodríguez-Reinoso, 2006b). AC is not an amorphous
material, it is partial amorphous as it has a poorly ordered microcrystalline structure
shown in Figure 1-8.

28
Figure 1-8 Comparison of three-dimensional crystal lattice of graphite (a) and
the less ordered structure typical of AC (b) (Bansal and Goyal, 2005).
This microcrystalline structure has been described as defective graphene
assemblies or alternatively stacks of aromatic sheets that differs from graphite with
respect to interlayer spacing, which is 0.335 nm in the case of graphite and ranges
between 0.34 nm and 0.35 nm in activated carbons. The orientation of the stacks of
carbon is also less ordered in activated carbons (Bansal and Goyal, 2005).
Activated carbons have a highly developed porosity which gives them an
enormous surface area (Bansal and Goyal, 2005); typically 1g of activated carbon will
have a surface area between 500-3000m2/g et al., 2005, Rodríguez-Reinoso and
Molina-Sabio, 1998). This value is determined by N2 gas adsorption (Rouquerol et
al., 1994). It is this surface area that allows AC to adsorb large amounts of pollutants.
AC preparation follows two broad steps: the carbonisation of the carbonaceous
raw material (in this work coal) at high temperatures (700 - 850°C) (Mazyck and
Cannon, 2000) in an inert atmosphere and the activation of the carbonised product.
During the carbonization process, most of the non-C elements such as O, H, and N are
eliminated as gaseous species (COx, NOx) by the pyrolysis of the parent material. The
carbon atoms group themselves into stacks of flat, aromatic sheets cross-linked in a
random manner in a nanocrystalline structure that chemists refer to as disordered and
physicists refer to as defective layers. These aromatic sheets are irregularly arranged,
which leaves free spaces. These spaces give rise to pores, which give the AC its high
surface area. During carbonization these pores are filled with the tarry matter or the
products of decomposition or at least blocked partially by disorganized carbon. This

29
pore structure in carbonized char is further developed and enhanced during the
activation process, which converts the carbonized raw material into a form that
contains the greatest possible number of randomly distributed pores of various sizes
and shapes, giving rise to an extended and extremely high surface area of the product.
The activation of the char (steam activation) uses an atmosphere of air, CO2, or steam
in the temperature range of 750°C to 900°C (Bansal and Goyal, 2005, Mazyck and
Cannon, 2000).
The “activation” results in the oxidation of some of the regions within the char
in preference to others, so that as combustion proceeds, a preferential etching takes
place. There is considerable diversity in how the pores and pore structure of an AC
are described. The pores are generally classified into micropores (widths smaller than
2 nm), mesopores (widths between 2 nm and 50 nm) and macropores (widths larger
than 50 nm) (Rouquerol et al., 1994). Mesopores are often expressed as a methylene
blue (MB) number as it is assumed that a large molecule such as MB cannot penetrate
the micropores. Micropores capacity can be expressed as an iodine number. It is
assumed that iodine can penetrate into the micropores while larger molecules such as
MB cannot. By comparing the iodine and methylene blue numbers of an AC it is
possible to determine the relative microporosity to mesoporosity ratio. No
comprehensive model of the microporious nature of carbons has been devised that can
tie together all the properties of an AC (Marsh and Rodríguez-Reinoso, 2006c). The
majority of papers assume the “branched tree” model is the structure of the AC
(Figure 1-9). This model assumes that the macropores lead to mesopores which in
turn lead to the micropores. It assumes that the micropores (or at least the bulk of
them) do not connect to the surface and must be accessed through the other pore sizes.
Critics of this model note that there is no reason to assume that the AC’s pores
contract from larger to smaller and it implies that parts of the carbon have no porosity
(Marsh and Rodríguez-Reinoso, 2006c).

30
Figure 1-9 Unmodified activated carbon (Baup et al., 2000, Marsh and
Rodríguez-Reinoso, 2006d).
Electron spin resonance studies have shown that the aromatic sheets in
activated carbons contain free radical structure or structure with unpaired electrons.
These unpaired electrons are remnants of the carbonization process; due to the
breaking of bonds at the edges of the aromatic sheets create edge carbon atoms. These
edge carbon atoms have unsaturated valences and can interact with elements such as
O, H, N, and S (present in the parent material or added by the activating agent)
creating surface oxygen functionalities (SOF) (Figure 1-10).
Figure 1-10 Diagram of Surface Oxygen Functionalities (SOF) on the edges of
the aromatic sheets of an AC surface (Shen et al., 2008).

31
The surface of activated carbon can be characterized into three zones: the
carbon basal planes (including basal edges and crystal defects), heterogeneous surface
groups (mainly SOF, but includes sulphur groups) and inorganic ash (Franz et al.,
2000). The majority of the adsorption sites are on the basal planes, which form more
than 90 % of the carbon surface. However, the much higher activity of the
heterogeneous groups can affect the overall adsorption capacity. Heteroatoms (non
carbon atoms) may be combined both with peripheral carbon atoms at the corner and
edges of crystallites, in intercrystalline spaces and even in defect zones of particular
planes constituting the AC’s crystalline structure. Most heteroatoms are grouped at
the surface of the AC and they differ in terms of their reactivity. Surface bound
heteroatoms are believed to adopt the character of the functional groups typical for
aromatic compounds and to react in a similar way to reagents. If they are bound in the
core of the crystalline structure they are often inert due to their low accessibility and
interaction with local atoms (Jankowska et al., 1991).
Other factors can influence the adsorption of the AC. The point of zero charge
of an AC is the pH at which the AC has no net charge (Hameed et al., 2009). At a pH
below this, the carbon is net positively charged and above this it is negatively
charged. This property significantly influences the adsorption on the carbon surface
and is an important consideration for creating ACs as changes in pH will greatly
influence adsorption (Khan, 2002).
The elemental composition of a typical AC has been found to be 88 % C, 0.5
% H, 0.5 % N, 1 % S, and 6 to 7 % O, with the balance representing inorganic ash
constituents (Bansal and Goyal, 2005). ACs used in applications where high purity is
required are typically treated - usually acid washed - to reduce the ash content as it
could leach into solution. The oxygen content of an AC can vary depending on the
type of raw material and the conditions of the activation process, ACs with more SOF
will consequently have higher oxygen content. In theory, all carbonaceous materials
can be made into AC, although the properties of the resulting AC will vary, depending
on the raw material, the activating agent, and the conditions of the carbonization and
activation processes.
It is worth considering how the sorbate adsorbs onto the AC. The entire
process can be broken down into four steps (Kumar et al., 2003) shown in Figure
1-11. The diffusion through the bulk solution is usually assumed and is not considered
a step by some literature (Choy et al., 2004, Nevskaia et al., 1999). For this work the

32
four steps will be considered. The four steps can be divided into two broad processes:
the crossing of the boundary layer surrounding the particle onto its surface or external
mass transfer (steps 1 - 2) and the diffusion within the particle, the intraparticle mass
transfer (steps 3 - 4). The first step is the diffusion of the adsorbate through the bulk
liquid solution followed by mass transfer through a laminar boundary layer around the
particle that is referred to as the diffusional boundary layer or the film diffusion stage
of adsorption. This phenomenon occurs in adsorption but also relevant to catalysis. It
is influenced by the hydraulic behaviour in the vessel (column), the surrounding area
of the particle, physical properties of the solvent(s) and the molecular diffusion of the
solute, particle size of the AC, but is not affected by the nature or the porosity of the
GAC (as this is accounted for in the next step). The intraparticle mass transfer
involves two different phenomena: porous diffusion (the adsorbate first diffuses in the
liquid filling the pores and then is adsorbed) and surface diffusion (the adsorbate is
first adsorbed then diffuses from one site to another).
Figure 1-11 Four step model of AC adsorption in this case a GAC (Baup et al.,
2000).
The diffusion of the solute in the bulk fluid (Hossain and McLaughlan, 2011)
(Step 1) is very fast compared to the diffusion through the outer layer and within the
particle which can take a considerable time. The concentrations of the liquid bulk will
be governed by the overall mass balance (the amount of adsorbed substrate vs. the
equilibrium concentration) and the hydraulic mixing behaviour of the vessel. An
instantaneous reversible reaction is assumed for the real adsorption step (step 4). The

33
liquid phase concentration of adsorbate and the adsorbate load at the carbon’s surface
are locally related by an equilibrium law.
Thus adsorption kinetics is governed by external mass transfer and internal
diffusion and can be represented by homogeneous surface diffusion model (Abuzaid
and Nakhla, 1997). Where the coefficients Kf (external mass transfer coefficient), Dp
(pore diffusion coefficient) and Ds (the surface diffusion coefficient) represent the
contribution of each of their phases to the adsorption kinetics. It has been noted that
the contribution of Ds is 20 times as important as the Dp contribution (migration of the
substrate though the pore volume) and consequently most homogeneous surface
diffusion models consider only Kf and Ds.
The best AC for a particular application is usually determined empirically as
there are many parameters that influence adsorption. Prediction of adsorption capacity
in advance is limited to models that deal with idealized cases (Franz et al., 2000).
There are greater than 400 parameters of an AC that can be measured which makes it
impractical to determine every property of an AC (Lever, 2010). BET isotherms using
N2 is a very popular method for comparing ACs (Rolando M.A., 2007, Rouquerol et
al., 1999). There is no fundamental reason for the use of N2, other substances: H2, He,
CO2, Ar, Kr, Xe, C4H10 (butane), C5H12 (pentane), Li and Hg can also be used, each of
which gives different results. It is impossible to accurately determine surface area, as
distinct from determining reproducibility (Marsh and Rodríguez-Reinoso, 2006d).
The surface area provided is the maximum adsorption capacity under the arbitrary
conditions of the adsorption experiment. N2 is used due to its relative convenience and
it should be noted that it is not in the ASTM International manual for material testing
while phenol adsorption and iodine adsorption are included (Jankowska et al., 1991,
Marsh and Rodríguez-Reinoso, 2006d).
1.4 Integrated photocatalytic adsorbents
The first study of integrated photocatalytic adsorbents (IPCAs) to degrade
water pollutants was conducted in 1996 (Torimoto et al., 1996) and the number of
published studies using IPCAs has grown steadily since then (Figure 1-12). The term
IPCA was coined much later in 2005 (Haque et al., 2005). Photocatalysts are

34
commercially deployed in one large scale water treatment plant and research and
development is on-going worldwide (Blanco et al., 2009).
0
2
4
6
8
10
12
14
16
18
1996
1997
1998
1999
2000
2001
2002
2003
2004
2005
2006
2007
2008
2009
2010
2011
No o
f st
ud
ies
pu
bli
shed
per
yea
r
Year
Figure 1-12 Number of surveyed AC/TiO2 IPCA (degrading water pollutants)
studies published per year 1996- December 2011.
By combining the adsorption potential of activated carbons with the
photocatalytic properties of titanium dioxide it is possible to create an integrated
photocatalytic adsorbent (Figure 1-13) with improved photocatalytic potential. IPCAs
may consist of either activated carbon coated with TiO2 or TiO2 coated with a
carbonaceous material that was heat treated to form an activated carbon. Numerous
studies have reported synergistic effects between mixtures of TiO2 and AC (a mass of
each is separately added to solution) in contrast to composites (where both substances
are combined together) of TiO2 and AC (Areerachakul et al., 2008, Cordero et al.,
2007a, Cordero et al., 2007b, Matos et al., 2007, Matos et al., 1998, Qourzal et al.,
2004, Zhang et al., 2004). Other adsorbent types have been used to create IPCAs
including zeolites (Haque et al., 2005, Huang et al., 2008, Kabir et al., 2006, Shankar
et al., 2006, Vaisman et al., 2005, Wang et al., 2008, Yoneyama and Torimoto, 2000),
alumina silicates (Ding et al., 2001a, Kun et al., 2006, Maekawa et al., 2006, Ménesi
et al., 2008, Yamashita et al., 2004, Yamashita et al., 2007), TiO2 coated
carbonaerogel (Jin et al., 2011), carbon nanofibres (Kim et al., 2011) and carbon

35
nanotubes (Gao et al., 2011, Lee, 2004, Wang et al., 2009a, Wu et al., 2008, Xia et
al., 2007, Yao et al., 2008, Yu et al., 2005, Zhu et al., 2007).
Figure 1-13 Activated carbon modified with TiO2: an IPCA.
Source: (Gao et al., 2011, Lim et al., 2011, Liu et al., 2007a, Wang et al., 2009b, Zhang
et al., 2011a)
It is claimed that AC provides a synergistic effect (Cordero et al., 2007b, Foo
and Hameed, 2010a, Li Puma et al., 2008, Lim et al., 2011, Liu et al., 2007a, Wang et
al., 2007) due to enhanced adsorption of the target pollutant onto the activated carbon
phase followed closely by a transfer through an interphase to the TiO2 phase, giving a
complete photodegradation process. The literature cited in this chapter does not offer
conclusive evidence of this effect which can be confused with extra adsorption due to
the presence of the adsorbent (see Chapter 6).
The proposed mechanism(s) for IPCA action and synergy as described in the
literature is summarised here. The AC in the IPCA is said to concentrate the pollutant
near the photocatalyst surface allowing more efficient usage of the electron hole pairs
created by illumination of the TiO2. A diagram of the process is shown in Figure 1-14.
This process has not been fully explained in the literature. It may work by the transfer
of the substrate from the solution to adsorption sites in close proximity to the TiO2
only or it might work by the diffusion of the substrate from the pores of the AC to the
TiO2 surface. It is also possible that a combination of the two processes occurs. If the

36
substrate does not diffuse out of the ACs pores then the adsorption capacity of the
IPCA cannot be fully regenerated and after the initial adsorption capacity is exhausted
the IPCA would only be effective at substrate removal during illumination. The lack
of diffusion out of the pores could have several causes:
1. Covalent bonding with the ash or functional groups on the AC surface.
2. Clogging of the pores with substrate, preventing desorption.
3. Due to the higher activation energy of desorption the rate of desorption is always
lower than adsorption of the sorbate when the adsorbent is placed in clean water to
desorb therefore a slow adsorption rate will lead to a slow desorption rate.
Several factors could influence this process depending on which model is
correct. Faster desorption kinetics would allow more efficient transfer of the substrate
from the pores of the AC to the TiO2 while increased TiO2 loading on the surface of
the AC may reduce the number of available adsorption sites thus lowering the
adsorption capacity.
Figure 1-14 Diagram of IPCA photodegradation mechanisms. (1) Transfer of the
substrate to the adsorption sites close to the TiO2. (2) Diffusion of the substrate
from the ACs pores to the TiO2 surface. (Devipriya and Yesodharan, 2005).
The relative importance of each mechanism must be considered. If the
substrate can diffuse out of the AC pores in a reasonable timeframe then a thin surface
layer of TiO2 on the AC will be effective for photodegradation as the substrate can
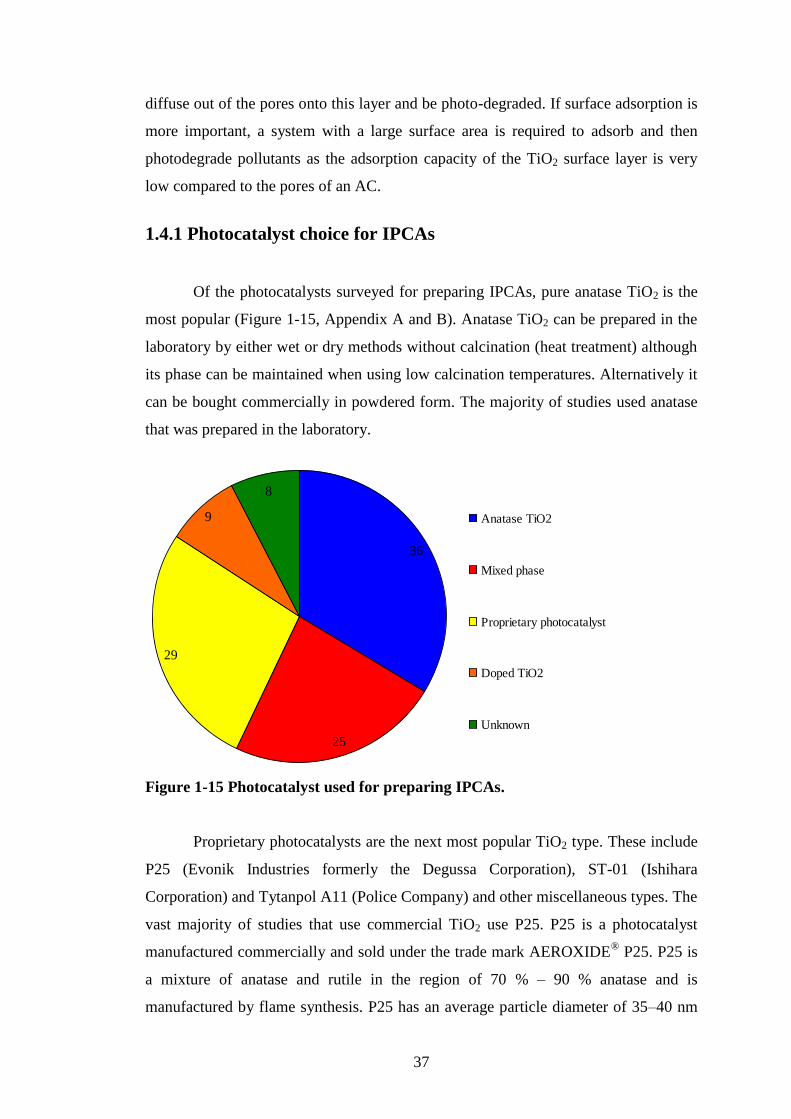
37
diffuse out of the pores onto this layer and be photo-degraded. If surface adsorption is
more important, a system with a large surface area is required to adsorb and then
photodegrade pollutants as the adsorption capacity of the TiO2 surface layer is very
low compared to the pores of an AC.
1.4.1 Photocatalyst choice for IPCAs
Of the photocatalysts surveyed for preparing IPCAs, pure anatase TiO2 is the
most popular (Figure 1-15, Appendix A and B). Anatase TiO2 can be prepared in the
laboratory by either wet or dry methods without calcination (heat treatment) although
its phase can be maintained when using low calcination temperatures. Alternatively it
can be bought commercially in powdered form. The majority of studies used anatase
that was prepared in the laboratory.
36
25
29
9
8
Anatase TiO2
Mixed phase
Proprietary photocatalyst
Doped TiO2
Unknown
Figure 1-15 Photocatalyst used for preparing IPCAs.
Proprietary photocatalysts are the next most popular TiO2 type. These include
P25 (Evonik Industries formerly the Degussa Corporation), ST-01 (Ishihara
Corporation) and Tytanpol A11 (Police Company) and other miscellaneous types. The
vast majority of studies that use commercial TiO2 use P25. P25 is a photocatalyst
manufactured commercially and sold under the trade mark AEROXIDE® P25. P25 is
a mixture of anatase and rutile in the region of 70 % – 90 % anatase and is
manufactured by flame synthesis. P25 has an average particle diameter of 35–40 nm
38
(anatase), 85–95 nm (rutile) - as determined by X-ray diffraction (XRD) and
transmission electron microscopy (TEM) analysis - and a specific surface area of 44–
50 m2g
-1 (Balázs et al., 2008). There is disagreement in the literature about the precise
composition of P25, for example it is cited as anatase 92 %, rutile 8 % (Yamashita et
al., 2007), 75 % anatase, 25 % rutile (Xia et al., 2007) and 80 % anatase, 20 % rutile
(Yu et al., 2005). The anatase and rutile phases exist separately in powdered form
(Ohno et al., 2001) and while the anatase phase is more photoactive (although this
depends on the reaction conditions and catalyst morphologies (Shi and Weng, 2008,
Sun and Xu, 2010), the mixture of the two phases is synergetic and allows P25 to
have better activity than anatase and rutile separately (Hurum et al., 2003, Ohno et al.,
2001). The synergy of P25 is claimed (Hurum et al., 2003, Shi and Weng, 2008) to be
due to:
1. The smaller band gap of rutile (3.0 eV) extending the range of photoactivity into
the visible spectrum.
2. Stabilization of charge separation due to electron transfer from rutile to anatase
phase slows recombination (known as the antennae effect).
3. The small size of the rutile crystallites facilitates this transfer, creating catalytic
hot spots at the rutile/anatase interface.
The wide availability of P25 means that it is used both as photocatalyst in
IPCAs but also as a reference photocatalyst to compare IPCA performance (Mills and
Le Hunte, 1997).
Laboratory prepared IPCAs composed of a mixture of anatase and rutile TiO2
are the next largest group of IPCA studied. Studies that use high calcination
temperature for preparing IPCAs create mixed phase photocatalysts comprising of a
mixture of rutile and anatase, for instance 30:70 % rutile: anatase (Fu et al., 2004a,
Xu et al., 2008). These mixtures are an inevitable consequence of using a calcination
step to prepare IPCAs as the anatase phase is converted to the rutile phase by high
temperatures. These studies usually investigate a range of temperatures (e.g. 700-
900 C) to create different IPCAs in order to determine which temperature produces
the most photoactive IPCA (Xu et al., 2008). Higher calcination temperatures cause
more anatase to be converted to the rutile phase. However, increasing calcination
temperature will cause the TiO2 particles to become larger and it is suggested that the
larger TiO2 particles will not block the pores of the AC thus increasing the adsorption

39
capacity of the IPCA (Xu et al., 2008). It was noted that activated carbon fibres
(ACFs) can protect the anatase phase thus allowing the use of high calcination
temperatures without causing a phase change (Fu et al., 2004a). AC has been used as
a support to prepare TiO2 for use in photocatalytic studies (Slimen et al., 2011). The
AC reduces the particle size and agglomeration of the TiO2 which gives it
significantly higher photocatalytic activity compared to the TiO2 prepared without a
support and higher activity than a P25 control. The AC is burned at 700°C in air so
that only the TiO2 powder (the ash of the AC is washed off) remains for use in
photocatalytic studies.
Several authors cited (Lee et al., 2004a, Liu et al., 2010, Torimoto et al., 1996,
Torimoto et al., 1997, Zhang et al., 2010) did not state the TiO2 phase that they were
using.
There is considerable literature (Al-Kdasi et al., 2004, Anpo, 2000, Choi et al.,
2007, Comninellis et al., 2008, Fujishima et al., 2000, Fujishima and Zhang, 2006,
Gogate and Pandit, 2004, Hoffmann et al., 1995, Mills and Le Hunte, 1997, Wahi et
al., 2005, Yurdakal et al., 2007, Zhou and Smith, 2002, Zwiener and Frimmel, 2000)
describing the degradation of APIs and other organics by TiO2 (on its own). TiO2
photocatalysis has advantages over other AOPs:
1. pH adjustment is not required compared to photo-Fenton (Rizzo et al., 2009).
2. As a catalytic process reagents such as H2O2 are not required as is the case with
UV/ H2O2, perozonation and photo-Fenton.
3. The •OH radical is a nonspecific oxidant which improves mineralisation (Zwiener
and Frimmel, 2000).
There is considerable literature on the doping of pure TiO2 (Hoffmann et al.,
1995, Wu et al., 2010, Zaleska, 2008) and several studies have created doped TiO2
that were subsequently converted into IPCAs. Chemical vapour deposition was used
to add Ag to the surface of TiO2 on an IPCA in order to overcome its lower
photocatalytic performance compared to TiO2 slurry (Zhang et al., 2005a). Six IPCAs
using different Ti:Ag ratios and deposition times were prepared and compared to an
IPCA using P25 as the photocatalyst. The performance of the doped IPCAs increased
with the Ti:Ag ratio and, deposition time and with the exception of the IPCA with the
highest deposition time and Ti:Ag ratio, all of the doped IPCAs had higher
photodegradation ability for methyl orange than the P25 IPCA.

40
P25 modified with CdS was prepared using separate sol gel and precipitation
methods (Zhao et al., 2010). The modified P25 was applied to an ACF and used to
degrade methylene blue with sunlight as the irradiation source. The apparent reaction
rate constant of the doped IPCA prepared using the precipitation methods and sol gel
methods were 70 % and 21 % higher respectively than the unmodified P25 IPCA.
Another approach used co-doping of anatase TiO2 with Fe(III) and Ho(III) followed
by application to a activated carbon fibres (ACF) (Shi, 2009). It was noted that the
doping could prevent the formation of cracks in TiO2 films on the surface of the ACF
although the mechanism remains unknown. The study lacked a TiO2 control therefore
it is unclear if the doping had a positive effect on the photodegradation ability. Fe(0)
was applied to TiO2 and then impregnated onto an ACF (Liu et al., 2009). The doped
IPCA degraded approximately 20 % more 2,4-dichlorophenol than the unmodified
P25 IPCA. The improved photocatalytic performance was attributed to the superior
dechlorination ability of Fe(0) combined with the synergistic properties of the TiO2
ACF IPCA.
A Fe doped TiO2 was used to prepare an ACF IPCA for degrading dye
wastewater (Li et al., 2010). COD removal was approximately 50 % higher than the
unmodified TiO2 while colour removal (determined by an undefined colorimetry
method) was comparable. Li et al. attributed this improvement in performance to
trapping of photo-generated electrons in the conduction band of Fe3+
which decreased
electron/hole pair recombination in the TiO2 although no direct evidence of this was
provided. Vanadium (V) doped TiO2 was used to degrade X-3B (Reactive Brilliant
Red dye) (Xu et al., 2010) under visible light. The doped IPCA, V doped TiO2 and
P25 degraded 89 %, 60 % and 7 % of the X-3B respectively. The diffuse reflection
spectra of the V doped TiO2 showed enhanced absorption of visible light (380nm -
800 nm) compared to the unmodified TiO2. The enhanced performance was attributed
to this higher visible light absorption. The V doped TiO2 also displayed enhanced
hydrophilicity which was attributed to photo-generated holes diffusing to the surface
and reacting with the surface oxygen lattice leading to the dissociative adsorption of
water at those defective sites.
TiO2 was doped with C and then surrounded by AC (Lee et al., 2010). Anatase
TiO2 grains were prepared in a co-polymer that was then heat treated to form an AC.
The anatase grains become doped with C during the carbonisation process and are
claimed to develop enhanced visible light absorption. Under visible light illumination

41
methylene blue was effectively degraded in under one hour compared to no removal
seen in the anatase TiO2 control.
The choice of substrate for degradation is an important consideration in
measuring doping performance. At visible wavelengths photo-adsorption of visible
light by methylene blue (MB) induces electron injection into TiO2
(photosensitization) leading to reduction of molecular oxygen and oxidative
decomposition of the electron-deficient MB (Yan et al., 2006). This is a separate
effect to conventional doping allowing the TiO2 to photodegrade under visible light
and has led to the recommendation that “transparent substrates” be used for
determining photocatalytic activity of visible light photocatalysis in the 540 nm – 680
nm range (Ryu and Choi, 2008, Yan et al., 2006).
1.4.2 Adsorbent types
In this work the AC used to prepare IPCAs is categorised based on physical
form as the diverse physical and chemical properties of AC such as iodine number, N2
adsorption, density, mesopore and micropore volume are not detailed in the majority
of articles cited. The most popular forms of AC in the reviewed literature (Figure
1-16) are powdered activated carbon (PAC) and granular activated carbon (GAC).
Other forms such as extruded activated carbon (EAC) and activated carbon
cloths/activated carbon filters (ACC/ACF) are also available but are not widely used
in water treatment. Granular activated carbon is most commonly used in water
treatment due to its relatively large grain size which makes it easy to handle and form
filter beds, unlike PAC which due to its small grain size becomes easily suspended in
solution and thus must be filtered or coagulated out of the solution.

42
39
36
20
7
82 2
PAC
GAC
ACF/ACC
Carbon Coating
Other
Not stated
EAC
Figure 1-16 AC type and number used in IPCA studies.
The abundance of literature describing the use of PAC is most likely due to its
ease of use in photocatalytic reactors and preparation compared to GAC and EAC
especially given that the GAC and EAC are prepared by compressing PAC and a
binder. IPCAs have also been prepared using AC created in the laboratory from a
diverse set of precursors including wood (Cordero et al., 2007a, Cordero et al.,
2007b), coconut shell (Lee et al., 2004a, Lee et al., 2004b), Jordanian olive stone (El-
Sheikh et al., 2004), pyrolysed sewage sludge (Zhang et al., 2004), waste Canola
hulls (Mahmoodi et al., 2011) and coal tar pitch (Velasco et al., 2010a). In theory, any
natural organic material can be converted to activated carbon although economic
considerations limit the number of viable feedstocks for commercial production
(Marsh and Rodríguez-Reinoso, 2006b). The flexibility of source materials for
activated carbon production enables IPCAs to be prepared from a multitude of raw -
materials and industrial wastes.
A more costly approach to IPCAs production involves composites of TiO2 and
carbon nanotubes (CNTs). The CNT acts as an adsorbent providing all the associated
benefits (adsorption capacity, substrate concentration) as activated carbon (Gao et al.,
2007). The conductive properties of CNTs allow electrons that have been promoted to
the conduction band by the photocatalysis process to be transferred away from the
TiO2 surface. This reduces electron/hole pair recombination and by prolonging the
electron holes on the TiO2 surface, increases the likelihood of a photodegradation
reaction and therefore a corresponding increase in the photodegradation rate (Gao et

43
al., 2007, Yao et al., 2008). CNTs are also claimed to increase the adsorption
spectrum of TiO2 in the visible region allowing photodegradation using visible light
(Wang et al., 2009a). The progress and challenges of CNT IPCAs have been reviewed
elsewhere (Woan et al., 2009).
Doping of the adsorbent used in the IPCA has been attempted but with limited
success (Oh et al., 2009). A laboratory prepared ACF doped with Fe by immersion in
ferric nitrate solutions was then added to a tetrabutyl orthotitanate solution in order to
apply TiO2 to the IPCA. The resulting IPCAs possessed similar photodegradation
ability as the non-doped TiO2 ACF which suggests that doping the AC is not as
effective a strategy as doping the TiO2 on its own.
1.4.3 Wet methods for preparation of IPCAs
IPCA preparation methods are broadly divided into “dry” and “wet” methods.
Dry methods use a physical and/or gaseous/vapour process whereas wet processes use
an aqueous phase in applying the TiO2 to the adsorbent. Wet processes including sol
gel, boiling impregnation, liquid phase deposition and electrophoretic deposition
constitute the majority of methods used to prepare IPCAs (Appendix A and B).
Proponents of dry methods cite as advantages the absence of waste streams
and avoidance of several of the preparation steps needed for sol gel methods such as
saturation, ageing and drying (Wu et al., 2003, Zhang et al., 2005a). In spite of these
claimed advantages, wet methods are much more common in the literature. Wet
methods are generally more accessible because complex, specialist and proprietary
equipment is not a prerequisite for their use (Wang et al., 2009b).
1.4.3.1 Sol-gel
Sol-gel methods are used to prepare either the virgin TiO2 or the complete
IPCA. Although many methods are generally categorised as sol-gel there is
considerable variation relating to precursor and adsorbent choice and the method of
impregnation.
While the majority of IPCAs are prepared by applying TiO2 to activated
carbon, a smaller subset of IPCA preparation methods apply either the TiO2 to a

44
carbonaceous material (or vice versa) that is then converted to activated carbon. For
instance hydroxypropyl cellulose was applied to commercial TiO2 powder (ST-01)
and then activated at 700°C in N2 and the resulting IPCA was used to decolourise
methylene blue (Tsumura et al., 2002). The most important parameter affecting the
degradation efficiency was the use of pre-saturation (the IPCA was loaded with the
substrate). For example the IPCA with the highest carbon content was the least
effective at decolourising methylene blue when the IPCA was not pre-saturated before
illumination. However, when the IPCAs were pre-saturated the reverse was true. This
was attributed to the need for migration of the substrate from the AC to the TiO2
surface which was higher when the IPCA was pre-saturated. Cellulose microspheres
have been used as a supporting material for P25 which was carbonised to create an
IPCA (Yamashita et al., 2007). The IPCA was twice as effective at degrading
acetaldehyde as unmodified TiO2 of the same particle size. Poly vinyl butyral and
poly vinyl alcohol have been used as supports for TiO2 and are carbonised to create
IPCAs (Tryba et al., 2003a).
The second category of the sol gel studies (and the most numerous types) uses
a sol gel process to prepare the TiO2 used in the impregnation process. Typically the
TiO2 is prepared using a Ti precursor such as tetrabutyl orthotitanate dissolved in
absolute ethanol (Liu et al., 2007b). An acid can be added to control the pH (Zhu and
Zou, 2009) and a hygroscopic compound such as diethanolamine can be added to
optimise the solution (Li et al., 2006). The AC is added to the TiO2 by:
1. Dip coating into the sol gel solution (Liu et al., 2009, Liu et al., 2007b),
2. Drop coating of the solution onto the AC (He et al., 2009, Wang et al., 2009b)
3. Stirring/immersion of the AC in the solution (Wang et al., 2007, Yao et al., 2010,
Zhang et al., 2010)
4. Ultrasonication of the TiO2 solution with the AC (Li et al., 2007, Li et al., 2010,
Xu et al., 2008).
Regardless of the impregnation method used, the resulting IPCAs are usually
heat treated at low temperatures (200-250°C) (Hou et al., 2009, Inagaki et al., 2006)
in air and then calcined at 300-800°C in an inert atmosphere e.g. N2.
Low temperature methods can be used to prepare IPCAs and these methods
are reported to be superior to high temperature preparation methods as the surface
area of the TiO2 particles is not decreased as a result of heat treatment (Ao et al.,
2008a, Ao et al., 2008c, Basha et al., 2010). Preparation involved a sol-gel method to

45
prepare TiO2 and ultrasonication to mix the TiO2 and PAC (or GAC) solution
followed by drying with a rotary evaporator. Another low temperature preparation
method stirred different proportions of commercial TiO2 powder (P25) and AC in an
aqueous solution for an hour followed by filtration and drying (Araña et al., 2003a).
The resulting IPCA had improved photodegradation ability in terms of apparent first-
order rate constants that were 619 % higher for natural sunlight and 67 % higher for
UV light compared to virgin TiO2.
1.4.3.2 Other wet methods
The majority of papers in the reviewed literature that used wet methods to
prepare TiO2 used sol-gel type processes, other studies used alternative wet methods
to prepare the TiO2 including boiling impregnation, liquid phase deposition and
electrophoretic deposition. Wet chemical impregnation techniques are of interest due
to their straightforward protocols, low temperature and energy costs.
Boiling impregnation was used to apply TiO2 to GAC (Khan, 2002). The
method involves mixing TiO2 and AC and repeatedly boiling dry the solution to
create an IPCA. The resulting IPCA degraded 80 % and 90 % of methylene blue at
concentrations of 10 mg/L and 20 mg/L, respectively, and it was regenerated twice.
This method was also used to apply a solution of P25 (ultrasonicated beforehand) to a
series of inert and adsorbent supports including GAC and zeolite (Lu et al., 1999).
The coated supports were then calcined and used to degrade propoxur (a carbamate
insecticide). The GAC based IPCA removed almost four times more propoxur than
P25 alone. When the adsorption capacity of the IPCA was taken into account (it had a
lower concentration at t = 0 due to adsorption) its mineralisation rate was roughly
equivalent to P25.
The liquid phase deposition (LPD) method is a simple and easily-controlled
process for fabricating thin films of coating on ACF and does not require special
equipment (Hou et al., 2009). It consists of submerging a pre-treated ACF into a
solution of TiO2 precursor for several hours followed by drying and annealing for 180
min at 350 C in an N2 atmosphere. The resulting IPCA demonstrated much higher
photodegradation (49 %) of Acid Orange II (dye) compared to virgin TiO2 (11 %). In
the same study electro-photocatalysis was used parallel to conventional UV
photocatalysis. The IPCA was used as an anode and an electric current was passed

46
through it to decrease electron-hole recombination and this achieved a degradation
rate approximately 10 % greater than conventional UV photocatalysis (Hou et al.,
2009).
Electrophoretic deposition was used to apply a suspension of commercial P25
(in a 5 % (v/v) 2-propanol) and PAC to conductive glass plates coated with SnO2
films doped with indium (Peralta-Hernández et al., 2007). The indium glass plates
function as the cathode in the process. The resulting nano-composite electrodes
prepared using a range of different synthesis suspensions were sintered (heat treated)
in air. The IPCA present on the surface of the electrodes was three times more
effective at decolourising Orange-II dye (30 % reduction of Orange-II compared to a
10 % reduction in the TiO2 control after 200min of UV irradiation). The study did not
use a photolysis control or total organic carbon (TOC) to monitor degradation but
measured the production of H2O2 (a key reactive oxygen species) and determined that
it was 50 % higher in the IPCA compared to virgin TiO2.
1.4.4 Dry methods of preparation
Dry methods constitute less than a one sixth of the methods used in the
literature, with Chemical Vapour Deposition (CVD) and its variants comprising the
majority of these methods.
1.4.4.1 Chemical Vapour Deposition
Chemical vapour deposition (CVD) creates a vapour using an inert carrier gas
(typically N2) and a chemical precursor(s) that is to be applied to a substrate. CVD
can be categorised according to the pressure or the physical characteristics of the
vapour used for deposition. Atmospheric pressure (AP) CVD (Ding et al., 2001b, El-
Sheikh et al., 2007, Zhang et al., 2005a) and MOCVD (metal organic chemical
vapour deposition) (Zhang et al., 2005b, Zhang et al., 2006) have been used to
prepare IPCAs. Although not explicitly mentioned in every study, the majority of
CVD methods appear to have been used at atmospheric pressure. Low pressure
MOCVD was used to prepare supported anatase TiO2 on the surface of silica gel
(Ding et al., 2000). The photocatalytic activity of the supported TiO2 was nearly half

47
of that of the powder photocatalyst (P25). CVD was used to create an EAC-based
IPCA as well as IPCAs using silica gel and - Al2O3 (a polymorph of alumina) (Ding
et al., 2001b). The silica gel had the highest photodegradation ability of the IPCAs for
degrading phenol and this is attributed to its greater surface area. An initial increase in
phenol concentration was attributed to the release of phenol from the EAC-based
IPCA and no TiO2 slurry was included as a control. These factors limit the usefulness
of this study in comparing AC to other adsorbents.
Molecular adsorption-deposition was used to apply a TiO2 precursor (TiCl4) to
ACFs (Fu et al., 2004a). The method consists of heating the ACF under vacuum
followed by adsorption of TiCl4 vapour and saturated water vapour at room
temperature. The system was then heated to 90 C and evacuated, followed by
calcination. As this method creates a vapour that is deposited on a substrate it could
also be considered lower pressure chemical vapour deposition (LPCVD). IPCAs
prepared by exclusively by CVD have been reviewed in detail elsewhere (Li Puma et
al., 2008).
1.4.4.2 Mechanofusion: Theta composer
Mechanofusion processes grind materials together and can be used to apply
TiO2 to an AC to create an IPCA. One example is the Theta Composer ; it is a
proprietary elliptical rotor type powder mixer that uses a rotating vessel and rotor to
create high shear forces that bind the particles together. Resulting IPCAs exhibited
methylene blue decolourising potential comparable to IPCAs prepared by boiling
impregnation (Khan, 2002). The most important consideration for IPCAs prepared
using this method was the process used to activate the activated carbon as the ACs
prepared by acid washing were ineffective compared to AC activated by steam. The
increasing number of dry methods and equipment available to prepare composite
powders has been reviewed elsewhere (Yang et al., 2005). Proponents of
mechanofusion have reviewed other mechanofusion methods such as magnetic
assisted impaction coating, hybridiser and rotating fluidized bed coater that could be
used to prepare IPCA (Pfeffer et al., 2001). None of these methods have been used to
prepare IPCA in the ten years since the first mechanofusion IPCA.

48
1.4.5 Substrate for photodegradation
IPCAs have been used principally to photodegrade a variety of organic
contaminates, typically hazardous substances such as phenol, chlorophenol, azo dyes,
pesticides and other chlorinated compounds (Figure 1-17). However, only five studies
in the literature surveyed involved an actual characterised wastewater sample and two
other studies looked at the degradation of commercially purchased humic acid, a
constituent of the natural organic materials found in water.
25
19
18
16
14
4
3
3
5
44 1 Phenolic compounds
Methylene blue
Methyl orange
Other dye
Other
Microorganism/endotoxin
Chemical weapons
Chlorinated solvents
Wastewater
Pharmaceuticals
Rhodamine B
Pesticides
Figure 1-17 Number of substrates (numbers on the inside of the graph) used for
photodegradation in the 104 surveyed studies (some studies use more than one
substrate).
For paper mill wastewater, the best performing ACF- based IPCAs removed
15 mg/L more COD and colour removal was 50 % faster when compared to P25
(Yuan et al., 2007). The IPCA showed minimal loss of photocatalysis ability after
three adsorption cycles. A similar study used a Fe doped, ACF based IPCA (Li et al.,
2010). The Fe-doped IPCA could reduce COD by a third more than the IPCA
containing non doped TiO2 and was twice as effective as unmodified TiO2. The same
pattern was repeated for colour removal although the differences in the colour

49
removal rate were much smaller with the Fe-doped IPCA removing almost 100 % of
the colour compared to 80 % for unmodified TiO2. Regeneration using UV light
allowed it to maintain a 50 % removal rate for COD under pilot plant conditions. The
IPCA was also used to reduce the COD of effluent from a municipal sewage plant
demonstrating the longevity of the IPCA in typical operating conditions. This study is
one of only two in the surveyed IPCA literature to use an IPCA on municipal
wastewater. No other information was provided on the characteristics of the
wastewater other than the COD the IPCA removed. This means assessing the overall
effectiveness of this IPCA - as a polishing treatment for municipal wastewater - is not
possible with the information detailed in this study. An IPCA based on a GAC
designed for wastewater treatment was used to remove colour compounds
(absorbance at 254 nm, with molecular weights of 400–10,000 Dalton) for a
municipal sewage treatment plant (Zhu and Zou, 2009). The initial colour removal
declined from 90 % to 50 % after 10 adsorption cycles and using separate
regeneration steps the colour removal could be returned to approximately original
levels. The comparison for the regeneration step was undertaken only once and there
was no comparison with an unmodified IPCA. Therefore there is no indication of the
lifespan of the IPCA compared to an unmodified AC.
A PAC IPCA was prepared using sol-gel TiO2 doped with N. This TiO2 was
then applied to the PAC using either stirring or a self-assembly method using AC
treated with poly(sodium styrene sulfonate) to attract the TiO2 particles to the AC
surface (Zhang et al., 2011a). The 11.2 mg/L concentration of humic acid is found in
the environment and the IPCA prepared using the self-assembly method degraded
approximately half of the humic acid after 250 min of illumination. This rate of
degradation was no higher than the TiO2 control and the effect of photolysis was not
investigated in this study.
A similar study used a slightly higher concentration of humic acid (15 mg/L);
a sol gel prepared IPCA and measured the degradation rate using UV adsorption and
total organic carbon (TOC). The best performing IPCA achieved a TOC removal rate
greater than 95 % in 180 min and a corresponding reduction in UV absorbance. The
IPCA performed better than photolysis and photocatalysis using TiO2, however the
catalyst concentration of TiO2 was lower than the IPCA and this may have been
detrimental to its performance. The difference in TOC between the TiO2 control and
IPCA was around 20 % which corresponds to approximately 1 mg/L in a solution that

50
had a 5 mg/L initial concentration. This may not be a significant difference in terms of
overall performance. GAC IPCAs prepared using a sol gel method with a TiO2:AC
ratio from 0.03:1 to 0.63:1 have been used to inactivate (kill or prevent from
reproducing) microorganisms (Li et al., 2008a). The best performing IPCA (47 %
TiO2) sterilised the sample in 175 min compared to a 70 % reduction in viable E.coli
numbers in 250 min for 100 % TiO2 slurry. Another IPCA prepared by a sol gel
method was used to degrade 50 mg/L and 200 mg/L of microcystin-LR
(cyanobacteria endo toxin) (Lee et al., 2004a, Lee et al., 2004b). The removal of
microcystin-LR was accomplished in 15 min under UV illumination compared to a 60
% reduction in 60 min without illumination. No TiO2 slurry control was included so it
is unclear if this IPCA has enhanced photodegradation properties compared to
unmodified TiO2.
A mixture of P25 and activated carbon - prepared by pyrolysis (activation) of
sewage sludge - was used to reduce ionic mercury Hg(II) to metallic mercury Hg(0)
(Zhang et al., 2004). Hg(0) is insoluble in water in contrast to Hg(II) and thus has
higher affinity for activated carbon. Under UV illumination this system was able to
remove a third more mercury than the activated carbon on its own. Recovery from the
AC of 40 % to 65 % of the adsorbed Hg(0) was possible using separate chemical
processing.
Generally studies of dyes as target compounds use decolouration to measure
degradation (Fu et al., 2004a, Khan, 2002, Li et al., 2006, Liu et al., 2007b) while
studies using HOPs (hazardous organic pollutant) measure the degradation of the
target compound (Torimoto et al., 1997, Yoneyama and Torimoto, 2000). Total
organic carbon (TOC) and/or dissolved organic carbon (DOC) or CO2 released during
photodegradation can also be used to measure the mineralisation of the compound
(Eggins et al., 1997, Torimoto et al., 1996, Torimoto et al., 1997). If the substrate is a
simple compound or is well characterised then investigation of intermediate formation
yields additional information on IPCA efficiency. For instance methyl orange
photodegradation creates phenol as an intermediate product. In a comparison of a sol
gel and CVD IPCAs both are equally efficient in degrading methyl orange, however
the CVD IPCA was more effective at degrading the intermediate product (phenol) and
consequently the mineralisation rate measured by TOC was 100 % higher (Zhang and
Lei, 2008).

51
Artificial aeration is incorporated into some experimental designs (Ding et al.,
2001b, Fu et al., 2004b, Li et al., 2005, Li et al., 2008b, Sun et al., 2009, Wang et al.,
2009a, Zhang et al., 2005c, Zhang and Lei, 2008). Aeration may improve
photodegradation by ensuring that there is sufficient O2 that can be reduced to the
superoxide radical O2- which speeds up degradation (Zhang et al., 2008). However, it
remains unclear if O2 addition improved performance in all cases. IPCAs have also
been used to degrade gaseous or volatile pollutants such as formaldehyde (Mo and
Ye, 2009), methanol (Tao et al., 2006), ethylene (Ye et al., 2009), BTEX compounds
(benzene, toluene, ethylbenzene, and xylenes) (Jo and Yang, 2009) and dimethyl
sulphide (Jo et al., 2011). This application of IPCAs was commercialised for air
cleaners (Fujishima and Zhang, 2006) and remains the only current practical
demonstration of the technology.
1.4.6 Regeneration/reuse of IPCAs
The ability of IPCAs to be regenerated and/or reused is a primary
consideration if practical applications of IPCAs are to be demonstrated. Repeated
adsorption/degradation tests have been conducted on a limited number of IPCAs
using either three (Gao et al., 2011, Khan, 2002, Mozia et al., 2007b, Yuan et al.,
2007), four (Shi, 2009, Yao et al., 2010), five (Ao et al., 2008d, Basha et al., 2010),
six (Ao et al., 2008a, Ao et al., 2008c, Ao et al., 2009, Cao et al., 2010, Liu et al.,
2010), seven (Liu et al., 2009), fifteen (Li et al., 2010) or 20 (Li et al., 2005)
regeneration/degradation cycles. Regeneration degrades the substrate on the surface
and in the pores of the AC in order to restore its original adsorption capacity. This
step necessitates desorption of the substrate from the pores in the AC into solution –
either the bulk solution or the fluid in the pore volume - and then migration to the
illuminated TiO2 particles otherwise the adsorption sites on the AC cannot become
available for the adsorption of more substrate i.e. they cannot be regenerated (Foo and
Hameed, 2010a, Leary and Westwood, 2011, Lim et al., 2011, Wang et al., 2009b).
The effectiveness of IPCA regeneration varies based on their properties which
influence the migration from the pores of the AC to the illuminated surface. For
example fifteen adsorption/degradation cycles using methylene blue led to a reduction
of its removal rate from 100 % to 92 % with a 7 % loss of the TiO2 on the IPCA (Fu
52
et al., 2006). The photodegradation ability decreased with each cycle to varying
degrees. This was attributed to the blocking of micropores and the inability of the UV
light to enter these pores to trigger photodegradation. Other studies reported
approximately 20 % lower substrate removal after six cycles (Ao et al., 2009). An 80
% reduction in the rate of photodegradation has been reported, whereby 2 h of
illumination were required for 80 % substrate decomposition in the first cycle
compared to 10 h required for 80 % decomposition in the twentieth cycle (Li et al.,
2005). Another study described essentially unchanged photodegradation performance
after four cycles (Basha et al., 2011).
Desorption rates in solution have not been investigated in IPCA studies
although they have been investigated in studies of AC adsorption which should be
applicable to IPCAs. Desorption in terms of the backward rate constant is found to be
significantly slower than the adsorption (forwards rate constant) for the adsorption of
phenol (Rengaraj et al., 2002). Desorption of microcystin-LR (Lee et al., 2004a, Lee
et al., 2004b) using methanol extraction yielded approximately 15 % of the substrate
adsorbed on the AC. Desorption from the IPCA was approximately 1 % and the
author attributed the difference in desorbed concentration to the photodegradation of
the substrate on the IPCA. Given that only a small percentage of the total microcystin-
LR desorbed suggests that the degradation rate is either slowed by the need for
desorption (as only a small percentage can desorb at a given time) or that only a small
percentage of the total adsorption sites can be regenerated. The need for methanol for
desorption limits its practicality for IPCAs in typical operating conditions. For 2-
methyl-4-chlorophenoxyacetic acid (MCPA) desorption, high temperatures and
pressures of 160 - 180°C and 38 bar respectively were able to desorb between 20 %
and 60 % of the adsorbed substrate for an AC (Gimeno et al., 2003). These studies
suggest that the total regeneration of the adsorption capacity of the AC is impossible.
The papers listed at the start of this section indicate that an IPCA can be reused from
five to twenty times while maintaining varying levels of performance. This opposing
evidence can be reconciled by considering that many studies lack necessary controls
(Appendix A and B) and could be inaccurate because they are measuring residual
adsorption by the IPCA rather than achieving total saturation of the AC surface before
regenerating it. In addition adsorption is occurring at the same time as
photodegradation in IPCA studies compared to the dark adsorption conditions where
ACs are used and then regenerated usually ex-situ (outside of the reactor) after

53
reaching saturation. IPCAs might demonstrate the ability to repeatedly degrade
organic pollutants and still not be able to recover their original dark adsorption
capacity.
For regenerating IPCAs several processes have been investigated either as an
alternative to, or supplement to UV light. A hybrid ultrasound (from an ultrasonic
bath) and UV system was used to regenerate an IPCA utilised for removing colour
compounds from treated wastewater (Zhu and Zou, 2009). Regeneration using UV
light alone required 16 h, UV light and hydrogen peroxide required 3 h but
regeneration using UV and ultrasound required only 30 min and achieved the highest
regeneration levels. This study did not consider the effect of ultrasound on the
stability of the activated carbon. Separate research using ultrasound to regenerate
GAC has shown that the percentage of particles smaller than what could be
considered GAC (<2.5 mm) increased from 0 to 4.6 % after 1 h of sonication (Lim
and Okada, 2005). While it was noted that this is smaller than the loss of GAC in
thermal reactivation of approximately 10 % it is a disadvantage of ultrasonic
regeneration. This is especially relevant to IPCAs as ultrasonication may not only
affect particle size but may also loosen the deposited TiO2 on the IPCA surface.
Another study compared the efficiency of regenerating a coated chitosan ACF IPCA
using UV light and Fenton reagent (Liu et al., 2010). In six subsequent
adsorption/regeneration cycles the removal rate of the UV regenerated and Fenton
regenerated IPCAs remained above 82 % and 86 % respectively, while the removal
rate of the IPCA that was not regenerated declined from 91 % initially to 51 % after
six cycles of adsorption/regeneration. Although the Fenton reagent performed
marginally better the structure of the IPCA could be damaged (Liu et al., 2010).
Ultrasonic irradiation results in the formation and collapse of micro scale
bubbles and generation of local high temperatures and is an alternative to UV light as
an energy source for creating electron holes in TiO2 particles (Kubo et al., 2005).
Ultrasonic irradiation of water causes acoustic cavitation i.e. microscale bubbles are
formed. The collapse of these bubbles causes locally high temperatures and extreme
pressure (up to 5000K and 1000 ATM) that can decompose water to create hydroxyl
radicals, which degrade organic compounds. In ultrasonification studies using an
ultrasonic probe immersed in the test solution, 90 g/L of IPCA degraded 1 mol/L of
phenol in 180 min and 1.5 g/L IPCA degraded 0.6 mol/L of phenol in 540 min (Kubo
et al., 2007). Increasing catalyst loadings markedly increased phenol degradation rates

54
and it was noted that this would not be possible using photocatalysis due to light
penetration problems. However the effect of ultrasonication on the stability of the
IPCA and consequent changes in adsorption behaviour were not investigated.
1.4.7 IPCAs and photocatalytic reactor design
Conventional photocatalysis test systems typically use either a suspension of
TiO2 (Karpova et al., 2007, Molinari et al., 2008, Zhang et al., 2007) or an
immobilised layer (Blanco et al., 2009, Byrne et al., 1998, Guillard et al., 2004) of
unmodified TiO2. In order to treat wastewaters effectively the TiO2 must be kept
under constant illumination. Under illumination from a 125 W Hg lamp, up to 28 h
were required for complete mineralisation of a 47 mg/L solution of gemfibrozil with
0.4 g/L of photocatalyst (Yurdakal et al., 2007) although mineralisation times for
gemfibrozil in a membrane photoreactor (with 1 g/L photocatalysts) can be as short as
150 min for 97 % mineralisation (Molinari et al., 2008). In contrast, an IPCA can
concentrate the pollutant in a smaller area improving efficiency by increasing
substrate contact time with the photocatalyst (Augugliaro et al., 2006) which is
important when the pollutant concentration is very low in the µg/L or ng/L range.
Moreover, a photocatalysis system using a suspension of TiO2 (or a PAC based
IPCA) requires that the suspension be removed from the water after the photocatalysis
step is finished. In a water treatment plant this may be done via filtration or
coagulation limiting the possibility of recovery of the catalyst and increasing the cost
of treatment. This problem can be overcome by using a GAC, EAC or ACF based
IPCA which can be readily filtered from the water or used in a fixed or fluidised bed
arrangement obviating the need for separation.
An alternative approach is the use of photocatalytic membrane reactors
(PMRs) which filter out the TiO2 after the photocatalysis step (Mozia et al., 2007a).
While PMRs remove the TiO2 suspension and allow its reuse, they do not overcome
the low adsorption and constant illumination problems of TiO2 suspensions. Systems
that use immobilised thin films of unmodified TiO2 do not have the removal problems
of suspensions of TiO2; however they are limited by their low surface to volume ratio
and therefore require large capacities (Ochuma et al., 2007). The use of

55
microstructured reactors is being investigated to overcome these problems (Coyle and
Oelgemöller, 2008, Matsushita et al., 2007).
Magnetic separation represents an innovative solution to liquid-catalyst
separation. It involves applying TiO2 to an inert silica or activated carbon support that
had been impregnated with magnetic magnetite particles (Ao et al., 2008c, Ao et al.,
2009, Kostedt et al., 2005, Wang and Zhou, 2010). The resulting composites are used
in photocatalytic reactors where a magnetic field is used to both stir and recover the
catalyst.
IPCAs generally have reaction rates higher than unmodified or virgin TiO2
(Section 1.4.5) and the use of IPCAs with larger particle sizes allows the use of
IPCAs in fluidised bed type reactors which are simpler and do not require active
filtration thus reducing reactor costs.
1.5 Conclusions
IPCAs are effective for degrading a wide variety of organic pollutants. IPCAs
are more effective than either AC or TiO2 separately and the proposed mechanism to
explain this synergy is the concentration of the substrate at the TiO2 surface by the
AC. A wide variety of IPCA preparation methods are available that centre around sol-
gel methods and the ultrasonication of the raw materials.
1.6 Project aims
1. Investigation of the capacity the capacity of IPCAs, commercial AC and TiO2 to
adsorb and photodegrade pharmaceuticals.
2. The potential for synergy between AC and TiO2 for the removal of
pharmaceuticals.

56
1.7 Project objectives
This work has the following objectives:
1. Preparation of IPCAs using activated carbon and titanium dioxide.
2. Characterisation of IPCAs using SEM, FESEM and XRD.
3. Determine the adsorption kinetics of IPCAs, commercial AC and TiO2 for
famotidine and solifenacin succinate.
4. The adsorption capacity of IPCAs, commercial AC and TiO2 for famotidine and
solifenacin succinate in deionised water at different initial pHs.
5. The adsorption capacity of IPCAs, commercial AC and TiO2 for different initial
concentrations of famotidine and solifenacin succinate in deionised water.
6. The photolysis of famotidine and solifenacin succinate under light from a medium
pressure mercury lamp.
7. The ability of IPCAs, commercial AC and TiO2 to photodegrade famotidine and
solifenacin succinate.
8. The potential for synergy between AC and TiO2 for the removal of famotidine and
solifenacin succinate.

57
Chapter 2 Materials and
Methods
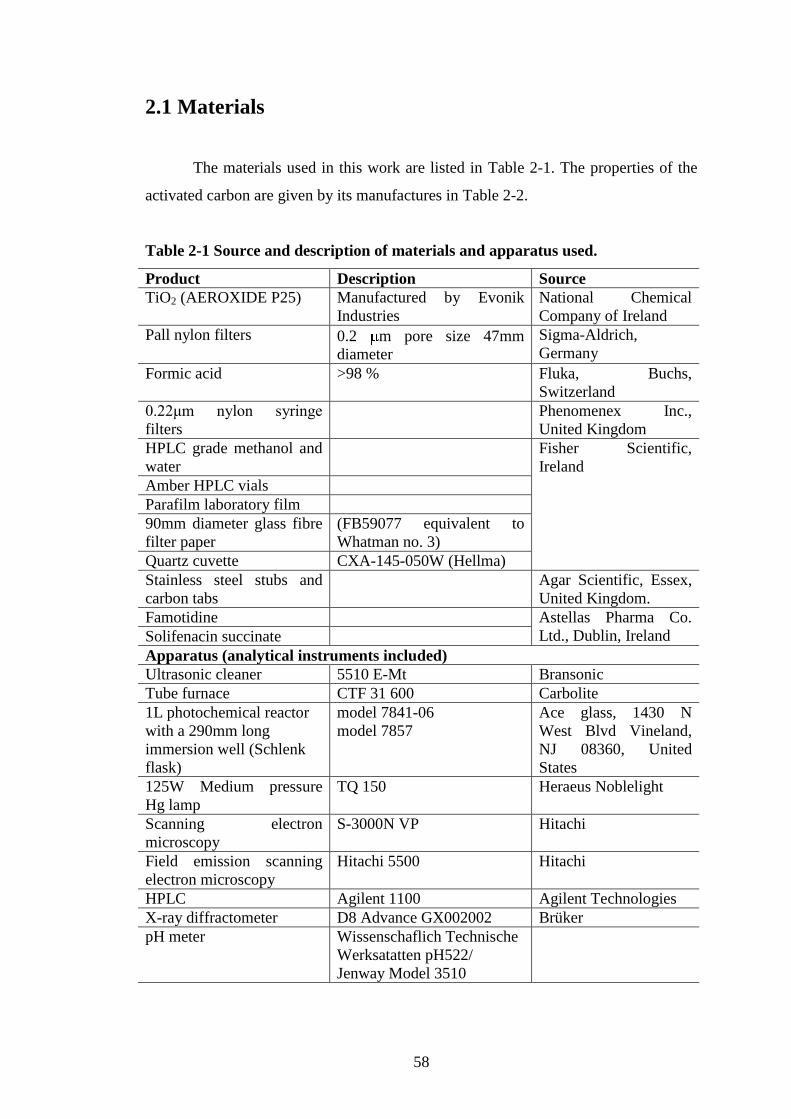
58
2.1 Materials
The materials used in this work are listed in Table 2-1. The properties of the
activated carbon are given by its manufactures in Table 2-2.
Table 2-1 Source and description of materials and apparatus used.
Product Description Source
TiO2 (AEROXIDE P25) Manufactured by Evonik
Industries
National Chemical
Company of Ireland
Pall nylon filters 0.2 m pore size 47mm
diameter
Sigma-Aldrich,
Germany
Formic acid >98 % Fluka, Buchs,
Switzerland
0.22μm nylon syringe
filters
Phenomenex Inc.,
United Kingdom
HPLC grade methanol and
water
Fisher Scientific,
Ireland
Amber HPLC vials
Parafilm laboratory film
90mm diameter glass fibre
filter paper
(FB59077 equivalent to
Whatman no. 3)
Quartz cuvette CXA-145-050W (Hellma)
Stainless steel stubs and
carbon tabs
Agar Scientific, Essex,
United Kingdom.
Famotidine Astellas Pharma Co.
Ltd., Dublin, Ireland Solifenacin succinate
Apparatus (analytical instruments included)
Ultrasonic cleaner 5510 E-Mt Bransonic
Tube furnace CTF 31 600 Carbolite
1L photochemical reactor
with a 290mm long
immersion well (Schlenk
flask)
model 7841-06
model 7857
Ace glass, 1430 N
West Blvd Vineland,
NJ 08360, United
States
125W Medium pressure
Hg lamp
TQ 150 Heraeus Noblelight
Scanning electron
microscopy
S-3000N VP Hitachi
Field emission scanning
electron microscopy
Hitachi 5500 Hitachi
HPLC Agilent 1100 Agilent Technologies
X-ray diffractometer D8 Advance GX002002 Brüker
pH meter Wissenschaflich Technische
Werksatatten pH522/
Jenway Model 3510

59
2.2 Methods:
2.2.1 IPCA preparation
2.2.1.1 Initial IPCA preparation method.
AquaSorb 2000 (6 g) was added to a 0.2 L solution of deionised water with
0.6 g of P25 corresponding to a P25: AquaSorb 2000 wt. ratio of 1:10. This IPCA is
therefore denoted the 1:10 IPCA. This mixture was then ultrasonicated (Bransonic
5510 E-Mt) for 1 h. The ultrasonicated IPCA solution was oven dried (at 80°C). The
IPCA was then washed by adding 0.02 L - 0.03 L of deionised water to the dried
IPCA which was then stirred and the water – now containing loose TiO2 - was
decanted using a Pasteur pipette. This process was repeated five times to remove
loose TiO2. Deionised water was then added to the beaker containing the IPCA until it
reached the 0.05 L mark. This suspension was oven dried at 110 C. The dried IPCA
was collected and stored in sealed glass vials before use. The same procedure was
used for the 1:1, 1:1.33, 1:2, 1:4, 1:5, 1:40, 1:20, 1:13, 1:100 and 1:200 IPCAs with
the only difference being that the ratios of TiO2 to activated carbon were adjusted to
match the IPCA name.
Table 2-2 Activated carbon specification provided by manufacturer.
Carbon name:
Properties
AquaSorb 2000 (Aqua 2k)
Surface area (m2/g) 1050
Particle size (mm) 0.425-1.70
Iodine number (mg/g) >1000
Pore volume (cm3/g) 1.04
Ash content (%) <15 %
Moisture content (wt. %) <5
AC type GAC
pH 8-11
Typical application Water treatment
Donated by ENVA Water Treatment, Cork, Ireland

60
2.2.1.2 IPCA prepared for heat treated IPCAs
Heat treated IPCAs used the same method for the preparation as the 1:10
IPCA (Section 2.2.1.1) with the following heat treatment conditions. Four grams of
1:10 IPCA were placed evenly inside an alumina ceramic–“boat” type crucible 100
mm x 20 mm x 20 mm (Length x width x depth) in size. The crucible was placed in
the centre of a horizontal tube furnace (Carbolite CTF 31 600). The temperature
increase rate (ramp rate) for the furnace was 10 C a minute with a treatment time
(after the desired temperature was reached) of 2 h for all samples. At 200 C the IPCA
samples were heat treated in air. For the 500 C / 600°C / 700°C IPCA samples the
1:10 IPCA was heat treated at 500 C / 600°C / 700°C in an argon atmosphere. The
furnace was purged of air with argon for five minutes after insertion of the sample and
an argon flow rate of approximately 16 cm3 per second was maintained until the
sample was removed. Samples were heat treated for 2 h and then left to cool for 1 h.
2.2.1.3 Improved IPCA preparation method
AquaSorb 2000 (10 g) was added to a 0.4 L solution of deionised water with 1
g of P25 corresponding to a P25: AquaSorb 2000 wt. ratio of 1:10. This mixture was
then ultrasonicated (Bransonic 5510 E-Mt) for 1 h. The ultrasonicated IPCA solution
was oven dried (at 80°C), washed in deionised water and then poured onto glass fibre
filter paper. The IPCA grains were washed off the filter paper with deionised water
into a separate 0.05 L beaker. The smaller TiO2 particles remained bound to the filter
paper. The IPCA was then washed by adding 0.02 L - 0.03 L of deionised water to the
dried IPCA which was then stirred and the water – now containing loose TiO2 - was
decanted using a Pasteur pipette. This process was repeated three times to remove
loose TiO2. Deionised water was then added to the beaker containing the IPCA until it
reached the 0.05 L mark. This solution was oven dried at 110 C. The dried IPCA was
collected and stored in sealed glass vials before use.

61
2.2.2 Characterisation methods for P25, AC and IPCAs
2.2.2.1 Scanning electron microscopy
The surface structures of AC and IPCAs were analysed by scanning electron
microscopy (SEM) using a Hitachi S-3000N VP SEM with a tungsten filament
electron gun and Oxford INCA EDS system. The samples were adhered onto stainless
steel stubs using carbon tabs. EDX analysis was performed on the 1:2 IPCA (Figure
3-2) at 20 kV and processed using INCA software. All SEM micrographs of the AC
(Figure 3-3) and 1:10 IPCA (Figure 3-4) were captured at 20 kV using the secondary
electron detector at x30,000 magnification. EDX analysis of the 1:10 IPCA was
performed at 20 kV and processed using INCA software.
2.2.2.2 Field emission scanning electron microscopy
Field emission scanning electron microscopy (FESEM) studies used a Hitachi
5500 FESEM equipped with a cold field emission tungsten source with built-in anode
heater and an Oxford INCA EDS system. The sample was adhered onto a copper grid
using PVC glue before it was placed on the stage for analysis. Only the 1:10 IPCA
was used for FESEM analysis. All FESEM images were processed by the “noise
reduction” feature of the FESEM software. The accelerating voltage varied from 20
kV to 25 kV during image capture using the secondary electron and dark field
detectors. EDX analysis of the 1:10 IPCA was performed at 20 kV and processed
using INCA software.
2.2.2.3 X-ray diffraction
X-ray diffraction (XRD) studies were conducted at room temperature (20°C -
25°C) using a Brüker D8 Advance GX002002 x-ray diffractometer with NaI
scintillator detector configured with either a soller slot or a 0.6 mm solid slot. A 0.6
mm slit was placed in front of the 60 kV, 2.2 kW Cu-Kα radiation X-ray source.
IPCA samples were adhered onto borosilicate glass slides using two sided pressure
sensitive adhesive tape and the TiO2 was applied using petroleum jelly. The glass

62
slides and adhesives were analysed separately to provide controls for all samples.
Aqua 2k was used as the AC control. The diffraction angle (2-theta) was set to 22 to
80 for all studies. Data processing used Diffrac plus XRD commander version 2.6.0
and EVA Application 8,0,0,2 software. Scan speed was set to nine seconds/step and
the increment was set to 0.05.
2.2.2.4 Fourier Transform Infrared Spectroscopy
Infrared spectra of the 1:10 IPCAs were obtained using a Fourier Transform
Infrared Spectrophotometer (FTIR GX 2000, Perkin-Elmer). For the FTIR study, 30
mg of finely ground AC and IPCA were pelleted with 300 mg of KBr (Sigma) in
order to prepare translucent sample disks. The FTIR samples were sent to the Central
Salt and Marine Chemicals Research Institute, Bhavnagar, Gujarat, India for analysis.
The FTIR of the KBr AC pellet was made using the transmission method. The FTIR
spectra were recorded with 10 scans at a resolution of 4cm-1
. An unused 1:10 IPCA, a
1:10 IPCA used for famotidine dark adsorption and a 1:10 IPCA used for
photodegradation were separately analysed. All the experiments were conducted in
triplicate and in some cases 4–5 times. However, only the average values are shown in
the figures for clarity. The standard deviation in all cases was found to be ±5 %.
2.2.3 Analytical methods for famotidine and solifenacin
High performance liquid chromatography (HPLC) method
Famotidine/ solifenacin concentrations were measured using a high
performance liquid chromatography (HPLC) system consisting of an Agilent 1100
(Agilent Technologies, Palo Alto, Ca, USA) low-pressure gradient pump equipped
with a UV–Vis detector. This method was based on a combined method for
famotidine, solifenacin and tamsulosin determination (Deegan, 2011). The LOD (limit
of detection) and LOQ (limit of quantification) for famotidine/ solifenacin was 0.2
mg/L and 1 mg/L respectively. A 150 mm x 4.6 mm, 3.5 μm particle Luna
pentaflourophenyl propyl reverse phase column (Phenomenex Inc., United Kingdom)
was used for separation of the analyte. The mobile phase used for famotidine analysis
consisted of 15 % methanol to 85 % water (purchased from Fisher Scientific Ireland)

63
with 0.1 % formic acid (Fluka, Buchs, Switzerland). The mobile phase used for
solifenacin analysis was 60 % – 70 % methanol to water (purchased from Fisher
Scientific Ireland) with 0.1 % formic acid (Fluka, Buchs, Switzerland).
This solution was filtered by 0.22 µm nylon filters (Sigma-Aldrich, Germany)
and degassed by ultrasonication (5510 E-Mt Bransonic) for 30 min. The eluent flow
rate was 1 mL/min and the injection volume was 50 μL. The wavelength of the
detector was set at 205 nm. Data were processed by Agilent Chem Station software
B.02.01SR1.
A 1000 mg/L famotidine/ solifenacin stock solution was prepared by
dissolving 100mg of famotidine/ solifenacin into a 0.1 L volume flask using the
mobile phase prepared for analysis: 15 % methanol: 85 % water with 1 mL formic
acid for famotidine and 60 % - 70 % methanol: 40 % - 30 % water with 1 ml formic
acid for solifenacin. This stock solution was used to prepare 10 mg/L, 25 mg/L, 50
mg/L, 75 mg/L and 100 mg/L famotidine standards using 0.01 L volumetrics. All
samples and standards were placed in amber HPLC vials (Fisher Scientific Ireland)
for analysis.
2.2.4 Sorption studies
2.2.4.1 General adsorption method
All adsorption studies used 0.05g of TiO2/ AC/ 1:10 IPCA in 0.1 L
famotidine/ solifenacin solutions in 0.25 L borosilicate glass conical flasks sealed
with parafilm and shaken at 150 rpm in the dark in a 15°C+/-2°C temperature
controlled room. Solutions of 100 mg/L famotidine or solifenacin were prepared by
dissolving 100 mg of pharmaceutical in 1 L of deionised water and ultrasonicating
(Bransonic 5510 E-Mt) this solution for 30 min. The pH of the solution was measured
at the start and end of each study using a Jenway Model 3510 pH meter. Each study
was done in duplicate and separate adsorbent free controls were prepared using the
same method. The shaker was stopped to take 1 mL samples from the famotidine/
solifenacin solutions and adsorbent free controls using pasture pipettes.
For TiO2 studies 3 mL samples were taken from the famotidine/ solifenacin
solutions and adsorbent free controls using pasture pipettes. The 3 mLs of sample

64
solution were filtered with 0.22 μm nylon syringe filters (Phenomenex Inc., United
Kingdom) to remove any TiO2 particles before analysis. The reduction in the volume
of solution with sampling was included in any adsorption loading calculations. The
filtered samples were analysed using high performance liquid chromatography
(HPLC) (see Section 2.2.3).
The adsorbed substrate or adsorption loading, q (mg/g) represents the substrate
uptake and was calculated (Dai, 1994, Hameed et al., 2009, Kim et al., 2008) from the
difference in substrate concentration in the aqueous phase before and after adsorption,
as per following equation:
W
)CV(Cq fi (15)
where, q is the adsorption loading, V is the volume of substrate in solution (L),
Ci and Cf are the initial concentration of substrate in solution (mg/L) and the final
concentration of substrate in solution (mg/L) (after a given time typically 22 h)
respectively, and W is the mass of AC/IPCA (g).
2.2.4.2 Adsorption kinetic studies
The method detailed in Section 2.2.4.1 was used for adsorption kinetic studies
with the following exception: 0.25 mL samples were taken from the famotidine/
solifenacin solutions in the IPCA and AC studies using pasture pipettes.
2.2.4.3 Effect of initial pH
The method detailed in Section 2.2.4.1 was used with the following
exceptions. Adjustment of the famotidine/ solifenacin solution to pH 2 used 1 M HCl,
adjustment to pH 4 and pH 6 used 0.1 M HCl and adjustment to pH 8 used 0.1 M
NaOH (Hameed et al., 2009, Purkait et al., 2007, Putra et al., 2009). The HCl and
NaOH were added to the famotidine/ solifenacin solution drop wise using pasture
pipettes until the desired pH was achieved. The famotidine or solifenacin solution was
stirred while measurements were taken by a pH meter (Wissenschaflich Technische
Werksatatten pH522 or Jenway Model 3510 for solifenacin and all P25 adsorption
studies). After the desired pH was achieved the adsorbent was added to the famotidine
or solifenacin solutions.

65
2.2.4.4 Effect of initial concentration
The method detailed in Section 2.2.4.1 was used with the following
exceptions. One hundred milligrams of famotidine/ solifenacin dissolved in 0.1 L of
the mobile phase used for analysis was used to prepare a 1000 mg/L stock solution of
famotidine. The initial concentrations studied were 20 mg/L, 40 mg/L, 50 mg/L, 60
mg/L, 80 mg/L, 100 mg/L and 150 mg/L. The initial concentrations were prepared by
adding 2 mL, 4 mL, 5 mL, 6 mL, 8 mL, 10 mL and 15 mL of stock solution to 0.1 L
volumetric flasks and making up to the mark with deionised water. For solifenacin
AC/ IPCA studies, 10 mg/L and 30 mg/L concentrations were also used. These 0.1 L
solutions were added to the 0.25 L conical flasks after 0.05g P25/ AC/ IPCA were
weighted into them. For P25 studies the 0.1 L solutions were added to the 0.25 L
conical flasks after 0.05 g P25 was weighted into them. The 0.1 L solutions were used
to wash the P25 from the weigh boat into the conical flask. The pH of the solution
was measured after the P25/ AC/ 1:10 IPCA was added - and at the end of the study -
while the solution was stirred.
2.2.4.5 Desorption studies
0.2 g of AC was weighted into 0.2 L solutions in 0.5 L borosilicate glass
beakers sealed with parafilm and shaken at approximately 100 rpm in the dark.
Solution pH and ambient temperature was also monitored during sample removal. pH
of the solution was not adjusted, therefore the natural pH of the solution (pH 6 - 8)
was used for all studies. Desorption studies can be divided into two parts: the
adsorption stage followed by the desorption stage.
In the adsorption stage the AC is contacted with a famotidine / solifenacin
solution to allow the AC to become loaded with pharmaceutical. In the desorption
stage the AC that was contacted with famotidine/ solifenacin was placed in 0.2 L of
deionised water. When the solution was changed the solution was decanted and the
AC was washed with deionised water by adding 25 mLs of deionised water to the AC
and then decanting it. This process was repeated three times. After the AC was
washed the 0.5 L beaker was filled with a 0.2 L 100 mg/L famotidine/ solifenacin
solution. All samples were analysed by HPLC (Section 2.2.3).

66
Two types of desorption experiments were undertaken, where the AC had
different levels of saturation in each. The procedure of both is detailed below:
1. One cycle of saturation – The AC was placed in a 100 mg/L famotidine/
solifenacin solution and shaken for 24 h. After 24 h of adsorption the famotidine/
solifenacin solution was decanted and the AC washed. 0.2 L deionised water was
added and then 1ml samples were taken to measure desorption from the AC. After
a period of time the deionised water solution was changed and the AC washed.
2. Three cycles of saturation – The AC was placed in a 100 mg/L famotidine/
solifenacin solution (0 h). Samples were taken after 24 h (48 h) and the
famotidine/ solifenacin solution was decanted and the AC washed. A fresh 0.2 L,
100 mg/L famotidine/ solifenacin solution was added and a sample was taken
after 24 h (72 h) of desorption. The AC was washed and then placed in 0.2 L of
deionised water (0 h) signifying the start of the desorption phase. pH
measurements were make during the taking of 1ml samples from the famotidine/
solifenacin solutions. After 48 h of desorption the solution was decanted and the
AC washed and immersed in a 0.2 L deionised water solution. Samples were
taken after 24 h intervals at 72 h and 96 h.
2.2.5 Models used for adsorption analysis
2.2.5.1 Intraparticle diffusion model
The intraparticle diffusion model (Arivolia et al., 2009, Hameed et al., 2009,
Hameed, 2009, Hossain and McLaughlan, 2011, Kumar et al., 2003, Thirumal and
Kaliappan, 2011, Önal, 2006) can be expressed by the following equation:
Ctkqt0.5
int (16)
Where qt is adsorption loading (mg/g) at a given time (days), kint is the
intraparticle diffusion rate constant (mg/g day−1/2
) and C is the intercept and indicates
the presence of boundary layer diffusion and t is time (days).

67
2.2.5.2 Bangham equation
Bangham equation (Önal, 2006) is given as:
αlog(t)2.303V
mklog
qtmC
Cloglog b
0
0
(17)
Where C0 is the initial concentration of the adsorbate in solution (mg/L), V the
volume of solution (L), qt is the amount of dye adsorbed (mg/g) at time t, t is time
(days), m the weight of the adsorbent used (g/L). α (which must be <1) and kb, the
pore diffusion rate (mL/(g/L)) are the constants (Tütem et al., 1998, Önal, 2006). For
a plot of Log Log (Ci/Ci-m*qt) vs. log (t), α is the slope of the line and kb is equal to
10^intercept(2.303V/m).
2.2.6 Models used for isotherm studies
2.2.6.1 Langmuir
The Langmuir equation (Langmuir, 1916) is expressed as:
22hL
22hLm22h
CK1
CKqq (18)
Where q22h is the adsorption loading (mg/g) after 22 h, qm (mg/g) is the
maximum amount of the adsorbate per unit weight of the adsorbent to form a
complete monolayer on the surface (monolayer adsorption capacity), C22h is the
concentration in solution after 22 h adsorption, KL (L/mg) is the Langmuir constant
related to the affinity of the binding sites (free energy of adsorption).
2.2.6.2 Freundlich
The Freundlich isotherm model (Freundlich, 1907, Mohan and Singh, 2002) is
expressed as:
n
1
22hF22h CKq (19)
Where q22h is the adsorption loading (mg/g) after 22 h, C22h is the
concentration in solution after 22 h adsorption, KF (l/mg), 1/n are Freundlich

68
constants related to sorption capacity and sorption intensity of the adsorbent, which
represent the quantity of sorbate adsorbed onto the IPCAs and AC for an equilibrium
concentration.
2.2.6.3 Temkin isotherm
The Temkin isotherm (Hameed et al., 2009, Kundu and Gupta, 2006, Lataye
et al., 2008) is expressed in linear form as:
)Bln(CBln(A)q 22h22h (20)
Where q22h is the adsorption loading (mg/g) after 22 h, C22h is the
concentration in solution after 22 h adsorption, B = RT/b, B is the Temkin energy
constant (J mol−1
) R the universal gas constant (J mol−1
K−1
), T the absolute
temperature (K), b is the variation of adsorption energy (J mol−1
) and A is the
equilibrium binding constant (l mg−1
) corresponding to the maximum binding energy.
A plot of q22h versus lnC22h enables the determination of the isotherm constants, B and
A from the slope and intercept of the line respectively (Lataye et al., 2008).
2.2.6.4 Redlich–Peterson (R-P) isotherm
The Redlich and Peterson model (Kumar et al., 2003, Kumar et al., 2008,
Lataye et al., 2008, Redlich and Peterson, 1959) is usually given as:
β
22hpr
22hpr
22hCA1
CKq
(21)
Where q22h is the adsorption loading (mg/g) at equilibrium, C22h is the
concentration in solution after 22 h adsorption, Kr-p and Ar-p are the Redlich and
Peterson isotherm constants (Aksu and Yener, 2001). The equation was determined
using a non-linear regression method (Aksu and Yener, 2001). This equation was
calculated using the Solver Add-In for Microsoft Excel. The isotherm can also be
expressed (Wu et al., 2010) as:
β
22hpr
22hprpr
22hCeA1
CAKq
(22)
Eq (22) can be transformed into:

69
β
22h
prprpr22h
22h CK
1
KA
1
q
C
(23)
There are two limiting behaviors: When β = 1 the equation converts to the
Langmuir form (eq 22) and when b = 0 it converts to Henry’s law. When Ar-p = 0, it
transforms into the Freundlich isotherm equation.
2.2.6.5 Error checking of isotherm studies
The fit of calculated isotherm data to the experimental data was investigated
using the sum of the squares of the errors (SSE) test (Eq 24) (Basha et al., 2011, Choy
et al., 2004, Kumar et al., 2008, Kundu and Gupta, 2006, Kundu and Gupta, 2006)
and the standard error (SE) test (Basha et al., 2010) shown in Eq 25.
m
1i
2qexp)(qcalSSE
(24)
m
1i
2qexp)(qcal
pn
1SE
(25)
Where qcal is the calculated adsorption loading (mg/g) at a given time, qexp is
the experimental determined adsorption loading (mg/g) at a given time, n is the
number of data points in the data set and p is the number of parameters in the model
being tested.

70
2.2.7 Method for photodegradation studies
Photolysis and photocatalysis studies were conducted using a 1 L borosilicate
glass photoreactor (Schlenk flask) manufactured by Ace Glass (model 7841-06) and
an immersion well (model 7857); 290 mm in length with water cooling (Figure 2-1).
A 125 W medium pressure mercury lamp (TQ 150 Heraeus Noblelight, emission
between 248 nm and 579 nm, λmax 366 nm see Appendix D) inserted in the middle
of the reactor was used as the light source. All studies were illuminated by this light
source for 180 min. Tap water was circulated through the immersion well (water
cooling jacket) to keep the solution temperature from rising 2°C - 3°C above room
temperature (21°C). The famotidine/ solifenacin solution in the photoreactor was
mixed using a magnetic stirrer at 150 rpm. All studies had an equilibrium stage where
they were placed in the reactor for a given time (240min to 15min) and not
illuminated. Samples taken during the dark adsorption stage are denoted with negative
values e.g. samples taken 60 min before illumination are denoted as -60. Samples
containing TiO2 were syringe filtered with 0.22 m nylon filters to remove any TiO2
particles in the sample. Samples (3ml) were taken and analysed as described in
Section 2.2.3. The catalyst concentrations were 0.2 g/L, 0.3 g/L, 0.4 g/L and 0.5 g/L
for TiO2 catalyst concentration optimisation, 0.4g/L for TiO2 studies and for IPCA
studies 0.4 g/L or 1.5g/L. Two initial concentrations were studied: 50 mg/L and 100
mg/L for famotidine and 45 mg/L and 100 mg/L for solifenacin succinate.

71
A) B)
Figure 2-1 A) Schematic of photochemical reactor, B) Photograph of
photochemical reactor using 1:10 IPCA during illumination.

72
Chapter 3 Characterisation of
AC and IPCAs

73
3.1 Introduction
Physical characterisation methods were used to investigate the properties of
the IPCAs. The methods used for the IPCA were also used on the AC and where
applicable TiO2. In this chapter:
Morphological features of the surface of the AC and IPCAs are determined using
SEM and FESEM analysis.
Energy dispersive x-ray (EDX) is used to analyse the distribution of TiO2 across
the surface of the IPCA and its elemental composition.
The crystalline structure of the AC and TiO2 is analysed using X-ray diffraction
(XRD).
3.2 Scanning electron microscopy / energy dispersive X-ray
of AC and IPCAs.
The texture and morphology of the catalyst are important parameters that
influence photocatalytic activity. It is established that small TiO2 aggregates that are
uniformly dispersed, have more reactive sites than agglomerated particles which have
a smaller surface area (Foo and Hameed, 2010a). Separate from TiO2 agglomeration a
good dispersion of TiO2 across the surface of an AC is necessary to create an effective
IPCA as large areas without TiO2 will not have photocatalytic ability, reducing the
overall performance of an IPCA.
The first IPCA to be investigated was the 1:2 IPCA (prepared using a ratio of
50% TiO2 to AC by mass) as its high TiO2 to AC ratio would likely give more signal
response than an IPCA with lower TiO2 loading. The SEM image of the 1:2 IPCA
(Figure 3-1) depicts the granular structure of the carbon surface and shows that it is
irregular with some smooth surfaces. EDX analysis of this grain of the 1:2 IPCA
(Figure 3-2) shows the presence of titanium (thus titanium dioxide) on the surface of
the IPCA. The EDX spectrum also shows the presence of trace levels of Ca, S, Al and
Fe. These are likely impurities in the IPCA from Aqua 2k, an AC prepared from
bituminous coal which would contain these elements (Xue and Lu, 2008).

74
Figure 3-1 SEM image of the 1:2 IPCA surface.
Element C O Al Si S Ca Ti Fe
Weight% 69.53 21.81 0.58 1.50 0.40 0.05 5.97 0.16
Atomic% 78.56 18.50 0.29 0.72 0.17 0.02 0.169 0.04
Figure 3-2 SEM - EDX spectrum of 1:2 IPCA.
The SEM image of an AC in Figure 3-3 depicts the carbon surface and shows
that it is irregular with some smooth surfaces. The SEM image of a 1:10 IPCA
(Figure 3-4) shows a roughened AC surface caused by the homogeneous deposition of
aggregates of TiO2 on the carbon surface, which is in line with comparable studies
(Araña et al., 2003b). EDX analysis of a grain of the 1:10 IPCA (Figure 3-5, Figure

75
3-6) demonstrate a distribution of titanium across its entire surface. The titanium
loading appears uneven with some areas of the IPCA displaying notably higher
titanium concentrations. While this may be due to irregular distribution of the TiO2
across the IPCA surface it is more likely caused by emission of X-rays from surfaces
of the IPCA that face away from the detector and consequently cannot be detected
(Figure 3-7). The areas of the IPCA facing or in proximity to the detector therefore
appear to have the highest Ti composition (Eggert 2011).
Figure 3-3 SEM micrograph of Aqua 2k AC.

76
Figure 3-4 SEM micrograph of 1:10 IPCA.
Figure 3-5 EDX analysis of titanium on the 1:10 IPCA surface.

77
Element C O Al Si S Ca Ti
Weight% 65.91 20.50 0.11 0.77 0.71 0.09 11.91
Atomic% 77.58 18.11 0.06 0.39 0.31 0.03 3.51
Figure 3-6 EDX spectrum and elemental composition of the 1:10 IPCA surface.
Detect
or
Detect
or
Flat surfaceRough surface
e- beam Generated x-ray
Figure 3-7 Simplified diagram of the emission of X-rays from rough and flat
surfaces in EDX.
3.3 Field emission scanning electron microscopy of AC and
IPCAs
FESEM uses a field-emission cathode in the electron gun of a SEM to provide
narrower probing beams, improving resolution while minimizing sample charging and
damage. The improved resolution allows higher magnification than SEM. It was used
to provide higher magnifications (180,000 vs. 30,000) of the AC and IPCA surface
compared to SEM images.

78
Figure 3-8 shows the TiO2 distribution around the surface of a small particle
of GAC. Figure 3-9 is a magnification of the centre bottom section of Figure 3-8 and
the measurements of the TiO2 particles are shown. The TiO2 particles have a diameter
in the region of 15 nm – 31 nm. These images demonstrate that TiO2 can be dispersed
effectively across the AC surface by the ultrasonication impregnation method used to
prepare the IPCAs. Not every grain of AC was evenly coated with TiO2 and several
larger agglomerations of P25 were also visible indicating that this method does not
create an IPCA with a completely even distribution of TiO2. Figure 3-10 shows the
irregular surface of the 1:10 IPCA with heavy deposition of TiO2 on the top right
hand corner, a section of this segment is magnified and shown in Figure 3-11. The
agglomerations of TiO2 are clearly visible and the larger particles of P25 are
deposited at the bottom of the TiO2 layer with smaller grains deposited on top. This
effect is caused by the drying procedure during IPCA preparation, the larger and
heavier particles should settle first followed by smaller and lighter particles.
Figure 3-8 FESEM image of a small grain of 1:10 IPCA.

79
Figure 3-9 FESEM image showing the diameter of TiO2 particles on the IPCA
shown in Figure 3-8.
Figure 3-10 FESEM image of a section of 1:10 IPCA.

80
Figure 3-11 Magnified FESEM image of an area of the 1:10 IPCA covered in
TiO2.
A grain of unmodified Aqua 2k AC is shown in Figure 3-12. It has the same
irregular macro structure surface as the 1:10 IPCA but without the deposits of TiO2.
The few bright spots on the surface are either a build-up of charge on the AC surface
from the electron beam or particles of trace elements in the AC. The surface of the
AC shown in Figure 3-13 is at the same magnification as the image of the 1:10 IPCA
(Figure 3-11). Figure 3-13 shows an irregular but smooth surface that is
fundamentally different to that shown in Figure 3-11. This proves that the
agglomerations present in Figure 3-11 are P25 TiO2 particles and not features of the
AC surface. The FESEM results verify the SEM results ensuring agreement of both
methods and it indicates the SEM method is able to resolve the P25 effectively, but
not at the same resolution as FESEM.

81
Figure 3-12 FESEM image of a grain of unmodified AC.
Figure 3-13 High magnification FESEM image of an area of the AC surface.
EDX analysis of the 1:10 IPCA using FESEM yielded similar results to the
SEM EDX analysis (Figure 3-5) for the presence of Ti and other trace elements in the
AC. Two sites on the 1:10 IPCA were studied and these sites are labelled A (Figure
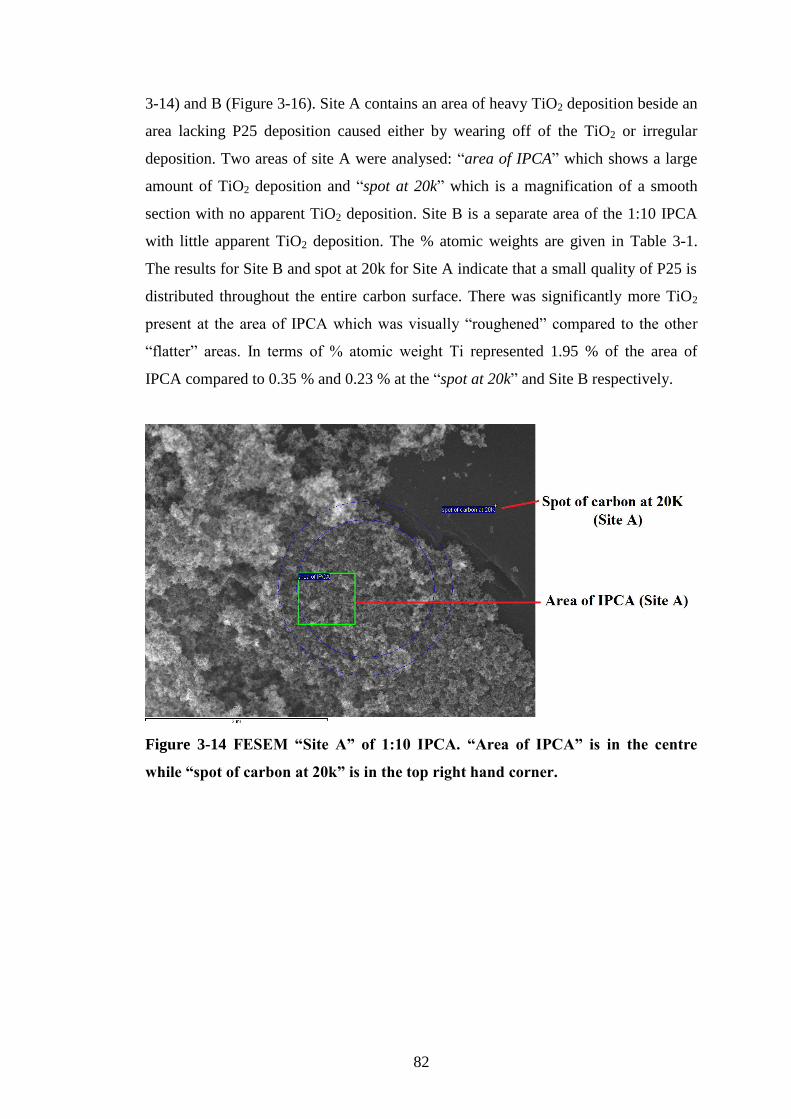
82
3-14) and B (Figure 3-16). Site A contains an area of heavy TiO2 deposition beside an
area lacking P25 deposition caused either by wearing off of the TiO2 or irregular
deposition. Two areas of site A were analysed: “area of IPCA” which shows a large
amount of TiO2 deposition and “spot at 20k” which is a magnification of a smooth
section with no apparent TiO2 deposition. Site B is a separate area of the 1:10 IPCA
with little apparent TiO2 deposition. The % atomic weights are given in Table 3-1.
The results for Site B and spot at 20k for Site A indicate that a small quality of P25 is
distributed throughout the entire carbon surface. There was significantly more TiO2
present at the area of IPCA which was visually “roughened” compared to the other
“flatter” areas. In terms of % atomic weight Ti represented 1.95 % of the area of
IPCA compared to 0.35 % and 0.23 % at the “spot at 20k” and Site B respectively.
Figure 3-14 FESEM “Site A” of 1:10 IPCA. “Area of IPCA” is in the centre
while “spot of carbon at 20k” is in the top right hand corner.

83
SAlTiS
Ti
SiO
Ti
C
0 0.5 1 1.5 2 2.5 3 3.5 4 4.5 5 5.5
keVFull Scale 2595 cts Cursor: 5.895 (38 cts)
area of IPCA
Figure 3-15 FESEM EDX spectrum of “Area of IPCA”.
Figure 3-16 FESEM Site B “Spot of carbon”.
TiO Ti
Zr SZr
ZrTi
S
C
0 0.5 1 1.5 2 2.5 3 3.5 4 4.5 5 5.5
keVFull Scale 567 cts Cursor: 5.877 (26 cts)
Spot on carbon
Figure 3-17 FESEM spectrum of "Spot of carbon".

84
Table 3-1 FESEM, EDX analysis. All elements analysed (Normalised). All results
in atomic%.
C O Al Si S TiO2 Zr
Site A
Area of IPCA 64.47 32.28 0.09 1.01 0.2 1.95
Spot at 20k 91.93 7.13 0.5 0.2 0.23
Site B
Spot of carbon 94.58 4.02 0.96 0.35 0.09
3.4 X-ray diffraction
XRD is an analytical technique which reveals information about the
crystallographic structure and chemical composition of powders and thin films. XRD
was used to investigate the crystalline phase of the TiO2 and the crystalline
structure(s) of the AC. Both of these parameters can influence the adsorption and
photoactivity of IPCAs and must be monitored especially when an IPCA is heat
treated as these properties are changed by heat treatment (see Section 5.4).
The legend names each sample and the type of slot placed over the detector.
The glass slides used for mounting the samples were analysed and the results are
shown in Figure 3-18. The plain glass slide analysed with the solid slits had a stable
baseline with no peaks indicating that the glass slide is inert for this analysis. When
the glass is covered with petroleum jelly and analysed with a sollor slot there are no
peaks but there is a gradual increase in the baseline at lower 2-theta angles. Petroleum
jelly was used to bind the powdered TiO2 to the glass slide as its viscous nature
allows a large amount of TiO2 to be incorporated onto the slide compared to adhesive
tape where the layer of TiO2 is only a few particles thick. Unlike other adhesives
petroleum jelly has no crystalline structure which is important because it will not give
any peaks in the XRD spectrum. However, the alkane chains in the petroleum jelly are
said to have diffraction peaks close to graphite (Cunningham et al., 2004). Given that
there are no peaks at or near the graphite peak at 26.5° this implies that the increase in
the baseline is caused by extra x-rays entering the detector through the sollor slot that
would be filtered out by the solid slits. It is also possible that it is caused by trace
metal impurities in the glass or x-ray interactions with the carbonaceous material in

85
the petroleum jelly that are too small to be detected using the solid slits. However a
baseline with this shape is not observed in the P25 studies (Figure 3-19) which
indicates that the petroleum jelly is not the cause and that the rise in the baseline will
not interfere with the analysis of other samples.
Figure 3-18 XRD spectra of glass slide (with silts) and glass slide covered with
petroleum jelly (with sollor slot).
Figure 3-19 shows the XRD spectrum of P25 TiO2. The sample analysed with
solid slits has a lower signal in terms of the number of counts and a higher signal to
noise ratio. There is no difference in location of the peaks using either method with
the exception of the peaks at 69° and 70.5° which are not visible using solid slits. The
reduction in the signal to noise ratio from 11:1 for the solid slits to 7:1 for the sollor
slots is a worthwhile trade-off to enhance the signal for smaller peaks which aids the
identification of the TiO2 phases.

86
Figure 3-19 XRD spectra of P25 adhered to a glass slide with petroleum jelly
with solid slits and a sollor slot.
Figure 3-20 is the same spectrum as Figure 3-19 but the vertical lines
correspond to the crystal structure. The peaks at 25°, 38°, 48°, 54°, 55°, 70.5° and 75°
correspond to a synthetic anatase phase (SS-NNNN 89-4921). The peaks at 27.5°,
36°, and 41° correspond to the rutile phase (SS-NNNN 89-0553). The peaks at 54.5°,
63° and 69° could refer to either phase due to signal overlap in the case of 69° or
insufficient resolution to separate close peaks belonging to both phases for example
54.5° could be a rutile peak or part of the anatase peak at 54°. The rutile phase has an
overall weaker signal compared to anatase. This indicates that the P25 is mainly
composed of anatase TiO2 with a smaller concentration of rutile. A calculation based
on peak height would indicate that this P25 is approximately 80 % anatase to rutile
(Zhao et al., 2010). This value is within the ratio of values found in the literature
(Section 1.4.1). The % anatase to rutile in P25 is important because the rutile phase
has a lower conducting band potential and may act as an electron sink reducing the
recombination of charge carriers. A change in the polymorph ratios could alter the
photocatalytic activity.

87
Figure 3-20 XRD spectra of P25 adhered to a glass slide with petroleum jelly
with solid slits and a sollor slot. The vertical lines indicate crystalline phase.
The XRD spectrum of the non-heat treated 1:10 IPCA is shown in Figure
3-21). The XRD spectrum of the 1:10 IPCA heat treated at 700°C (see Section
2.2.1.2) is shown in Figure 3-22. The XRD spectrum of unmodified AC is shown in
Figure 3-23. There is no noticeable difference between the two 1:10 IPCAs. The AC
returns a stronger signal especially in the 40-50° regions. Peaks are visible at 26.5°
and 60° for all IPCAs but are absent in the P25 controls (Figure 3-19). These peaks
correspond to graphite - the spectra are similar to commercial graphite results reported
in the literature (Liang et al., 2003) - which would appear in the XRD spectrum either
because it is a constituent of the AC (Zhao et al., 2009) or limited parallelism between
the graphene layer of the AC created x-ray scattering that corresponds to graphite
(Marsh and Rodríguez-Reinoso, 2006c). The rising baseline at low 2-theta angles is
typical of carbonaceous materials (Cunningham et al., 2004) and would be consistent
with the defective graphene layer structure of AC and is evident in other studies (Jia
et al., 2007, LI et al., 2011, Velasco et al., 2010c). The low concentration of P25 on
the surface of the IPCA makes it difficult to resolve the crystalline phase of the TiO2.
The peaks at 25°, 38°, 48°, and the weak signals at 54°, 55° are present in the IPCA
but not the AC and correspond to synthetic anatase. Due to the lower response no
rutile peaks are visible in contrast to P25 where several were visible. The main rutile
peak at 27.5° is not visible due to the rising baseline caused by the AC. For the
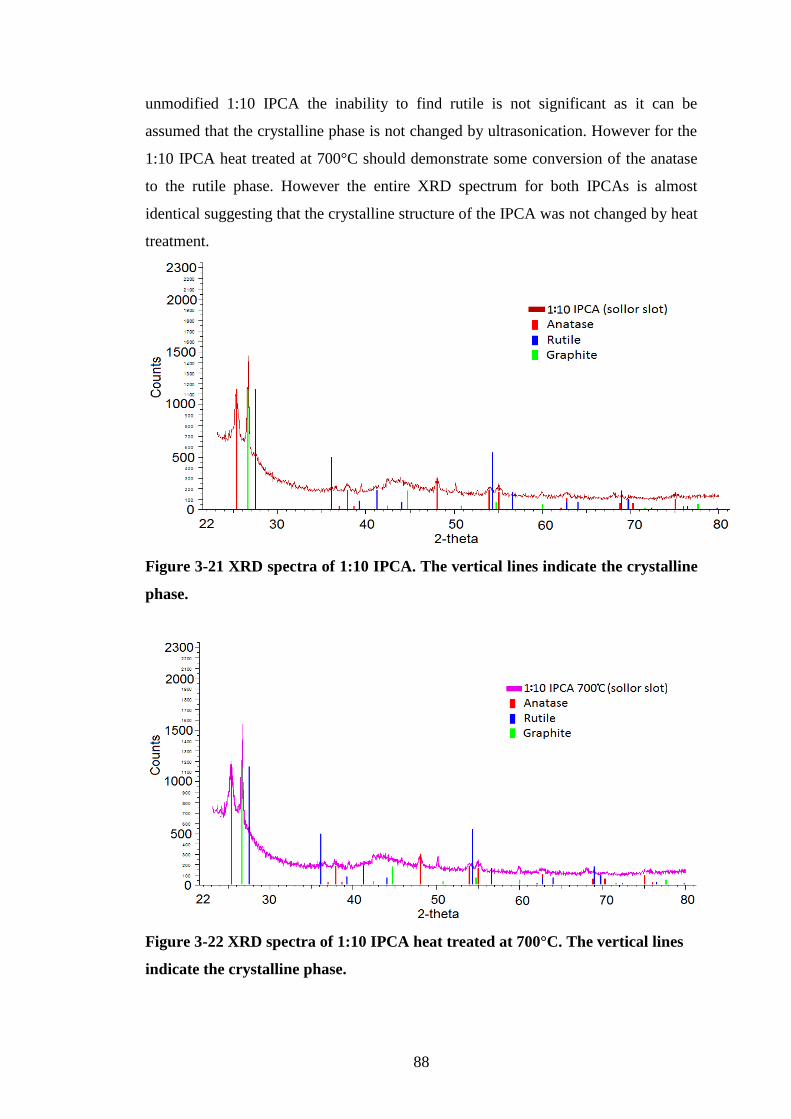
88
unmodified 1:10 IPCA the inability to find rutile is not significant as it can be
assumed that the crystalline phase is not changed by ultrasonication. However for the
1:10 IPCA heat treated at 700°C should demonstrate some conversion of the anatase
to the rutile phase. However the entire XRD spectrum for both IPCAs is almost
identical suggesting that the crystalline structure of the IPCA was not changed by heat
treatment.
Figure 3-21 XRD spectra of 1:10 IPCA. The vertical lines indicate the crystalline
phase.
Figure 3-22 XRD spectra of 1:10 IPCA heat treated at 700°C. The vertical lines
indicate the crystalline phase.

89
Figure 3-23 XRD spectra of activated carbon. The vertical lines indicate the
crystalline phase.
A peak at 50° exists on the IPCA and AC but is absent in the P25 spectrum. Its
larger peak height on the AC implies that it is a feature of the AC. Its lower response
on the IPCA is possibly due to attenuation of the X-rays by the TiO2 layer on the
IPCA. Attempts to identify this peak were unsuccessful.
3.5 Conclusions
Characterisation of the IPCA confirmed that P25 is distributed across the
Aqua 2k surface by the ultrasonication method and that the anatase to rutile ratio in
the P25 is 80 %. In conclusion:
The SEM results confirm that the TiO2 is distributed across the IPCA surface.
FESEM studies have shown that the TiO2 particles typically have a 25 nm particle
diameter but are present in larger agglomerations.
XRD results demonstrated that the AC is graphitic in nature while the TiO2 is
mixed phase with a larger content of the anatase phase to the rutile phase.
Heat treatment of the IPCA did not cause a noticeable change in the phase of the
TiO2 on the IPCA.

90
Chapter 4 Adsorption Studies

91
4.1 Introduction
Adsorption studies of the activated carbon (AC) (Aqua 2k) and TiO2 provide
baseline adsorption properties of the separate materials before they are used to create
an IPCA. The adsorption capacities of the IPCAs were studied to determine the effect
of adding TiO2 on the adsorption capacity of the AC surface. The adsorption kinetics
of AC and IPCAs in the dark were analysed by the intraparticle diffusion model and
Bangham equation. Isotherm data were analysed using the Langmuir, Freundlich,
Temkin and Redlich–Peterson models to provide an insight into the interaction
between the adsorbent (AC and IPCA) and the adsorbate (famotidine or solifenacin).
This chapter will investigate:
The adsorption kinetics of TiO2, AC and IPCA.
The effect of different pHs and initial famotidine and solifenacin concentrations on
the adsorption capacity of TiO2, AC and IPCA.
The results of isotherm and kinetic models applied to the adsorption data.
Desorption of adsorbed famotidine and solifenacin from AC into solution to
ascertain substrate migration out of the pores of the AC.
4.1.1 Pharmaceuticals under investigation
Two pharmaceuticals: famotidine and solifenacin succinate were selected for
photodegradation and adsorption studies using TiO2, AC and IPCAs. These two
pharmaceuticals were selected since they are priority pollutants present in our
industrial partner’s (Astellas, Dublin) production waste streams.
Famotidine, 3-{[2-(diaminomethyleneamino)-1,3-thiazol-4-yl]-methyl-thio}-
N2-sulfamoyl-propionamide is a histamine H2-receptor antagonist that is a potent
inhibitor of gastric and acid secretion in humans (Hassan et al., 1997, Hegedüs et al.,
1989). The structure of famotidine is shown in Figure 4-1. It has a molecular weight
of 337.449. It contains terminal amino groups and has two well-known crystal
structural dimensions (Ferenczy et al., 2000). Its removal from the body has a half-life
of 2.5 h to 3.5 h and 65 % to 70 % of the compound is recoverable unchanged in the
urine of subjects given famotidine (Lee et al., 2004c). It is discharged from the
pharmaceutical industry and partially degraded during conventional water treatment

92
(Radjenović et al., 2009). Famotidine removal has been studied at three large WWTPs
with population equivalents of 74,000, 170,000 and 400,000 (Verlicchi et al., 2012).
Famotidine was detected in 19 % of the influent samples and 8 % of the effluent
samples. Removal efficiencies were 90 %, 10 % and 85 % with 10 %, 5 % and 15 %
adsorption onto the waste activated sludge respectively. The WWTPs with longer
solid retention times (SRTs) (10 and 16 days) performed best. These results and the
widespread use of famotidine suggest pervasive discharge into the environment via
sewage sludge or WWTP effluent. The stability of famotidine in solution and in
combination with other drugs has also been investigated (Wu and Fassihi, 2005).
Stability varied considerably depending on storage conditions. At pH 2 under light
from a “fluorescent lamp” at 37°C the half-life of a 10 mg/L deionised water solution
of famotidine was 0.65 days while at pH 4 in the dark the same concentration had a
half-life of 154 days. Famotidine has a Log Dow (Log distribution coefficient of
octanol-water) of -0.64 and a Log Pow (Log partition coefficient of octanol-water) of -
2.1 (ChemSpider 2012, Wishart et al., 2012).
Figure 4-1 Structure of famotidine.
Solifenacin Succinate ((+)-(1S,3_R)-quinuclidin-3_-yl1-phenyl-1,2,3,4-
tetrahydroisoquinoline-2-carboxylate monosuccinate) is the succinic acid salt of
azabicyclophenyl-isoquinolinecarboxylate and has a molecular weight of 480.55 g.
The structure of solifenacin succinate is shown in Figure 4-2. It is a muscarinic
receptor antagonist, and has higher selectivity for the urinary bladder than for the
salivary gland minimising the dry mouth side effect of similar drugs (Maniscalco et
al., 2006, Yanagihara et al., 2007). Solifenacin is weakly basic (pKa 8.5) and is 93 %
positively ionized (cationic) at pH 7.4. The Log Pow is 3.96 (ChemSpider 2012,
Wishart et al., 2012) and the Log Dow (Log Pow at pH 7) is 1.69, indicating that the
octanol: water distribution at pH 7 is 50:1 therefore solifenacin is highly lipophilic

93
(Maniscalco et al., 2006). It is used for the treatment of overactive bladder syndrome
and was shown to improve symptom bother, work productivity, activity participation,
and medical care resource utilization in elderly subjects (Zinner et al., 2009). Studies
of solifenacin degradation via IPCAs or TiO2 were not found in the literature.
Figure 4-2 Structure of solifenacin succinate.
4.2 TiO2 adsorption
4.2.1 Famotidine adsorption
4.2.1.1 Kinetics of TiO2 adsorption
The adsorption of a 100 mg/L concentration of famotidine onto TiO2 over 72
hours is shown in Figure 4-3. The concentration in the control sample without
adsorbent remained constant at 100 mg/L. Equilibrium in the TiO2 sample appears to
have been reached after 7 h, with adsorption of 2 mg - 3 mg of famotidine onto P25
TiO2. No samples were taken after 72 h. These results in Figure 4-3 demonstrate that
the 22 h contact time selected for adsorption studies is adequate for TiO2 adsorption.

94
0
20
40
60
80
100
120
0 10 20 30 40 50 60 70 80
Fa
mo
tid
ine
con
cen
tra
tio
n (
mg
/L)
Time (hours)
P25
Control
Figure 4-3 Famotidine concentration (mg/L) vs. time (days) for P25 TiO2
adsorption. Average results shown (N=2), error bars are standard deviation.
4.2.1.2 Effect of initial concentrations on adsorption
The adsorption capability of TiO2 for famotidine was further investigated
using a number of different initial concentrations of famotidine (Figure 4-4). The
adsorption of famotidine by TiO2 was minimal, even at high concentrations. At the
highest adsorption loading (2.5 mg/g) the concentration of famotidine was reduced
from 40.6 mg/L to 39.3 mg/L.

95
0.0
0.5
1.0
1.5
2.0
2.5
3.0
3.5
0 20 40 60 80 100
Ad
sorp
tion
lo
ad
ing (
q)
(mg/g
)
Famotidine concentration after 22 h (C 22 h) (mg/L)
Figure 4-4 Adsorption loading (q) of famotidine onto TiO2 vs. famotidine
concentration after 22 h (C22h). Initial concentrations were 20 mg/L, 30 mg/L, 40
mg/L, 50 mg/L, 60 mg/L, 80 mg/L and 100 mg/L. Average results shown (N=2),
error bars are standard deviation.
These results are in agreement with the literature as it is widely reported that
TiO2 (including P25) has little adsorption capacity. The BET surface area of P25 by
N2 adsorption is 44 – 53 m2/g
(Balázs et al., 2008, Velasco et al., 2010b)
. No values
for pharmaceutical adsorption onto TiO2 were found in the published literature.
However several studies did include adsorption data for other organic compounds
such as phenol and heavy metals. These results are summarised in Table 4-1.
Table 4-1 Sample adsorption values for TiO2 reported in the literature
Photocatalyst Substrate (Ci) Solution
volume
Result Ref
50 mg/L P25 2.67 μM As(III),
0.2 mg/L
0.05L 13 μmol/g, 0.97 mg/g (Liu et al.,
2008)
1 g/L P25 100 mg/L
Phenol.
0.4L <3 mg/g “<3 %
removal”, 31.88
μmol/g
(Velasco et al.,
2010a, Velasco
et al., 2010c)
0.5 g/L P25 80 mg/L Hg(II) 0.2L 20 mg/g, 250 μmol/g
Hg(II) adsorption
(Zhang et al.,
2004)
2.5 g/L sol-gel
TiO2
20 mg/L Phenol 0.2L 0.24 mg/g 2.55
μmol/g “3 %
adsorption”
(Li et al., 2007)

96
4.2.1.3 Effect of pH on adsorption
The low adsorption capacity of TiO2 could be due to the initial solution pH
(3.8) of the isotherm studies being unfavourable for adsorption. The point of zero
charge (PZC) is defined as the pH at which the net charge is zero (Saepurahman et al.,
2010). The PZC of P25 is usually give as 6.5 i.e. at pHs below 6.5 it is positively
charged and negatively charged at pHs higher than 6.5. The change on a surface
influences its adsorption properties as more cations will be adsorbed on a negatively
charged surface (Órfão et al., 2006). The surface charge also influences
agglomeration of particles which would lower the particles surface area.
Consequently the relationship between initial pH (pHi) and famotidine adsorption
(initial concentration 100 mg/L) in the pH range of 4 to 8 was also evaluated (Figure
4-5). The removal capacity showed no trend as the pHi value of the solution increased
from 4 to 8. Famotidine adsorption rises from pH4 to pH6, however when error bars
are considered there is no trend in famotidine adsorption from pH6 to pH8. pH buffers
were not used to maintain the solution pH as they might compete with the famotidine
for adsorption onto the TiO2.
0
2
4
6
8
10
12
3.0 4.0 5.0 6.0 7.0 8.0
Ad
sorp
tion
load
ing
(q)
(mg/
g)
Initial pH (pHi)
Figure 4-5 Adsorption loading (q) of famotidine onto TiO2 vs. Initial pH (pHi).
pHi studied were 4, 6, 6.9 and 7.7. Average results shown (N=2), error bars are
standard deviation.

97
It should be noted that famotidine is unstable at low pHs with a half-life of
0.61 days at pH 2 compared to a half-life of 154 days at pH 4 (Wu and Fassihi, 2005).
A series of famotidine controls were used to determine famotidine stability with
respect to pH. Figure 4-6 shows the difference in final concentration with the pHi of
the solution. The controls demonstrate stability at all pHis except pH 2 where the
concentration declined by 34 % over 22 hours. For these reasons famotidine
adsorption at an initial pH of 2 was not studied.
0
10
20
30
40
50
60
70
80
90
100
110
1.0 2.0 3.0 4.0 5.0 6.0 7.0 8.0
Fa
mo
tid
ine
Co
nce
ntr
ati
on
(m
g/L
)
Inital pH (pHi)
Figure 4-6 Famotidine concentration after 22 h (C22h) vs. initial pH (pHi) of
adsorbent free controls. Initial concentration: 100 mg/L. Average results shown
(N=2), error bars are standard deviation.
4.2.2 Solifenacin adsorption
4.2.2.1 Adsorption kinetics of TiO2
The adsorption of solifenacin onto TiO2 is shown in Figure 4-7. The
concentration in the control sample without adsorbent remained on average constant
around 100 mg/L. Similar to the famotidine studies equilibrium appears to have been
reached after 7 h. No samples were taken after 72 h. These results demonstrate that

98
the 22 h contact time selected for adsorption studies is more than adequate for TiO2
adsorption of solifenacin.
0
10
20
30
40
50
60
70
80
90
100
110
0 10 20 30 40 50 60 70 80
So
life
na
cin
co
nce
ntr
ati
on
(m
g/L
)
Time (hour)
P25
Control
Figure 4-7 Solifenacin concentration (mg/L) vs. time (hours) for P25 TiO2
adsorption. Average results shown (N=2), error bars are standard deviation.
4.2.2.2 Effect of initial concentration on adsorption
The adsorption of solifenacin onto TiO2 (Figure 4-8) demonstrates no clear
trend with increasing initial concentration (Ci), similar to famotidine adsorption. TiO2
has a maximum adsorption loading value of 3.5 mg/g at Ci = 150 mg/L and all other
adsorption loading values do not exceed 3 mg/g. This result confirms the low
adsorption capacity of P25 TiO2 for solifenacin.

99
-1
0
1
2
3
4
5
0 20 40 60 80 100 120 140 160
Ad
sorp
tio
n l
oa
din
g (
q)
(mg
/g)
Solifenacin concentration final (Cf) (mg/L)
Figure 4-8 Adsorption loading (q) of TiO2 vs. solifenacin concentration after 22 h
(C22h). Initial concentrations studied were 20 mg/L, 30 mg/L, 40 mg/L, 50 mg/L,
60 mg/L, 80 mg/L and 100 mg/L and 150 mg/L. Average results shown (N=2),
error bars are standard deviation.
4.2.2.3 Effect of pH on solifenacin adsorption
The effect of pH on the adsorption of solifenacin onto TiO2 was investigated
in pHi range from 2 to 8 (Figure 4-9). Unlike famotidine, the adsorption capacity of
TiO2 for solifenacin increased with increasing pH over the entire pH range. Maximum
solifenacin uptake occurred at initial pH 8 with an adsorption loading of 9 mg/g and
the lowest adsorption loading of 1.4 mg/g occurred at initial pH 4. The pH 4 results
are similar to the isotherm results at 3.1 - 3.7 (Ci = 100 mg/L) with average adsorption
loading values of 1.4 mg/g and 0.8 mg/g respectively (Figure 4-8).

100
0
2
4
6
8
10
12
1.0 2.0 3.0 4.0 5.0 6.0 7.0 8.0 9.0
Ad
sorp
tion
load
ing (
q)
(mg/g
)
Initial pH (pHi)
Figure 4-9 Adsorption loading (q) of solifenacin onto TiO2 vs. initial pH (pHi).
pHi studied were 2.1, 4.1, 4.8, 6 and 8.1. Average results shown (N=2), error bars
are standard deviation.
Solifenacin pH controls are shown in Figure 4-10.
0
10
20
30
40
50
60
70
80
90
100
110
1.0 2.0 3.0 4.0 5.0 6.0 7.0 8.0 9.0
So
life
na
cin
co
nce
ntr
ati
on
(m
g/L
)
Inital pH (pHi)
Figure 4-10 Solifenacin concentration after 22 h (C22h) vs. initial pH (pHi) of
adsorbent free controls. Initial concentration: 100 mg/L. Average results shown
(N=2), error bars are standard deviation.

101
These controls were run to determine solifenacin stability with respect to pH.
Figure 4-10 shows the difference in C22h vs. the pHi of the solution. The difference in
solifenacin concentration after 22 h in a pH adjusted solution is negligible.
4.3 AC adsorption
4.3.1 Famotidine
4.3.1.1 Adsorption kinetics of AC
The adsorption of famotidine onto AC is shown in Figure 4-11. The
famotidine concentration in solution dropped constantly during the study, but the
speed decreased with the study time. The concentration in the control sample without
adsorbent remained constant at 100 mg/L. Equilibrium during the study period was
not reached as the famotidine concentration continued to decline throughout the study.
The famotidine concentration in solution dropped below the LOQ (1 mg/L) of the
HPLC method by day 21 therefore further samples were not taken.
0
10
20
30
40
50
60
70
80
90
100
110
0 2 4 6 8 10 12 14 16 18 20 22
Fam
otid
ine
con
cen
trat
ion
(m
g/L
)
Time (days)
Control
AC
Figure 4-11 Famotidine concentration (mg/L) vs. time (days) for AC. Adsorbent
free control is also shown. Average results shown (N=2), error bars are standard
deviation.

102
The constant decline in the famotidine concentration could be due to a very
high adsorption capacity of the AC for famotidine. To test this hypothesis the same
adsorbents used above were placed in a fresh 100 mg/L famotidine solution and the
concentration in solution was monitored over a number of days (Figure 4-12). The
adsorption is fastest in the initial part of the study and adsorption gradually declines
throughout the study period. Famotidine removal is roughly half that of the first
adsorption rate study (Figure 4-11). In the first experiment, after 14 days the AC had
reduced the average concentration in solution from 100 mg/L to 3 mg/L while in the
second experiment on average the AC reduced the initial concentration from 100
mg/L to 55 mg/L. This indicates that as the adsorption sites on the AC surface were
occupied the rate of adsorption of new famotidine molecules from solution decreased.
During this experiment equilibrium is not reached (as the concentration in solution is
constantly decreasing) demonstrating that famotidine has a very high affinity for the
AC and thus a large amount (greater than 250 mg/g) of famotidine can be adsorbed
before equilibrium is reached.
0
10
20
30
40
50
60
70
80
90
100
110
0 2 4 6 8 10 12 14 16
Fa
mo
tid
ine
con
cen
tra
tio
n (
mg
/L)
Time (days)
AC
Control
Figure 4-12 Famotidine concentration (mg/L) vs. time (days) for AC. Adsorbent
free control is also shown. Average results shown (N=2), error bars are standard
deviation.

103
The adsorption loading (mg/g) of AC is shown in Figure 4-13. For the first
adsorption study (1st stage), adsorption levels off suggesting equilibrium is reached at
13 days, however the concentration of famotidine in solution continues to drop
(Figure 4-11). The majority of papers in the literature take this pseudo equilibrium as
the equilibrium concentration for kinetic analysis (see Table 4-2). The exact time for
equilibrium varies between ACs depending on the nature of their pore structure. In the
literature surveyed it varied from minutes to greater than 30 days.
0
20
40
60
80
100
120
140
160
180
200
0 2 4 6 8 10 12 14 16 18 20 22
Ad
sorp
tion
load
ing (
q)
(mg/g
)
Time (day)
AC 1st stage
AC 2nd stage
Figure 4-13 Famotidine adsorption (q) loading (mg/g) vs. time (days) for AC for
first and second stage famotidine adsorption studies. Average results shown
(N=2), error bars are standard deviation.

104
Table 4-2 Features of adsorption studies
Analyte Concentration
studied
Equilibrium
time
Conditions Models* Ref
Resorcinol and
catechol
500 - 1000 mg/L 48 h (data
reported for 25
h)
W= 5 mg/L; V=
0.2 L; pH 7.1; T
= 29.9 +/- 0.3°C
L, F, R–P,
Radke–
Prausnitz, Toth,
and Fritz–
Schlunder.,
(Kumar et
al., 2003)
2,4-D 50 – 400 mg/L 10h (not
confirmed)
W= 0.20 g; V =
0.2L; pH 3.6;
T=30°C
L,F, T (Hameed
et al.,
2009)
17β-estradiol
(radio-
labelled)
0.5 - 100 ng/L 1-5 h (Studied
to 142 h)
W= 2 g/L; V =
0.05 L; pH ?; T =
?°C
None (Fuerhacke
r et al.,
2001)
Atrazine,
Bromoxynil
and Diuron
0.259 - 0.499
mg/L, 0.455 -
0.818 mg/L and
0.261 - 0.558
mg/L
3 days (Fully
confirmed)
W= 0.7-3.1 mg/L
(GAC crushed);
V = 2L; pH ?; T
= 25°C
F, Differential
Column Batch
Reactor
Kinetics.
(Baup et
al., 2000)
Phenol 10 - 60 mg/L 5 h – substrate
runs out.
W= 20 500 mg/L;
V = 0.1L in
0.25L; pH 2-13;
T=27°C
F, First order
rate expression.
(Rengaraj
et al.,
2002)
Amoxicillin 300 mg/L 35 min
(concentration
graph not
shown)
W= 3.5 g (14
g/L); V = 0.25 L
in 0.25 L; pH
2.15-7.04; T =
30°C
L,F, pseudo-
first and second
order models.
(Putra et
al., 2009)
Congo red dye
(CAS No:
573-58-0)
50 - 545 mg/L 20 - 180 min
(not confirmed
needs samples
at longer
intervals)
W= 1g/L; V =
1L; pH 2.15-7.04;
T=30°C
L,F, first and
pseudo second
order models.
(Purkait et
al., 2007)
MCPA 14 – 144 mg/L 49, 53 and 72 h
(the latter not
confirmed)
W= 0.5g (5g/L);
V = 0.1L; pH =
7.; T=20°C
L, F, Shrinking-
core mass-
transfer model.
(Gimeno et
al., 2003)
Methyl green,
methyl violet
200 - 800 mg/g
adsorption
4 - >12 h (not
confirmed)
W = 80 – 120 mg
(114 - 171
mg/L); V = 0.7
L; pH = 5.6, 5.9,
10.6; T=15 -
26°C
L, first order
equation
(Dai,
1994)
2-
chlorophenol
< 4-
chlorophenol
< 2, 4-
dichlorophenol
20 – 300 mg/L 3 - 11day, 6
days for GAC
(not confirmed)
W= 0.01–4g (1-
40g/L); V =
0.045-0.1L; pH =
4.5-6.3 no buffer;
T=22°C
L, F, pseudo
first and second
order, intra-
particle
diffusion
(Hossain
and
McLaughl
an, 2011)
Acid Blue 80,
Acid Red 114
and Acid
Yellow 117
Not stated
probably 50-200
mg/L”
21 days (data
not shown)
W= 0.05g (1
g/L); V = 0.05 L;
pH = ?; T = 20°C
L, P factor,
intra-particle
diffusion
(Choy et
al., 2004)
Phenol, o-
chlorophenol
99 - 204 mg/L 3 to 33 days W= ?g (1 g/L); V
= 0.3 - 0.5L; pH
= 7; T = 20°C
F (Peel and
Benedek,
1980)
*L=Langmuir, F=Frendrich, T=Temkin, R-P=Redlich-Peterson

105
4.3.1.2 Effect of initial pH on famotidine adsorption
The pH of a solution is an important parameter affecting the adsorption
process (Lataye et al., 2008, Yao et al., 2010). A change in the pH alters the charge
profile of adsorbate species which consequently influences their interactions with the
adsorbent (Li et al., 2003). The relationship between initial solution pH (in the pH
range of 4 - 8) and famotidine adsorption by the AC was examined (Figure 4-14).
Results show that the removal capacity increased as the pHi value of the famotidine
solution increased from 4 to 8. The maximum famotidine uptake of 122 mg/g and was
found to occur at pHi 5.6. The AC and famotidine solution had a pH value of 5.8 in
deionised water solutions and famotidine has a pKa (logarithmic acid dissociation
constant) value of 6.9 indicating that famotidine is 93 % protonated at this pH. The
solution pH affects the surface charge of the adsorbents and, therefore, the adsorption
proceeds through dissociation of functional groups on the active sites of the adsorbent
(Lataye et al., 2008, Moreno-Castilla, 2004).
0
20
40
60
80
100
120
140
3.0 4.0 5.0 6.0 7.0 8.0 9.0
Ad
sorp
tion
load
ing (
mg/g
)
Initial pH (pHi)
Figure 4-14 Adsorption loading (q) of famotidine onto Aqua 2k vs. initial pH
(pHi). pHi studied were 4.0, 5.8, 6.0 and 8.0. Average results shown (N=2), error
bars are standard deviation.

106
The famotidine may adsorb onto the AC surface by mechanisms that are not
affected by pH: van der waals forces, π-π stacking and hydrophobic interactions. The
fact that the adsorption varies with pH suggests other mechanisms may be important.
Electrostatic interactions and H bonding (to oxygen groups on the AC surface) would
be influenced by pH. The potential chemical interactions of famotidine with the
sorbent in this case AC or IPCA may be given by the following equations (Lataye et
al., 2008, Moreno-Castilla, 2004). M+
refers to metal oxides (Al, Si, Ca, Ti oxides) on
the AC/ IPCA surface.
Fam + H+ ↔ FamH
+ (27)
Fam + AC/ IPCA ↔ Fam-AC/ IPCA (28)
Fam H+ +M
+ AC/ IPCA ↔ FamH
+-AC/ IPCA + M
+ (29)
H+ + FamH
+-AC/ IPCA ↔ H
+-AC/ IPCA + FamH
+ (30)
H+ + AC/ IPCA ↔ H
+-AC/ IPCA (31)
Fam + H+-AC/ IPCA ↔ FamH
+-AC/ IPCA (32)
The transition of Fam to FamH+ is dependent on pH, with a maximum amount
of FamH+ occurring at low pH (pHi ≤ 4), which results in the low adsorption of
FamH+ onto the positively charged surface of the AC/ IPCA (AC edges may be
positively or negatively charged). At higher pH (pHi ≥ 5.8), the Fam molecules are
netural in charge and are sorbed onto the adsorbents. The AC (and IPCA) has
maximum affinity to Fam and FamH+ for 5.8 ≤ pHi ≤ 8 (5.6 ≤ pHf ≤ 6.8). As the
FamH+ adsorption rate is lower than that of Fam molecules, therefore, the dominant
sorption reaction (at pHi ≈8.0) is given by Eq. (28). Other reactions given by Eq. (27)
and (29) to (32) play a smaller role in the sorption process as evidenced by the low
famotidine adsorption at low pHs and the low metal content on the Aqua 2k surface.
Similar pH effects have been observed by other groups (Karimi-jashni and Narbaitz,
1997, Lataye et al., 2008, Nevskaia et al., 1999).
4.3.1.3 Effect of initial concentration on adsorption onto AC
The influence of initial famotidine concentration on adsorption was
investigated at concentrations ranging from 20 mg/L to 150 mg/L at pH 3.6. To
expedite analysis a 22 h contact time was selected as the largest segment of adsorption
(30 %) occurs during this time. After 22 h of adsorption the lowest concentrations (Ci
= 20 mg/L) in the isotherm are reduced to approximately 2 mg/L. A longer

107
equilibrium time would reduce the lower concentrations (or perhaps all
concentrations) in solution to less than the limit of quantification of the HPLC
detection method (1 mg/L) and as such would not allow the construction of an
isotherm. The results are shown in Figure 4-15.
0
10
20
30
40
50
60
70
80
90
0 20 40 60 80 100 120
Ad
sorp
tion
lo
ad
ing (
q)
(mg/g
)
Famotidine concentration after 22 h (C22h) (mg/L)
Figure 4-15 Adsorption loading (q) of famotidine on Aqua 2k vs. concentration
after 22 h adsorption (C22h). Initial concentrations studied were 20 mg/L, 40
mg/L, 50 mg/L, 60 mg/L, 80 mg/L and 100 mg/L and 150 mg/L. Average results
shown (N=2), error bars are standard deviation.
The adsorption capacity initially displayed a steep rise that declined over time.
This behaviour reflects saturation on the surface of the AC as the famotidine
concentration increased. With the increase of initial famotidine concentration from 20
mg/L to 150 mg/L, the adsorbed famotidine at equilibrium increased from 34 mg/g to
72 mg/g.

108
4.3.2 Solifenacin
4.3.2.1 Adsorption kinetics of AC
The concentration of solifenacin in solution during the study period is shown
in Figure 4-16. The adsorption loading of solifenacin by the AC is shown in Figure
4-17. The concentration in the control sample (without adsorbent) varied slightly from
99 mg/L to 104 mg/L. The concentration in solution dropped constantly but with a
gradual slowing of the adsorption process during the course of the experiment. The
results demonstrate a tendency towards an equilibrium that is not reached during the
29 day study period. These results are very similar to famotidine with the exception
that the adsorption loading (adsorption capacity) is lower. This suggests that the
mechanism effecting famotidine is also relevant for solifenacin. Samples were taken
for 29 days (1740 h). The equilibrium time reported for solifenacin is outside the
majority of values found in the literature (Table 4-2) which contains equilibrium times
from minutes to over a month. Some studies will report that equilibrium has been
reached when the substrate is completely removed from solution while other studies
report equilibrium after a period of time e.g. 24 h (see Table 4-2).
0
10
20
30
40
50
60
70
80
90
100
110
0 5 10 15 20 25 30
Soli
fen
aci
n C
on
cen
trati
on
(m
g/L
)
Time (day)
Control
AC
Figure 4-16 Average solifenacin concentration (mg/L) vs. time (day) for AC.
Average results shown (N=2), error bars are standard deviation.

109
0
20
40
60
80
100
120
140
160
0 5 10 15 20 25 30
Ad
sorp
tio
n l
oa
din
g (
mg
/g)
Time (day)
Figure 4-17 Solifenacin adsorption loading (mg/g) vs. time (day) for AC. Average
results shown (N=2), error bars are standard deviation.
4.3.2.2 Effect of pH on solifenacin adsorption
The effect of pH on adsorption of solifenacin onto Aqua 2k was investigated
in an initial pH range from 2 to 8 (Figure 4-18). The removal capacity of the IPCAs
showed no discernible pattern over the entire pH range. Maximum solifenacin uptake
occurred at an initial pH of 2 with a adsorption loading of 63 mg/g and the lowest
adsorption loading of 41 mg/g occurred at an initial pH of 4. When error bars are
included there is an overlap between most of the data points. This indicates that pH
does not have a strong effect on solifenacin adsorption onto AC. These results are in
contrast to solifenacin adsorption onto P25 where there is increased adsorption with
higher initial pHs. Although given the low adsorption capacity of P25 the P25
adsorption results are not reliable. The final pH of the solution is higher than the
initial pH for all pHs except pH8 which is in contrast to the results from adsorption of
famotidine onto AC.

110
0
10
20
30
40
50
60
70
1.0 2.0 3.0 4.0 5.0 6.0 7.0 8.0 9.0
Ad
sorp
tion
load
ing (
mg/g
)
Initial pH (pHi)
Figure 4-18 Adsorption loading (q) of solifenacin onto Aqua 2k vs. pHi. pHi
studied were 2.1, 4.0, 4.9, 6.0 and 8.0. Average results shown (N=2), error bars
are standard deviation.
4.3.2.3 Effect of initial concentration on solifenacin adsorption
The influence of initial solifenacin concentration on the adsorption capacity of
Aqua 2k was investigated at concentrations ranging from 10 mg/L to 150 mg/L in the
pH range of 3.1 to 3.9 (Figure 4-19). The adsorption loading displayed rose steeply
before levelling off. This behaviour reflects saturation on the surface of the AC as the
solifenacin concentration increased. The AC adsorbs more solifenacin than P25 with a
maximum adsorption loading of 60 mg/g compared to 3.5 mg/g for P25 at an initial
concentration of 150 mg/L.

111
0
10
20
30
40
50
60
70
0 10 20 30 40 50 60 70 80 90 100 110 120
Ad
sorp
tio
n l
oa
din
g (
q)
(mg
/g)
Solifenacin concentration after 22 h (C22h) (mg/L)
Figure 4-19 Adsorption loading (q) of solifenacin on Aqua 2k vs. concentration
after 22 h adsorption (C22h). Initial concentrations studied were 20 mg/L, 30
mg/L, 40 mg/L, 50 mg/L, 60 mg/L, 80 mg/L and 100 mg/L and 150 mg/L.
Average results shown (N=2), error bars are standard deviation.
4.4 IPCA adsorption
4.4.1 Famotidine
4.4.1.1 Adsorption kinetics of 1:10 IPCA
The adsorption of famotidine onto AC and 1:10 IPCA is shown in Figure
4-20. The adsorption trend is identical to that of the AC. The famotidine concentration
in solution dropped below the LOQ (1 mg/L) of the HPLC method by day 21
therefore further samples were not taken.

112
0
10
20
30
40
50
60
70
80
90
100
110
0 2 4 6 8 10 12 14 16 18 20 22
Fa
mo
tid
ine
con
cen
tra
tio
n (
mg
/L)
Time (days)
Control
1:10 IPCA
AC
Figure 4-20 Famotidine concentration (mg/L) vs. time (days) for AC and IPCA.
Average results shown (N=2), error bars are standard deviation.
The IPCAs were placed in a fresh 100 mg/L famotidine solution and the
concentration in solution was monitored over a number of days (Figure 4-21).
0
10
20
30
40
50
60
70
80
90
100
110
0 2 4 6 8 10 12 14 16
Fam
oti
din
e co
nce
ntr
ati
on
(m
g/L
)
Time (days)
Control
AC
1:10 IPCA
Figure 4-21 Famotidine concentration (mg/L) vs. time (days) for AC and IPCA.
Average results shown (N=2), error bars are standard deviation.
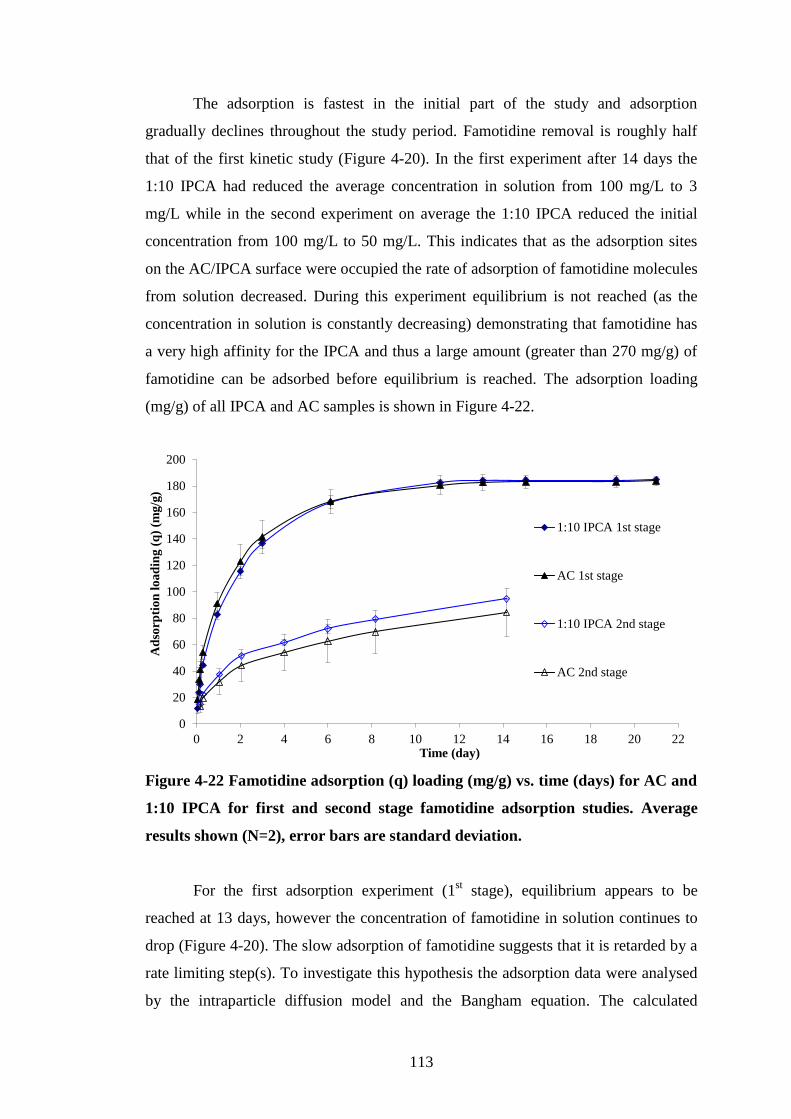
113
The adsorption is fastest in the initial part of the study and adsorption
gradually declines throughout the study period. Famotidine removal is roughly half
that of the first kinetic study (Figure 4-20). In the first experiment after 14 days the
1:10 IPCA had reduced the average concentration in solution from 100 mg/L to 3
mg/L while in the second experiment on average the 1:10 IPCA reduced the initial
concentration from 100 mg/L to 50 mg/L. This indicates that as the adsorption sites
on the AC/IPCA surface were occupied the rate of adsorption of famotidine molecules
from solution decreased. During this experiment equilibrium is not reached (as the
concentration in solution is constantly decreasing) demonstrating that famotidine has
a very high affinity for the IPCA and thus a large amount (greater than 270 mg/g) of
famotidine can be adsorbed before equilibrium is reached. The adsorption loading
(mg/g) of all IPCA and AC samples is shown in Figure 4-22.
0
20
40
60
80
100
120
140
160
180
200
0 2 4 6 8 10 12 14 16 18 20 22
Ad
sorp
tion
lo
ad
ing
(q
) (m
g/g
)
Time (day)
1:10 IPCA 1st stage
AC 1st stage
1:10 IPCA 2nd stage
AC 2nd stage
Figure 4-22 Famotidine adsorption (q) loading (mg/g) vs. time (days) for AC and
1:10 IPCA for first and second stage famotidine adsorption studies. Average
results shown (N=2), error bars are standard deviation.
For the first adsorption experiment (1st stage), equilibrium appears to be
reached at 13 days, however the concentration of famotidine in solution continues to
drop (Figure 4-20). The slow adsorption of famotidine suggests that it is retarded by a
rate limiting step(s). To investigate this hypothesis the adsorption data were analysed
by the intraparticle diffusion model and the Bangham equation. The calculated
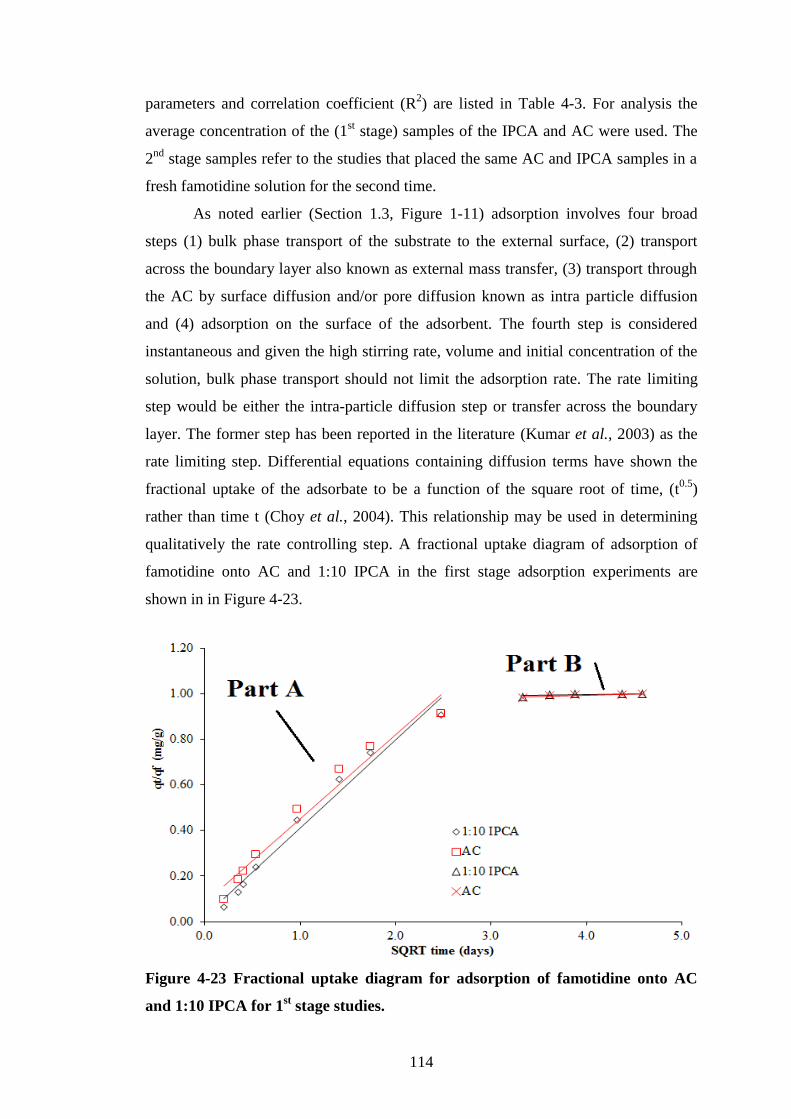
114
parameters and correlation coefficient (R2) are listed in Table 4-3. For analysis the
average concentration of the (1st stage) samples of the IPCA and AC were used. The
2nd
stage samples refer to the studies that placed the same AC and IPCA samples in a
fresh famotidine solution for the second time.
As noted earlier (Section 1.3, Figure 1-11) adsorption involves four broad
steps (1) bulk phase transport of the substrate to the external surface, (2) transport
across the boundary layer also known as external mass transfer, (3) transport through
the AC by surface diffusion and/or pore diffusion known as intra particle diffusion
and (4) adsorption on the surface of the adsorbent. The fourth step is considered
instantaneous and given the high stirring rate, volume and initial concentration of the
solution, bulk phase transport should not limit the adsorption rate. The rate limiting
step would be either the intra-particle diffusion step or transfer across the boundary
layer. The former step has been reported in the literature (Kumar et al., 2003) as the
rate limiting step. Differential equations containing diffusion terms have shown the
fractional uptake of the adsorbate to be a function of the square root of time, (t0.5
)
rather than time t (Choy et al., 2004). This relationship may be used in determining
qualitatively the rate controlling step. A fractional uptake diagram of adsorption of
famotidine onto AC and 1:10 IPCA in the first stage adsorption experiments are
shown in in Figure 4-23.
Figure 4-23 Fractional uptake diagram for adsorption of famotidine onto AC
and 1:10 IPCA for 1st stage studies.

115
kint values are determined from the slope of the linear portion of this plot. The
values of intercept, C give an idea about the boundary layer thickness, i.e. the larger
the intercept, the greater the boundary layer effect. The AC and IPCA display two
linear sections that have been labeled “Part A” and “Part B”. Part A for both samples
demonstrates a linear relationship with the square root of time throughout both
experiments. This indicates that intra-particle diffusion is the rate limiting step of the
adsorption process. The presence of an intercept value suggests that there is a
boundary layer effect slowing the rate of adsorption. The intraparticle diffusion rate
constant (kint) is higher for the IPCA than the AC (0.3884 mg/g day0.5
vs. 0.3706 mg/g
day0.5
). For Part B of the trend the slope of the line is almost flat (0.0076 mg/g day0.5
and 0.011 mg/g day0.5
for IPCA and AC respectively) indicating very little
intraparticle diffusion. This is likely caused by the reduction in the famotidine
concentration in solution. Part B begins after 11 days at which point the famotidine
concentration has dropped from 100 mg/L to 4 mg/L. At this point in the study the
adsorption process is probably slowed by a lack of substrate which in turn lowers the
intraparticle diffusion rate. Results of the 2nd
stage studies are shown in Figure 4-25.
0.00
0.20
0.40
0.60
0.80
1.00
1.20
0.0 0.5 1.0 1.5 2.0 2.5 3.0 3.5 4.0
qt/
qf
(mg/g
)
SQRT time (days)
1:10 IPCA 2nd stage
AC 2nd stage
Figure 4-24 Fractional uptake curve for adsorption of famotidine onto AC and
1:10 IPCA for 2nd
stage studies.

116
The 2nd
stage studies demonstrate a single linear trend indicating that
intraparticle diffusion is rate limiting. The 2nd
stage studies have lower kint than the 1st
stage studies (Part A) as they do not adsorb as much famotidine. The boundary layer
is also larger. Both of these effects are likely caused by the lower adsorption of the
famotidine during the 2nd
stage studies as the boundary layer effect will be more
pronounced when the overall adsorption (and intraparticle diffusion) is lower.
A Bangham equation plot of famotidine adsorption is shown in Figure 4-25. If
the Bangham equation produces a straight line then pore or intraparticle diffusion is a
limiting factor. A double logarithmic plot linearized the data for famotidine
adsorption for the first stage IPCA and AC results with a high degree of correlation
(R2
= 0.9493 and 0.9531). However the second stage IPCA and AC results had higher
correlation coefficients (R2
= 0.9881 and 0.9904). This appears to be due to a
plateauing of the famotidine adsorption in the first stage studies from day eleven
onwards. At this point the famotidine remaining in solution was almost completely
adsorbed (Figure 4-20). The plateauing of the Bangham plot indicates that the
intraparticle diffusion rate is no longer the limiting factor at the end of the study
period. This is expected as the lack of substrate is limiting the adsorption rate at this
stage of the study. The stage two studies do not show this trend as they are not
conducted for long enough to adsorb greater than 97 % of the substrate in solution as
was the case for the first stage studies. The results of the intraparticle diffusion model
and a linear Bangham plot confirm that the diffusion of adsorbate into pores of the
adsorbent is a rate-controlling step (Önal, 2006). This result confirms that pore
diffusion was the most important factor effecting adsorption with film diffusion (the
boundary layer effect) having a small limiting effect. Values of kb and α (<1) are
given in Table 4-3.

117
-4.0
-3.5
-3.0
-2.5
-2.0
-1.5
-2 -2 -1 -1 0 1 1 2
Log L
og C
i/C
i-w
t/L
*q
t (m
g/g
)
Log time (days)
1:10 IPCA
AC
1:10 IPCA 2nd stage
AC 2nd stage
Figure 4-25 Bangham’s plot of Log Log (Ci/Ci −qt) vs. Log t for famotidine
adsorption.

118
Table 4-3 Kinetic parameters for adsorption of famotidine onto AC and IPCAs
(first and second stage studies)
Model Parameters
Experimental values
Sample name q (final) (mg/g)
1:10 IPCA 184.71
AC 183.84
1:10 IPCA (2nd
stage) 94.61
AC (2nd
stage) 84.40
Intraparticle diffusion equation
kint (mg/g day0.5
) C (mg/g) R2
1:10 IPCA (Part A) 0.3884 0.0215 0.9771
AC (Part A) 0.3706 0.0811 0.9677
1:10 IPCA (Part B) 0.0076 0.9667 0.5799
AC (Part B) 0.011 0.9503 0.7747
1:10 IPCA (2nd
stage) 0.0054 0.123 0.9763
AC (2nd
stage) 0.0054 0.112 0.9825
Bangham equation
α kb (mL/g/L) R2
1:10 IPCA 0.4305 0.0649 0.9493
AC 0.359 0.0763 0.9531
1:10 IPCA (2nd
stage) 0.4049 0.0349 0.9881
AC (2nd
stage) 0.4081 0.0304 0.9904
4.4.1.2 Effect of initial concentration on adsorption
The influence of initial famotidine concentration on IPCA adsorption was
investigated using the same conditions as the AC study. IPCAs with TiO2 to AC ratios
from 1:200 to 1:10 were studied so adsorption capacity could be compared to their
photocatalytic activity. The results are shown in Figure 4-26.

119
0
10
20
30
40
50
60
70
80
90
100
0 20 40 60 80 100 120
Ad
sorp
tio
n l
oa
din
g (
q)
(mg
/g)
Concentration after 22 h adsorption (C22h) (mg/L)
1:200 IPCA
1:100 IPCA
1:40 IPCA
1:20 IPCA
1:13 IPCA
1:10 IPCA
Aqua 2k AC
Figure 4-26 Adsorption loading (q) of famotidine on various IPCAs and AC vs.
concentration after 22 h adsorption (C22h). Initial concentrations studied were 20
mg/L, 40 mg/L, 50 mg/L, 60 mg/L, 80 mg/L and 100 mg/L and 150 mg/L.
Average results shown (N=2), error bars are standard deviation.
The adsorption capacity displays a steep rise with a decline in the rate of
increase as the trend starts to plateau. This behaviour was observed for all the
adsorbents and reflects saturation of the surface of the adsorbents as the famotidine
concentration increased. This shape of isotherm suggests Langmuir-type adsorption
between famotidine and the IPCAs and AC. With the increase of initial famotidine
concentration from 20 mg/L to 150 mg/L, the adsorbed famotidine after 22 h of
adsorption increased from 3 mg/g to 87 mg/g and 34 mg/g to 72 mg/g for the 1:100
IPCA and AC, respectively. The 1:10 IPCA was determined to be the most effective
IPCA for famotidine adsorption. With the TiO2 content in the IPCA increasing from
1:100 to 1:10, the adsorption capacity decreased from 87 mg/g to 75 mg/g due to the
higher content of TiO2 particles on the surface of the AC occupying adsorption sites
(Wang et al., 2008).

120
4.4.1.3 Effect of initial pH on adsorption
The effect of initial pH on famotidine adsorption for the IPCA and AC is
shown in Figure 4-27. The IPCA demonstrated an increase in adsorption capacity
with increasing pH in contrast to the TiO2 pH studies that demonstrated no discernible
trend. The final pH of both the AC and IPCA are similar providing further
confirmation that the adsorption properties of the AC and 1:10 IPCA are
quantitatively similar.
0
20
40
60
80
100
120
140
3.0 4.0 5.0 6.0 7.0 8.0 9.0
Ad
sorp
tion
loa
din
g (m
g/g)
Initial pH (pHi)
1:10 IPCA
Aqua 2k
Figure 4-27 Adsorption loading (q) of famotidine onto Aqua 2k and 1:10 IPCA
vs. initial pH (pHi). pHi studied were 4.0, 5.8, 6.0 and 8.0. Average results shown
(N=2), error bars are standard deviation.

121
4.4.2 Solifenacin
4.4.2.1 Adsorption kinetics of the 1:10 IPCA
The concentration of solifenacin in solution during the study period is shown
in Figure 4-28. The adsorption trend is almost identical to the AC suggesting the
adsorption mechanisms are the same.
0
10
20
30
40
50
60
70
80
90
100
110
0 5 10 15 20 25 30
Soli
fen
aci
n C
on
cen
trati
on
(m
g/L
)
Time (day)
Control
AC
1:10 IPCA
Figure 4-28 Average solifenacin concentration (mg/L) vs. time (day) for AC and
IPCA. Average results shown (N=2), error bars are standard deviation.
The adsorption loading of solifenacin by the 1:10 IPCA and AC is shown in
Figure 4-29. The same kinetic models used to analyse the famotidine adsorption rate
data were also used for solifenacin. A fractional uptake diagram of adsorption of
solifenacin onto AC and 1:10 IPCA is shown in Figure 4-30. Figure 4-28 and Figure
4-30 demonstrate that there is multi-linearity in solifenacin adsorption i.e. separate
adsorption phases taking place during the course of the experiment. The first stage
(Part A) is from day 0 - 6 and has rapid adsorption, the second stage (Part B) from
days 6 - 19 has a lower adsorption rate and the third stage (Part C) (days 19 to 29) has
an adsorption rate lower than the second stage.

122
0
20
40
60
80
100
120
140
160
0 5 10 15 20 25 30
Ad
sorp
tion
load
ing (
mg/g
)
Time (day)
1:10 IPCA
AC
Figure 4-29 Solifenacin adsorption loading (mg/g) vs. time (day) for various
adsorbents. Average results shown (N=2), error bars are standard deviation.
Multi-linearity is reported in the literature (Kumar et al., 2003) but the process
claimed to be represented by each step varies between researchers. Where the initial
part of the plot is linear through the origin (Kumar et al., 2003) - as is the case in this
research - the different sections of the curve are attributed to diffusion of the
substrates into the macro, meso and micro-pores of the adsorbent. Other researchers
attribute the first portion to the diffusion of adsorbate through the solution or the
boundary layer diffusion of solute molecules (Arivolia et al., 2009, Önal, 2006). The
second portion is described as the intraparticle diffusion stage which is rate limiting
and the third portion, if present, is attributed to the final equilibrium stage (Önal,
2006). The large solution volume, concentration of solifenacin in solution and the
high stirring rate rules out diffusion through the solution as a rate limiting step.
Similarly if the process is controlled by the external resistance (film diffusion) then a
plot of lnC vs. t must be linear (Nevskaia et al., 1999).

123
Figure 4-30 Fractional uptake curve of solifenacin for 1:10 IPCA and AC.
However when lnC vs. t was plotted the resulting graph (Figure 4-31) was not
linear indicating that it is not a rate limiting step.
0.0
0.5
1.0
1.5
2.0
2.5
3.0
3.5
4.0
4.5
5.0
0 5 10 15 20 25 30 35
lnC
(m
g/L
)
Time (day)
1:10 IPCA
AC
Figure 4-31 lnC (concentration) vs. t for IPCA and AC.

124
This result is confirmed by the low intercept values for Part A of the graph
(0.0062 mg/g and 0.0271 mg/g for the IPCA and AC respectively) which implies a
small boundary layer thickness if the boundary layer actually exists. An equilibrium
stage is also unlikely as an explanation for the third stage as the studies did not reach
equilibrium and at most only removed 87 % of the solifenacin from solution.
A Bangham equation plot of solifenacin adsorption is shown in Figure 4-32.
The double logarithmic plot linearized solifenacin adsorption by the IPCA with a high
degree of correlation (R2
= 0.9724). The AC results did not fit as well (R2=0.8085),
however, this is due to an outlier at t = 240min (Log(t) -0.77815). If this point is
removed then the R2 value is much higher (R
2 = 0.9559) and similar to that of the
IPCA.
-5.0
-4.5
-4.0
-3.5
-3.0
-2.5
-2.0
-2.0 -1.5 -1.0 -0.5 0.0 0.5 1.0 1.5 2.0
Lo
g L
OG
Ci/
Ci-
wt/
L*
Qt
(mg
/g)
Log time (t) (days)
1:10 IPCA
AC
Figure 4-32 Bangham equation for solifenacin.
These results confirm the intraparticle diffusion model i.e. diffusion of
solifenacin into the pores of the sorbent is the rate-controlling step. These results are
similar to those of famotidine which would be expected since both are being adsorbed
onto the same AC. This is possible due to the relatively large size of the famotidine
and solifenacin molecules which would hinder their migration through the pore of the
AC.

125
Table 4-4 Kinetic parameters for adsorption of solifenacin onto AC and 1:10
IPCA.
Model Parameters
Experimental values
Sample q (final) (mg/g)
1:10 IPCA 148.37
AC 138.04
Intraparticle diffusion equation
kint (mg/g day0.5
) C (mg/g) R2
1:10 IPCA Part A 0.2669 0.0062 0.9896
AC Part A 0.2801 0.0271 0.9674
1:10 IPCA Part B 0.0958 0.4842 0.9797
AC Part B 0.0998 0.4659 0.9992
1:10 IPCA Part C 0.0822 0.5477 0.9113
AC Part C 0.0788 0.5686 0.9325
Bangham equation
α Kb (mL/g/L) R2
1:10 IPCA 0.4398 0.03747 0.9724
AC 0.5268 0.02740 0.8085
4.4.2.2 Effect of initial concentration on adsorption
The adsorption capacity of the IPCA at different solifenacin initial
concentrations was compared to the AC and these results are shown in Figure 4-33.
The adsorption loading displayed a steep rise followed by a decline in the rate of
adsorption until it plateaued. The values for the AC and IPCA are very similar and are
almost identical at initial concentrations of 80 mg/L, 100 mg/L and 150 mg/L (46.4
mg/g, 52.8 mg/g, and 59.9 mg/g vs. 46.2 mg/g, 52.9 mg/g, and 59.6 mg/g for the AC
and IPCA respectively). These results confirm that the addition of P25 to the AC (to
create an IPCA) did not cause a noticeable reduction in the adsorption capacity of the
AC.

126
0
10
20
30
40
50
60
70
0 20 40 60 80 100 120 140
Ad
sorp
tion
load
ing (
q)
(mg/g
)
Concentration after 22 h of adsorption (C22h) (mg/L)
1:10 IPCA
Aqua 2k AC
Figure 4-33 Adsorption loading (q) of solifenacin vs. concentration after 22 h
(C22h) of adsorption onto Aqua 2k and 1:10 IPCA. Initial concentrations studied
were 10 mg/L, 20 mg/L, 30 mg/L, 40 mg/L, 50 mg/L, 60 mg/L, 80 mg/L and 100
mg/L and 150 mg/L. Average results shown (N=2), error bars are standard
deviation.
4.4.2.3 Effect of initial pH on adsorption
The effect of pH on solifenacin adsorption for the IPCA and AC control is
shown in Figure 4-34. When error bars are included there is not a significant
difference between the IPCA and AC in terms of adsorption capacity at different pHis.
There is no clear trend with rising pH for either AC or IPCA adsorption.

127
0
10
20
30
40
50
60
70
1.0 2.0 3.0 4.0 5.0 6.0 7.0 8.0 9.0
Ad
sorp
tio
n l
oa
din
g (
mg
/g)
Initial pH (pHi)
1:10 IPCA
Aqua 2k
Figure 4-34 Adsorption loading (q) of solifenacin onto Aqua 2k and 1:10 IPCAs
vs. initial pH (pHi). pHi studied for ACs were 2.1, 4.0, 4.9, 6.0 and 8.0. pHi
studied for IPCAs were 2.1, 4.2, 4.9, 6.3 and 7.7. Average results shown (N=2),
error bars are standard deviation.
4.5 Isotherm modelling of adsorption onto IPCAs and AC
4.5.1 Famotidine
The relationship between the adsorbed famotidine and the famotidine
concentration remaining in solution at equilibrium is described by the adsorption
isotherm, characterised by constants whose values express the surface properties and
affinity of the adsorbent. To optimise an adsorption system, it is important to establish
the most appropriate correlation for the equilibrium plot. Adsorption isotherms
namely the Langmuir, Freundlich, Redlich-Peterson and Temkin were applied to the
data of famotidine adsorption onto various IPCAs and the unmodified AC. All the
statistical parameters and the constants obtained from the models are summarised in
Table 4-5.

128
The experimental data was plotted using different linear forms of the
Langmuir isotherm: 1/q vs. 1/C22h, (C22h/q)/C22h, q/(q/C22h) and q vs. 1/C22h to check
for best fit. The plot of (C22h/q)/C22h produced a plot that fitted the experimental data
and achieved high R2 values (0.9739 to 0.9946). The adsorption performances of the
various IPCAs and AC were compared by their respective qm values calculated from
fitting the Langmuir isotherm to the experimental data. The sorption performances of
IPCAs were higher than that of the AC, and decreased with increasing TiO2 content of
the IPCAs. The 1:40 IPCA showed the highest maximum saturated adsorption (qm of
96 mg/g) and the 1:10 IPCA had the highest adsorption equilibrium constant (KL =
0.125 L/mg). The Langmuir constants were used to determine a calculated adsorption
loading (q(cal)) which was then compared to the experimental values using the sum of
square error (SSE) and standard error (SE) tests (see Section 2.2.6.5). In general the
values for both tests will be lower for data that has a higher correlation with the model
in question. For simplicity only SSE will be discussed as it is the standard test for the
fit of experimental data.
For the C22h/q vs. C22h plot the SSE ranged from between 144.93 to 1064.64,
the lowest variance in the data was the 1:20 IPCA. The error values for this model
were very high compared to other isotherm models (Table 4-5) indicating that the
Langmuir model is a relatively poor fit for the data. The high SSE is due to the
Langmuir model not being a good fit for the data at lower famotidine concentrations
(Figure 4-35). This can be attributed to the heterogeneous surface of the AC adsorbing
a larger proportion of the famotidine at low famotidine concentrations compared to
high famotidine concentrations. From a theoretical point of view the Langmuir
isotherm is not suitable for use on activated carbons as it is based on three theoretical
assumptions (Marsh and Rodríguez-Reinoso, 2006b) that are not applicable to
activated carbons:
1. Only monolayer adsorption occurs throughout the whole adsorption process.
2. The adsorption process is localized with no adsorbate-adsorbate interactions.
3. The heat of adsorption is independent of surface coverage i.e. the adsorbent has an
energetically homogeneous surface.
The ability of this model to linearise AC isotherms is probably due to
assumption (1.) and (3.) compensating for each other. Adsorbate-adsorbate
interactions would increase with adsorption while the enthalpies of adsorption

129
decrease. In spite of these limitations the Langmuir equation is widely used in the
published literature.
Table 4-5 Calculated isotherm parameters for famotidine adsorption onto various
IPCAs and AC.
Models Adsorbents
AC 1:200
IPCA
1:100
IPCA
1:40
IPCA
1:20
IPCA
1:13
IPCA
1:10
IPCA
Langmuir (C22h/q vs. C22h)
qm (mg/g) 86.2 81.9 91.7 96 92.6 88.5 96
KL(L/mg) 0.087 0.13 0.17 0.065 0.102 0.125 0.117
R2 0.9803 0.9895 0.9946 0.997 0.9922 0.9852 0.9739
SSE 416 323 212.9 395 144.9 672.7 1064.64
SE 9.12 8.04 6.53 8.89 5.38 11.60 14.59
Freundlich (lnq vs. lnC22h)
KF (L/g) 26.7 30.5 31.99 23.3 22.95 33.4 36.49
1/n 0.2323 0.2047 0.2356 0.2756 0.3034 0.1985 0.1891
n 4.3048 4.885 4.244 3.628 3.2959 5.0378 5.288
R2 0.9764 0.9606 0.9299 0.9792 0.954 0.9596 0.9482
SSE 682.6 3114.9 304.96 52.8 242.6 207.96 174.33
SE 11.68 6.45 7.81 3.25 6.97 6.45 5.90
Temkin (q vs. lnC22h)
A (l/g) 4.4 10.4 6.8 2 1.7 12.9 17.8
BT (J/mg) 12.4 10.9 13.7 15 16.9 11.3 11.3
B kJ/mg 193.5 219.7 174.4 158.8 141.7 212.4 211.7
R2 0.8875 0.9967 0.95 0.9256 0.951 0.9136 0.8937
SSE 74.99 37.7 243.9 142.9 105.1 138 208.8
SE 3.87 2.74 6.99 5.35 4.6 5.3 6.5
Redlich and Peterson (q vs. C22h)
Kr-p 11760 71 39.99 20633.9 20641 20647.8 36373
Ar-p 447.9 1.8 0.74 954.96 791.8 626 1029.9
β 0.76 0.85 0.89 0.70 0.73 0.80 0.80
R2 0.9874 0.9850 0.9757 0.9922 0.9597 0.9692 0.9666
SSE 34.5 34.7 93.9 30.3 171.5 96.9 129.35
SE 2.63 2.63 4.33 2.46 5.86 4.40 5.09
For the Freundlich model the KF values vary from 22.9 to 36.5 and are highest
for the 1:13 and 1:10 IPCAs indicating greater affinity for famotidine adsorption
compared to other IPCAs and the AC (Rengaraj et al., 2002). The SSE values for the
Freundlich model are similar (range 52.84 to 3114.89 vs. 144.93 to 1064.64) to the
Langmuir models indicating that the Freundlich model is not a better fit of the data.
The model is a better fit at lower famotidine concentrations than the Langmuir model.
The Frendlich model is usually assumed to correspond to a heterogeneous surface so

130
it would be a better fit of the adsorption data at lower concentrations (Foo and
Hameed, 2010b). This is further evidence the Langmuir model is unsuitable.
The Redlich and Peterson isotherm incorporates the features of the Langmuir
and Freundlich isotherms into a single equation. The Redlich–Peterson (R-P) isotherm
is a good fit for the experimental data as evidenced by high R2 (0.9562-0.9912) and
low SSE values (34.5 to 171.5) for AC and the various IPCAs. β values - β indicates
surface heterogeneity - ranged between 0.7 and 0.87. A highly heterogeneous system
will have a β value closer to 0 (the Freundlich equation) than 1 (the Langmuir
equation) (Basha et al., 2011). This outcome confirms that the adsorption mechanism
is closer to Langmuir than Freundlich; however, the presence of surface heterogeneity
indicates that Langmuir is not ideal and would suggest that a heterogeneous surface is
the reason for the Langmuir isotherm’s poor fit of the experimental data at low
sorbate concentrations.
The Temkin model provides useful thermodynamic information and is
intended for predicting gas phase equilibrium (when organization in a tightly packed
structure with identical orientation is not necessary); however more complex liquid-
phase adsorption systems cannot always be represented by this model (Foo and
Hameed, 2010b). It is a model that is derived from Langmuir and as such assumes
monolayer coverage.
The Temkin model demonstrated R2 values between 0.8875 and 0.9677 with
SSE values between 37.7 and 243.9 which are lower than the Langmuir and the
Freundlich models. The constant BT is related to heat of sorption (J/mg), was found to
be in the following order: 1:200 IPCA < 1:13 IPCA < 1:10 IPCA < AC < 1:100 IPCA
< 1:40 IPCA <1:20 IPCA. A (l/mg) the equilibrium binding constant ranged from 1.7
to 17.8. This suggests differences in the adsorbate - adsorbate interactions on the
various IPCAs; however it is likely just variations in the data. In spite of lower R2
values than the Langmuir model the SSE values of the Temkin model are higher than
the Langmuir model which signifies a better fit of the experimental data. Given that
the only difference between the Langmuir and Temkin models is that the Temkin
model assumes adsorbate – adsorbate interactions. The mechanism suggested for the
ability of the Langmuir isotherm to model a heterogeneous solid such as AC is
adsorbate – adsorbate interactions compensating for the lowering of adsorption
strength with increasing famotidine adsorption. The predicted q values for adsorption
of famotidine onto AC are shown in Figure 4-35. The trend seen in this sample is

131
repeated for all the IPCA samples therefore only the AC, 1:200 IPCA and 1:10 IPCA
are shown for clarity.
0
10
20
30
40
50
60
70
80
90
0 20 40 60 80 100 120
Ad
sorp
tio
n l
oa
din
g (
q)
(mg
/g)
Concentration after 22 h adsorption (C22h) (mg/L)
q(exp)
Langmuir (C22h/q vs. C22h)
Freundlich (Lnq vs.LnC22h)
Temkin (q vs. LnC22h)
Redlich and Peterson (q vs. C22h)
Figure 4-35 Experimental values (q(exp)) and calculated isotherm values of
adsorption loading for famotidine adsorption onto AC vs. concentration after 22
h of adsorption (C22h). Average q(exp) results shown (N=2), error bars are
standard deviation.

132
0
10
20
30
40
50
60
70
80
90
0 20 40 60 80 100 120
Ad
sorp
tion
lo
ad
ing (
q)
(mg/g
)
Concentration after 22 h adsorption (C22h) (mg/L)
q(exp)
Langmuir C22h/q vs. C22h
Freundlich (Lnq vs.LnC22h)
Temkin (q vs. LnC22h)
Redlich and Peterson (q vs. C22h)
Figure 4-36 Experimental values (q(exp)) and calculated isotherm values of
adsorption loading for famotidine adsorption onto 1:200 IPCA vs. concentration
after 22 h of adsorption (C22h). Average q(exp) results shown (N=2), error bars
are standard deviation.
0
10
20
30
40
50
60
70
80
90
100
0 20 40 60 80 100 120
Ad
sorp
tio
n l
oa
din
g (
q)
(mg
/g)
Concentration after 22 h adsorption (C22h) (mg/L)
q(exp)
Langmuir (C22h/q vs. C22h)
Freundlich (Lnq vs.LnC22h)
Temkin (q vs. LnC22h)
Redlich and Peterson (q vs. C22h)
Figure 4-37 Experimental values (q(exp)) and calculated isotherm values of
adsorption loading for famotidine adsorption onto 1:10 IPCA vs. concentration
after 22 h of adsorption (C22h). Average q(exp) results shown (N=2), error bars
are standard deviation.

133
4.5.2 Solifenacin
The solifenacin adsorption data was modelled using the same methods and
models as the famotidine isotherm data (Table 4-6). The fit of this model to the
experimental data is shown in Figure 4-38 and Figure 4-39. The statistical parameters
and the constants obtained from the models are summarised in Table 4-6.
Like famotidine, only the C22h/q vs. C22h plot of the Langmuir model fitted the
data with R2 values of 0.9751 – 0.9782 for the AC and 1:10 IPCA respectively. The
adsorption performances of the 1:10 IPCA and AC were compared by their respective
qm values calculated from fitting the Langmuir isotherm to the experimental data. The
sorption performances of the IPCA were higher than that of the AC, which matches
the famotidine results. The qm value for the IPCA and AC were 66.23 mg/g and 68.03
mg/g respectively suggesting similar adsorption performance between both
adsorbents.
The Langmuir constants were used to determine a calculated adsorption
loading (q(cal)) which was then compared to the experimental values using the SSE
and SE tests. For the C22h/q vs. C22h plot the SSE values were 191.3 and 133.9 for the
AC and IPCA respectively. The results of the error tests for the Langmuir models
were very high compared to other isotherm models (Table 4-6). The Langmuir
constants were used to plot the predicted Langmuir isotherms which are shown in
Figure 4-38 and Figure 4-39. The predicted Langmuir plots are closer to the
experimental values than the famotidine Langmuir plot. This is due to the much better
fit of the Langmuir plot to solifenacin adsorption at low solifenacin concentrations
especially for the 1:10 IPCA.
For the Freundlich model the KF (L/g) values were 11.11 and 8.76 for the AC
and IPCA respectively indicating greater affinity for solifenacin adsorption onto the
AC compared to the 1:10 IPCA (Rengaraj et al., 2002). The SSE values for the
Freundlich model are similar to the Langmuir model: 53.11 and 161.97 vs. 191.28 and
133.88 for the AC and IPCA respectively indicating that both models are a good fit of
the data.
The Redlich–Peterson (R-P) isotherm models the experimental data well as
evidenced by high R2 (0.9809 and 0.9689) and relatively low SSE (50.79 - 96.39)
values for AC and the 1:10 IPCAs (Figure 4-38 and Figure 4-39). β values were 0.67

134
and 0.79 for the AC and IPCA respectively. These results are similar to those of
famotidine suggesting that both famotidine and solifenacin adsorption follow the
same adsorption mechanism. The β values of solifenacin adsorption are similar to
famotidine which suggests the IPCA has a similarly heterogeneous surface for
solifenacin adsorption, although these results could be due to variation in the data.
The predicted q values for adsorption of solifenacin onto AC are shown in
Figure 4-38 and the 1:10 IPCA are shown in Figure 4-39.
Table 4-6 Calculated isotherm parameters for solifenacin adsorption onto
various IPCAs and AC.
Models Adsorbents
AC 1:10 IPCA Models AC 1:10 IPCA
Langmuir (C22h /q vs. C22h) Freundlich (lnq vs. ln C22h)
qm (mg/g) 66.23 68.03 KF (L/g) 11.11 8.76
KL(L/mg) 0.0548 0.0504 1/n 0.3582 0.4217
n 2.79 2.37
R2 0.9751 0.9782 R
2 0.9466 0.9087
SSE 191.28 133.88 SSE 53.11 161.97
SE 5.23 4.37 SE 2.75 4.81
Temkin (q vs. ln C22h) Redlich and Peterson (q vs. C22h)
A (l/g) 1.05 0.6869 Kr-p 66.01 6.947
BT (J/mg) 11.6 13.128 Ar-p 5.23 0.288
b (kJ/mg) 206.3 182.5 β 0.67 0.79
R2 0.9377 0.9477 R
2 0.9842 0.9735
SSE 274.02 100.37 SSE 50.79 96.39
SE 6.26 3.79 SE 2.69 3.71
The Temkin model demonstrated R2 values of 0.9339 and 0.9476 and SSE
values of 274 and 100.4 for the AC and IPCA respectively which are similar to the
Langmuir and Freundlich models. The Temkin model is derived from the Langmuir
equation and it has a similar fit to the Langmuir isotherm in terms of SSE values
(Figure 4-38 and Figure 4-39). The main difference between the Langmuir and
Temkin model is that the Temkin model assumes adsorbate–adsorbate interactions.

135
This suggests that interactions between the solifenacin molecules have little influence
on the solifenacin adsorption process. This is in contrast to famotidine where the
Temkin isotherm - and its assumptions - is the best fit for the data.
0
10
20
30
40
50
60
70
80
0 20 40 60 80 100 120
Ad
sorp
tion
load
ing (
q)
(mg/g
)
Concentration after 22 h of adsorption (C22h)
q(exp)
Langmuir (C22h/q vs. C22h)
Freundlich (Lnq vs.LnC22h)
Temkin (q vs. LnC22h)
Redlich and Peterson (q vs. C22h)
Figure 4-38 Experimental values (q(exp)) and calculated isotherm values of
adsorption loading for solifenacin adsorption onto AC vs. concentration after 22
h of adsorption (C22h). Average q(exp) results shown (N=2), error bars are
standard deviation.

136
0
10
20
30
40
50
60
70
80
0 20 40 60 80 100 120
Ad
sorp
tion
load
ing (
q)
(mg/g
)
Concentration final (Cf) (mg/L)
q(exp)
Langmuir (C22h/q vs. C22h)
Freundlich (Lnq vs.LnC22h)
Temkin (q vs. LnC22h)
Redlich and Peterson (q vs. C22h)
Figure 4-39 Experimental values (q(exp)) and calculated isotherm values of
adsorption loading for solifenacin adsorption onto 1:10 IPCA vs. concentration
after 22 h of adsorption (C22h). Average q(exp) results shown (N=2), error bars
are standard deviation.
4.6 Desorption of famotidine and solifenacin from AC
Desorption is required for photocatalytic regeneration of an IPCA as it is
necessary for the transfer of the substrate from the adsorbent (in this case AC) to the
TiO2, where it is photodegraded. Theoretically the bonding of the substrate to the AC
is physical as adsorption is a physical rather than chemical process and therefore
reversible; however in practice several factors may hinder or prohibit this. The
substrate may become stuck inside the micropores of the AC and thus simple
desorption will not be able to remove it (Marsh and Rodríguez-Reinoso, 2006a). If the
compound is hydrophobic then it will not desorb back into solution in any appreciable
way compared to a substrate that is hydrophilic. While some literature imagines the
migration of substrate to the TiO2 as a simple conveyer belt type process (Khan,
2002) in reality it would desorb into solution and via the solution it would migrate
towards the TiO2. Typically AC is not regenerated by desorption into solution i.e.
washing of the carbon with clean water either continuously or cyclically over a long
period of time. Depending on the application regeneration of the spent up AC usually
uses pyrolysis in an oxidizing atmosphere at high temperature (650°C - 1100°C) or

137
treatment with super-heated steam, CO2 or both at high temperatures (350°C - 700°C)
(Bansal and Goyal, 2005, Mazyck and Cannon, 2000). The regenerated AC can have
an adsorption capacity of 90 % to 95 % of the fresh carbon (Bansal and Goyal, 2005)
and this process consumes about 1 % – 10 % (Bansal and Goyal, 2005, Lim and
Okada, 2005) of the original AC. The lost AC mass is usually made up by the
addition of fresh AC.
Desorption studies in the literature typically use a strong acid or base e.g. 0.1N
H2SO4, 0.1N HNO3 or 0.1N NaOH (Arivolia et al., 2009, Lataye et al., 2008,
Rengaraj et al., 2002) or a solvent e.g. methanol (Lee et al., 2004a) to desorb the
substrate from the AC. These methods were not used as strong acids and bases would
affect the stability of the IPCA. In addition, the desorption of the substrate from the
adsorbent to the photocatalyst creating IPCA synergy is claimed to occur in the
reaction solution which would not contain a solvent or be adjusted to a pH favorable
for desorption. For this reason desorption in a solution of deionized water is a better
test of desorption as IPCAs would be used in these conditions.
First, desorption from ACs with different levels of adsorbed famotidine
(famotidine surface area coverage) was investigated. Two types of desorption
experiments were undertaken, where the AC had different levels of saturation in each.
For the first set the ACs were placed in a 100 mg/L famotidine solution for 24 h (one
cycle of adsorption) before it was washed with deionised water and then used for
desorption studies. The second set of ACs were placed in 100 mg/L famotidine
solutions a total of three times to ensure that they were saturated with famotidine
before being used in desorption studies.
The adsorption stage of the study (Table 4-7) showed that 32 % of the
famotidine concentration was removed after 90 min and greater than 99 % adsorption
occurred after 24 h. The AC saturated with famotidine was then placed in deionised
water and a sample was taken at 25 h, the concentration of famotidine was below the
limit of detection (0.2 mg/L) indicating that the GAC was adequately washed.
Sampling was continued at 24 h, 48 h and 72 h; again no famotidine concentration
was detected above the limit of detection. At 72 h the water was changed and samples
taken at every hour for four hours. The peak area values increased over each hour but
remained below the LOD for all samples.

138
Table 4-7 Famotidine desorption after 1 adsorption cycle (concentration (mg/L)).
Time
Sample
Adsorption Desorption
0 h 1.5 h 24 h 1 h 24 h 48 h 72 h
Initial 103
Control 103 110 117.4 128.0 133.3
Aqua 2k (1) 34.5 0.1 0.2 0.1 0.1 0.0
Aqua 2k (2) 31.9 0.0 0.1 0.0 0.0 0.0
Time
Sample
Desorption
73 h 74 h 75 h 76 h 96 h
Control 140
Aqua 2k (1) 0.0 0.0 0.0 0.0 0.0
Aqua 2k (2) 0.0 0.0 0.1 0.0 0.0
LOQ 1 mg/L LOD 0.2 mg/L. Replacement of the deionised water solution
occurred after 0 h and after 72 h.
The samples desorbed no more than 1 % of the adsorbed famotidine and for all
the samples the famotidine concentration was lower than the limit of quantification of
the detection method. Consequently it was necessary to use more adsorption cycles so
that the resulting desorption would be more pronounced and thus easier to detect. The
second study saturated the AC with famotidine three times (Table 4-8). Saturation of
the adsorption sites on the AC was greater as 98 % of the famotidine is removed by
all the ACs in the first adsorption cycle while in the third cycle adsorption of
famotidine dropped to 40 %.
This “adsorbed AC” was then screened for desorption. Approximately 12
mg/L desorbed from the AC into the solution during the first 24 h in deionised water.
When the samples were placed in fresh deionised water for the second time,
famotidine was released, although in smaller quantities (6 mg/L) with about 68 %
released within 90 min of placing the AC in deionised water. These results indicate
that desorption is greater if greater amounts of famotidine are adsorbed onto the
surface of the AC. Desorption from Aqua 2k is approximately 3 % in the first
desorption cycle and 2 % in the second desorption cycle. A total desorption of 5 % in
two cycles with a declining trend suggests that only a small percentage of the

139
famotidine seems to be mobile under these conditions. Theoretically the famotidine
could migrate to the surface of the TiO2 but this process could take days.
Table 4-8 Famotidine desorption, 3 adsorption cycles (concentration (mg/L)).
Time
Sample
Adsorption Desorption Desorption
0 h 24 h 48 h 72 h 24 h 48 h 49.5 h 51 h 72 h
Initial 101.3 107.1 100.0
Control 101.6 101.9 102.4 102.3 102.2 101.9
Aqua 2k (1) 0.1 26.1 59.8 11.7 8.8 4.5 4.7 6.0
Aqua 2k (2) 0.7 24.6 60.2 11.8 9.4 3.6 4.7 5.9
LOQ 1 mg/L LOD 0.2 mg/L. Replacement of the deionised water solution took
place after 0 h and after 48 h.
Similar studies were used to characterise solifenacin desorption. After one
cycle of adsorption greater than 96 % of the solifenacin in solution was removed by
Aqua 2k (Table 4-9). After 1 h of immersion in fresh deionised water an average
concentration of 0.9 mg/L solifenacin desorbed from the AC. When the solutions
were placed in fresh deionised water after the 48 h sample the same trend was
repeated. The majority of desorption occurs in the first 1 h which indicates that the
initial rate of desorption is high, however given the gradual decrease in concentration
after 24 h indicates that desorption/adsorption equilibrium is not reached quickly. The
equilibrium concentration of solifenacin decreased with each time the AC samples
were put in fresh deionised water indicating that desorption rates decreases as the total
solifenacin concentration adsorbed on the AC decreases.
Table 4-9 Solifenacin desorption, 1 adsorption cycle (concentration (mg/L)).
Time
Sample
Adsorption Desorption Desorption
0 h 24 h 1 h 2 h 3 h 24 h 48 h 72 h 96 h
Initial 98.3
Control 100.9 101.3 101.0 100.9 101.0
Aqua 2k (1) 3.8 1.2 1.1 1.1 0.3 0.1 0.3 0.2
Aqua 2k (2) 2.2 0.6 0.6 0.6 0.2 0.1 0.3 0.2
LOQ 1 mg/L LOD 0.2 mg/L. The deionised water solution was replaced at time 0
and at time 48 h.
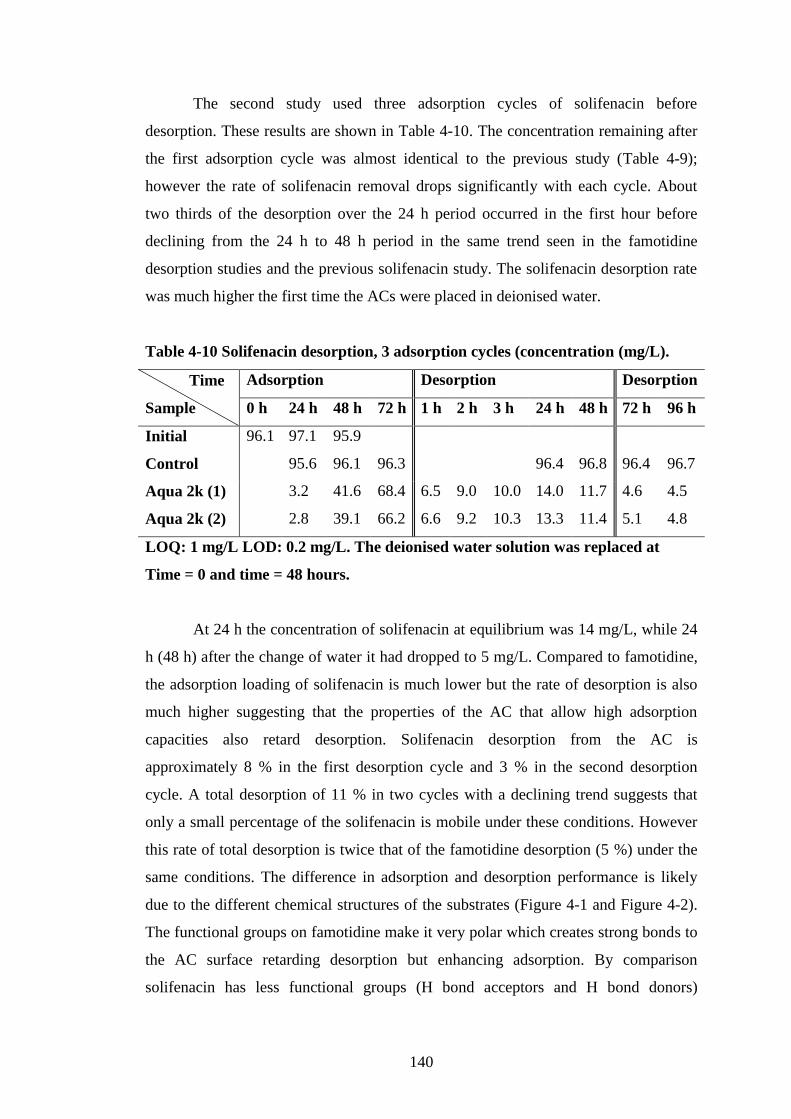
140
The second study used three adsorption cycles of solifenacin before
desorption. These results are shown in Table 4-10. The concentration remaining after
the first adsorption cycle was almost identical to the previous study (Table 4-9);
however the rate of solifenacin removal drops significantly with each cycle. About
two thirds of the desorption over the 24 h period occurred in the first hour before
declining from the 24 h to 48 h period in the same trend seen in the famotidine
desorption studies and the previous solifenacin study. The solifenacin desorption rate
was much higher the first time the ACs were placed in deionised water.
Table 4-10 Solifenacin desorption, 3 adsorption cycles (concentration (mg/L).
Time
Sample
Adsorption Desorption Desorption
0 h 24 h 48 h 72 h 1 h 2 h 3 h 24 h 48 h 72 h 96 h
Initial 96.1 97.1 95.9
Control 95.6 96.1 96.3 96.4 96.8 96.4 96.7
Aqua 2k (1) 3.2 41.6 68.4 6.5 9.0 10.0 14.0 11.7 4.6 4.5
Aqua 2k (2) 2.8 39.1 66.2 6.6 9.2 10.3 13.3 11.4 5.1 4.8
LOQ: 1 mg/L LOD: 0.2 mg/L. The deionised water solution was replaced at
Time = 0 and time = 48 hours.
At 24 h the concentration of solifenacin at equilibrium was 14 mg/L, while 24
h (48 h) after the change of water it had dropped to 5 mg/L. Compared to famotidine,
the adsorption loading of solifenacin is much lower but the rate of desorption is also
much higher suggesting that the properties of the AC that allow high adsorption
capacities also retard desorption. Solifenacin desorption from the AC is
approximately 8 % in the first desorption cycle and 3 % in the second desorption
cycle. A total desorption of 11 % in two cycles with a declining trend suggests that
only a small percentage of the solifenacin is mobile under these conditions. However
this rate of total desorption is twice that of the famotidine desorption (5 %) under the
same conditions. The difference in adsorption and desorption performance is likely
due to the different chemical structures of the substrates (Figure 4-1 and Figure 4-2).
The functional groups on famotidine make it very polar which creates strong bonds to
the AC surface retarding desorption but enhancing adsorption. By comparison
solifenacin has less functional groups (H bond acceptors and H bond donors)

141
therefore it is easier for it to desorb back into solution. The enhanced desorption could
contribute to the synergy in IPCA photodegradation. Faster desorption would lead to
more migration to the TiO2 surface and thus more photodegradation.
4.7 Conclusions
Baseline adsorption studies have demonstrated that AC has a large adsorption
capacity for famotidine and solifenacin and is a suitable adsorbent for their removal.
Studies of P25 demonstrate that it is an ineffective adsorbent. Isotherm modelling
gave some insights into the adsorption process on AC and IPCAs. These results
indicate that IPCAs are suitable for adsorbing pharmaceuticals in the dark:
Intraparticle diffusion is the limiting step for both famotidine and solifenacin
adsorption.
P25 TiO2 has negligible adsorption capacity.
The adsorption capacity of AC at 150 mg/L initial concentration is 82 mg/g for
famotidine and 60 mg/g for solifenacin. This establishes the adsorption capacity
of the AC for the pharmaceuticals under investigation.
For solifenacin adsorption the IPCA’s adsorption capacity (60 mg/g) is not
noticeably different to the unmodified AC (60 mg/g). For famotidine adsorption
the IPCA (93 mg/g) adsorbed more than the AC (82 mg/g).
Desorption of famotidine and solifenacin adsorbed on the AC surface was less
than 5 % for famotidine and 11 % for solifenacin over a four day period.
Indicating that only a small fraction (<12 %) of the API adsorbed on an AC can
desorb into solution.
The Temkin model is the best fit for the famotidine adsorption data, while the
Redlich-Peterson model is the best fit for the solifenacin data in terms of R2 and
SSE values.
These results complete the first part of the first aim of the project: “The capacity
of IPCAs, commercial AC and TiO2 to adsorb … pharmaceuticals”.

142
Chapter 5 Photodegradation
Studies

143
5.1 Introduction
Given that IPCAs can adsorb both famotidine and solifenacin, the next step is
to determine the IPCA’s photocatalytic properties and the photocatalytic properties of
the raw materials. Photolysis studies were used to determine the substrate
photodegradation due to UV light alone. Photocatalysis studies used unmodified TiO2
(P25) to demonstrate how much substrate is removed by conventional photocatalysis.
Initial screening studies of the IPCAs prepared by ultrasonication were undertaken to
determine their photocatalytic properties. This chapter will investigate:
Photolysis of famotidine and solifenacin using light from a medium pressure
mercury lamp.
Photocatalysis of famotidine and solifenacin using TiO2, IPCAs and AC.
If ultrasonication impregnation of Aqua 2k AC and P25 TiO2 is suitable for
preparing photocatalytic IPCAs.
The optimum TiO2: Aqua 2k ratio for an IPCA.
The experimental conditions necessary to determine IPCA photocatalysis
IPCA dark adsorption, with AC and TiO2 control studies.
Photodegradation studies of solifenacin under the same conditions as famotidine.
5.2 Baseline photodegradation studies
No studies of IPCA photodegradation of famotidine were found in the
surveyed literature however there is one study on the use of anatase and rutile TiO2 to
degrade famotidine “compacts”; compressed mixtures of TiO2 and famotidine
(Kakinoki et al., 2004). This study determined that famotidine discoloured slightly
under 300 nm to 450 nm light but discoloured significantly in the presence of
irradiated TiO2 at the same wavelengths.
Initial studies of famotidine and solifenacin photodegradation under UV light
were undertaken in the absence of catalysts (photolysis) and in the presence of P25
TiO2 (photocatalysis). Two concentrations of famotidine were chosen: 50 mg/L and
100 mg/L and 45 mg/L and 100 mg/L for solifenacin.

144
5.2.1 Photolysis studies
Photolysis of famotidine (no catalyst is used) is shown in Figure 5-1. There is
a decline of 15 mg/L famotidine over 180 min of illumination at an initial famotidine
concentration of 100 mg/L. At an initial concentration of 50 mg/L the famotidine
concentration was reduced by 10 mg/L after 180 min of illumination. These results
show that degradation of famotidine (photolysis) occurs in the absence of a catalyst.
0
10
20
30
40
50
60
70
80
90
100
110
-60 -30 0 30 60 90 120 150 180
Con
cen
trati
on
of
fam
oti
din
e (m
g/L
)
Time (min)
100 mg/L famotidne
50 mg/L famotidine
Figure 5-1 Concentration of famotidine vs. time for photolysis studies, t < 0 is the
period where famotidine was present in the reactor without illumination.
Average results shown (N=2), error bars are standard deviation.
Photolysis studies of solifenacin are shown in Figure 5-2. Solifenacin
photolysis is not evident at Ci = 50 mg/L or Ci = 100 mg/L. This indicates that no
solifenacin photodegradation occurs in the absence of a photocatalyst.

145
0
10
20
30
40
50
60
70
80
90
100
-30 0 30 60 90 120 150 180
Con
cen
trati
on
of
soli
fen
aci
n (
mg/L
)
Time (min)
100 mg/L solifenacin succinate
45 mg/L solifenacin succinate
Figure 5-2 Concentration of solifenacin vs. time for photolysis studies, When t <
0 the solifenacin was in the reactor without illumination. Average q(exp) results
shown (N=2), error bars are standard deviation.
5.2.2 Photocatalysis studies
5.2.2.1 Photocatalysis catalyst concentration optimisation
For photocatalysis studies it was necessary for the catalyst concentration in
solution to be optimised to achieve optimum photocatalysis in solution. The effect of
different catalysts concentrations of P25 TiO2 on the photocatalytic degradation of the
100 mg/L famotidine solution in the borosilicate glass photoreactor used for
suspended TiO2 and IPCA studies is shown in Figure 5-3.
All studies using P25 demonstrate removal of famotidine compared to
photolysis. There was no notable difference in famotidine removal for the TiO2
concentration of 0.2 g/L, 0.3 g/L and 0.4 g/L; however the 0.5 g/L TiO2 concentration
had a slightly higher removal rate. Overall these results are in accordance with
previous work (Murphy, 2009) which demonstrated that 0.4 g/L TiO2 was the
optimum catalyst concentration (in the range of 0.1 g/L and 0.6 g/L) at the 0.083 mM
(28 mg/L) famotidine concentration investigated.

146
0
10
20
30
40
50
60
70
80
90
100
110
-60 -30 0 30 60 90 120 150 180
Con
cen
trati
on
of
fam
oti
din
e (m
g/L
)
Time (min)
0.2g/L P25
0.3g/L P25
0.4g/L P25
0.5g/L P25
Average photolysis
Figure 5-3 Concentration of famotidine vs. time for different P25 catalyst
concentrations and photolysis control.
5.2.2.2 Photocatalysis studies for famotidine and solifenacin
The photocatalytic degradation of famotidine by 0.4 g/L TiO2 at initial
concentrations of 50 mg/L and 100 mg/L are shown in Figure 5-4. The shape of each
graph is very similar; a fast initial decline in the first 30min of illumination and a
slower but steady decline from 30 min onwards. The mass of famotidine removed at
both concentrations, after 180 min of irradiation was very similar: 55 mg at Ci = 100
mg/L and 50 mg at Ci = 50 mg/L.

147
0
10
20
30
40
50
60
70
80
90
100
-60 -40 -20 0 20 40 60 80 100 120 140 160 180
Co
nce
ntr
ati
on
of
fam
oti
din
e (m
g/L
)
Time (min)
100 mg/L famotidine
50 mg/L famotidine
Figure 5-4 Concentration of famotidine vs. time for 0.4g/L P25 photocatalysis
studies, t < 0 is the period where famotidine was present in the reactor without
illumination. Average q(exp) results shown (N=3), error bars are standard
deviation.
The photocatalytic degradation of solifenacin by 0.4 g/L P25 at initial
concentrations of 50 mg/L and 100 mg/L are shown in Figure 5-5. The shape of each
graph is very similar; a fast initial decline in the first 20min of illumination and a
slower but steady decline after that. The mass of solifenacin removed was 24 mg at Ci
= 100 mg/L and 30 mg at Ci = 45 mg/L.

148
0
10
20
30
40
50
60
70
80
90
100
110
-60 -40 -20 0 20 40 60 80 100 120 140 160 180
Con
cen
trati
on
of
soli
fen
aci
n (
mg/L
)
Time (min)
100 mg/L solifenacin succinate
45 mg/L solifenacin succinate
Figure 5-5 Concentration of solifenacin vs. time for 0.4g/L P25 TiO2
photocatalysis studies, t < 0 is the period where solifenacin was present in the
reactor without illumination. Average q(exp) results shown (N=3), error bars are
standard deviation.
5.3 Initial IPCA photodegradation studies
These studies used catalyst concentrations of 0.4 g/L of IPCA, the same
catalyst concentrations as TiO2 studies. TiO2 loadings used to prepare the IPCAs
varied from 1:10 to 1:100 (Figure 5-6). A dark adsorption phase of 15 min was
included however adsorption equilibrium would take significantly longer (see Section
4.3.1.1). The IPCAs demonstrated limited famotidine removal during the dark
adsorption stage while they displayed moderate famotidine removal during the
photodegradation stage that exceeded photolysis. The increasing TiO2 content of the
IPCAs had no discernible effect on the photodegradation ability of the IPCA. It was
found that TiO2 loadings above 1:10 demonstrated considerable leaching of TiO2
particles into solution (Figure 5-7) making it impossible to determine if
photodegradation was caused by the IPCA or the free TiO2 particles in solution. The
IPCA concentration in subsequent studies was increased from 0.4 g/L to 1.5 g/L in
line with other published IPCA studies (Ao et al., 2008a) to increase photocatalysis.

149
This new IPCA concentration was shown to be the most effective catalyst
concentration for active pharmaceutical ingredient degradation in our group (Basha et
al., 2011), thus the study of different IPCA concentrations was not undertaken.
Subsequent studies used IPCAs with lower percentage TiO2 loadings (in the range of
1:100 to 1:2) to limit TiO2 leaching into solution.
0
10
20
30
40
50
60
-20 0 20 40 60 80 100 120 140 160 180
Con
cen
trati
on
of
fam
oti
din
e (m
g/L
)
Time (min)
1:10 IPCA
1:5 IPCA
1:2 IPCA
1:1.33 IPCA
1:1 IPCA
Photolysis
Figure 5-6 Famotidine concentration vs. time of IPCAs prepared by
ultrasonication using Aqua 2k with TiO2 loadings from 1:10 to 1:1. Catalyst
concentration 0.4 g/L IPCA. t = -15 to 0 is the dark adsorption phase.

150
Figure 5-7 1L photoreactor after photodegradation using 1:1 IPCA, loose TiO2 is
visible in solution as a grey cloud. A pH probe is also present in the solution.
The higher catalyst concentration in the photoreactor caused an increase in
famotidine sorption during the dark adsorption stage (Figure 5-8) compared to the 0.4
g/L catalyst concentration (Figure 5-6). There was also a more pronounced difference
in photodegradation ability in IPCAs prepared with different TiO2 contents.
0
5
10
15
20
25
30
35
40
45
50
55
-20 0 20 40 60 80 100 120 140 160 180
Con
cen
trat
ion
of
fam
otid
ine
(mg/
L)
Time (min)
1:100 IPCA
1:40 IPCA
1:20 IPCA
1:10 IPCA
1:4 IPCA
1:2 IPCA
Figure 5-8 Famotidine concentration vs. time of IPCAs prepared by
ultrasonication using Aqua 2k with TiO2 loadings ranging from 1:2 to 1:100. t = -
15 to 0 is the dark adsorption phase.

151
The concentration of famotidine at t = 0 is different for each IPCA. It is
necessary to use a kinetic analysis to overcome this limitation. The degradation curves
of famotidine exhibit a mono-exponential trend, suggesting that a pseudo-first order
reaction model can be applied to describe the kinetic behaviour (Aruldoss et al., 2011,
Li et al., 2008b, Yoon et al., 2012, Zhang et al., 2011b). For IPCAs photocatalysis it
is necessary for the substrate to adsorb onto the IPCA. A low substrate concentration
will have a low adsorption rate which lowers the photodegradation rate. Therefore the
initial concentration of famotidine affects the degradation rate, i.e. the kinetic rate
constant decreases with decreasing concentration (da Silva and Faria, 2003). Pseudo-
first order kinetics with respect to famotidine concentration (C) in solution may be
expressed as:
rCkdt
dCapp (33)
Integration of the Eq. 33 leads to following equation.
tkC
CIn app
0
(34)
where, kapp is the apparent pseudo-first order rate constant and is affected by
famotidine concentration, C0 is the initial concentration in the bulk solution after dark
adsorption, r is reaction rate and t is the reaction time, with the same restriction of C =
C0 at t = 0. The values of kapp were obtained directly from the regression analysis of
the of the plot of Eq. 34 (a plot of ln(C0/C) vs. t) for all experiments.
kapp values (Table 5-1) for the photodegradation performance of the IPCAs
were in the order 1:2 > 1:4 > 1:10 > 1:40 > 1:100 > 1:20. Free TiO2 particles were
present in the 1:4 and 1:2 IPCAs which may be responsible for their higher
photodegradation performance. Consequently subsequent studies of IPCAs used P25
loading ratios no greater than 1:10 and additional washing of the IPCAs during and
after synthesis to prevent leaching.

152
Table 5-1 kapp values for photodegradation of famotidine using 1:100-1:2 IPCAs.
IPCA type C0 (mg/L) Pseudo-first-order model
kapp (min-1
) Correlation coefficient, R2
1:100 IPCA 36.25 0.0082 0.9698
1:40 IPCA 37.81 0.0092 0.9728
1:20 IPCA 40.65 0.0066 0.9796
1:10 IPCA 34.33 0.0098 0.9616
1:4 IPCA 30.98 0.0103 0.9961
1:2 IPCA 29.13 0.0104 0.9663
0.00
0.20
0.40
0.60
0.80
1.00
1.20
1.40
1.60
1.80
2.00
0 20 40 60 80 100 120 140 160 180 200Time (min)
In(C
0/C
)
1:100 IPCA
1:40 IPCA
1:20 IPCA
1:10 IPCA
1:4 IPCA
1:2 IPCA
.
Figure 5-9 Pseudo reaction rates vs. time of IPCAs prepared by ultrasonication
using Aqua 2k with P25 TiO2 loadings from 1:100 to 1:2.
The use of the higher catalyst concentration (1.5 g IPCA/L) demonstrated a
more pronounced removal (Figure 5-10) of famotidine, however, the adsorption in the
dark adsorption stage is more pronounced with the 1.5 g/L catalyst concentration
compared to the 0.4 g/L catalyst concentration. Future studies used a one hour dark
adsorption time used in published studies (Liu et al., 2009).

153
0
5
10
15
20
25
30
35
40
45
50
55
-20 0 20 40 60 80 100 120 140 160 180
Con
cen
trati
on
of
fam
oti
din
e (m
g/L
)
Time (min)
1:10 IPCA (1.5g/L) 1:4 IPCA (1.5g/L)
1:2 IPCA (1.5g/L) 1:10 IPCA (0.4g/L)
1:5 IPCA (0.4g/L) 1:2 IPCA (0.4g/L)
Figure 5-10 Famotidine concentration vs. time of IPCAs with the similar TiO2
concentrations at 0.4 g/L and 1.5 g/L catalyst concentrations.
5.4 Optimisation of IPCA photodegradation of famotidine
The 1.5 g/L catalyst concentration from previous studies was used and the
dark adsorption phase was increased from 15 min to 60 min to help differentiate
adsorption from photocatalysis. The stirring rate and illumination time remained the
same. The level of removal of famotidine from aqueous solutions by 1:200 to 1:10
IPCAs increased with UV irradiation time after dark adsorption (Figure 5-11, Figure
5-12). Famotidine reduction in photolysis studies was 39 % after 180 min of
illumination and was lower than the removal rate of all of the IPCAs and the TiO2
control. The observed improvement in famotidine removal relative to photolysis and
the dark adsorption control was attributed to photocatalytic activity of the TiO2
particles on the AC. IPCAs containing 10 % TiO2 (1:10 IPCA) reduced the
famotidine concentration faster than the other IPCAs. The relationship between the
famotidine degradation rate (in terms of kapp values) by the IPCAs follows the
sequence: 1:10 > 1:13 > 1:20 > 1:40 > 1:100 > 1:200 > 1:10 (without illumination).
The effect of heat treatment (calcination) on IPCA performance was
investigated. Heat treated IPCAs were prepared using the method detailed in Section
2.2.1.2. The removal rates for heat treated 1:10 IPCAs decreased with increasing

154
calcination temperature in the order: 200 C > 500 C > 600 C > 700 C (Figure 5-13,
Table 5-2). The percentage of the famotidine degraded by the 1:10 (non-heat treated)
IPCA under UV irradiation was 77 % after 180 min while the 1:10 IPCA heat treated
at 200 C degraded 73 % of famotidine. These similar values indicate that heat
treatment at 200 C has no significant effect on the catalyst morphology or
effectiveness. The reduction in removal efficiency with increasing calcination
temperature is shown in Figure 5-13. In published studies it is assumed that both the
crystal structure and porosity of the composite catalyst have an influence on its
photocatalytic properties (Sun et al., 2009, Sun et al., 2006) i.e. the anatase to rutile
structure has changed and this is the cause of the lower photoactivity. The XRD
results in Section 6.4 are inconclusive regarding phase change. Further investigation
of heat treatment was not undertaken as it was not a promising line of investigation.
0
10
20
30
40
50
60
-60 -40 -20 0 20 40 60 80 100 120 140 160 180
Co
nce
ntr
ati
on
of
fam
oti
din
e (m
g/L
)
Time (min)
1:200 IPCA1:100 IPCA1:40 IPCA1:20 IPCA1:13 IPCA1:10 IPCA1:10 IPCA (Dark)PhotolysisP25
Figure 5-11 Famotidine concentration vs. time for 1:200 IPCA to 1:10 IPCAs
including TiO2, dark adsorption and photolysis controls.
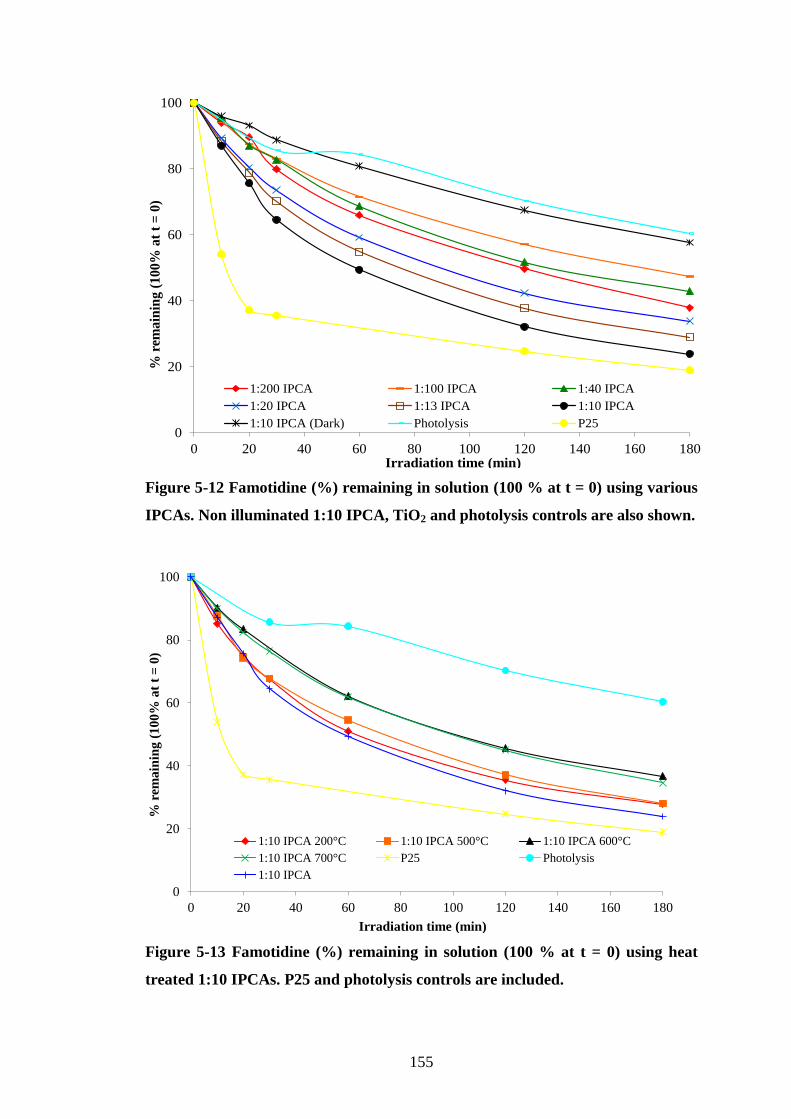
155
0
20
40
60
80
100
0 20 40 60 80 100 120 140 160 180
% r
ema
inin
g (
10
0%
at
t =
0)
Irradiation time (min)
1:200 IPCA 1:100 IPCA 1:40 IPCA
1:20 IPCA 1:13 IPCA 1:10 IPCA
1:10 IPCA (Dark) Photolysis P25
Figure 5-12 Famotidine (%) remaining in solution (100 % at t = 0) using various
IPCAs. Non illuminated 1:10 IPCA, TiO2 and photolysis controls are also shown.
0
20
40
60
80
100
0 20 40 60 80 100 120 140 160 180
% r
ema
inin
g (
10
0%
at
t =
0)
Irradiation time (min)
1:10 IPCA 200°C 1:10 IPCA 500°C 1:10 IPCA 600°C
1:10 IPCA 700°C P25 Photolysis
1:10 IPCA
Figure 5-13 Famotidine (%) remaining in solution (100 % at t = 0) using heat
treated 1:10 IPCAs. P25 and photolysis controls are included.

156
The degradation curves of famotidine continue to exhibit a mono-exponential
trend and were modelled (Figure 5-14, Figure 5-15) using the same pseudo-first order
reaction model as previous studies.
0.0
0.2
0.4
0.6
0.8
1.0
1.2
1.4
1.6
1.8
0 20 40 60 80 100 120 140 160 180
ln(C
0/C
)
Time (min)
1:200 IPCA
1:100 IPCA
1:40 IPCA
1:20 IPCA
1:13 IPCA
1:10 IPCA
1:10 IPCA (Dark)
Figure 5-14 Kinetics of famotidine photodegradation (linear transform ln(C0/C)
vs. t) in photocatalytic experiments using various IPCAs.
0.0
0.2
0.4
0.6
0.8
1.0
1.2
1.4
1.6
1.8
0 20 40 60 80 100 120 140 160 180
ln(C
0/C
)
Time (min)
1:10 IPCA 200°C
1:10 IPCA 500°C
1:10 IPCA 600°C
1:10 IPCA 700°C
1:10 IPCA
1:10 IPCA (Dark)
Figure 5-15 Kinetics of famotidine photodegradation (linear transform ln(C0/C)
vs. t) in photocatalytic experiments using heat treated IPCAs.

157
Table 5-2 kapp values for photodegradation of famotidine using various IPCAs.
IPCA type Pseudo first-order model
C0
(mg/L)
kapp (min-1
) Correlation
coefficient, R2
1:200 IPCA 31 0.0045 0.955
1:100 IPCA 31 0.0047 0.947
1:40 IPCA 29 0.0052 0.968
1:20 IPCA 26 0.007 0.915
1:13 IPCA 25 0.0077 0.940
1:10 IPCA 25 0.0091 0.915
1:10 IPCA heat treated at 200°C 26 0.008 0.957
1:10 IPCA heat treated at 500°C 36 0.0078 0.932
1:10 IPCA heat treated at 600°C 29 0.0062 0.924
1:10 IPCA heat treated at 700°C 31 0.0063 0.967
Both the kapp values and the photodegradation graphs (Table 5-2 and Figure
5-12) demonstrate that the 1:10 IPCA is the best performing IPCA and that the
relative position of each IPCAs in terms of photoactivity (for adsorption performance,
see Chapter 4) also corresponds to its TiO2 loading e.g. the 1:100 and 1:200 IPCA
have the lowest TiO2 loading and photoactivity while the 1:10 IPCA has the opposite.
This is in contrast to published studies that demonstrate an optimum TiO2 loading
above which the photocatalytic ability decreases. This is possibly due to the leaching
of TiO2 at higher loading levels into solution because of the preparation method
employed in this study. This makes it impossible to identify the optimum loading as
the extra photoactivity could also be interpreted as the effect of free TiO2. The 1:10
IPCA was also found to be the most effective IPCA in other studies in this research
group on amoxicillin and indomethacin (Basha et al., 2011, Basha et al., 2010).

158
5.5 Photodegradation studies of famotidine using 1:10 IPCA
and AC control
After the optimum P25: AC ratio was determined and reactor conditions
enhanced to allow photodegradation using IPCAs to be observed, more detailed
famotidine studies were undertaken. These studies used the 1:10 IPCAs with a 1.5 g/L
catalyst concentration (Sections 5.4). The 1:10 IPCA used in this section was prepared
using the improved IPCA preparation method (Section 2.2.1.3). To ensure a more
pronounced difference between the dark adsorption stage and illuminated stage the
dark adsorption stage was extended to 4 h followed by 3 h of photodegradation and
the initial concentration before dark adsorption was increased to 100 mg/L in line
with the highest concentration used in photolysis studies to ensure that there was a
large concentration of famotidine available for degradation after dark adsorption.
These conditions were used in an attempt to ensure that the majority of famotidine
adsorption would occur before illumination to ensure that it could be separated from
photocatalysis. Compared to the previous studies more adsorption will have occurred
during the dark phase compared to the photodegradation phase so the results would
show more pronounced photodegradation. These results are shown in Figure 5-16.

159
0
10
20
30
40
50
60
70
80
90
100
110
-240 -180 -120 -60 0 60 120 180
Fam
oti
din
e co
nce
ntr
ati
on
(m
g/L
)
Illuminated time (min)
Photolysis
P25 TiO2
Dark IPCA
Light IPCA
Light AC
Dark AC
Figure 5-16 Famotidine concentration vs. time for 1:10 IPCAs, AC, P25 and
photolysis studies. “Light” studies were illuminated; “Dark” studies were not.
Average results shown (N=3), error bars are standard deviation.
The TiO2 and photolysis controls are the same as those discussed in Section
5.2. The different adsorption rates for each study leaves a different concentration at t
= 0 for each adsorbent (light and dark IPCAs and ACs). No discernible pattern can be
detected. The dark AC studies remove the most famotidine, while the dark IPCA
studies removed the least famotidine of all the adsorbents. When the results are
expressed as percentage removed from t = 0 (Figure 5-17) the illuminated IPCA
removed the most famotidine, although the dark AC removed the second largest
amount of famotidine. When error bars are included and the effect of photolysis is
considered there is negligible difference between the illuminated and non-illuminated
IPCAs.

160
0
10
20
30
40
50
60
70
80
0 20 40 60 80 100 120 140 160 180
% r
emo
va
l o
f fa
mo
tid
ine
Illumination time (min)
Light IPCA
P25 TiO2
Dark AC
Light AC
Dark IPCA
Photolysis
Figure 5-17 Average % remaining of famotidine concentration vs. time for
photolysis, P25, illuminated and not illuminated IPCAs and ACs. Average results
shown (N=3), error bars are standard deviation.
Further evidence of the lack of photodegradation of famotidine by the IPCA is
provided by FTIR. It was used to examine three separate 1:10 IPCAs; one that was
unused, another that photodegraded a 50 mg/L famotidine solution and a final sample
used for famotidine adsorption in the dark.
The FTIR spectra of the 1:10 IPCA after the adsorption of famotidine in the
dark and after photodegradation along with FTIR spectrum of virgin 1:10 IPCA
catalyst are shown in Figure 5-18 (a–c). Compared to the raw IPCA (Figure 5-18 (a))
new absorption bands such as 3391, 2918, 1537 and 1089cm-1
which appeared on the
absorption spectra of the IPCA after famotidine adsorption (Figure 5-18 (b)) can be
assigned to O–H stretching, C–H stretch of alkane, N–O stretch of nitro, respectively.
Both alcohol and nitro groups were involved in the famotidine adsorption (Figure
5-18 (b)). In general, the famotidine molecule consists of guanidine, thiazole,
thioether and sulfamoyl parts (Roeges, 1994). It exhibits strong absorptions in the
region 3,550–3,250cm-1
as well as 1,500–1,650 and 1,135–1,360cm-1
due to NH2 and
SO2 functional groups (Saepurahman et al., 2010). After irradiation of the famotidine
loaded 1:10 IPCA, peaks in the 1,500–1,650 and 1,135–1,360cm-1
range decreased

161
(Figure 5-18 (c)) suggesting that the adsorbed famotidine did not undergo significant
– if any - photodegradation. If these peaks were absent then it would indicate that the
famotidine was photodegraded.
Figure 5-18 FTIR spectra of (a) virgin 1:10 IPCA, (b) 1:10 IPCA after
famotidine adsorption and (c) 1:10 IPCA after photodegradation of famotidine.
The limited removal of famotidine at the 50 mg/L famotidine concentration,
the negligible removal of famotidine at the 100 mg/L concentration and the FTIR
results indicate that IPCAs have a limited ability to photodegrade famotidine. The
photodegradation potential of the IPCA for famotidine removal is small compared to
its adsorption ability. In conclusion IPCAs are not effective for famotidine
photodegradation.

162
5.6 Photodegradation studies of solifenacin using 1:10 IPCA
and AC control
The poor performance of the IPCAs for famotidine degradation casts doubt on
the viability of IPCAs for degrading pharmaceuticals. In similar studies using IPCAs
(O'Dwyer. 2011) to photodegrade chlorinated pesticides: 2, 4-Dichlorophenoxyacetic
acid (2,4-D) and 2-methyl-4-chlorophenoxyacetic acid (MCPA), the illuminated
IPCAs removed the same amount of 2,4-D and MCPA as the dark adsorption control.
This demonstrates that IPCAs are not effective for chlorinated pesticide removal.
They demonstrated no synergy compared to TiO2 and AC adsorption in the dark.
IPCA studies on amoxicillin (antibiotic) and indomethacin (a non-steroidal anti-
inflammatory drug) were more successful (Basha et al., 2011, Basha et al., 2010). It
was decided to investigate the adsorption and photocatalytic performance of the
IPCAs on a different substrate. The pharmaceutical solifenacin succinate was
investigated to provide a contrast to famotidine. The IPCAs that were illuminated
were labelled “light IPCA” while the IPCAs that were not illuminated were called
“dark IPCA”. The same naming scheme was also applied to the AC controls. The
studies using no catalyst were called “photolysis” and the studies using P25 were
labelled “TiO2”.
The 1:10 IPCA used in this section was prepared using the improved IPCA
prepation method (Section 2.2.1.3). Initial studies used 40 - 45 mg/L solifenacin in
deionised water solutions and are shown in Figure 5-19. Solifenacin removal followed
the order light IPCA > dark IPCA > TiO2 > photolysis. Photolysis had a negligible
effect on the solifenacin concentration reducing the concentration by 1 mg/L or 2 %.
TiO2 photocatalysis using P25 reduced the solifenacin concentration by 30 mg/L or 65
% of the solifenacin in solution. The light IPCA was illuminated from t = 0 - 180. It
adsorbed and degraded 33 mg/L or 75 % of the solifenacin. Compared to TiO2 the rate
of degradation was identical to the illuminated IPCA from 60 min onwards indicating
that the IPCA has robust photocatalytic activity. The dark IPCA removed 20 mg/L of
the solifenacin in solution or 50 % and the absence of illuminated means it is due to
adsorption. The rate of adsorption moderated during the contact time indicating
saturation of the IPCA. A comparison between the light and dark IPCA illustrates the
effect of photocatalysis as the illumination dramatically increases the solifenacin
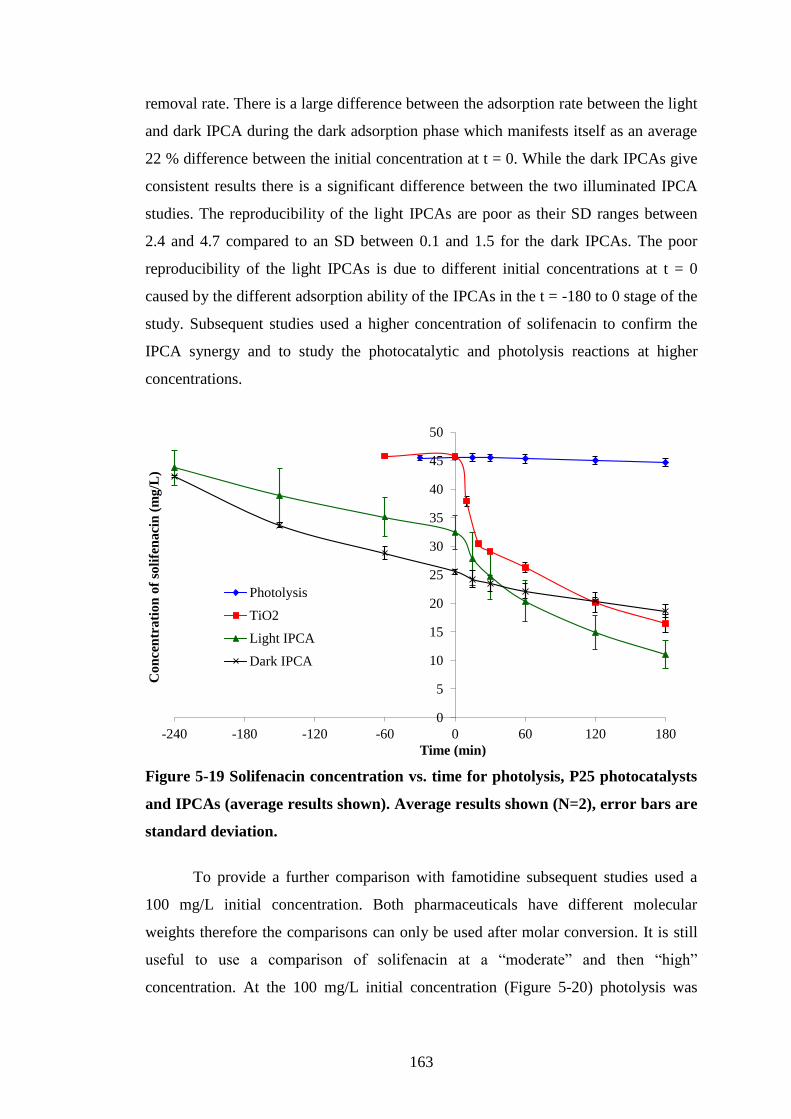
163
removal rate. There is a large difference between the adsorption rate between the light
and dark IPCA during the dark adsorption phase which manifests itself as an average
22 % difference between the initial concentration at t = 0. While the dark IPCAs give
consistent results there is a significant difference between the two illuminated IPCA
studies. The reproducibility of the light IPCAs are poor as their SD ranges between
2.4 and 4.7 compared to an SD between 0.1 and 1.5 for the dark IPCAs. The poor
reproducibility of the light IPCAs is due to different initial concentrations at t = 0
caused by the different adsorption ability of the IPCAs in the t = -180 to 0 stage of the
study. Subsequent studies used a higher concentration of solifenacin to confirm the
IPCA synergy and to study the photocatalytic and photolysis reactions at higher
concentrations.
0
5
10
15
20
25
30
35
40
45
50
-240 -180 -120 -60 0 60 120 180
Con
cen
trati
on
of
soli
fen
aci
n (
mg/L
)
Time (min)
Photolysis
TiO2
Light IPCA
Dark IPCA
Figure 5-19 Solifenacin concentration vs. time for photolysis, P25 photocatalysts
and IPCAs (average results shown). Average results shown (N=2), error bars are
standard deviation.
To provide a further comparison with famotidine subsequent studies used a
100 mg/L initial concentration. Both pharmaceuticals have different molecular
weights therefore the comparisons can only be used after molar conversion. It is still
useful to use a comparison of solifenacin at a “moderate” and then “high”
concentration. At the 100 mg/L initial concentration (Figure 5-20) photolysis was

164
negligible the same as at 40 mg/L, reducing the average solifenacin concentration by
4 mg/L or less than 5 %. Photocatalysis using P25 reduced the solifenacin
concentration by 24 mg/L on average or 25 % of the solifenacin in solution. P25 TiO2
photocatalysis demonstrated a lower % reduction in solifenacin concentration (25 %
vs. 65 %) compared to the 40 mg/L initial concentration. Like the 40 mg/L studies the
light IPCA shows a considerable increase in solifenacin degradation rates during
illumination degrading 43 % of the solifenacin in solution at t = 0 compared to 11 %
that was adsorbed by the dark IPCA. The dark IPCA adsorption rate decreases with
time and its overall removal rate was lower than the light IPCA due to the absence of
photocatalysis.
0
10
20
30
40
50
60
70
80
90
100
-240 -180 -120 -60 0 60 120 180
Co
nce
ntr
ati
on
of
soli
fen
aci
n (
mg
/L)
Time (min)
Photolysis
P25
Light IPCA
Dark IPCA
Dark AC
Light AC
Figure 5-20 Solifenacin concentration vs. time for photolysis, P25 photocatalysts,
IPCAs and ACs (average results shown). Average results shown (N=3), error
bars are standard deviation.
The light IPCA removed 57 % of the solifenacin compared to 30 % removal
by the dark IPCA over the 240 min study period. The AC controls demonstrate no
photocatalytic ability. When error bars are considered there is no difference between
the illuminated AC, the AC control in the dark and the dark IPCA, as they removed
33 %, 31 % and 30 % of the solifenacin respectively over 420 min. This combined
with the negligible photolysis indicates that illuminated IPCAs have considerable
synergistic (removal greater than adsorption and photodegradation combined) ability

165
which cannot be attributed to photolysis plus adsorption as is the case with famotidine
studies.
5.7 Conclusions
IPCAs demonstrate the ability to remove famotidine at a faster rate than
photolysis at a high catalyst concentration. This confirms that Aqua 2k and P25 can
be combined into an IPCA using ultrasonication. In terms of photocatalytic ability and
catalyst stability the 1:10 IPCA was determined to be the best IPCA. On investigation
with a long (4 h) dark adsorption time famotidine does not demonstrate any
convincing photodegradation ability. In contrast, solifenacin photodegradation using
IPCAs demonstrates convincing photodegradation ability under the same conditions.
1.5 g/L IPCA catalyst concentration is required to achieve high removal of
famotidine.
Removal of famotidine during illumination of the IPCA increases with TiO2
loading up to a ratio of 1:10.
IPCAs with TiO2: AC loadings above 1:10 leach TiO2 into solution.
Pseudo first order kinetics can be used to model the famotidine photodegradation
reaction at an initial concentration of 50 mg/L.
Famotidine studies with a 4 h dark adsorption time were unsuccessful as
famotidine removal by the illuminated IPCAs was no higher than adsorption by
the IPCAs in the dark.
Solifenacin studies were successful as they demonstrated synergy i.e. the IPCA
removed more solifenacin than the AC and TiO2 combined under illumination.
The famotidine and solifenacin results represent the realisation of the second
project aim: “The potential for synergy between AC and TiO2 for the removal of
pollutants”.

166
Chapter 6 Evaluation of
Findings

167
6.1 Introduction
In the reviewed literature in Chapter 1, it is claimed that IPCAs are a robust
and effective technology for removing organic pollutants. However, arising from the
research for this thesis, it has been found that this is not always the case and synergies
between activated carbon and titanium dioxide in the form of an IPCA is not
guaranteed. On further evaluation of the literature in this work, many gaps in the
research methodologies and experimental conditions reported are used to illustrate
that many claimed synergies are flawed. Results from this current work have found
synergy in pollutant degradation in the case of solifenacin, but no synergy has been
found in the case of famotidine. A possible explanation for this difference is proposed
in Section 6.3 arising from the differences in chemical structure of each compound.
To test this hypothesis, the degradation of two other pharmaceuticals previously
studied within our research group will be compared and contrasted to famotidine and
solifenacin with respect to IPCA photodegradation. In summary, this chapter will:
Critically evaluate the claimed synergy of IPCAs in published literature in the
degradation of pollutants (Section 6.2).
Detail the pharmaceuticals investigated for IPCA synergy and adsorption capacity
in this work and in this author’s research group (Section 6.3).
Discuss the contribution of different chemical properties to enhance/inhibit
photodegradation and hypothesise as to why synergy is displayed in the
degradation of some pharmaceuticals, but not in others (Section 6.4).
Propose suggestions for future work to determine the mechanisms that
enhance/inhibit photocatalytic degradation (Section 6.5).
6.2 Critical assessment of synergy claims in IPCA literature
IPCAs demonstrated synergy (removal greater than adsorption and
photodegradation combined) for solifenacin degradation but not famotidine
degradation. Famotidine studies demonstrated no removal beyond adsorption and
photolysis. This indicates that IPCAs are ineffective for famotidine photodegradation.
These famotidine results are in contrast to the majority of the published literature
which establishes IPCAs as versatile photocatalysts for organic degradation.

168
A critical approach was used to re-evaluate IPCA studies included in the
literature review and a detailed critique of each study is contained in the “notes”
column in Appendix A and B. Synergy between the AC and TiO2 under UV
illumination is stated as the key advantage of using IPCAs (Foo and Hameed, 2010a,
Khan, 2002, Matos et al., 1998) and warrants more investigation as the evidence used
to support claimed synergy is weak or non-existent. In the absence of synergy there is
no economic or environmental justification for combining the AC and TiO2 as they
would perform their respective roles as adsorbent and photocatalyst just as efficiently
separately.
As it is impossible to review every claim of synergy of TiO2 and AC (or other
adsorbents e.g. zeolite) several of the most cited synergy claims will be discussed.
One heavily cited paper that is a proponent of synergy (Matos et al., 1998) used a
50mg: 10mg TiO2: AC mixture - not a true IPCA as the components are not combined
together - denoted as TiO2+AC to demonstrate synergy for phenol degradation in the
mM range (Figure 6-1). Although the graphs legend states M, the method section in
the study refers to the initial concentration in mM. After 30 min of illumination no
photolysis was observed. After very rapid adsorption for the first 15 min in contact
with the solution the AC and TiO2+AC displayed no further adsorption. The
TiO2+AC and TiO2 reduced the substrate concentration during illumination, however
TiO2 on its own displays a higher degradation rate than the TiO2+AC combination
suggesting that the latter has lower photocatalytic performance. The TiO2+AC
mixture reduced the phenol in solution to zero faster due to its lower concentration (at
t = 0) after initial dark adsorption. When the degradation curves are linearised and by
the outlines it is concluded that the TiO2 - AC performs better. The lower phenol
concentration for the IPCA at time = 0 was not considered in this conclusion.

169
Figure 6-1 “(a) Kinetics of phenol disappearance (b) kinetic curves [sic] of
phenol disappearance” (Matos et al., 1998).
AC+TiO2 mixtures were prepared using a milling technique and
ultrasonication and compared to the original mixture described in Figure 6-1. The
lower performance of the ultrasonicated mixture could be attributed to the separation
of TiO2 and AC particles, weakening their surface interaction i.e. their synergy
(Matos et al. 1998). Changes in adsorption performance and thus a higher initial
concentration is a better explanation for the decrease in the apparent rate constant.
Discussion of reaction kinetics hides the lack of robust data to support the synergy
claim.
It is claimed that the degradation of chemical weapons: soman, VX, and
yperite using IPCAs are synergistic (Cojocaru et al., 2009). The degradation of the
substrate using IPCAs (1 % – 25 % wt TiO2 – weight ratios from 1:100 to 1:4 TiO2 to
AC) is greater than unmodified TiO2 is the only evidence put forward to demonstrate
synergy. The lack of an AC and photolysis controls cast doubt on the
photodegradation properties of the IPCA. There is N2 isotherm data in the paper but
no empirical data on adsorption so the proposed synergy could be little more than AC
adsorption. The N-doped titania prepared for the study does appear to perform better
than the unmodified TiO2 although the N doped TiO2 was heat treated and the
unmodified TiO2 was prepared using a low temperature method so they are not
directly comparable as heat treatment can improve photodegradation performance of a
single phase photocatalysis (Fu et al., 2004a, Xu et al., 2008).

170
In a review titled “Carbonaceous nanomaterials for the enhancement of TiO2
photocatalysis” (Leary and Westwood, 2011) the synergism and photoactivity of AC
were attributed to another paper studying phenol. In this paper (Velasco et al., 2010b)
the IPCAs were prepared by rotary evaporating a mixture (15:85) of P25 and AC. The
study lacks a photolysis control and it is unclear if there was an adsorption phase
before UV illumination. The AC performs better than the IPCA under dark adsorption
conditions and it removes a higher concentration of phenol under UV illumination
than the IPCA. The authors attribute the increased phenol removal by the AC to
photoactivity of the AC due to its ash content (11 %). It is proposed that P25 has an
antagonistic effect on the AC (Figure 6-2) in the IPCA in the first hour and half of
photodegradation that is overcome by the photoactivity of P25. No error bars are
given and the experimental method does not mention if the experiments were
repeated.
Figure 6-2 “Phenol concentration decay curves of the investigated catalysts
under dark adsorption and UV irradiation” “Q” refers to the AC and “QTi”
refers to the IPCA (Velasco et al., 2010b).
The IPCAs are claimed to modify the phenol photodegradation pathway
as evidenced by the different ratios of intermediates in the IPCA and P25
photodegradation samples (Figure 6-3). It is noted by the author that the difference is
probably due to adsorption of intermediates onto the AC.

171
Figure 6-3 “Evolution of phenol decomposition intermediates upon UV
irradiation on various materials investigated. (A) commercial titania and (B)
carbon/titania composite” (Velasco et al., 2010b).
A review article of IPCAs prepared by chemical vapour deposition (Li Puma
et al., 2008) claims IPCA synergy and it subsequently cites the studies listed below.
These studies are analysed below and do not offer robust evidence of synergy:
1. Wang et al., (2007) used thirty minutes of dark adsorption and included photolysis
and TiO2 controls. 6 % to 70 % of the dye used as the substrate is removed in the
dark adsorption stage and since there is no dark adsorbent control it is impossible
to determine if the reaction rate is measuring adsorption or photodegradation.
2. Liu et al., (2007a) also used 30 min of dark adsorption before illumination with no
dark adsorption and photolysis controls. Very low adsorption in dark adsorption
stage and lack of controls make it difficult to evaluate performance.
Photodegradation appears noticeably higher after illumination of the three
contaminants.
3. Yoneyama and Torimoto, (2000) notes that mordenite has a high adsorption
capacity but its adsorption strength is moderate enough to allow diffusion of
adsorbed propionaldehyde to the TiO2. Adsorbents with high adsorption constants
e.g. activated carbon gave lower propionaldehyde decomposition rates presumably
due to retardation of the diffusion of the adsorbed propionaldehyde. Experimental
data are given but they do not support synergy. None of the examples in the paper
have photolysis or adsorbent controls and photodegradation experiments do not
seem to use a dark adsorption phase. Although the production of CO2 would
indicate photo-oxidation, with no controls it is impossible to draw firm

172
conclusions. For AC IPCAs there is a high concentration of catalyst (1 g/L) but the
initial substrate concentration of 30 µM in a volume of 10 cm3 is perhaps too small
to evaluate performance. Illumination time is enormous for the comparison of
adsorbents >1000 to 2000 min for 100 % CO2 production. This paper is similar to
a previous study by the same author (Torimoto et al., 1996).
A separate review (Foo and Hameed, 2010a) focusing on the photodegradation
of textile dyes using IPCAs stated the case for synergy between the AC and TiO2
although the term is not explicitly used. The authors cited the aforementioned review
(Li Puma et al., 2008) as evidence of synergy although this review does not provide
any evidence and cites other studies that are listed above. Citing of secondary sources
suggests that claims of synergy are taken as an axiom and that the original evidence
(or any evidence) of synergy is not subjected to any critical review.
A broad review of IPCAs (Lim et al., 2011) includes a figure to illustrate
IPCA synergy. The paper asserts that adsorption is necessary for photodegradation to
occur and thus the Langmuir model is widely accepted for modelling equilibrium
adsorption. The IPCA photodegradation is enhanced by improved mass transfer,
concentrating the target pollutants around the surface of the photocatalyst. These
claims are not referenced or supported. The paper documents the method for
calculating “synergy factor” from Matos et al., (1999). This refers to a letter
submitted to the journal Carbon and the results and explanation are essentially the
same as a previous paper Matos et al., (1998) discussed above with the exception that
the effect of AC surface treatment with acids and bases is investigated.
A film type IPCA prepared using a low temperature sol-gel method was
studied for synergy (Ao et al., 2008b). The IPCA film was placed in 20 mls of a 100
mg/L solution of 4-cholophenol for 30 min of dark adsorption followed by
illumination for 6 h. While a sol-gel TiO2 and P25 control were included there was no
photolysis and adsorbent controls. The dark adsorption stage was not reported;
however, if it was included (as it has been in (Figure 6-4)) it would suggest that the
IPCA performance is mainly adsorption.

173
Figure 6-4 Adapted from Ao et al., (2008b): Diagram of degradation of 4-
chlorphenol. (The dark adsorption time (black line) of the IPCA is not shown in
the original version). Initial concentration of 100 mg/L is stated in the method
section.
Linear transformation of the kinetic curves is used to claim that the IPCAs
worked better but the curves have different starting points so they are not comparable.
Recycling of the composite is detailed but there is no adsorbent or dark control in this
study so the IPCA may not have a longer lifespan than the unmodified AC.
A few select studies demonstrated more convincing results. Ao et al., (2008a)
used the same sol-gel method as a previous study (Ao et al., 2008b) but with phenol
as the substrate. This study lacks a photolysis control and the adsorbent control shows
no reduction in phenol after the initial dark adsorption phase. The IPCA removes
more phenol from the solution than the TiO2, however, the slope of the degradation
lines are very similar even with the difference in substrate concentrations (Figure
6-5). It suggests an effective photoactive IPCA but not necessarily a synergistic
reaction.

174
Figure 6-5 “Degradation of phenol in aqueous solutions” (Ao et al., 2008a).
The photodegradation of microcystin-LR in two similar studies from the same
author (Lee et al., 2004a, Lee et al., 2004b) demonstrates what appears to be IPCA
synergy. Both studies used a closed loop continuous flow fluidised bed reactor and
batch photodegradation apparatus. Photolysis is negligible and the illumination of the
IPCA causes a significant increase in the removal rate compared to the IPCA that was
not illuminated. Seven to fourteen times the amount of substrate could be desorbed
from the IPCA that was not illuminated vs. the IPCA that was illuminated. No
substrate could be extracted from the IPCA sample that had been illuminated for
longer than 30 min. These results suggest that the IPCA can effectively degrade the
substrate which is why it cannot be desorbed. The study design does not allow the use
of TiO2 controls which might be more effective at degrading the microcystin-LR,
therefore this study does not prove synergy of IPCAs compared to TiO2 although it
does show than an IPCA can perform better than an unmodified AC.
The first studies of IPCAs appeared promising (Torimoto et al., 1996,
Torimoto et al., 1997, Yoneyama and Torimoto, 2000), however, they all lack
photolysis and dark adsorption controls. CO2 production is measured and it indicates
that something is being mineralised, however, due to a lack of adsorbent controls it is
impossible to determine if it is the substrate, AC and/ or functional groups on the AC.
The reaction volumes are also very small.

175
Overall there is some robust evidence of IPCA synergy (see Appendix A and
B) in the published literature, however, many of the examples of synergy in the
literature are questionable and may not represent IPCAs with any kind of synergetic
behaviour. While there are many reports on the increased effectiveness of IPCAs it is
not clear if IPCAs can perform better than AC and TiO2 separately due to a lack of
experimental controls in the studies reviewed. The majority of the reviewed studies
lack dark adsorption controls therefore it is not certain that the IPCAs remove more
substrate under illumination than in darkness. The mechanism by which the IPCA
degrades the substrate is also not explicitly explained in most of these adsorption
studies. It is generally agreed that the AC concentrates the substrate in the proximity
of TiO2. However it is not clear if the TiO2 is cleaning the AC by the substrate
diffusing towards the TiO2 from the ACs pores or whether the AC may be
concentrating the substrate on the AC surface increasing the substrate contact with
TiO2. In the second case there will be no observable impact on the substrate absorbed
in the AC pores. It is also necessary to demonstrate the effectiveness of IPCAs in
treating actual water and wastewater samples under typical operating conditions as
these conditions are more challenging than bench scale. With the exception of five
studies in the published literature, all studies have used a deionised water matrix
which is not representative of the solutions that are normally purified with AC.
The limitations of the peer reviewed literature mean that the synergistic
behaviour demonstrated by the 1:10 IPCAs for solifenacin degradation is one of the
most robust examples of IPCA photocatalytic degradation of an organic pollutant.
This is due to the presence of the necessary controls (dark, photolysis and
photocatalysis) and a pronounced difference in photodegradation performance
between the illuminated and non-illuminated IPCAs.
6.3 Molecules investigated for IPCA photodegradation
The contrast in adsorption and photodegradation performance between
famotidine and solifenacin is due to their different chemical structures. With only two
substrates it is not possible to draw any conclusions on what features of a chemical
structure influence the photodegradation performance of an IPCA. The chemical
structure and photocatalytic and adsorption properties of other analytes (indomethacin

176
and amoxicillin) studied in the Environtech group at DCU (of which this author is a
member) will also be considered to try and illuminate any reactivity trends. This
section will summarise the structure, adsorption and photocatalysis results of each
substrate.
The structure of famotidine is shown in Figure 6-6 and Figure 6-7. Famotidine
can be readily photodegraded by TiO2 but not by the IPCAs, this may be attributed to
strong adsorption of famotidine onto AC and negligible desorption.
Figure 6-6 Structure of famotidine.
Figure 6-7 3D structure of famotidine.
The structure of solifenacin is shown in Figure 6-8 and Figure 6-9. Unlike
famotidine, solifenacin can be readily photodegraded by both TiO2 and IPCAs.
Solifenacin adsorption onto AC was also found to be lower than famotidine; however
solifenacin desorption from AC is higher than famotidine (Section 4.6).

177
Figure 6-8 Structure of solifenacin.
Figure 6-9 3D structure of solifenacin.
The structure of amoxicillin is shown in Figure 6-10 and Figure 6-11. It is a
relatively bulky molecule and is readily photodegraded by both TiO2 and IPCAs
(Figure 6-12). Amoxicillin adsorption onto AC is at least four times higher than
famotidine and solifenacin, however, desorption from the AC has not been assessed to
date.

178
Figure 6-10 Structure of amoxicillin.
Figure 6-11 3D structure of amoxicillin.
0
0.1
0.2
0.3
0.4
0.5
0.6
0.7
0.8
0.9
1
0 50 100 150 200 250
Am
ox
icil
lia
n c
on
cen
tra
tio
n /
init
al
con
cen
tra
tio
n
Irradiation time (min)
AC with UV
Irradiation of Titanium dioxide
1.0% IPCA with UV
10% IPCA with UV
25% IPCA with UV
Figure 6-12 Photodegradation and removal of amoxicillin using AC, TiO2 and
IPCAs. Initial concentration 150 mg/L, catalyst concentration 1.5 g/L, 3 h dark
adsorption time not shown (Basha et al., 2011).

179
The structure of indomethacin is shown in Figure 6-13 and Figure 6-14. It is
readily photodegraded by TiO2 and IPCAs (Figure 6-15). Indomethacin adsorption
onto AC is higher (max adsorption loading of 100 mg/g) than famotidine and
solifenacin (max adsorption loadings of 80 mg/g and 60 mg/g respectively) but lower
than amoxicillin (max adsorption loadings of 450 mg/g). Desorption of indomethacin
from the AC has not been assessed.
Figure 6-13 Structure of indomethacin.
Figure 6-14 3D structure of indomethacin.

180
Figure 6-15 Dark adsorption of indomethacin, followed by visible-light
photocatalysis kinetic plots for various IPCAs. Initial concentration at t = 0, 0.25
mmol, catalyst concentration is 1.2 g/L. Data from Basha et al., (2010).
6.4 Reasons for success or failure of molecules to be
photodegraded by IPCAs
By considering the substrates studied in the Environtech Group at DCU an
attempt is made to find what factors influence IPCA photocatalysis. Some of the
chemical properties of the APIs investigated for IPCA photodegradation are shown in
Table 6-1. While all these substrates have different chemical structures a broad trend
can be inferred from their photodegradation with IPCAs. Some factors can be
discounted:
1. Adsorption capacity. Given that the adsorption of amoxicillin and indomethacin
are higher than famotidine it appears that high adsorption on its own is not the
cause of the lack of photodegradation of famotidine.

181
2. Molecular weight might not have a significant influence on photodegradation by
the IPCAs as solifenacin succinate is heavier than famotidine and photodegrades
effectively. In contrast, indomethacin and amoxicillin have a similar molar weight
to famotidine and are effectively photodegraded using IPCAs.
Table 6-1 Chemical properties of APIs in IPCA photodegradation studies.
Famotidine Solifenacin Indomethacin Amoxicillin
CLogP Driver: Mol
Refractivity
8.142 10.696 9.505 9.3926
CLogP Driver:
Partition Coefficient
-0.513 4.6796 4.1799 2.0318
ACD/LogP: -0.64 4.159 4.251 0.883
ACD/LogD (pH 5.5) -2.50 1.2 2.70 -1.64
ACD/LogD (pH 7.4) -1.27 2.53 0.98 -2.32
#H bond acceptors 9 4 5 8
#H bond donors 8 0 1 5
# freely rotating
bonds
7 3 4 6
# of Rule of 5
Violations
1 0 0 1
Molar weight 337.449 480.55 357.787 365.4
Molar Refractivity
cm3
79.06 105.823 94.594 91.475
Molar Volume cm3 183.554 290.574 269.565 236.218
Source: (ChemSpider 2012)
Famotidine has the lowest molar refractivity, molar volume, Log P and Log D
(pH 5.5) values and the highest number of H bond donors and acceptors of the three
APIs. In theory the polar nature of famotidine would decrease its adsorption on AC
due to repulsion from the nonpolar AC surface. However, as a result of the large
number of H bond sites, H bonding occurs between famotidine and the hydroxyl,
epoxide and carboxyl groups on the AC surface. Furthermore, the small size of
famotidine should minimise steric effects on the AC surface. The combination of

182
these two effects may explain the high adsorption capacity of the AC for famotidine
and hence the low desorption rate that consequently inhibits transfer of the famotidine
to the P25 surface for photodegradation.
Solifenacin, indomethacin and amoxicillin, in contrast to famotidine, have
larger molar refractivity, molar volume and Log P values and with exception of
amoxicillin have half the number of H bond acceptors and H bond donors (for H-bond
donors it is at least eight times lower). The less H bonds between the API and the AC
surface the lower the binding strength allowing for higher desorption from the surface
of the AC. Therefore, in the case of solifenacin and indomethacin reduced H-bond
interactions with the AC surface allows for higher desorption to solution followed by
migration to the P25 surface of the IPCA resulting in photodegradation, that was
observed experimentally.
Amoxicillin presents a challenge to this hypothesis as it has almost the same
number of H bond acceptor sites as famotidine (8 vs. 9 respectively) although it has
less donor sites (5 vs. 8 respectively). However, the difference in IPCA reactivity
between famotidine and amoxicillin may be accounted for by the larger molar volume
of amoxicillin, and its branched chain structure would likely cause unfavourable steric
interactions with the AC surface of the IPCA. This may lower amoxicillin binding to
the AC surface and could increase desorption into solution and thus migration of
amoxicillin to the surface of P25 on an IPCA.
The importance of adsorption affinity for the photodegradation of the substrate
using IPCA has been suggested in the literature (Yoneyama and Torimoto, 2000).
This phenomenon has not been extensively studied and presents an opportunity for
future work.
6.5 Future work to confirm mechanism
To confirm that photodegradation using IPCAs is promoted by low substrate
affinity to the AC surface caused by a combination of steric effects and low H
bonding it would be necessary to study other APIs with similar properties to
famotidine. There are two other APIs with a similar structure to famotidine:
cimetidine and ranitidine which are also H2 receptor antagonists. Their chemical

183
properties are listed (Table 6-2) and structures are shown in Figure 6-16 to Figure 6-
19.
Table 6-2 Chemical properties of APIs used in past and future IPCA
photodegradation studies.
Famotidine Solifenacin Cimetidine Ranitidine
ACD/LogP: -0.64 4.159 0.072 -0.068
ACD/LogD (pH 5.5) -2.50 1.2 -1.76 -2.73
ACD/LogD (pH 7.4) -1.27 2.53 -0.25 -1.07
#H bond acceptors 9 4 6 7
#H bond donors 8 0 3 2
# freely rotating
bonds
7 3 5 10
# of Rule of 5
Violations
1 0 0 0
Molar weight 337.449 480.55 252.34 314.4
Molar Refractivity
cm3
79.06 105.823 70.7 85.647
Molar Volume cm3 183.554 290.574 198.2 265.446
Source: (ChemSpider 2012, Lookchem 2012)
Figure 6-16 Structure of cimetidine.

184
Figure 6-17 3D structure of cimetidine.
Figure 6-18 Structure of ranitidine.
Figure 6-19 3D structure of ranitidine.
If cimetidine and ranitidine are not effectively degraded by IPCAs and have a
high adsorption affinity on the AC/IPCA surface (high adsorption capacity and low
desorption) then the rate of desorption from the AC surface is vital for photocatalysis.
Studies of desorption of amoxicillin and indomethacin from AC would also need to be
undertaken to confirm that high desorption rates inhibit API photodegradation.

185
6.6 Conclusion
The majority of the peer reviewed literature of IPCA photodegradation lacks
the necessary controls to confirm IPCA photodegradation. Solifenacin, amoxicillin
and indomethacin are effectively degraded by IPCAs while famotidine is not. This
difference in photodegradation performance of the IPCA for different APIs is due to
steric effects and less H bonding reducing the adsorption affinity of solifenacin,
amoxicillin and indomethacin compared to famotidine. The lower adsorption affinity
increases desorption and thus migration to the TiO2 surface allowing
photodegradation. IPCA photodegradation studies of cimetidine and ranitidine which
have similar chemical structures to famotidine would confirm the proposed
mechanism.

186
Chapter 7 Conclusions and
Recommendations

187
7.1 Conclusions
Arising from shortcomings of existing research, this work investigated and
evaluated the following aims:
1. The capacity of IPCAs, commercial AC and TiO2 to adsorb and photodegrade
pharmaceuticals.
2. The synergy between AC and TiO2 for the removal of pollutants.
The major findings of this work are:
1. The adsorption capacity of AC, IPCA and TiO2 for solifenacin and famotidine has
been determined. Aqua 2k has a high adsorption capacity for famotidine and a
lower capacity for solifenacin. This adsorption capacity is not noticeably reduced
by the addition of TiO2 particles to the AC surface to create an IPCA. Baseline
photodegradation data for famotidine and solifenacin photolysis and
photocatalysis has been gathered. Famotidine is moderately photodegraded by
photolysis while there is no photolysis of solifenacin under the same illumination
conditions. Famotidine and solifenacin are both degraded by P25 TiO2; although
the photodegradation rate of famotidine is higher.
2. There was no synergy demonstrated between TiO2 and AC in the
photodegradation of famotidine. In contrast solifenacin photodegradation using
IPCAs demonstrated more photodegradation than either TiO2 or AC. The synergy
demonstrated in this work by IPCAs for solifenacin degradation is more robust
than the vast majority of published literature on IPCA photodegradation.

188
7.2 Recommendations for future work
IPCA adsorption and photodegradation studies of cimetidine and ranitidine -
which are similar in chemical structure to famotidine - should be undertaken. If
IPCAs have a high adsorption capacity and they have no synergy for
photodegradation of cimetidine and ranitidine then it would confirm that high
adsorption strength inhibits synergistic IPCA photodegradation.
Studies of APIs that can be photodegraded by IPCAs (solifenacin, amoxicillin and
indomethacin) should be undertaken using sunlight as the illumination source.
The ability of IPCAs to degrade APIs such as solifenacin, amoxicillin and
indomethacin should be investigated in real world conditions i.e. in water matrixes
that contain natural organic materials and concentration ranges of APIs typically
found in wastewater.
Future studies of API photodegradation using IPCAs should measure desorption
as it gives insights into the rate of substrate transfer and influences
photodegradation. Desorption of amoxicillin and indomethacin from IPCAs
should also be investigated.
Optimising experimental conditions based on optical modelling of reactor system
and materials.

189
References
Abuzaid, N.S. and Nakhla, G. 1997. Predictability of the homogeneous surface diffusion model for
activated carbon adsorption kinetics; formulation of a new mathematical model. Journal of
Environmental Science and Health .Part A: Environmental Science and Engineering and Toxicology,
32(7), pp.1945-1961.
Aksu, Z. and Yener, J. 2001. A comparative adsorption/biosorption study of mono-chlorinated phenols
onto various sorbents. Waste Management, 21(8), pp.695-702.
Al-Kdasi, A., Idris, A., Saed, K. and Teong Guan, C. 2004. Treatment of Textile Wastewater by
Advanced Oxidation Processes A review. Global Nest Journal, 6(3), pp.222-230.
Anpo, M. 2000. Utilization of TiO2 photocatalysts in green chemistry. Pure and Applied Chemistry,
72(7), pp.1265-1270.
Ao, Y., Xu, J., Fu, D. and Yuan, C. 2009. Photocatalytic degradation of X-3B by titania-coated
magnetic activated carbon under UV and visible irradiation. Journal of Alloys and Compounds, 471(1-
2), pp.33-38.
Ao, Y., Xu, J., Fu, D., Shen, X. and Yuan, C. 2008a. Low temperature preparation of anatase TiO2-
coated activated carbon. Colloids and Surfaces A: Physicochemical and Engineering Aspects, 312(2-3),
pp.125-130.
Ao, Y., Xu, J., Fu, D., Shen, X. and Yuan, C. 2008b. Low temperature preparation of anatase TiO2-
activated carbon composite film. Applied Surface Science, 254(13), pp.4001-4006.
Ao, Y., Xu, J., Fu, D., Shen, X. and Yuan, C. 2008c. A novel magnetically separable composite
photocatalyst: Titania-coated magnetic activated carbon. Separation and Purification Technology,
61(3), pp.436-441.
Ao, Y., Xu, J., Fu, D. and Yuan, C. 2008d. A simple route for the preparation of anatase titania-coated
magnetic porous carbons with enhanced photocatalytic activity. Carbon, 46(4), pp.596-603.
Araña, J., Doña-Rodríguez, J.M., Tello Rendón, E., Garriga i Cabo, C., González-Díaz, O., Herrera-
Melián, J.A., Pérez-Peña, J., Colón, G. and Navío, J.A. 2003a. TiO2 activation by using activated
carbon as a support: Part I. Surface characterisation and decantability study. Applied Catalysis B:
Environmental, 44(2), pp.161-172.
Araña, J., Doña-Rodríguez, J.M., Tello Rendón, E., Garriga i Cabo, C., González-Díaz, O., Herrera-
Melián, J.A., Pérez-Peña, J., Colón, G. and Navío, J.A. 2003b. TiO2 activation by using activated
carbon as a support: Part II. Photoreactivity and FTIR study. Applied Catalysis B: Environmental,
44(2), pp.153-160.
Ardee Environment 22 June 2010. Low Pressure Lamps [Online]. Available from:
http://www.ardeeenvironment.info/low_pressure.html [Accessed 05/26 2012].
Ardee Environment 22 June 2010. Medium Pressure [Online]. Available from:
http://www.ardeeenvironment.info/medium_pressure.html [Accessed 05/26 2012].
Areerachakul, N., Vigneswaran, S., Ngo, H. and Kandasamy, J. 2008. A continuous photocatalysis
system in the degradation of herbicide. JF: Korean Journal of Chemical Engineering, 25(4), pp.663-
669.

190
Arivolia, S., Thenkuzhalib, M. and Martin Deva Prasath, P. 2009. Adsorption of rhodamine B by acid
activated carbon-Kinetic, thermodynamic and equilibrium studies Orbital 1(2), pp. 25/04/12-138-155.
Available from: http://www.orbital.ufms.br/index.php/Chemistry/article/view/24
Aruldoss, U., Kennedy, L.J., Judith Vijaya, J. and Sekaran, G. 2011. Photocatalytic degradation of
phenolic syntan using TiO2 impregnated activated carbon. Journal of Colloid and Interface Science,
355(1), pp.204-209.
Asiltürk, M. and Şener, Ş. 2012. TiO2-activated carbon photocatalysts: Preparation, characterization
and photocatalytic activities. Chemical Engineering Journal, 180(0), pp.354-363.
Augugliaro, V., Litter, M., Palmisano, L. and Soria, J. 2006. The combination of heterogeneous
photocatalysis with chemical and physical operations: A tool for improving the photoprocess
performance. Journal of Photochemistry and Photobiology C: Photochemistry Reviews, 7(4), pp.127-
144.
Balázs, N., Mogyorósi, K., Srankó, D.F., Pallagi, A., Alapi, T., Oszkó, A., Dombi, A. and Sipos, P.
2008. The effect of particle shape on the activity of nanocrystalline TiO2 photocatalysts in phenol
decomposition. Applied Catalysis B: Environmental, 84(3-4), pp.356-362.
Bansal, R.C. and Goyal, M. 2005. Activated Carbon Adsorption. Boca Raton, Florida: CRC Press.
Basha, S., Colin, B., Keane, D., Nolan, K., Morrissey, A., Oelgemöller, M. and Tobin, J.M. 2011. On
the adsorption/photodegradation of amoxicillin in aqueous solutions by an integrated photocatalytic
adsorbent (IPCA): experimental studies and kinetics analysis. Photochemical & Photobiological
Sciences, 10(6), pp.1014-1022.
Basha, S., Keane, D., Morrissey, A., Nolan, K., Oelgemöller, M. and Tobin, J. 2010. Studies on the
Adsorption and Kinetics of Photodegradation of Pharmaceutical Compound, Indomethacin Using
Novel Photocatalytic Adsorbents (IPCAs). Industrial & Engineering Chemistry Research, 49(22),
pp.11302-11309.
Baup, S., Jaffre, C., Wolbert, D. and Laplanche, A. 2000. Adsorption of Pesticides onto Granular
Activated Carbon: Determination of Surface Diffusivities Using Simple Batch Experiments.
Adsorption, 6pp.219-228.
Begum, N. and Farveez Ahmed, H. 2008. Synthesis of nanocrystalline TiO2 thin films by liquid phase
deposition technique and its application for photocatalytic degradation studies. Bulletin of Materials
Science, 31(1), pp.43-48.
Benabbou, A.K., Derriche, Z., Felix, C., Lejeune, P. and Guillard, C. 2007. Photocatalytic inactivation
of Escherischia coli: Effect of concentration of TiO2 and microorganism, nature, and intensity of UV
irradiation. Applied Catalysis B: Environmental, 76(3-4), pp.257-263.
Blanco, J., Malato, S., Fernández-Ibañez, P., Alarcón, D., Gernjak, W. and Maldonado, M.I. 2009.
Review of feasible solar energy applications to water processes. Renewable and Sustainable Energy
Reviews, 13(6-7), pp.1437-1445.
Boorman, G.A., Dellarco, V., Dunnick, J.K., Chapin, R.E., Hunter, S., Hauchman, F., Gardner, H.,
Cox, M. and Sills, R.C. 1999. Drinking Water Disinfection Byproducts: Review and Approach to
Toxicity Evaluation. Environmental Health Perspectives, 107(1), pp.207-217.
Byrne, J.A., Eggins, B.R., Brown, N.M.D., McKinney, B. and Rouse, M. 1998. Immobilisation of TiO2
powder for the treatment of polluted water. Applied Catalysis B: Environmental, 17(1-2), pp.25-36.
191
Cao, X., Oda, Y. and Shiraishi, F. 2010. Photocatalytic and adsorptive treatment of 2,4-dinitrophenol
using a TiO2 film covering activated carbon surface. Chemical Engineering Journal, 156(1), pp.98-
105.
Cao, X. and Shiraishi, F. 2010. A mechanism of photocatalytic and adsorptive treatment of 2,4-
dinitrophenol on a porous thin film of TiO2 covering granular activated carbon particles. Chemical
Engineering Journal, 160(2), pp.651-659.
Castiglioni, S., Bagnati, R., Fanelli, R., Pomati, F., Calamari, D. and Zuccato, E. 2006. Removal of
Pharmaceuticals in Sewage Treatment Plants in Italy. Environmental Science & Technology, 40(1),
pp.357-363.
ChemSpider, 26-7-20212. What is ChemSpider?[Online]. Available from:
http://www.chemspider.com/About.aspx [Accessed 7/26 2012].
Choi, H., Stathatos, E. and Dionysiou, D.D. 2007. Photocatalytic TiO2 films and membranes for the
development of efficient wastewater treatment and reuse systems. Desalination, 202(1-3), pp.199-206.
Choy, K.K.H., Porter, J.F. and Mckay, G. 2004. Intraparticle diffusion in single and multicomponent
acid dye adsorption from wastewater onto carbon. Chemical Engineering Journal, 103(1–3), pp.133-
145.
Clara, M., Strenn, B., Gans, O., Martinez, E., Kreuzinger, N. and Kroiss, H. 2005. Removal of selected
pharmaceuticals, fragrances and endocrine disrupting compounds in a membrane bioreactor and
conventional wastewater treatment plants. Water Research, 39(19), pp.4797-4807.
Cojocaru, B., Neatu, s., Pârvulescu, V.I., Somoghi, V., Petrea, N., Epure, G., Alvaro, M. and Garcia, H.
2009. Synergism of Activated Carbon and Undoped and Nitrogen-doped TiO2 in the Photocatalytic
Degradation of the Chemical Warfare Agents Soman, VX, and Yperite. ChemSusChem, 2(5), pp.427-
436.
Comninellis, C., Kapalka, A., Malato, S., Parsons, S.A., Poulios, I. and Mantzavinos, D. 2008.
Advanced oxidation processes for water treatment: advances and trends for R&D. Journal of Chemical
Technology & Biotechnology, 83(6), pp.769-776.
Cordero, T., Chovelon, J., Duchamp, C., Ferronato, C. and Matos, J. 2007a. Surface nano-aggregation
and photocatalytic activity of TiO2 on H-type activated carbons. Applied Catalysis B: Environmental,
73(3-4), pp.227-235.
Cordero, T., Duchamp, C., Chovelon, J., Ferronato, C. and Matos, J. 2007b. Influence of L-type
activated carbons on photocatalytic activity of TiO2 in 4-chlorophenol photodegradation. Journal of
Photochemistry and Photobiology A: Chemistry, 191(2-3), pp.122-131.
Coyle, E.E. and Oelgemöller, M. 2008. Micro-photochemistry: photochemistry in microstructured
reactors. The new photochemistry of the future? Photochemical and Photobiological Sciences, 7(11),
pp.1313-1322.
Cunningham, N., Dodelet, J.P., Guay, D., Ross, G.G., Hlil, A.R. and Hay, A.S. 2004. RBS and XRD
analyses of carbon-coated stainless steel plates. Surface and Coatings Technology, 183(2-3), pp.216-
223.
da Silva, C.G. and Faria, J.L. 2003. Photochemical and photocatalytic degradation of an azo dye in
aqueous solution by UV irradiation. Journal of Photochemistry and Photobiology A: Chemistry, 155(1-
3), pp.133-143.

192
Dai, M. 1994. The Effect of Zeta Potential of Activated Carbon on the Adsorption of Dyes from
Aqueous Solution: I. The Adsorption of Cationic Dyes: Methyl Green and Methyl Violet. Journal of
Colloid and Interface Science, 164(1), pp.223-228.
Deegan, A. 2011. Pharmaceuticals in industrial wastewater and their removal using photo-Fentons
oxidation. Ph.D. Research Thesis. Dublin City University.
Deegan, A., Shaik, B., Nolan, K., Urell, K., Oelgemöller, M., Tobin, J. and Morrissey, A. 2011.
Treatment options for wastewater effluents from pharmaceutical companies. Internation Journal of
Environmental Science and Technology, 8(3), pp.649-666.
Devipriya, S. and Yesodharan, S. 2005. Photocatalytic degradation of pesticide contaminants in water.
Solar Energy Materials and Solar Cells, 86(3), pp.309-348.
, E., Ordóñez, S., Vega, A. and Coca, J. 2005. Comparison of adsorption properties of a
chemically activated and a steam-activated carbon, using inverse gas chromatography. Microporous
and Mesoporous Materials, 82(1-2), pp.173-181.
Ding, Z., Zhu, H.Y., Greenfield, P.F. and Lu, G.Q. 2001a. Characterization of Pore Structure and
Coordination of Titanium in TiO2 and SiO2–TiO2 Sol-Pillared Clay. Journal of Colloid and Interface
Science, 238(2), pp.267-272.
Ding, Z., Hu, X., Yue, P.L., Lu, G.Q. and Greenfield, P.F. 2001b. Synthesis of anatase TiO2 supported
on porous solids by chemical vapor deposition. Catalysis Today, 68(1-3), pp.173-182.
Ding, Z., Hu, X., Lu, G.Q., Yue, P. and Greenfield, P.F. 2000. Novel Silica Gel Supported TiO2
Photocatalyst Synthesized by CVD Method. Langmuir, 16(15), pp.6216-6222.
Djaoued, Y., Brüning, R., Bersani, D., Lottici, P.P. and Badilescu, S. 2004. Sol–gel nanocrystalline
brookite-rich titania films. Materials Letters, 58(21), pp.2618-2622.
Eggert, F. The Self Absorption Rough Surfaces / Soft X-Rays [Online]. Available from:
http://microanalyst.mikroanalytik.de/info4.phtml [Accessed 18/10 2011].
Eggins, B.R., Palmer, F.L. and Byrne, J.A. 1997. Photocatalytic treatment of humic substances in
drinking water. Water Research, 31(5), pp.1223-1226.
El-Sheikh, A.H., Al-Degs, Y.S., Newman, A.P. and Lynch, D.E. 2007. Oxidized activated carbon as
support for titanium dioxide in UV-assisted degradation of 3-chlorophenol. Separation and
Purification Technology, 54(1), pp.117-123.
El-Sheikh, A.H., Newman, A.P., Al-Daffaee, H., Phull, S., Cresswell, N. and York, S. 2004.
Deposition of anatase on the surface of activated carbon. Surface and Coatings Technology, 187(2-3),
pp.284-292.
Enick, O.V. and Moore, M.M. 2007. Assessing the assessments: Pharmaceuticals in the environment.
Environmental Impact Assessment Review, 27(8), pp.707-729.
Ferenczy, G.G., Párkányi, L., Ángyán, J.G., Kálmán, A. and Hegedus, B. 2000. Crystal and electronic
structure of two polymorphic modifications of famotidine. An experimental and theoretical study.
Journal of Molecular Structure: THEOCHEM, 503(1-2), pp.73-79.
Fitzer, E., Kochling, K.H., Boehm, H.P. and Marsh, H. 1995. Recommended Terminology For the
description of carbon as a solid. Pure and Applied Chemistry, 67(3), pp.473-506.
Foo, K.Y. and Hameed, B.H. 2010a. Decontamination of textile wastewater via TiO2/activated carbon
composite materials. Advances in Colloid and Interface Science, 159(2), pp.130-143.

193
Foo, K.Y. and Hameed, B.H. 2010b. Insights into the modeling of adsorption isotherm systems.
Chemical Engineering Journal, 156(1), pp.2-10.
Franz, M., Arafat, H.A. and Pinto, N.G. 2000. Effect of chemical surface heterogeneity on the
adsorption mechanism of dissolved aromatics on activated carbon. Carbon, 38(13), pp.1807-1819.
Freundlich, H. 1907. Uber die adsorption in Losungen. Z. Phys. Chem., 57pp.385-470.
Fu, P., Luan, Y. and Dai, X. 2004a. Preparation of activated carbon fibers supported TiO2 photocatalyst
and evaluation of its photocatalytic reactivity. Journal of Molecular Catalysis A: Chemical, 221(1-2),
pp.81-88.
Fu, P., Luan, Y. and Dai, X. 2004b. Preparation of TiO2 photocatalyst anchored on activated carbon
fibers and its photodegradation of methylene blue. China Particuology, 2(2), pp.76-80.
Fu, P., Luan, Y. and Dai, X. 2006. Interposition fixing structure of TiO2 film deposited on activated
carbon fibers. Transactions of Nonferrous Metals Society of China, 16(4), pp.965-969.
Fuerhacker, M., Dürauer, A. and Jungbauer, A. 2001. Adsorption isotherms of 17β-estradiol on
granular activated carbon (GAC). Chemosphere, 44(7), pp.1573-1579.
Fujishima, A. and Zhang, X. 2006. Titanium dioxide photocatalysis: present situation and future
approaches. Comptes Rendus Chimie, 9(5-6), pp.750-760.
Fujishima, A., Rao, T.N. and Tryk, D.A. 2000. Titanium dioxide photocatalysis. Journal of
Photochemistry and Photobiology C: Photochemistry Reviews, 1(1), pp.1-21.
Fytianos, K., Voudrias, E. and Kokkalis, E. 2000. Sorption–desorption behaviour of 2,4-dichlorophenol
by marine sediments. Chemosphere, 40(1), pp.3-6.
Gao, B., Yap, P.S., Lim, T.M. and Lim, T. 2011. Adsorption-photocatalytic degradation of Acid Red
88 by supported TiO2: Effect of activated carbon support and aqueous anions. Chemical Engineering
Journal, 171(3), pp.1098-1107.
Gao, Y., Liu, H. and Ma, M. 2007. Preparation and photocatalytic behavior of TiO2-carbon nanotube
hybrid catalyst for acridine dye decomposition. Reaction Kinetics and Catalysis Letters, 90(1), pp.11-
18.
Gernjak, W., Maldonado, M.I., Malato, S., Cáceres, J., Krutzler, T., Glaser, A. and Bauer, R. 2004.
Pilot-plant treatment of olive mill wastewater (OMW) by solar TiO2 photocatalysis and solar photo-
Fenton. Solar Energy, 77(5), pp.567-572.
Gibs, J., Stackelberg, P.E., Furlong, E.T., Meyer, M., Zaugg, S.D. and Lippincott, R.L. 2007.
Persistence of pharmaceuticals and other organic compounds in chlorinated drinking water as a
function of time. Science of the Total Environment, 373(1), pp.240-249.
Gimeno, O., Plucinski, P., Kolaczkowski, S.T., Rivas, F.J. and Alvarez, P.M. 2003. Removal of the
Herbicide MCPA by Commercial Activated Carbons: Equilibrium, Kinetics, and Reversibility.
Industrial & Engineering Chemistry Research, 42(5), pp.1076-1086.
Gogate, P.R. and Pandit, A.B. 2004. A review of imperative technologies for wastewater treatment I:
oxidation technologies at ambient conditions. Advances in Environmental Research, 8(3-4), pp.501-
551.
Grover, D.P., Zhou, J.L., Frickers, P.E. and Readman, J.W. 2011. Improved removal of estrogenic and
pharmaceutical compounds in sewage effluent by full scale granular activated carbon: Impact on
receiving river water. Journal of Hazardous Materials, 185(2–3), pp.1005-1011.

194
Guillard, C., Debayle, D., Gagnaire, A., Jaffrezic, H. and Herrmann, J. 2004. Physical properties and
photocatalytic efficiencies of TiO2 films prepared by PECVD and sol–gel methods. Materials Research
Bulletin, 39(10), pp.1445-1458.
Gültekin, I. and Ince, N.H. 2007. Synthetic endocrine disruptors in the environment and water
remediation by advanced oxidation processes. Journal of Environmental Management, 85(4), pp.816-
832.
Hall, K.R., Eagleton, L.C., Acrivos, A. and Vermeulen, T. 1966. Pore- and Solid-Diffusion Kinetics in
Fixed-Bed Adsorption under Constant-Pattern Conditions. Industrial & Engineering Chemistry
Fundamentals, 5(2), pp.212-223.
Hameed, B.H. 2009. Spent tea leaves: A new non-conventional and low-cost adsorbent for removal of
basic dye from aqueous solutions. Journal of Hazardous Materials, 161(2-3), pp.753-759.
Hameed, B.H., Salman, J.M. and Ahmad, A.L. 2009. Adsorption isotherm and kinetic modeling of 2,4-
D pesticide on activated carbon derived from date stones. Journal of Hazardous Materials, 163(1),
pp.121-126.
Hamidin, N., Yu, Q.J. and Connell, D.W. 2008. Human health risk assessment of chlorinated
disinfection by-products in drinking water using a probabilistic approach. Water Research, 42(13),
pp.3263-3274.
Haque, F., Vaisman, E., Langford, C.H. and Kantzas, A. 2005. Preparation and performance of
integrated photocatalyst adsorbent (IPCA) employed to degrade model organic compounds in synthetic
wastewater. Journal of Photochemistry and Photobiology A: Chemistry, 169(1), pp.21-27.
Hassan, M.A., Salem, M.S., Sueliman, M.S. and Najib, N.M. 1997. Characterization of famotidine
polymorphic forms. International Journal of Pharmaceutics, 149(2), pp.227-232.
He, Z., Yang, S., Ju, Y. and Sun, C. 2009. Microwave photocatalytic degradation of Rhodamine B
using TiO2 supported on activated carbon: Mechanism implication. Journal of Environmental Sciences,
21(2), pp.268-272.
Heberer, T. 2002. Occurrence, fate, and removal of pharmaceutical residues in the aquatic
environment: a review of recent research data. Toxicology Letters, 131(1-2), pp.5-17.
Hegedüs, B., Bod, P., Harsányi, K., Péter, I., Kalman, A. and Parkanyi, L. 1989. Comparison of the
polymorphic modifications of famotidine. Journal of Pharmaceutical and Biomedical Analysis, 7(5),
pp.563-569.
Helmig, E.G., Fettig, J.D., Cordone, L., Schoenberg, T.H., DeMarco, M.J. and Suri, R., P.S. 2005. API
Removal from Pharmaceutical Manufacturing Wastewater – Results of Process Development, Pilot-
Testing, and Scale-Up. IN: Proceedings of the Water Environment Federation, WEFTEC 2005. Water
Environment Federation.
Hoffmann, M.R., Martin, S.T., Choi, W. and Bahnemann, D.W. 1995. Environmental Applications of
Semiconductor Photocatalysis. Chemical Reviews, 95(1), pp.69-96.
Hossain, G.S.M. and McLaughlan, R.G. 2011. Sorption of chlorophenols from aqueous solution by
granular activated carbon, filter coal, pine and hardwood. Environmental Technology, pp.1-8.
Hou, D., Feng, L., Zhang, J., Dong, S., Zhou, D. and Lim, T. 2012. Preparation, characterization and
performance of a novel visible light responsive spherical activated carbon-supported and Er3+
:YFeO3-
doped TiO2 photocatalyst. Journal of Hazardous Materials, 199–200(0), pp.301-308.

195
Hou, Y., Qu, J., Zhao, X., Lei, P., Wan, D. and Huang, C.P. 2009. Electro-photocatalytic degradation
of acid orange II using a novel TiO2/ACF photoanode. Science of the Total Environment, 407(7),
pp.2431-2439.
Hrudey, S.E. 2009. Chlorination disinfection by-products, public health risk tradeoffs and me. Water
Research, 43(8), pp.2057-2092.
Hu, L., Flanders, P.M., Miller, P.L. and Strathmann, T.J. 2007. Oxidation of sulfamethoxazole and
related antimicrobial agents by TiO2 photocatalysis. Water Research, 41(12), pp.2612-2626.
Huang, D., Miyamoto, Y., Ding, J., Gu, J., Zhu, S., Liu, Q., Fan, T., Guo, Q. and Zhang, D. 2011a. A
new method to prepare high-surface-area N–TiO2/activated carbon. Materials Letters, 65(2), pp.326-
328.
Huang, D., Miyamoto, Y., Matsumoto, T., Tojo, T., Fan, T., Ding, J., Guo, Q. and Zhang, D. 2011b.
Preparation and characterization of high-surface-area TiO2/activated carbon by low-temperature
impregnation. Separation and Purification Technology, 78(1), pp.9-15.
Huang, M., Xu, C., Wu, Z., Huang, Y., Lin, J. and Wu, J. 2008. Photocatalytic discolorization of
methyl orange solution by Pt modified TiO2 loaded on natural zeolite. Dyes and Pigments, 77(2),
pp.327-334.
Huerta-Fontela, M., Galceran, M.T. and Ventura, F. 2011. Occurrence and removal of pharmaceuticals
and hormones through drinking water treatment. Water Research, 45(3), pp.1432-1442.
Hurum, D.C., Agrios, A.G., Gray, K.A., Rajh, T. and Thurnauer, M.C. 2003. Explaining the Enhanced
Photocatalytic Activity of Degussa P25 Mixed-Phase TiO2 Using EPR. The Journal of Physical
Chemistry B, 107(19), pp.4545-4549.
Inagaki, M., Nonaka, M., Kojin, F., Tsumura, T. and Toyoda, M. 2006. Cyclic Performance of Carbon-
Coated TiO2 for Photocatalytic Activity of Methylene Blue Decomposition . Environmental
Technology, 27(5), pp.521-528.
Jankowska, H., Swiatkowski, A. and Choma, J. 1991. Active Carbon. Market Cross House, Cooper
Street, Chichester, West Sussex, PO19 1EB, England: Ellis Horwood Limited.
Janus, M., Inagaki, M., Tryba, B., Toyoda, M. and Morawski, A.W. 2006. Carbon-modified TiO2
photocatalyst by ethanol carbonisation. Applied Catalysis B: Environmental, 63(3-4), pp.272-276.
Jia, B., Duan, L., Ma, C. and Wang, C. 2007. Characterization of TiO2 Loaded on Activated Carbon
Fibers and Its Photocatalytic Reactivity. Chinese Journal of Chemistry, 25(4), pp.553-557.
Jin, Y., Wu, M., Zhao, G. and Li, M. 2011. Photocatalysis-enhanced electrosorption process for
degradation of high-concentration dye wastewater on TiO2/carbon aerogel. Chemical Engineering
Journal, 168(3), pp.1248-1255.
Jo, W.K., Shin, S.H. and Hwang, E.S. 2011. Removal of dimethyl sulfide utilizing activated carbon
fiber-supported photocatalyst in continuous-flow system. Journal of Hazardous Materials, 191(1–3),
pp.234-239.
Jo, W. and Yang, C. 2009. Granular-activated carbon adsorption followed by annular-type
photocatalytic system for control of indoor aromatic compounds. Separation and Purification
Technology, 66(3), pp.438-442.
Joakim Larsson, D.G. and Fick, J. 2009. Transparency throughout the production chain—a way to
reduce pollution from the manufacturing of pharmaceuticals? Regulatory Toxicology and
Pharmacology, 53(3), pp.161-163.

196
Kabir, M.F., Vaisman, E., Langford, C.H. and Kantzas, A. 2006. Effects of hydrogen peroxide in a
fluidized bed photocatalytic reactor for wastewater purification. Chemical Engineering Journal,
118(3), pp.207-212.
Kakinoki, K., Yamane, K., Teraoka, R., Otsuka, M. and Matsuda, Y. 2004. Effect of relative humidity
on the photocatalytic activity of Titanium dioxide and photostability of famotidine. Journal of
Pharmaceutical Sciences, 93(3), pp.582-589.
Karimi-jashni, A. and Narbaitz, R.M. 1997. Impact of pH on the adsorption and desorption kinetics of
2-nitrophenol on activated carbons. Water Research, 31(12), pp.3039-3044.
Karpova, T., Preis, S., Kallas, J. and Torres, A. 2007. Selective photocatalytic oxidation of steroid
estrogens in presence of saccharose and ethanol as co-pollutants. Environmental Chemistry Letters,
5(4), pp.219-224.
Kasprzyk-Hordern, B., Dinsdale, R.M. and Guwy, A.J. 2009. Illicit drugs and pharmaceuticals in the
environment – Forensic applications of environmental data. Part 1: Estimation of the usage of drugs in
local communities. Environmental Pollution, 157(6), pp.1773-1777.
Kavitha, V. and Palanivelu, K. 2004. The role of ferrous ion in Fenton and photo-Fenton processes for
the degradation of phenol. Chemosphere, 55(9), pp.1235-1243.
Keane, D., Basha, S., Nolan, K., Morrissey, A., Oelgemöller, M. and Tobin, J. 2010. Photodegradation
of Famotidine by Integrated Photocatalytic Adsorbent (IPCA) and Kinetic Study. Catalysis Letters,
144(2), pp.300-308.
Khan, A.Y. 2002. Titanium Dioxide Coated Activated Carbon: A Regenerative Technology For Water
Recovery. Master Of Engineering. Univ Of Florida.
Khetan, S.K. and Collins, T.J. 2007. Human Pharmaceuticals in the Aquatic Environment: A Challenge
to Green Chemistry. Chemical Reviews, 107(6), pp.2319-2364.
Kim, C.H., Kim, B. and Yang, K.S. 2011. Visible light-induced photocatalytic activity of Ag-
containing TiO2/carbon nanofibers composites. Synthetic Metals, 161(11-12), pp.1068-1072.
Kim, S., Ngo, H.H., Shon, H.K. and Vigneswaran, S. 2008. Adsorption and photocatalysis kinetics of
herbicide onto titanium oxide and powdered activated carbon. Separation and Purification Technology,
58(3), pp.335-342.
Kim, T.Y., Lee, Y., Park, K., Kim, S.J. and Cho, S.Y. 2005. A study of photocatalysis of TiO2 coated
onto chitosan beads and activated carbon. Research on Chemical Intermediates, 31(4), pp.343-358.
Klamerth, N., Miranda, N., Malato, S., Agüera, A., Fernández-Alba, A.R., Maldonado, M.I. and
Coronado, J.M. 2009. Degradation of emerging contaminants at low concentrations in MWTPs
effluents with mild solar photo-Fenton and TiO2. Catalysis Today, 144(1-2), pp.124-130.
Kostedt, W.L., Drwiega, J., Mazyck, D.W., Lee, S., Sigmund, W., Wu, C. and Chadik, P. 2005.
Magnetically Agitated Photocatalytic Reactor for Photocatalytic Oxidation of Aqueous Phase Organic
Pollutants. Environmental Science & Technology, 39(20), pp.8052-8056.
Kubo, M., Fukuda, H., Chua, X.J. and Yonemoto, T. 2007. Kinetics of Ultrasonic Degradation of
Phenol in the Presence of Composite Particles of Titanium Dioxide and Activated Carbon. Industrial &
Engineering Chemistry Research, 46(3), pp.699-704.
Kubo, M., Matsuoka, K., Takahashi, A., Shibasaki-Kitakawa, N. and Yonemoto, T. 2005. Kinetics of
ultrasonic degradation of phenol in the presence of TiO2 particles. Ultrasonics Sonochemistry, 12(4),
pp.263-269.

197
Kumar, A., Kumar, S. and Kumar, S. 2003. Adsorption of resorcinol and catechol on granular activated
carbon: Equilibrium and kinetics. Carbon, 41(15), pp.3015-3025.
Kumar, K.V., Porkodi, K. and Rocha, F. 2008. Comparison of various error functions in predicting the
optimum isotherm by linear and non-linear regression analysis for the sorption of basic red 9 by
activated carbon. Journal of Hazardous Materials, 150(1), pp.158-165.
Kumar, P.M., Badrinarayanan, S. and Sastry, M. 2000. Nanocrystalline TiO2 studied by optical, FTIR
and X-ray photoelectron spectroscopy: correlation to presence of surface states. Thin Solid Films,
358(1-2), pp.122-130.
Kun, R., Mogyorósi, K. and Dékány, I. 2006. Synthesis and structural and photocatalytic properties of
TiO2/montmorillonite nanocomposites. Applied Clay Science, 32(1-2), pp.99-110.
Kundu, S. and Gupta, A.K. 2006. Arsenic adsorption onto iron oxide-coated cement (IOCC):
Regression analysis of equilibrium data with several isotherm models and their optimization. Chemical
Engineering Journal, 122(1-2), pp.93-106.
Lacey, C., McMahon, G., Bones, J., Barron, L., Morrissey, A. and Tobin, J.M. 2008. An LC–MS
method for the determination of pharmaceutical compounds in wastewater treatment plant influent and
effluent samples. Talanta, 75(4), pp.1089-1097.
Langmuir, I. 1916. The Constitution and Fundamental Properties of Solids and Liquids. Part I. Solids.
Journal of the American Chemical Society, 38(11), pp.2221-2295.
Lataye, D.H., Mishra, I.M. and Mall, I.D. 2008. Adsorption of 2-picoline onto bagasse fly ash from
aqueous solution. Chemical Engineering Journal, 138(1-3), pp.35-46.
Leary, R. and Westwood, A. 2011. Carbonaceous nanomaterials for the enhancement of TiO2
photocatalysis. Carbon, 49(3), pp.741-772.
Lee, S. 2004. Photocatalytic Nanocomposites Based On TiO2 And Carbon Nanotubes. PhD. University
of Florida.
Lee, D., Kim, S., Cho, I., Kim, S. and Kim, S. 2004a. Photocatalytic oxidation of microcystin-LR in a
fluidized bed reactor having TiO2-coated activated carbon. Separation and Purification Technology,
34(1-3), pp.59-66.
Lee, D., Kim, S., Kim, S., Chung, I. and Kim, S. 2004b. Photocatalytic oxidation of microcystin-LR
with TiO2-coated activated carbon. Chemical Engineering Journal, 102(1), pp.93-98.
Lee, K.W., Kayser, S.R., Hongo, R.H., Tseng, Z.H. and Scheinman, M.M. 2004c. Famotidine and long
QT syndrome. The American Journal of Cardiology, 93(10), pp.1325-1327.
Lee, Y., Chang, K., Hu, C. and Lin, K. 2010. Synthesis of activated carbon-surrounded and carbon-
doped anatase TiO2 nanocomposites. Journal of Materials Chemistry, 20(27), pp.5682-5688.
Lever,John. 2010. E-mail correspondance from Jacobi Carbons. Personal Communication.
Li Puma, G., Bono, A., Krishnaiah, D. and Collin, J.G. 2008. Preparation of titanium dioxide
photocatalyst loaded onto activated carbon support using chemical vapor deposition: A review paper.
Journal of Hazardous Materials, 157(2-3), pp.209-219.
Li, F., Yuasa, A., Ebie, K. and Azuma, Y. 2003. Microcolumn test and model analysis of activated
carbon adsorption of dissolved organic matter after precoagulation: effects of pH and pore size
distribution. Journal of Colloid and Interface Science, 262(2), pp.331-341.

198
Li, Y., Chen, J., Liu, J., Ma, M., Chen, W. and Li, L. 2010. Activated carbon supported TiO2-
photocatalysis doped with Fe ions for continuous treatment of dye wastewater in a dynamic reactor.
Journal of Environmental Sciences, 22(8), pp.1290-1296.
Li, Y., Ma, M., Wang, X. and Wang, X. 2008a. Inactivated properties of activated carbon-supported
TiO2 nanoparticles for bacteria and kinetic study. Journal of Environmental Sciences, 20(12), pp.1527-
1533.
Li, Y., Sun, S., Ma, M., Ouyang, Y. and Yan, W. 2008b. Kinetic study and model of the photocatalytic
degradation of rhodamine B (RhB) by a TiO2-coated activated carbon catalyst: Effects of initial RhB
content, light intensity and TiO2 content in the catalyst. Chemical Engineering Journal, 142(2), pp.147-
155.
Li, Y., Zhang, S., Yu, Q. and Yin, W. 2007. The effects of activated carbon supports on the structure
and properties of TiO2 nanoparticles prepared by a sol–gel method. Applied Surface Science, 253(23),
pp.9254-9258.
Li, Y., Li, X., Li, J. and Yin, J. 2006. Photocatalytic degradation of methyl orange by TiO2-coated
activated carbon and kinetic study. Water Research, 40(6), pp.1119-1126.
Li, Y., Li, X., Li, J. and Yin, J. 2005. Photocatalytic degradation of methyl orange in a sparged tube
reactor with TiO2-coated activated carbon composites. Catalysis Communications, 6(10), pp.650-655.
Li, Y., Chen, W. and Li, L. 2011. Effects of Surface Areas and Adsorption Strength on the
Photoactivity and Decomposition Kinetics of Acid Red 27 over TiO2-Coated/Activated Carbon
Composites. Acta Physico -Chimica Sinica, 27(07), pp.1751-1756.
Liang, C., Dai, S. and Guiochon, G. 2003. A Graphitized-Carbon Monolithic Column. Analytical
Chemistry, 75(18), pp.4904-4912.
Lim, J. and Okada, M. 2005. Regeneration of granular activated carbon using ultrasound. Ultrasonics
Sonochemistry, 12(4), pp.277-282.
Lim, T., Yap, P., Srinivasan, M. and Fane, A.G. 2011. TiO2/AC Composites for Synergistic
Adsorption-Photocatalysis Processes: Present Challenges and Further Developments for Water
Treatment and Reclamation. Critical Reviews in Environmental Science and Technology, 41(13),
pp.1173-1230.
Liu, G., Zhang, X., Talley, J.W., Neal, C.R. and Wang, H. 2008. Effect of NOM on arsenic adsorption
by TiO2 in simulated As(III)-contaminated raw waters. Water Research, 42(8–9), pp.2309-2319.
Liu, J., Yang, R. and Li, S. 2006. Preparation and application of efficient TiO2/ACFs photocatalyst.
Journal of Environmental Sciences, 18(5), pp.979-982.
Liu, L.F., Zhang, P.H. and Yang, F.L. 2010. Adsorptive removal of 2,4-DCP from water by fresh or
regenerated chitosan/ACF/TiO2 membrane. Separation and Purification Technology, 70(3), pp.354-
361.
Liu, L., Chen, F. and Yang, F. 2009. Stable photocatalytic activity of immobilized Fe0/TiO2/ACF on
composite membrane in degradation of 2,4-dichlorophenol. Separation and Purification Technology,
70(2), pp.173-178.
Liu, S.X., Chen, X.Y. and Chen, X. 2007a. A TiO2/AC composite photocatalyst with high activity and
easy separation prepared by a hydrothermal method. Journal of Hazardous Materials, 143(1-2),
pp.257-263.

199
Liu, Y., Yang, S., Hong, J. and Sun, C. 2007b. Low-temperature preparation and microwave
photocatalytic activity study of TiO2-mounted activated carbon. Journal of Hazardous Materials,
142(1-2), pp.208-215.
Lookchem, 22 August 2012. Lookchem-Cimetidine [Online]. Available from:
http://www.lookchem.com/Cimetidine/ [Accessed 8/22 2012].
Lu, M., Chen, J. and Chang, K. 1999. Effect of adsorbents coated with titanium dioxide on the
photocatalytic degradation of propoxur. Chemosphere, 38(3), pp.617-627.
Maekawa, K., Chiyoda, O., Ohshiro, S., Okada, S., Anpo, M. and Yamashita, H. 2006. Photocatalytic
degradation of organic pollutants diluted in water using TiO2 loaded on fluoride-modified hydrophobic
mesoporous silica. Comptes Rendus Chimie, 9(5-6), pp.817-821.
Mahadwad, O.K., Parikh, P.A., Jasra, R.V. and Patil, C. 2011. Photocatalytic degradation of reactive
black-5 dye using TiO2-impregnated activated carbon. Environmental Technology, 33(3), pp.307-312.
Mahmoodi, N.M., Arami, M. and Zhang, J. 2011. Preparation and photocatalytic activity of
immobilized composite photocatalyst (titania nanoparticle/activated carbon). Journal of Alloys and
Compounds, 509(14), pp.4754-4764.
Malato, S., Blanco, J., Vidal, A. and Richter, C. 2002. Photocatalysis with solar energy at a pilot-plant
scale: an overview. Applied Catalysis B: Environmental, 37(1), pp.1-15.
Maniscalco, M., Singh-Franco, D., Wolowich, W.R. and Torres-Colón, R. 2006. Solifenacin succinate
for the treatment of symptoms of overactive bladder. Clinical Therapeutics, 28(9), pp.1247-1272.
Markandya, A., Taylor, T., Longo, A., Murty, M.N., Murty, S. and Dhavala, K. 2008. Counting the
cost of vulture decline—An appraisal of the human health and other benefits of vultures in India.
Ecological Economics, 67(2), pp.194-204.
Marsh, H. and Rodríguez-Reinoso, F. ,2006a. Chapter 9 - Production and Reference Material IN:
Marsh, H. and Rodríguez-Reinoso, F. (eds.) Activated Carbon. Oxford Elsevier Science Ltd, pp.454-
508.
Marsh, H. and Rodríguez-Reinoso, F. ,2006b. Introduction to the Scope of the Text IN: Marsh, H. and
Rodríguez-Reinoso, F. (eds.) Activated Carbon. Oxford Elsevier Science Ltd, pp.1-12.
Marsh, H. and Rodríguez-Reinoso, F. ,2006c. Chapter 2 - Activated Carbon (Origins) IN: Marsh, H.
and Rodríguez-Reinoso, F. (eds.) Activated Carbon. Oxford Elsevier Science Ltd, pp.13-86.
Marsh, H. and Rodríguez-Reinoso, F. ,2006d. Chapter 4 - Characterization of Activated Carbon IN:
AnonymousActivated Carbon. Oxford Elsevier Science Ltd, pp.143-242.
Matos, J., Laine, J., Herrmann, J.M., Uzcategui, D. and Brito, J.L. 2007. Influence of activated carbon
upon titania on aqueous photocatalytic consecutive runs of phenol photodegradation. Applied Catalysis
B: Environmental, 70(1-4), pp.461-469.
Matos, J., Laine, J. and Herrmann, J.M. 1999. Association of activated carbons of different origins with
titania in the photocatalytic purification of water. Carbon, 37(11), pp.1870-1872.
Matos, J., Laine, J. and Herrmann, J. 1998. Synergy effect in the photocatalytic degradation of phenol
on a suspended mixture of titania and activated carbon. Applied Catalysis B: Environmental, 18(3-4),
pp.281-291.

200
Matsushita, Y., Ichimura, T., Ohba, N., Kumada, S., Sakeda, K., Suzuki, T., Tanibata, H. and Murata,
T. 2007. Recent progress on photoreactions in microreactors. Pure and Applied Chemistry, 79(11),
pp.1959-1968.
Mazyck, D.W. and Cannon, F.S. 2000. Overcoming calcium catalysis during the thermal reactivation
of granular activated carbon: Part I. Steam-curing plus ramped-temperature N2 treatment. Carbon,
38(13), pp.1785-1799.
Ménesi, J., Körösi, L., Bazsó, É., Zöllmer, V., Richardt, A. and Dékány, I. 2008. Photocatalytic
oxidation of organic pollutants on titania–clay composites. Chemosphere, 70(3), pp.538-542.
Mills, A. and Le Hunte, S. 1997. An overview of semiconductor photocatalysis. Journal of
Photochemistry and Photobiology A: Chemistry, 108(1), pp.1-35.
Mills, L.J. and Chichester, C. 2005. Review of evidence: Are endocrine-disrupting chemicals in the
aquatic environment impacting fish populations? Science of the Total Environment, 343(1-3), pp.1-34.
Mo, D. and Ye, D. 2009. Surface study of composite photocatalyst based on plasma modified activated
carbon fibers with TiO2. Surface and Coatings Technology, 203(9), pp.1154-1160.
Mo, S. and Ching, W.Y. 1995. Electronic and optical properties of three phases of titanium dioxide:
Rutile, anatase, and brookite. Physical Review B, 51(19), pp.13023-13032.
Mohan, D. and Singh, K.P. 2002. Single- and multi-component adsorption of cadmium and zinc using
activated carbon derived from bagasse—an agricultural waste. Water Research, 36(9), pp.2304-2318.
Molinari, R., Caruso, A., Argurio, P. and Poerio, T. 2008. Degradation of the drugs Gemfibrozil and
Tamoxifen in pressurized and de-pressurized membrane photoreactors using suspended polycrystalline
TiO2 as catalyst. Journal of Membrane Science, 319(1-2), pp.54-63.
Mompelat, S., Le Bot, B. and Thomas, O. 2009. Occurrence and fate of pharmaceutical products and
by-products, from resource to drinking water. Environment International, 35(5), pp.803-814.
Moreno-Castilla, C. 2004. Adsorption of organic molecules from aqueous solutions on carbon
materials. Carbon, 42(1), pp.83-94.
Mounir, B., Pons, M.N., Zahraa, O., Yaacoubi, A. and Benhammou, A. 2007. Discoloration of a red
cationic dye by supported TiO2 photocatalysis. Journal of Hazardous Materials, 148(3), pp.513-520.
Mozia, S., Tomaszewska, M. and Morawski, A.W. 2007a. Photocatalytic membrane reactor (PMR)
coupling photocatalysis and membrane distillation—Effectiveness of removal of three azo dyes from
water. Catalysis Today, 129(1-2), pp.3-8.
Mozia, S., Toyoda, M., Inagaki, M., Tryba, B. and Morawski, A.W. 2007b. Application of carbon-
coated TiO2 for decomposition of methylene blue in a photocatalytic membrane reactor. Journal of
Hazardous Materials, 140(1-2), pp.369-375.
Muranaka, C.T., Julcour, C., Wilhelm, A., Delmas, H. and Nascimento, C.A.O. 2010. Regeneration of
Activated Carbon by (Photo)-Fenton Oxidation. Industrial & Engineering Chemistry Research, 49(3),
pp.989-995.
Murphy, S. 2009. Photocatalytic Degradation of Pharmaceuticals in Aqueous Solutions. Transfer
thesis. DCU.
Nagaoka, S., Hamasaki, Y., Ishihara, S., Nagata, M., Iio, K., Nagasawa, C. and Ihara, H. 2002.
Preparation of carbon/TiO2 microsphere composites from cellulose/TiO2 microsphere composites and
their evaluation. Journal of Molecular Catalysis A: Chemical, 177(2), pp.255-263.

201
Nevskaia, D.M., Santianes, A., Muñoz, V. and Guerrero-Ruíz, A. 1999. Interaction of aqueous
solutions of phenol with commercial activated carbons: an adsorption and kinetic study. Carbon, 37(7),
pp.1065-1074.
Neyens, E. and Baeyens, J. 2003. A review of classic Fenton’s peroxidation as an advanced oxidation
technique. Journal of Hazardous Materials, 98(1-3), pp.33-50.
Ni, M., Leung, M.K.H., Leung, D.Y.C. and Sumathy, K. 2007. A review and recent developments in
photocatalytic water-splitting using TiO2 for hydrogen production. Renewable and Sustainable Energy
Reviews, 11(3), pp.401-425.
Nieuwenhuijsen, M.J., Toledano, M.B., Eaton, N.E., Fawell, J. and Elliott, P. 2000. Chlorination
disinfection byproducts in water and their association with adverse reproductive outcomes: a review.
Occupational and Environmental Medicine, 57(2), pp.73-85.
Oaks, J.L., Gilbert, M., Virani, M.Z., Watson, R.T., Meteyer, C.U., Rideout, B.A., Shivaprasad, H.L.,
Ahmed, S., Iqbal Chaudhry, M.J., Arshad, M., Mahmood, S., Ali, A. and Ahmed Khan, A. 2004.
Diclofenac residues as the cause of vulture population decline in Pakistan. Nature, 427(6975), pp.630-
633.
Ocampo-Pérez, R., Sánchez-Polo, M., Rivera-Utrilla, J. and Leyva-Ramos, R. 2011. Enhancement of
the catalytic activity of TiO2 by using activated carbon in the photocatalytic degradation of cytarabine.
Applied Catalysis B: Environmental, 104(1-2), pp.177-184.
Ochuma, I.J., Osibo, O.O., Fishwick, R.P., Pollington, S., Wagland, A., Wood, J. and Winterbottom,
J.M. 2007. Three-phase photocatalysis using suspended titania and titania supported on a reticulated
foam monolith for water purification. Catalysis Today, 128(1-2), pp.100-107.
O'Dwyer,R. (2011) Development of titanium dioxide composites for the removal of pesticides from
water and wastewater using photocatalysis. Transfer Thesis, Dublin City University.
Oh, W., Zhang, F., Chen, M., Lee, Y. and Ko, W. 2009. Characterization and relative photonic
efficiencies of a new Fe-ACF/TiO2 composite photocatalysts designed for organic dye decomposition.
Journal of Industrial and Engineering Chemistry, 15(2), pp.190-195.
Ohno, T., Sarukawa, K., Tokieda, K. and Matsumura, M. 2001. Morphology of a TiO2 Photocatalyst
(Degussa, P-25) Consisting of Anatase and Rutile Crystalline Phases. Journal of Catalysis, 203(1),
pp.82-86.
Olympus Microscopy Resource Center, 06 June 2012. Non-Coherent Light Sources for Confocal
Microscopy [Online]. Available from:
http://www.olympusmicro.com/primer/techniques/confocal/noncoherentsources.html [Accessed 06/06
2012].
Önal, Y. 2006. Kinetics of adsorption of dyes from aqueous solution using activated carbon prepared
from waste apricot. Journal of Hazardous Materials, 137(3), pp.1719-1728.
Órfão, J.J.M., Silva, A.I.M., Pereira, J.C.V., Barata, S.A., Fonseca, I.M., Faria, P.C.C. and Pereira,
M.F.R. 2006. Adsorption of a reactive dye on chemically modified activated carbons—Influence of
pH. Journal of Colloid and Interface Science, 296(2), pp.480-489.
Oulton, R.L., - Kohn, T. and - Cwiertny, D.M. 2010. Pharmaceuticals and personal care products in
effluent matrices: A survey of transformation and removal during wastewater treatment and
implications for wastewater management. Journal of Environmental Monitoring, 12(11), pp.1956-
1978.

202
Ovenstone, J. and Yanagisawa, K. 1999. Effect of Hydrothermal Treatment of Amorphous Titania on
the Phase Change from Anatase to Rutile during Calcination. Chemistry of Materials, 11(10), pp.2770-
2774.
Parson, S., Jefferson, B. and Christopher, N. ,2007. Sustainable Water: Chemical Science Priorities
Summary Report IN: Hardy, J. (ed.) London Royal Society of Chemistry,
Peel, R.G. and Benedek, A. 1980. Attainment of equilibrium in activated carbon isotherm studies.
Environmental Science & Technology, 14(1), pp.66-71.
Peralta-Hernández, J.M., Manríquez, J., Meas-Vong, Y., Rodríguez, F.J., Chapman, T.W., Maldonado,
M.I. and Godínez, L.A. 2007. Photocatalytic properties of nano-structured TiO2-carbon films obtained
by means of electrophoretic deposition. Journal of Hazardous Materials, 147(1-2), pp.588-593.
Pfeffer, R., Dave, R.N., Wei, D. and Ramlakhan, M. 2001. Synthesis of engineered particulates with
tailored properties using dry particle coating. Powder Technology, 117(1-2), pp.40-67.
Phillips, P.J., Smith, S.G., Kolpin, D.W., Zaugg, S.D., Buxton, H.T., Furlong, E.T., Esposito, K. and
Stinson, B. 2010. Pharmaceutical Formulation Facilities as Sources of Opioids and Other
Pharmaceuticals to Wastewater Treatment Plant Effluents. Environmental Science & Technology,
44(13), pp.4910-4916.
Purkait, M.K., Maiti, A., DasGupta, S. and De, S. 2007. Removal of congo red using activated carbon
and its regeneration. Journal of Hazardous Materials, 145(1-2), pp.287-295.
Putra, E.K., Pranowo, R., Sunarso, J., Indraswati, N. and Ismadji, S. 2009. Performance of activated
carbon and bentonite for adsorption of amoxicillin from wastewater: Mechanisms, isotherms and
kinetics. Water Research, 43(9), pp.2419-2430.
Qourzal, S., Assabbane, A. and Ait-Ichou, Y. 2004. Synthesis of TiO2 via hydrolysis of titanium
tetraisopropoxide and its photocatalytic activity on a suspended mixture with activated carbon in the
degradation of 2-naphthol. Journal of Photochemistry and Photobiology A: Chemistry, 163(3), pp.317-
321.
Radjenović, J., Petrović, M. and Barceló, D. 2009. Fate and distribution of pharmaceuticals in
wastewater and sewage sludge of the conventional activated sludge (CAS) and advanced membrane
bioreactor (MBR) treatment. Water Research, 43(3), pp.831-841.
Ravichandran, L., Selvam, K. and Swaminathan, M. 2010. Highly efficient activated carbon loaded
TiO2 for photo defluoridation of pentafluorobenzoic acid. Journal of Molecular Catalysis A: Chemical,
317(1-2), pp.89-96.
Redlich, O. and Peterson, D.L. 1959. A Useful Adsorption Isotherm. The Journal of Physical
Chemistry, 63(6), pp.1024-1024.
Rengaraj, S., Moon, S., Sivabalan, R., Arabindoo, B. and Murugesan, V. 2002. Agricultural solid waste
for the removal of organics: adsorption of phenol from water and wastewater by palm seed coat
activated carbon. Waste Management, 22(5), pp.543-548.
Rizzo, L., Meric, S., Kassinos, D., Guida, M., Russo, F. and Belgiorno, V. 2009. Degradation of
diclofenac by TiO2 photocatalysis: UV absorbance kinetics and process evaluation through a set of
toxicity bioassays. Water Research, 43(4), pp.979-988.
Rodríguez-Reinoso, F. and Molina-Sabio, M. 1998. Textural and chemical characterization of
microporous carbons. Advances in Colloid and Interface Science, 76-77pp.271-294.

203
Roeges, N.P.G. 1994. A Guide to the Complete Interpretation of Infrared Spectra of Organic
Structures. Chichester: John Wiley & Sons, Ltd.
Rolando M.A., R. 2007. Adsorption and Diffusion in Nanoporous Materials. First Edition ed. Boca
Raton, Florida USA: CRC Press.
Rouquerol, F., Rouquerol, J. and Sing, K. 1999. Adsorption by Powders and Porous Solids Principles,
Methodology and Applications. 1st ed. London: ACADEMIC PRESS.
Rouquerol, J., Avnir, D., Fairbridge, C.W., Everett, D.H., Haynes, J.M., Pernicone, N., Ramsay, J.D.F.,
Sing, K.S.W. and Unger, K.K. 1994. Recommendations for the characterization of porous solids
(Technical Report). Pure and Applied Chemistry, 66(8), pp.1739-1758.
Ryu, J. and Choi, W. 2008. Substrate-Specific Photocatalytic Activities of TiO2 and Multiactivity Test
for Water Treatment Application. Environmental Science & Technology, 42(1), pp.294-300.
Saepurahman, Abdullah, M.A. and Chong, F.K. 2010. Preparation and characterization of tungsten-
loaded titanium dioxide photocatalyst for enhanced dye degradation. Journal of Hazardous Materials,
176(1-3), pp.451-458.
SEN Lights Corporation 25 August 2011. Low-Pressure Mercury Lamps [Online]. Available from:
http://www.senlights.com/lamp/lplamp/lamp.htm [Accessed 05/26 2012].
Serpone, N. 2006. Is the Band Gap of Pristine TiO2 Narrowed by Anion- and Cation-Doping of
Titanium Dioxide in Second-Generation Photocatalysts? The Journal of Physical Chemistry B,
110(48), pp.24287-24293.
Shankar, M.V., Anandan, S., Venkatachalam, N., Arabindoo, B. and Murugesan, V. 2006. Fine route
for an efficient removal of 2,4-dichlorophenoxyacetic acid (2,4-D) by zeolite-supported TiO2.
Chemosphere, 63(6), pp.1014-1021.
Shen, W., Li, Z. and Liu, Y. 2008. Surface Chemical Functional Groups Modification of Porous
Carbon. Recent Patents on Chemical Engineering, 1pp.27-40.
Shi, J., Zheng, J., Wu, P. and Ji, X. 2008. Immobilization of TiO2 films on activated carbon fiber and
their photocatalytic degradation properties for dye compounds with different molecular size. Catalysis
Communications, 9(9), pp.1846-1850.
Shi, J. 2009. Preparation of Fe(III) and Ho(III) co-doped TiO2 films loaded on activated carbon fibers
and their photocatalytic activities. Chemical Engineering Journal, 151(1-3), pp.241-246.
Shi, L. and Weng, D. 2008. Highly active mixed-phase TiO2 photocatalysts fabricated at low
temperatureand the correlation between phase compositionand photocatalytic activity. Journal of
Environmental Sciences, 20(10), pp.1263-1267.
Sirtori, C., Zapata, A., Oller, I., Gernjak, W., Agüera, A. and Malato, S. 2009. Decontamination
industrial pharmaceutical wastewater by combining solar photo-Fenton and biological treatment. Water
Research, 43(3), pp.661-668.
Slimen, H., Houas, A. and Nogier, J.P. 2011. Elaboration of stable anatase TiO2 through activated
carbon addition with high photocatalytic activity under visible light. Journal of Photochemistry and
Photobiology A: Chemistry, In Press, Accepted Manuscript
Smith, S.J., Stevens, R., Liu, S., Li, G., Navrotsky, A., Boerio-Goates, J. and Woodfield, B.F. 2009.
Heat capacities and thermodynamic functions of TiO2 anatase and rutile: Analysis of phase stability.
American Mineralogist, 94(2-3), pp.236-243.

204
Snyder, S.A., Adham, S., Redding, A.M., Cannon, F.S., DeCarolis, J., Oppenheimer, J., Wert, E.C. and
Yoon, Y. 2007. Role of membranes and activated carbon in the removal of endocrine disruptors and
pharmaceuticals. Desalination, 202(1-3), pp.156-181.
Spectroscopy TV 27 May 2012. LED Measurement Using an Integrating Sphere [Online]. Available
from: http://spectroscopytv.com/2009/02/13/led-measurement-using-an-integrating-sphere/ [Accessed
05/27 2012].
Sreekanth, D., Sivaramakrishna, D., Himabindu, V. and Anjaneyulu, Y. 2009. Thermophilic treatment
of bulk drug pharmaceutical industrial wastewaters by using hybrid up flow anaerobic sludge blanket
reactor. Bioresource Technology, 100(9), pp.2534-2539.
Suman Raj, D.S. and Anjaneyulu, Y. 2005. Evaluation of biokinetic parameters for pharmaceutical
wastewaters using aerobic oxidation integrated with chemical treatment. Process Biochemistry, 40(1),
pp.165-175.
Sun, J., Wang, X., Sun, J., Sun, R., Sun, S. and Qiao, L. 2006. Photocatalytic degradation and kinetics
of Orange G using nano-sized Sn(IV)/TiO2/AC photocatalyst. Journal of Molecular Catalysis A:
Chemical, 260(1-2), pp.241-246.
Sun, J., Wang, Y., Sun, R. and Dong, S. 2009. Photodegradation of azo dye Congo Red from aqueous
solution by the WO3–TiO2/activated carbon (AC) photocatalyst under the UV irradiation. Materials
Chemistry and Physics, 115(1), pp.303-308.
Sun, Q. and Xu, Y. 2010. Evaluating Intrinsic Photocatalytic Activities of Anatase and Rutile TiO2 for
Organic Degradation in Water. The Journal of Physical Chemistry C, 114(44), pp.18911-18918.
Tao, Y., Wu, C. and Mazyck, D.W. 2006. Removal of methanol from pulp and paper mills using
combined activated carbon adsorption and photocatalytic regeneration. Chemosphere, 65(1), pp.35-42.
Taylor, P.J. 2005. Matrix effects: the Achilles heel of quantitative high-performance liquid
chromatography–electrospray–tandem mass spectrometry. Clinical Biochemistry, 38(4), pp.328-334.
Ternes, T.A., Stumpf, M., Mueller, J., Haberer, K., Wilken, R.-. and Servos, M. 1999. Behavior and
occurrence of estrogens in municipal sewage treatment plants — I. Investigations in Germany, Canada
and Brazil. Science of the Total Environment, 225(1–2), pp.81-90.
Ternes, T.A., Meisenheimer, M., McDowell, D., Sacher, F., Brauch, H., Haist-Gulde, B., Preuss, G.,
Wilme, U. and Zulei-Seibert, N. 2002. Removal of Pharmaceuticals during Drinking Water Treatment.
Environmental Science & Technology, 36(17), pp.3855-3863.
Thirumal, J. and Kaliappan, S. 2011. Equilibrium, Kinetic and Thermodynamic behavior of Perchlorate
Adsorption Onto the Activated Carbon. European Journal of Scientific Research, 64(3), pp.365-376.
Torimoto, T., Okawa, Y., Takeda, N. and Yoneyama, H. 1997. Effect of activated carbon content in
TiO2-loaded activated carbon on photodegradation behaviors of dichloromethane. Journal of
Photochemistry and Photobiology A: Chemistry, 103(1-2), pp.153-157.
Torimoto, T., Ito, S., Kuwabata, S. and Yoneyama, H. 1996. Effects of Adsorbents Used as Supports
for Titanium Dioxide Loading on Photocatalytic Degradation of Propyzamide. Environmental Science
& Technology, 30(4), pp.1275-1281.
Treschev, S.Y., Chou, P., Tseng, Y., Wang, J., Perevedentseva, E.V. and Cheng, C. 2008.
Photoactivities of the visible-light-activated mixed-phase carbon-containing titanium dioxide: The
effect of carbon incorporation. Applied Catalysis B: Environmental, 79(1), pp.8-16.

205
Tryba, B., Morawski, A.W. and Inagaki, M. 2003a. A new route for preparation of TiO2-mounted
activated carbon. Applied Catalysis B: Environmental, 46(1), pp.203-208.
Tryba, B., Morawski, A.W. and Inagaki, M. 2003b. Application of TiO2-mounted activated carbon to
the removal of phenol from water. Applied Catalysis B: Environmental, 41(4), pp.427-433.
Tsumura, T., Kojitani, N., Umemura, H., Toyoda, M. and Inagaki, M. 2002. Composites between
photoactive anatase-type TiO2 and adsorptive carbon. Applied Surface Science, 196(1-4), pp.429-436.
Tütem, E., Apak, R. and Ünal, Ç.F. 1998. Adsorptive removal of chlorophenols from water by
bituminous shale. Water Research, 32(8), pp.2315-2324.
Vaisman, E., Kabir, M., Kantzas, A. and Langford, C. 2005. A fluidized bed photoreactor exploiting a
supported photocatalyst with adsorption pre-concentration capacity. Journal of Applied
Electrochemistry, 35(7), pp.675-681.
Velasco, L.F., Tsyntsarski, B., Petrova, B., Budinova, T., Petrov, N., Parra, J.B. and Ania, C.O. 2010a.
Carbon foams as catalyst supports for phenol photodegradation. Journal of Hazardous Materials,
184(1-3), pp.843-848.
Velasco, L.F., Parra, J.B. and Ania, C.O. 2010b. Role of activated carbon features on the photocatalytic
degradation of phenol. Applied Surface Science, 256(17), pp.5254-5258.
Velasco, L.F., Parra, J.B. and Ania, C.O. 2010c. Phenol Adsorption and Photo-oxidation on Porous
Carbon/Titania Composites. Adsorption Science & Technology, 28(8), pp.727-738.
Verhoeven, J.W. 1996. Glossary Of Terms Used In Photochemistry. Pure and Applied Chemistry,
68(12), pp.2223-2286.
Verlicchi, P., Al Aukidy, M. and Zambello, E. 2012. Occurrence of pharmaceutical compounds in
urban wastewater: Removal, mass load and environmental risk after a secondary treatment—A review.
Science of the Total Environment, 429(0), pp.123-155.
Vieno, N.M., Härkki, H., Tuhkanen, T. and Kronberg, L. 2007. Occurrence of Pharmaceuticals in
River Water and Their Elimination in a Pilot-Scale Drinking Water Treatment Plant. Environmental
Science & Technology, 41(14), pp.5077-5084.
von Gunten, U. and Hoigne, J. 1994. Bromate Formation during Ozonization of Bromide-Containing
Waters: Interaction of Ozone and Hydroxyl Radical Reactions. Environmental Science & Technology,
28(7), pp.1234.
Wahi, R.K., Yu, W.W., Liu, Y., Mejia, M.L., Falkner, J.C., Nolte, W. and Colvin, V.L. 2005.
Photodegradation of Congo Red catalyzed by nanosized TiO2. Journal of Molecular Catalysis A:
Chemical, 242(1-2), pp.48-56.
Wang, C., Deng, Z. and Li, Y. 2001. The Synthesis of Nanocrystalline Anatase and Rutile Titania in
Mixed Organic Media. Inorganic Chemistry, 40(20), pp.5210-5214.
Wang, C., Lee, C., Lyu, M. and Juang, L. 2008. Photocatalytic degradation of C.I. Basic Violet 10
using TiO2 catalysts supported by Y zeolite: An investigation of the effects of operational parameters.
Dyes and Pigments, 76(3), pp.817-824.
Wang, H., Wang, H., Jiang, W. and Li, Z. 2009a. Photocatalytic degradation of 2,4-dinitrophenol
(DNP) by multi-walled carbon nanotubes (MWCNTs)/TiO2 composite in aqueous solution under solar
irradiation. Water Research, 43(1), pp.204-210.

206
Wang, R., Fan, K. and Chang, J. 2009b. Removal of acid dye by ZnFe2O4/TiO2-immobilized granular
activated carbon under visible light irradiation in a recycle liquid–solid fluidized bed. Journal of the
Taiwan Institute of Chemical Engineers, 40(5), pp.533-540.
Wang, S. and Zhou, S. 2010. Titania deposited on soft magnetic activated carbon as a magnetically
separable photocatalyst with enhanced activity. Applied Surface Science, 256(21), pp.6191-6198.
Wang, W., Silva, C.G. and Faria, J.L. 2007. Photocatalytic degradation of Chromotrope 2R using
nanocrystalline TiO2/activated-carbon composite catalysts. Applied Catalysis, B: Environmental, 70(1-
4), pp.470-478.
Wang, X., Hu, Z., Chen, Y., Zhao, G., Liu, Y. and Wen, Z. 2009a. A novel approach towards high-
performance composite photocatalyst of TiO2 deposited on activated carbon. Applied Surface Science,
255(7), pp.3953-3958.
Wang, X., Liu, Y., Hu, Z., Chen, Y., Liu, W. and Zhao, G. 2009b. Degradation of methyl orange by
composite photocatalysts nano-TiO2 immobilized on activated carbons of different porosities. Journal
of Hazardous Materials, 169(1-3), pp.1061-1067.
Watkinson, A.J., Murby, E.J. and Costanzo, S.D. 2007. Removal of antibiotics in conventional and
advanced wastewater treatment: Implications for environmental discharge and wastewater recycling.
Water Research, 41(18), pp.4164-4176.
Wishart, D.S., Knox, C., Guo, A.C., Cheng, D., Shrivastava, S., Tzur, D., Gautam, B. and Hassanali,
M. 30/06/2012. DrugBank: a knowledgebase for drugs, drug actions and drug targets
(Famotidine).[Online]. Available from: http://www.drugbank.ca/drugs/DB00927 [Accessed 07/09
2012].
Wishart, D.S., Knox, C., Guo, A.C., Cheng, D., Shrivastava, S., Tzur, D., Gautam, B. and Hassanali,
M. 27/06/2012. DrugBank: a knowledgebase for drugs, drug actions and drug targets
(Solifenacin).[Online]. Available from: http://www.drugbank.ca/drugs/DB01591 [Accessed 07/09
2012].
Woan, K., Pyrgiotakis, G. and Sigmund, W. 2009. Photocatalytic Carbon-Nanotube-TiO2 Composites.
Advanced Materials, 21(21), pp.2233-2239.
Wu, C., Nguyen, J., Cai, M., Ruthkosky, M., Rogers, J., Feng, L., Watano, S. and Yoshida, T. 2003.
Surface Enhancement of Al2O3 Fiber With Nanosized Al2O3 Particles Using A Dry Mechanical
Coating Process. Journal of Engineering Materials and Technology, 125(2), pp.163-169.
Wu, F., Liu, B., Wu, K. and Tseng, R. 2010. A new linear form analysis of Redlich–Peterson isotherm
equation for the adsorptions of dyes. Chemical Engineering Journal, 162(1), pp.21-27.
Wu, H., Wang, Q., Yao, Y., Qian, C., Zhang, X. and Wei, X. 2008. Microwave-Assisted Synthesis and
Photocatalytic Properties of Carbon Nanotube/Zinc Sulfide Heterostructures. The Journal of Physical
Chemistry C, 112(43), pp.16779-16783.
Wu, Y., Zhang, J., Xiao, L. and Chen, F. 2010. Properties of carbon and iron modified TiO2
photocatalyst synthesized at low temperature and photodegradation of acid orange 7 under visible light.
Applied Surface Science, 256(13), pp.4260-4268.
Wu, Y. and Fassihi, R. 2005. Stability of metronidazole, tetracycline HCl and famotidine alone and in
combination. International Journal of Pharmaceutics, 290(1-2), pp.1-13.
Xia, X., Jia, Z., Yu, Y., Liang, Y., Wang, Z. and Ma, L. 2007. Preparation of multi-walled carbon
nanotube supported TiO2 and its photocatalytic activity in the reduction of CO2 with H2O. Carbon,
45(4), pp.717-721.

207
Xu, D., Huang, Z., Kang, F., Inagaki, M. and Ko, T.-. 2008. Effect of heat treatment on adsorption
performance and photocatalytic activity of TiO2-mounted activated carbon cloths. Catalysis Today,
139(1-2), pp.64-68.
Xu, J., Ao, Y., Chen, M., Fu, D. and Yuan, C. 2010. Photocatalytic activity of vanadium-doped titania–
activated carbon composite film under visible light. Thin Solid Films, 518(15), pp.4170-4174.
Xu, J., Ao, Y., Fu, D. and Yuan, C. 2008. Synthesis of fluorine-doped titania-coated activated carbon
under low temperature with high photocatalytic activity under visible light. Journal of Physics and
Chemistry of Solids, 69(10), pp.2366-2370.
Xue, G., Liu, H., Chen, Q., Hills, C., Tyrer, M. and Innocent, F. 2011. Synergy between surface
adsorption and photocatalysis during degradation of humic acid on TiO2/activated carbon composites.
Journal of Hazardous Materials, 186(1), pp.765-772.
Xue, Q. and Lu, S. 2008. Microstructure of ferrospheres in fly ashes: SEM, EDX and ESEM analysis.
Zhejiang University Press, co-published with Springer
Yamabi, S. and Imai, H. 2002. Crystal Phase Control for Titanium Dioxide Films by Direct Deposition
in Aqueous Solutions. Chemistry of Materials, 14(2), pp.609-614.
Yamashita, H., Kawasaki, S., Yuan, S., Maekawa, K., Anpo, M. and Matsumura, M. 2007. Efficient
adsorption and photocatalytic degradation of organic pollutants diluted in water using the fluoride-
modified hydrophobic titanium oxide photocatalysts: Ti-containing Beta zeolite and TiO2 loaded on
HMS mesoporous silica. Catalysis Today, 126(3-4), pp.375-381.
Yamashita, H., Maekawa, K., Nakao, H. and Anpo, M. 2004. Efficient adsorption and photocatalytic
degradation of organic pollutants diluted in water using fluoride-modified hydrophobic mesoporous
silica. Applied Surface Science, 237(1-4), pp.393-397.
Yan, X., Ohno, T., Nishijima, K., Abe, R. and Ohtani, B. 2006. Is methylene blue an appropriate
substrate for a photocatalytic activity test? A study with visible-light responsive titania. Chemical
Physics Letters, 429(4-6), pp.606-610.
Yanagihara, T., Aoki, T., Soeishi, Y., Iwatsubo, T. and Kamimura, H. 2007. Determination of
solifenacin succinate, a novel muscarinic receptor antagonist, and its major metabolite in rat plasma by
semi-micro high performance liquid chromatography. Journal of Chromatography B, 859(2), pp.241-
245.
Yang, H., Liu, L., Yang, F. and Yu, J. 2008. Fibrous TiO2 prepared by chemical vapor deposition using
activated carbon fibers as template via adsorption, hydrolysis and calcinations. Journal of Zhejiang
University - Science A, 9(7), pp.981-987.
Yang, J., Sliva, A., Banerjee, A., Dave, R.N. and Pfeffer, R. 2005. Dry particle coating for improving
the flowability of cohesive powders. Powder Technology, 158(1-3), pp.21-33.
Yao, S.H., Jia, Y.F. and Zhao, S.L. 2012. Photocatalytic oxidation and removal of arsenite by titanium
dioxide supported on granular activated carbon. Environmental Technology, 33(9), pp.983-988.
Yao, S., Li, J. and Shi, Z. 2010. Immobilization of TiO2 nanoparticles on activated carbon fiber and its
photodegradation performance for organic pollutants. Particuology, 8(3), pp.272-278.
Yao, Y., Li, G., Ciston, S., Lueptow, R.M. and Gray, K.A. 2008. Photoreactive TiO2/Carbon Nanotube
Composites: Synthesis and Reactivity. Environmental Science & Technology, 42(13), pp.4952-4957.

208
Yap, P. and Lim, T. 2011. Effect of aqueous matrix species on synergistic removal of bisphenol-A
under solar irradiation using nitrogen-doped TiO2/AC composite. Applied Catalysis B: Environmental,
101(3-4), pp.709-717.
Yap, P., Lim, T. and Srinivasan, M. 2011. Nitrogen-doped TiO2/AC bi-functional composite prepared
by two-stage calcination for enhanced synergistic removal of hydrophobic pollutant using solar
irradiation. Catalysis Today, 161(1), pp.46-52.
Yap, P., Lim, T., Lim, M. and Srinivasan, M. 2010. Synthesis and characterization of nitrogen-doped
TiO2/AC composite for the adsorption–photocatalytic degradation of aqueous bisphenol-A using solar
light. Catal Today, 151(1-2), pp.8-13.
Ye, S., Tian, Q., Song, X. and Luo, S. 2009. Photoelectrocatalytic degradation of ethylene by a
combination of TiO2 and activated carbon felts. Journal of Photochemistry and Photobiology A:
Chemistry, 208(1), pp.27-35.
Yoneyama, H. and Torimoto, T. 2000. Titanium dioxide/adsorbent hybrid photocatalysts for
photodestruction of organic substances of dilute concentrations. Catal Today, 58(2-3), pp.133-140.
Yoon, J., Baek, M., Hong, J., Lee, C. and Suh, J. 2012. Photocatalytic degradation of azo dye using
TiO2 supported on spherical activated carbon. Springer New York
Yu, Y., Yu, J.C., Chan, C., Che, Y., Zhao, J., Ding, L., Ge, W. and Wong, P. 2005. Enhancement of
adsorption and photocatalytic activity of TiO2 by using carbon nanotubes for the treatment of azo dye.
Applied Catalysis B: Environmental, 61(1-2), pp.1-11.
Yuan, R., Guan, R., Liu, P. and Zheng, J. 2007. Photocatalytic treatment of wastewater from paper mill
by TiO2 loaded on activated carbon fibers. Colloids and Surfaces A: Physicochemical and Engineering
Aspects, 293(1-3), pp.80-86.
Yuan, R., Guan, R., Shen, W. and Zheng, J. 2005a. Photocatalytic degradation of methylene blue by a
combination of TiO2 and activated carbon fibers. Journal of Colloid and Interface Science, 282(1),
pp.87-91.
Yuan, R., Guan, R. and Zheng, J. 2005b. Effect of the pore size of TiO2-loaded activated carbon fiber
on its photocatalytic activity. Scripta Materialia, 52(12), pp.1329-1334.
Yuan, R., Zheng, J., Guan, R. and Zhao, Y. 2005c. Surface characteristics and photocatalytic activity of
TiO2 loaded on activated carbon fibers. Colloids and Surfaces A: Physicochemical and Engineering
Aspects, 254(1-3), pp.131-136.
Yurdakal, S., Loddo, V., Augugliaro, V., Berber, H., Palmisano, G. and Palmisano, L. 2007.
Photodegradation of pharmaceutical drugs in aqueous TiO2 suspensions: Mechanism and kinetics.
Catalysis Today, 129(1-2), pp.9-15.
Zaleska, A. 2008. Doped-TiO2: A Review. Recent Patents on Engineering, 2pp.157-164.
Zarezade, M., Ghasemi, S. and Gholami, M.R. 2011. The effect of multiwalled carbon nanotubes and
activated carbon on the morphology and photocatalytic activity of TiO2/C hybrid materials. The Royal
Society of Chemistry
Zhang, F., Nriagu, J.O. and Itoh, H. 2004. Photocatalytic removal and recovery of mercury from water
using TiO2-modified sewage sludge carbon. Journal of Photochemistry and Photobiology A:
Chemistry, 167(2-3), pp.223-228.

209
Zhang, W., Zou, L. and Wang, L. 2011a. A novel charge-driven self-assembly method to prepare
visible-light sensitive TiO2/activated carbon composites for dissolved organic compound removal.
Chemical Engineering Journal, 168(1), pp.485-492.
Zhang, W., Li, Y., Wang, C. and Wang, P. 2011b. Kinetics of heterogeneous photocatalytic
degradation of rhodamine B by TiO2-coated activated carbon: Roles of TiO2 content and light intensity.
Desalination, 266(1-3), pp.40-45.
Zhang, X. and Lei, L. 2008. Effect of preparation methods on the structure and catalytic performance
of TiO2/AC photocatalysts. Journal of Hazardous Materials, 153(1-2), pp.827-833.
Zhang, X. and Lei, L. 2007. A kinetic model for describing effect of the external surface concentration
of TiO2 on the reactivity of eggshell activated carbon supported TiO2 photocatalyst. Chinese Science
Bulletin, 52(24), pp.3339-3345.
Zhang, X., Zhou, M. and Lei, L. 2006. TiO2 photocatalyst deposition by MOCVD on activated carbon.
Carbon, 44(2), pp.325-333.
Zhang, X., Zhou, M. and Lei, L. 2005a. Preparation of an Ag–TiO2 photocatalyst coated on activated
carbon by MOCVD. Materials Chemistry and Physics, 91(1), pp.73-79.
Zhang, X., Zhou, M. and Lei, L. 2005b. Preparation of photocatalytic TiO2 coatings of nanosized
particles on activated carbon by AP-MOCVD. Carbon, 43(8), pp.1700-1708.
Zhang, X., Zhou, M. and Lei, L. 2005c. Enhancing the concentration of TiO2 photocatalyst on the
external surface of activated carbon by MOCVD. Materials Research Bulletin, 40(11), pp.1899-1904.
Zhang, X., Wu, F., Wu, X., Chen, P. and Deng, N. 2008. Photodegradation of acetaminophen in TiO2
suspended solution. Journal of Hazardous Materials, 157(2-3), pp.300-307.
Zhang, Y., Zhou, J.L. and Ning, B. 2007. Photodegradation of estrone and 17β-estradiol in water.
Water Research, 41(1), pp.19-26.
Zhang, Y., Xiong, X., Han, Y., Yuan, H., Deng, S., Xiao, H., Shen, F. and Wu, X. 2010. Application of
titanium dioxide-loaded activated carbon fiber in a pulsed discharge reactor for degradation of methyl
orange. Chemical Engineering Journal, 162(3), pp.1045-1049.
Zhao, J., Yang, L., Li, F., Yu, R. and Jin, C. 2009. Structural evolution in the graphitization process of
activated carbon by high-pressure sintering. Carbon, 47(3), pp.744-751.
Zhao, W., Bai, Z., Ren, A., Guo, B. and Wu, C. 2010. Sunlight photocatalytic activity of CdS modified
TiO2 loaded on activated carbon fibers. Applied Surface Science, 256(11), pp.3493-3498.
Zhou, H. and Smith, D.W. 2002. Advanced technologies in water and wastewater treatment. Journal of
Environmental Engineering and Science, 1(4), pp.247-264.
Zhu, Z.P., Huang, K.L. and Zhou, Y. 2007. Preparation and Characterization of New Photocatalyst
Combined MWCNTs with TiO2 Nanotubes. Transactions of Nonferrous Metals Society of China,
17pp.1117-1121.
Zhu, B. and Zou, L. 2009. Trapping and decomposing of color compounds from recycled water by
TiO2 coated activated carbon. Journal of Environmental Management, 90(11), pp.3217-3225.
Zhu, Y., Fu, Y. and Ni, Q. 2011. Preparation and performance of photocatalytic TiO2 immobilized on
palladium-doped carbon fibers. Applied Surface Science, 257(6), pp.2275-2280.

210
Zinner, N., Noe, L., Rasouliyan, L., Marshall, T., Christopher Runken, M. and Seifeldin, R. 2009.
Impact of solifenacin on quality of life, medical care use, work productivity, and health utility in the
elderly: An exploratory subgroup analysis. The American Journal of Geriatric Pharmacotherapy, 7(6),
pp.373-382.
Zwiener, C. and Frimmel, F.H. 2000. Oxidative treatment of pharmaceuticals in water. Water
Research, 34(6), pp.1881-1885.

211
Appendix A, IPCAs Prepared by Wet Methods

212
Preparation method Adsorbent
(catalyst
loading)
Photocatalyst Substrate (initial
concentration)
Irradiation source Controls Notes Ref
Sol-gel method used to prepare TiO2 and magnetic
particles solution. Impregnated using refluxing and
ultrasonication.
Magnetic
activated
carbon: (PAC containing
magnetic
magnetite particles). (0.2
g/L)
Anatase TiO2 X-3B (50 mg/L) 0.25L breaker irradiated with
UV: 200W, Visible: halogen
500W lamp
Adsorbent
(UV&Vis),
no control for the
recycle.
The adsorbent shows little
photocatalytic action
compared to the IPCA. Dark adsorption (30min)
of the IPCA is a third
higher. Without a dark IPCA control it is
impossible to determine if
the enhanced X-3B removal (over 80min) is
due to photodegradation.
(Ao et al.,
2009)
As above. Magnetic activated
carbon (PAC)
(1.5g/L)
Anatase TiO2 Phenol (100 mg/L) 0.5L cylindrical stainless steel photoreactor with a 20W UV
lamp (365nm) covered by a
quartz glass sleeve.
TiO2 and P25, no
control for
recycle.
Without adsorbent controls the photodegradation of the
IPCAs could be simple
adsorption.
(Ao et al., 2008c)
Preparation methods as above with the exception that
some of the samples were calcined at 350 or 450 C in a
N2 atmosphere for 2h.
Magnetic
activated
carbon (PAC) (0.8 g/L)
Anatase TiO2 Phenol (100 mg/L) 0.5L glass beaker (containing
400ml solution) covered in
silver paper with an 8W UV lamp (365nm).
P25, no
control for
the recycle.
Dark adsorption stage (1h)
not shown suggests that
phenol decrease is residual adsorption.
(Ao et al.,
2008d)
Separate sol gel methods were used to prepare TiO2 and magnetic ferrite particles. The ferrite and TiO2 particles in
the sol-gel solution were then applied to the AC using
ultrasonication.
Magnetic ferrite activated
carbon (PAC)
(0.4g/L)
Anatase and rutile (P25 as reference)
Methyl orange (20 mg/L)
0.5L cylindrical glass reactor with a UV lamp (365nm) and
circulating water jacket.
Aeration: 0.6 L/min
P25, TiO2
and no
control for
the recycle. Photolysis
not shown
30min dark adsorption time not shown and
photodegradation is
expressed in % removal at t=0. Without an adsorbent
control it is impossible to
determine if removal is photocatalytic.
(Wang and Zhou, 2010)
Sol gel method was used to prepare a TiO2 solution.
Impregnation used ultrasonication and dip coating onto glass plates.
PAC coated on
a glass plate (not stated)
Anatase TiO2 (P25
as reference)
4-cholophenol
(100 mg/L)
Cylindrical silica reactor
(volume not stated) with 200W UV lamp (365nm, 9
mW cm-2).
None, None
for recycling
The dark adsorption stage
was not shown however if it was added it would
suggest that the IPCA performance is mainly
adsorption. Linear
transform of the kinetic curves is used to claim that
the IPCAs worked better
but the curves have different starting points so
they are not comparable.
(Ao et al.,
2008b)

213
Sol gel method was used to prepare a TiO2 solution and
ultrasonication was used for impregnation.
PAC (1.5g/L) Anatase TiO2 Phenol (100 mg/L) 0.5L cylindrical photoreactor
with 20W UV lamp, (peak 365nm).
Adsorbent,
none for recycle
Adsorbent control: no
reduction in phenol after the initial dark adsorption
phase. The IPCA removes
more phenol from the solution than the TiO2’s
however the slope of the
degradation curves appears very similar before
accounting for the different
in substrate concentrations.
(Ao et al.,
2008a)
TiO2 was synthesised using a sol gel method and a “dip
coating method” and ultrasonication for impregnation.
GAC (2g/L) Anatase TiO2 Phenol (10 mg/L) 0.05L photoreactor excited by
electrode-less discharge lamp
(EDL) excited by microwave irradiation (254-579nm,
output not stated).
None Extensive characterisation
information used to
compare solutions prepared with and without
microwaves. Looks at the
effect of heat treatment but finds no effect.
(Liu et al.,
2007b)
As above. PAC (1.5g/L
P25/IPCA, 0.1g/L AC)
Anatase TiO2 Rhodamine B (RhB)
(30 mg/L)
0.05L solution irradiated in a
microwave with a MW-EDML (MicroWave-
Electrodeless Discharge
Mercury Lamp) output not stated.
Photolysis,Ti
O2, P25 & adsorbent
40min of dark adsorption
not shown 14% of solution removed by P25, 20% by
the IPCA and 39% by the
smaller quantity of AC suggesting IPCA
adsorption is low. Dark
IPCA control is not shown. The IPCAs improved
performance over P25 could be adsorption.
(He et al.,
2009)
TiO2 prepared using a sol gel method. Impregnation
added GAC to this solution, followed by calcination.
GAC (2g/L) Anatase TiO2,
(P25 as reference)
Methyl orange (50
mg/L)
0.5L cylindrical glass (0.25L
solution) reactor inside equipped with an UV lamp
(365nm, output not stated)
with aeration.
Mixtures of
TiO2 and P25. None
for recycling
The most effective IPCA
(heat treated) is only marginally more effective
than a mixture of P25 and
AC suggesting the IPCA is ineffective. Uses pre-
saturation but not a dark
adsorption phase. The lack of a dark or adsorbent
control means it is unclear
if the removal is adsorption
or photodegradation.
(Wang et al.,
2009a)
Sol gel method used to prepare TiO2 solution. Varying
amounts of GAC were added to this solution which underwent hydrothermal treatment at 180°C for 8h.
Calcination at 600°C for 2h was the final step in IPCA
calcination.
GAC (2g/L) Anatase TiO2 Methyl orange (50
mg/L)
0.5L cylindrical glass (0.25L
solution) reactor using a central UV lamp (365nm,
300W) with aeration of 0.6
L/min.
Mixture of
TiO2 + AC
Mixture of TiO2 and AC
has mid range performance compared to the other
IPCAs. Includes
adsorption data that shows adsorption in 60min. No
dark adsorption stage after
(Wang et al.,
2009b)

214
pre-saturation. It is likely
that MO removal is slow adsorption after pre-sat as
degradation is expressed as
C/C0. Sol gel method used to prepare TiO2. Impregnation using
ultrasonication followed by heat treatment.
GAC (1.79g/L) Anatase and rutile
TiO2
Methyl orange (5 x
10-3 mole L-1 and
3,6,7,12,15 x 10-3 mole/L)
0.28L Photoreactor with 10 -
40W UV lamp (135 mW/cm2,
320–400 nm, peak: 365 nm) and aeration of 56 ml min-1.
Mixture of
TiO2 + AC,
TiO2, AC control for
recycling (20
cycles)
Dark adsorption (1h) not
shown but based on the
data in the text the 25% reduction in 1h the
“photodegradation” is in
fact residual adsorption. This relationship is
expressed as “Remnant
rate%”. Not clear that the mixture performs better
than IPCA. Not clear that
the AC recycle control was illuminated.
(Li et al.,
2005)
As above. GAC (2.5g/L) Anatase /rutile
TiO2, % ratios 1:0 and 35:65
Methylene blue (20
mg/L)
As above TiO2 and
IPCA dark and light.
No photolysis control
weakens case for IPCA action. The similar
adsorption performance of
the IPCA and TiO2 suggests the IPCA has very
poor adsorption.
(Li et al.,
2007)
Sol gel method was used to prepare TiO2. Impregnation using stirring followed by calcination.
GAC (2g/L) Anatase and rutile TiO2
Methyl orange (1 x 10⁻³ mol/L)
0.28L cynical Pyrex reaction cell (1.2cm inter diameter,
28cm height) containing 0.25L solution equipped with
an air-aerated stopcock, 40W
UV lamp, fixed in the middle of the quartz cell.
TiO2. No adsorbent control. Photolysis claimed to be
4%. Dark adsorption (30min) not shown and
may explain
“photodegradation”.
(Li et al., 2006)
As above. GAC (3.5g/L) Anatase to rutile
TiO2 in the ratio of 2.3.
Rhodamine B (RhB)
(1, 2.5, 5, 8 and 10 mmol/L)
UV Light intensity in 0.25L
Pyrex photoreactor: 0, 15, 25, 40 and 60mWcm−2 with
aeration (56mls-1)
None No “raw data” all kinetics.
30min dark adsorption.
(Li et al.,
2008b)
As above. GAC (2g/L) Anatase and/or rutile phase
Escherichia coli (1 × 10⁷ cfu/ml.) (E. coli,
NCIMB 8277)
IPCA was suspended in sterilised water using
ultrasonication and stirred.
Irradiation using a black light
fluorescent lamp. Volume not
given.
Photolysis & TiO2
Seems to decrease survivability. Results
expressed as survival rate
could mean that cfu’s were
still high after irradiation
time. Biofouling of AC ?
(Li et al., 2008a)

215
Sol gel method using a rotary evaporator was used to
prepare the IPCA.
GAC (0.19 g/L) TiO2 (phase not
stated)
Microcystin-LR
(cyanobacteria endotoxin) (50 -200
mg/L)
Cylindrical continuous flow
fluidized bed reactor (65cm h x 68cm inside diameter) with
a 4W black light lamp
(370nm, 0.6mW/cm2) containing 4.5kg IPCA/AC.
Photolysis,
Light & dark adsorbent
and IPCA
The comparison between
adsorption and illumination appears
convincing. However the
TiO2 could be leaching. Analysis section mentions
CO2 measurement but
nothing in the results about it.
(Lee et al.,
2004a)
As above. GAC (1 g/L) Anatase TiO2 Microcystin-LR (200
mg/L)
1L glass cylinder with a water
jacket for cooling. Irradiation was provided by a 4W black
light lamp (370nm, 0.6mW
cm-2).
Photolysis,
Light & dark adsorbent
and IPCA
Almost identical paper to
the one above paper. Uses desorption to claim
mineralisation.
(Lee et al.,
2004b)
Commercial TiO2 was loaded onto an ACF using an
epoxy resin followed by calcination.
ACF (5.7 g/L,
2.9 g/L TiO2 –
assumed volume of
solution, not explicitly
stated)
P25 (30 nm) Paper mill effluent 0.35L cylindrical
photoreactor with water
cooling jacket, 500W high-pressure Hg lamp (365nm)
and aeration
P25,
photolysis.
None for recycle.
Measures colour and COD
removal. Dark adsorption
not shown. Could be adsorption not
photodegradation.
(Yuan et al.,
2007)
As above. ACF (IPCA not stated, P25
same as above)
P25 (30 nm) b-cyclodextrin ((C2H10O5)7) (200
mg/L)
As above P25, dark adsorption.
None for
recycle.
P25 only compared to one IPCA for COD removal.
P25 has reasonably similar
(but more erratic) degradation rate compared
to the IPCA. Dark
adsorption and photolysis not shown. IPCA
adsorption better than
photodegradation but does not continue.
(Yuan et al., 2005b)
As above. ACF (1 g/L) P25 (30 nm) Methylene blue (85
mg/L)
As above P25 & dark
adsorption. None for
recycle.
No dark adsorption, the
first cycle of P25 is as effective as the IPCA.
Under illumination COD
decreases very quickly initially. Initial adsorption
is also very pronounced.
(Yuan et al.,
2005a)
50mg: 10mg TiO2 :AC were added in a suspended mixture. Not strictly an IPCA it is a synergistic
mixture.
PAC (0.6-2.4 g/L)
P25 Phenol (20 M) 0.1L pyrex photoreactor illuminated from below with
a 125 W high pressure Hg.
Circulating water cell with >349 cut off filter provided
water cooling.
TiO2, photolysis
and
adsorbent
The TiO2+AC and TiO2 display photodegradation
however the TiO2 displays
a much steeped degradation curve than the
TiO2+AC. However the
latter degrades the phenol
(Matos et al., 1998)
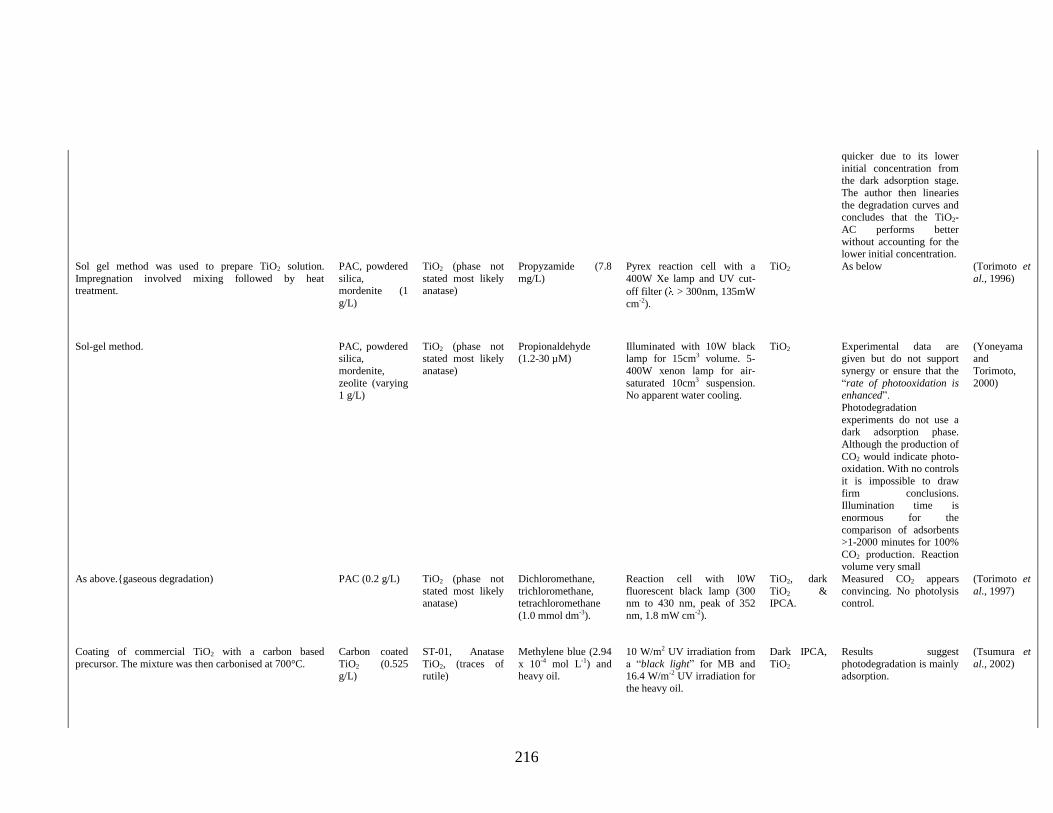
216
quicker due to its lower
initial concentration from the dark adsorption stage.
The author then linearies
the degradation curves and concludes that the TiO2-
AC performs better
without accounting for the lower initial concentration.
Sol gel method was used to prepare TiO2 solution.
Impregnation involved mixing followed by heat treatment.
PAC, powdered
silica, mordenite (1
g/L)
TiO2 (phase not
stated most likely anatase)
Propyzamide (7.8
mg/L)
Pyrex reaction cell with a
400W Xe lamp and UV cut-
off filter ( > 300nm, 135mW
cm-2).
TiO2 As below (Torimoto et
al., 1996)
Sol-gel method. PAC, powdered silica,
mordenite,
zeolite (varying 1 g/L)
TiO2 (phase not stated most likely
anatase)
Propionaldehyde (1.2-30 µM)
Illuminated with 10W black lamp for 15cm3 volume. 5-
400W xenon lamp for air-
saturated 10cm3 suspension. No apparent water cooling.
TiO2 Experimental data are given but do not support
synergy or ensure that the
“rate of photooxidation is enhanced”.
Photodegradation
experiments do not use a dark adsorption phase.
Although the production of
CO2 would indicate photo-oxidation. With no controls
it is impossible to draw
firm conclusions. Illumination time is
enormous for the
comparison of adsorbents >1-2000 minutes for 100%
CO2 production. Reaction volume very small
(Yoneyama and
Torimoto,
2000)
As above.{gaseous degradation) PAC (0.2 g/L) TiO2 (phase not
stated most likely anatase)
Dichloromethane,
trichloromethane, tetrachloromethane
(1.0 mmol dm-3).
Reaction cell with l0W
fluorescent black lamp (300 nm to 430 nm, peak of 352
nm, 1.8 mW cm-2).
TiO2, dark
TiO2 & IPCA.
Measured CO2 appears
convincing. No photolysis control.
(Torimoto et
al., 1997)
Coating of commercial TiO2 with a carbon based
precursor. The mixture was then carbonised at 700°C.
Carbon coated
TiO2 (0.525 g/L)
ST-01, Anatase
TiO2, (traces of rutile)
Methylene blue (2.94
x 10-4 mol L-1) and heavy oil.
10 W/m2 UV irradiation from
a “black light” for MB and 16.4 W/m-2 UV irradiation for
the heavy oil.
Dark IPCA,
TiO2
Results suggest
photodegradation is mainly adsorption.
(Tsumura et
al., 2002)

217
Sol gel method used to apply TiO2 to the surface of
Poly(Vinyl Butyral) (PVB) followed by heat treatment.
Poly(Vinyl
Butyral) (PVB) carbonised to
form an AC.
(0.6 g/L)
Anatase and rutile
TiO2 in the ratio of 1-0.3
Phenol (50 mg/L). Degradation experiments
were carried out under illumination from six UV
lamps with 20 W power.
Photolysis,
Dark adsorbent,
P25
IPCA adsorption is very
low. No TiO2 control. Degradation is
comparatively slow. P25 is
more effective than the best IPCA. AC stops TiO2
phase change.
(Tryba et al.,
2003a)
Sol gel method was used to prepare a TiO2 solution and impregnation used stirring, followed by calcination.
PAC (0.6 g/L) Anatase and Rutile TiO2 (depending
on calcination
temperature.)
Phenol (50 mg/L) Six lamps UV lamps were used to irradiate the solution
from the top.
Photolysis, light
adsorbent
The unmodified AC is almost as effective as the
best performing IPCA. “
(Tryba et al., 2003b)
Carbon precursor applied to P25. The composite was then
dehydrated and carbonised at 600 C.
Cellulose/TiO2 microsphere
composites (not
stated)
P25 (20 nm), ST-01 (7 nm)
Acetaldehyde (2000 mg/L)
Cell containing 3 cm3 reactant illuminated with two 4 W
black lights 300–400 nm)
Dark IPCA, TiO2, P25,
mixture
No dark adsorption phase and photolysis control.
After the first thirty
minutes the IPCAs performance is little more
than photolysis and
adsorption.
(Nagaoka et al., 2002)
As above. ACF (not
stated)
Anatase and rutile
TiO2
Methylene blue
(concentration not
stated)
Not stated (looks at reuse of
an IPCA)
None for
experiments
and none of recycle
Lots of characterisation but
no robust data.
(Fu et al.,
2006)
Sol-gel method used to prepare TiO2. Impregnated onto
the activated carbon cloth by dip coating followed by
calcination.
Activated
carbon cloths
(1.5 cm x 1.5
cm)
Anatase and rutile
TiO2.
Methylene blue (2.94
x 10-4 mol/L)
“UV irradiation” from a
365nm black light of 100 ml
solution
None Pre-saturation. Isotherms
but no raw data.
(Xu et al.,
2008)
Sol gel method was used to prepare the pure TiO2 and impregnate the AC. The solutions were then dried and
calcined at different temperatures.
PAC (1 g/L TiO2 and IPCA
containing the
same amount of TiO2)
Anatase and rutile TiO2 (P25 as
reference)
Chromotrope 2R (10-80 mg/L)
0.8L photoreactor with low pressure Hg vapour lamp
(Lamda max = 253.7 nm, 3 W
radiant flux)
Photolysis and TiO2
30 min dark adsorption. Between 6-70% of dye is
removed in the dark
adsorption stage and with no dark adsorbent control
it is impossible to
determine if the kapp is measuring adsorption or
photodegradation.
(Wang et al., 2007)
The IPCA’s were prepared by several methods, mechanofusion using a theta composer and boiling
impregnation (boiling dry a solution of TiO2 and AC).
PACs and GACs prepared
by different
activation
methods. (50-
30 mg/L, mass
in continuous flow system not
stated)
P25 Methylene blue (0.5-30 mg/L), Procion
red MX-B5 (reactive
red 2) (10-20 mg/L)
4-Watt low-pressure Hg UV lamp (approx 0.37 mW/cm2
for batch studies and 2
mW/cm2 for column studies)
Light adsorbent.
None for
recycle.
Only measures decolourisation. No
photolysis or P25 control.
Information seems patchy.
On p80 claims synergy.
Claims IPCA works better
after regeneration.
(Khan, 2002)
Sol gel method used to prepare a TiO2 solution, which was drip coated onto the ACF and calcined at 600 or
800 C in an N2 atmosphere.
ACF (2 g/L) Anatase TiO2 Methyl orange and acid fuchsine (120
mg/L)
0.25 L cylindrical photoreactor and water-
cooled quartz jacket with 500
TiO2 & dark adsorption.
None for
TiO2 is almost as effective as the IPCA in the first
cycle and is not used in
(Shi et al., 2008)

218
W high-pressure Hg lamp
(365 nm, 12.5 mW cm-2) and aeration.
recycle. subsequent cycles.
Adsorption data is incomplete. Suggests
IPCA performance is
adsorption and photolysis The WO3–TiO2 photocatalyst was prepared by a sol gel
method. Impregnation involved stirring and calcination.
GAC (20 g ?
not stated)
WO3–TiO2
(Anatase TiO2)
Congo Red (10-50
mg/L with H2O2
addition.)
2.5 L “fluidized bed
photoreactor” containing 2 L
solution with 500 W high-pressure Hg-vapour lamp and
aeration (0.2 m3 h-1)
None. Mentions
photodegradation
efficiency. Impossible to determine if substrate
removal is
photodegradation or adsorption.
(Sun et al.,
2009)
P25 was added to an epoxy resin solution and drip coated
onto an ACF and then calcined.
ACF (1 g/L
TiO2, 6.4 g ACF not incl
TiO2 loading)
P25 Methylene blue
(85 mg/L)
0.35L cylindrical
photoreactor with a water-cooled quartz jacket and
500W high-pressure Hg lamp
(365nm)
P25, none of
recycle.
Reproducibility seems
poor. P25 as effective as the IPCA.
(Yuan et al.,
2005c)
Various quantities of commercial TiO2 and AC were
mixed in an aqueous solution and stirred for 1 hr before
filtration.
Activated
carbon (form
not stated) (2 g/L TiO2 &
“proportionate
AC concentration
was used for
the other catalyst)
P25 Phenol, salicylic
acid, 4-aminophenol
or p-nitrophenol (100 mg/L)
0.25L photoreactor(s) with air
sparging (100ml min-1) and
irradiated with a “UV lamp”. Natural sunlight was also
used (no further information
given)
TiO2 No raw data all linear
transforms. No photolysis
control. TiO2 is compared for sun and UV light. FTIR
data convincing however.
(Araña et al.,
2003a, Araña
et al., 2003b)
Sol gel a method was used to prepare the IPCA. Impregnation involved stirring and was followed by
calcination.
PAC (1 g/L) Anatase TiO2 (P25 as reference)
Phenol, methyl orange (MO) and
Cr(VI)
(Concentration not stated)
Cylindrical quartz photoreactor containing 0.25
L solution (with water
cooling jacket) and an 8W UV lamp (365 nm) position.
TiO2,, TiO2 control for
recyle.
30 min dark adsorption, results expressed as C/C0.
Very low adsorption in
dark adsorption stage. Photodegradation appears
noticeably higher after the
start of illumination for the three contaminants.
(Liu et al., 2007a)
Commercial TiO2 powder was carbon coated by mixing
with polyvinyl alcohol in different mass ratios. The resulting IPCA was then calcined.
Carbon-coated
anatase powders (0.5
g/L)
Anatase TiO2 (ST-
01)
Methylene blue
(3.2×10⁻⁵ mol dm−3)
Photocatalytic membrane
reactor (PMR) with direct contact membrane distillation
and Hg UV lamp (355 nm,
146.1 W m−2 at irradiation
plate).
Photolysis,
TiO2 for 2 recycle.
No error bars so it appears
that ST-01 is nearly as effective as the best
performing IPCA with and
without membrane
distillation.
(Mozia et al.,
2007b)
The Fe was added to the ACF by dip coating. The Fe-
ACF was then added to a solution of TiO2 precursor and
stirred followed by vaporisation and calcination at 700 C.
Fe-ACF (5 g/L) Mixture of anatase
and rutile TiO2
Methylene blue (1.0
x 10-5 mol/L)
UV lamp above the solution
(20 W, 365 nm)
Adsorbent,
IPCA.
Dark adsorption not shown
and consist of 3 mins of sonication. MB removal is
not clear as it the shows
UV spectrum and not concentration.
(Oh et al.,
2009)

219
Liquid phase deposition used to apply TiO2 to the ACF.
The ACF was then dried and annealed at high temperature.
ACF (weight
not stated – 3 mm thick)
Anatase TiO2 Acid Orange II
(AOII) (50-200 mg/L)
Photoreactor consisting of
quartz reactor irradiated by a 15W germicidal lamp (90%
output at 253.7nm). The
IPCA was used as the photoanode, Pt wire used as
the counter electrode.
Photolysis,
dark and light IPCA,
electrochemi
cal oxidation & combined
photo and
electro chem
Dark adsorption of TOC
and substrate is half as effective as IPCA.
Combined process is
additive and not synergetic. Intermediate
removal via HPLC. No
dark adsorption stage and no error bars.
(Hou et al.,
2009)
A sol gel method was used to prepare carbon coated TiO2.
The resulting solution was dried, pulverised and calcined.
Carbon coated
TiO2 (0.33 g/L)
Anatase and rutile
TiO2
Methylene blue (1.6
x 10-5 M).
UV light bulb (0.5 mW/cm2,
364 nm) and visible light from an incandescent light
bulb (13.6 mW/cm2). LEDs
used to provide lighting for NO degradation
Visible and
UV photolysis,
TiO2.
Measures decolouring of
MB, adsorption peak shifts significantly over time.
Amount of MD irritated is
tiny. Degradation is measured using UV-vis
spec at a single wavelength
for linearised results.
(Treschev et
al., 2008)
Electrophoretic deposition was used to apply a suspension
of P25 and AC to a conductive glass plate electrode. The
electrodes were then placed in an oven and heated in air at 450°C for 30 min.
PAC (not
stated)
P25 Orange-II (OG-II)
(50 mg/L)
Glass reactor with direct
illumination by a low-
pressure mercury vapour UV lamp (75 mW/cm2, λ = 365
nm).
TiO2. No dark adsorption,
removal rate of IPCA
small (30%) likely due to adsorption. Measures H2O2
production.
(Peralta-
Hernández et
al., 2007)
Commercial TiO2 was carbon coated by exposing it to ethanol vapours for 1hr in temperature ranging from 150
to 400 C.
Carbon coated TiO2 (0.1 g/L)
Tytanpol A11 (Police, Poland)
and P25 (Degussa,
Germany)
Phenol (100 mg/L) Artificial solar light was provided by using a 100 W
lamp (354W/m2 visible, 0.09
W m-1 UV) and UV light was provided by 6, 20 W UV
lamps (100 W/m2 visible, 154 W m-2 UV)
P25, A11 in visible and
UV.
15min dark adsorption. Does not show phenol
decomposition v time (24h
vis/5h UV). Measures functional group
decomposition. Under UV no decomposition reaction
is higher than 50%.
Photolysis seems as effective as the IPCA.
(Janus et al., 2006)
A sol gel method was used to prepare TiO2/ACF
composite. The gel was then dried and then calcined.
ACF (weight
not stated)
Anatase and rutile
TiO2
Toluene (20mg/L) Solution was irritated with a
500 W high pressure mercury lamp (380 nm).
TiO2,
adsorbent.
Measures TOC. Adsorbent
has 80% of the effectiveness of the IPCA
since photolysis is not
shown it is likely there is no synergy.
(Liu et al.,
2006)
A sol gel method was used to prepare F doped TiO2.
Impregnation used ultrasonication.
PAC (1 g/L) F doped anatase
TiO2 (brookite
traces)
Phenol (25mg/L) 0.2 L silica photoreactor with
250 W halogen lamp with a
light filter cutting <400 nm
(11.3 mW cm-2)
P25, TiO2, F-
TiO2 doped
IPCAs,
Photolysis
(not shown)
Regular IPCA no more
effective than P25. 30min
dark adsorption.
Concentration as C/C0
based on the adsorption data in the text the F-IPCA
has more adsorption
capacity causing the “photodegradation”
(Xu et al.,
2008)

220
Commercial TiO2 was impregnated on the ACF by stirring
and then ultrasonication. The resulting IPCA was then calcined.
ACF (not
stated)
Anatase TiO2 Methylene blue (100
mg/L)
Lamp fitted along reaction
cell and the ACF was fixed horizontally along the
reaction cell (no information
on power output or lamp type).
Photolysis,
dark adsorption,
No control
for recycle.
No synergy, IPCA
performance has the same shape as photolysis plus
adsorption.
(Jia et al.,
2007)
Commercial TiO2 was impregnated onto the PAC using
ultrasonication. N doped IPCA was prepared by adding saturated urea to the TiO2 suspension and then following
the procedure outlined above.
PAC (200 g/L ) Anatase TiO2 Soman, VX, and
Yperite (concentration not
stated)
Photoreactor (size not stated)
consisting of a closed quartz tube flushed with air
(50cm3min-1), 125W high-
pressure black-bulb lamp
( 365 nm, 3.0W UVA 315–
400 nm).
TiO2
The degradation of the
substrate over IPCAs (1-25% wt TiO2) is greater
than unmodified TiO2 is
the only evidence put forward to demonstrate
synergy. There is N2
isotherm data in the paper but no empirical data on
adsorption so the proposed
synergy could be little more than AC adsorption.
The N-doped titania
appears to perform better than the unmodified TiO2
although it was heat treated
and the unmodified TiO2
was not so they are not
directly comparable
(Cojocaru et
al., 2009)
Commercial TiO2 powder was coated with Poly(vinyl alcohol) and then carbonised. The powder was then
adhered onto organic adhesive tape or a film using an organic binder.
Carbon coated TiO2 (not
stated)
Anatase TiO2 (ST-01)
Methylene blue (2.94 x 10⁻⁵ mol/L)
3x20 W UV light bulbs where placed 200mm from the IPCA
tape or film.
None for recycle.
No controls and results expressed as C/C0.
Impossible to determine anything.
(Inagaki et al., 2006)
Commercial TiO2 was applied to the GAC using
ultrasonication. Commercial TiO2 was added to a chitosan solution and cast into beads by a “phase-inversion
technique”.
GAC (0.25-1.5
g/L)
Anatase TiO2 Salmonella
choleraesuis subsp. ATCC 14028 (108
cfu ml-1)
1L batch photoreactor with
20W high pressure mercury lamp (320–400 nm)
Dark TiO2,
Photolysis, TiO2, dark
adsorbent
Removal using TiO2 is
slightly more effective than either IPCA. No mention
of dark adsorption.
(Kim et al.,
2005)
Sol gel method was used to prepare the entire IPCA
followed by heat treatment at 200 C in air.
GAC (50 g fluidised bed
system)
Anatase TiO2, rutile and brookite
traces
Colour (organics absorption at 254
nm)
Adsorption was carried out separately. UV regeneration
using six 18 W UV-A or UV-
C lamps and/or ultrasonic bath
Adsorbent control for
adsorption.
No fresh or used AC for
Recycle.
No photolysis control, regeneration experiments
do not prove anything due
to a lack of controls. Only demonstrates adsorption by
the IPCAs and ACs.
(Zhu and Zou, 2009)
Sol gel processes was used to prepare separate solutions
of ZnFe2O4 and TiO2. The latter solution was added drop
wise to the ZnFe2O4. GAC was then added to the
combined solution and shaken for 12h and dried. The samples were then calcined at 500°C for 2 h.
GAC (20-40 g) Anatase TiO2
doped with
ZnFe2O4
Acid dye - brillred-
RH (5-20 mg/L)
“Recycle fluidized bed
reactor” with 150 W visible
light source.
Adsorbent. No raw data, all linearisied
results. GAC is almost as
effective as IPCA.
(Wang et al.,
2009b)
CdS P25 was prepared by a sol gel and a precipitation
method. These catalysts were applied to ACFs using an adhesive and dip coating.
ACFs (not
explicitly stated)
CdS doped P25 Methylene blue (50
mg/L)
75mm x 50mm piece of the
IPCA were put 100mL flasks and exposed to sunlight for 5h
TiO2 CdS doping of the TiO2
increased its absorbance in the visible spectrum and
the doped IPCA performed
(Zhao et al.,
2010)

221
better than the P25 IPCA.
However a comparison of plain and doped TiO2
under illumination from
sunlight was not reported so it is impossible to know
if the doping created a
more effective TiO2 under solar illumination
conditions.
Sol gel method used to prepare the doped TiO2. This solution was added drop wise to the ACF. Followed by
calcined at 600 - 800 C in N2.
ACF (not stated)
Fe(III) and Ho(III) doped TiO2
Methyl orange (120 mg/L)
0.25L cylindrical vessel with a water-cooled quartz jacket
with a 500-W high-pressure
Hg (365 nm). Aeration was used.
None, none for recycle.
Raw data expressed as C/C0. No proof.
(Shi, 2009)
Sol-gel method used to prepare Fe(0) doped TiO2. ACF
was dip coated using this solution and calcined at 200 C for 2h.
ACF (not
stated)
Fe(0) TiO2 (phase
not stated)
2,4-dichlorophenol
(10-100 mg/L)
Cylindrical quartz tube
30cm×3cm (height×diameter) with a 20W germicidal low-
pressure Hg lamp ( max 254
nm, 92 W/cm2 at 365 nm)
TiO2, Fe(0).
None for 7 recycles.
Photolysis is not shown but
it would seem to be very effective. 60min dark
adsorption.
Photodegradationand TOC removal likely adsorption.
(Liu et al.,
2009)
The IPCAs were obtained by mixing P25 and activated
carbon at different proportions in water and stirred for 3 h followed by filtering and drying.
PAC (1g/L) P25 Pentafluorobenzoic
acid (100-600 mg/L)
175 cm3 immersion type
photoreactor with either a 16
W low pressure Hg lamp (
253.7 nm, photon flux:
2.54×10⁻⁵ Einstein L−1s−1) or 8 W medium pressure Hg
lamp ( 365 nm, photon flux:
2.08×10⁻⁶ Einstein L−1 s−1). Aeration 8.1 mLs−1
AC+P25,
P25, two wavelength
used.
Only measures
defluoridation. No dark adsorption or photolysis.
P25 as effective at 254nm.
(Ravichandra
n et al., 2010)
A commercial solution of amorphous TiO2 was applied to either a plain PET film or a PET film with GAC adhered
to it using a silicon binder. The GAC film was sprayed
with the TiO2 and dried a total of five times.
GAC (not stated)
Anatase TiO2 2,4-dinitrophenol (1 to 250 mg/L)
Batch-recirculation flow system with 6 W blacklight
blue fluorescent lamp ( 300–
400 nm).
TiO2, light & dark AC and
IPCA. None
for recycle.
No photolysis, no synergy, IPCA only delivers a
minuscule improvement in
performance compared to AC. Looks at the effect of
temperature.
(Cao et al., 2010)
As above As above (not explicitly stated
- TiO2 content
between 0.09
and 0.12 g)
As above 2,4-dinitrophenol (5-80 mmol/m3)
As above TiO2 Looks at degradation products, no significantly
new data. No synergy
although it is claimed.
(Cao and Shiraishi,
2010)
Sol gel method used to prepare a TiO2 solution. The ACF
was impregnated with TiO2 by immersing it in this
solution for 1h followed by calcination at 500°C in an Ar atmosphere.
ACF (1-3 g/L) Anatase TiO2 Phenol, methyl
orange (7-80 and 120
mg/L respectively)
Quartz reactor with Hg UV
lamp (300 W,λmax 365 nm)
TiO2, light
and dark
adsorbent. None for
No photolysis control.
Suggests that IPCA is
more effective than TiO2 although synergy is not
(Yao et al.,
2010)

222
recycle proven. 60min dark
adsorption, results given as C/C0 or % removal.
P25 was added to an acetone and epoxy solution and
stirred vigorously. Prewashed GAC was added to this solution. The suspension was filtered, washed and dried.
Followed by calcination at 500°C for 2h in an N2
atmosphere. These processes were repeated once to yield the final IPCA.
GAC (2.5 g/L) P25 Rhodamine B
(5×10⁻³ mol/L)
Photodegradation
experiments used a Pyrex reaction cell aerated at 0.6
L/min. A UV lamp was fixed
in the middle of the quartz cell (light intensity varied
between 50-200W).
None Extended discussion of
kinetics of IPCA action. Contains no raw data (only
linearised graphs) and the
kinetic examples incorporate no photolysis,
TiO2 or adsorbent controls.
(Zhang et al.,
2011b)
Catalyst I: TiO2 deposited on cellulose fibers. Catalyst II: A composite of a layer of cellulose fibers with deposited
TiO2, a layer of carbon fibers and a layer of cellulose
fibers. Both catalysts were rinsed for 12 h by deionised water
Commercial photocatalyst
fibres from
Ahlstrom (France) (not
stated)
Commercial TiO2
(type not stated) Basic red 46 (10 and 25 mg/L)
PTFE (polytetrafluoroethylene)
coated flat plate photoreactor
inclined at 30 with two 15W
UV lamps (emission = 365
nm) or 2 visible light lamp.
Natural sunlight was also used (180 - 190 W/m2).
None Results expressed as decolourisation.
(Mounir et al., 2007)
Sol-gel method used to prepare TiO2. The ACF was then
added to this solution and stirred vigorously for 1h. The
IPCA was then dried and calcined at 900 C for 2h in an
N2 atmosphere.
ACF (1.25 g/L) TiO2 (type not
stated)
Methyl orange (80
mg/L)
0.2 L pulsed discharge reactor
with aeration (oxygen flow rate of 96 L h−1). UV light
generated by the pulse
discharges, irradiating a suspended ACF IPCA.
Photolysis No comparison except that
the IPCA increased system efficiency by 58%
compared to photolysis.
(Zhang et al.,
2010)
Sol-gel method was used to prepared Fe doped TiO2 using
Fe(NO3)3 and tetrabutyl orthotitanate. Ultrasonic impregnation was used to apply the doped TiO2 to the
AC. The dried IPCA was calcined at 250 C in air and
then 500 C in N2.
GAC (2-12 g/L) Fe-TiO2 (anatase
and rutile TiO2)
Wastewater (from a
“dye factory”, municipal wastewater
was also used )
Continuous flow 6.3 L
stainless steel cylindrical photoreactor with 2 UV
lamps mounted in the centre.
Aeration (56 mL/sec) was used.
TiO2. None
for recycle.
Results expressed as COD
or colour remnant %. TiO2 is quite effective. Dark
adsorption is not
mentioned. No control, no proof.
(Li et al.,
2010)
Boiling impregnation was used to apply commercial TiO2
to the adsorbent. These were then heat treated at 550 C
GAC, glass beads, zeolite,
brick, quartz.
(1.2 g/L)
P25 Propoxur (4.78x10⁻⁴ M)
1 L double-jacked vessel with a quartz cover. UV irradiation
was provided by three 10 W
low pressure Hg lamps (peak
: 254 nm) above the reactor.
Dark and light
adsorbent.
Results expressed as C/C0. No TiO2 and photolysis
controls. Unclear if IPCA
is actually an adsorbent.
(Lu et al., 1999)
V doped titania (VTO) was prepared using a sol gel
method. Ultrasonic impregnation was used to apply the VTO to PAC. This IPCA was then applied using dip
coating to a glass plate.
PAC (not
explicitly stated)
V-doped titania X-3B (50 mg/L) 1.2 L cylindrical silica batch
photoreactor system with 250 W halogen lamp (filter
cutting off <400 nm) and
vertical aeration with IPCA
placed on the bottom of the
reactor.
Photolysis,
P25, doped TiO2
30min dark adsorption.
Results expressed as C/C0. Dark adsorption not
shown. IPCA performance
could be adsorption.
(Xu et al.,
2010)
Solution of P25 was applied to the AC and carbon foam by mixing in a rotary evaporator followed by drying.
Carbon form prepared by acid modification of coal tar
pitch followed by heat treatment at 600 C in N2 and then
stream activation at 800 C for 1h
“Carbon foams” & GAC
(1 g/L)
P25 Phenol (100 mg/L) 0.4 L photoreactor with 125 W high pressure Hg lamp
vertically suspended in a
cylindrical quartz cooling jacket.
Light and Dark IPCAs,
P25.
No photolysis control. Results expressed as C/C0
Comparison table of other
work. No dark adsorption, unclear if IPCA actually
(Velasco et al., 2010a)

223
photodegrades. Includes
intermediate analysis.
IPCA prepared by rotary evaporating a mixture (15:85) of
P25 and AC. All samples were washed with DI water and
dried at 110 C
GAC (1 g/L) P25 Phenol (10 mg/L) 0.4 L photoreactor with 125
W a high pressure Hg lamp
vertically suspended in a cylindrical, double-walled
quartz cooling jacket.
Adsorbent
(light and
dark), TiO2, Photolysis
The study lacks a
photolysis control and it is
unclear if there was an adsorption phase before
UV illumination. The AC
performs better in the dark than the IPCA, however it
performs better under UV
illumination. The author attributes this to
photoactivity of the
unmodified AC possibly due to its ash content
(11%). It is proposed that P25 has an antagonistic
effect on the AC (Fig 3.) in
the IPCA in the first hour and half of irradiation that
is overcome by the
photoactivity of P25. No error bars are given and the
experimental method does
not mention if the
experiments were repeated.
The authors claim that
IPCAs “modify the phenol photodegradation
pathway” as evidenced by
the different ratios of intermediates in the IPCA
and P25 photodegradation
samples. It is noted however, that the
difference is probably due
to absorption of intermediates onto the AC.
(Velasco et
al., 2010b)
As above GAC (1 g/L) P25 As above As above Light and
Dark IPCAs,
P25.
Graphs are expressed
differently however raw
data appears the same.
(Velasco et
al., 2010c)
A sol-gel method was used to prepare N doped TiO2. PAC
was then added to this solution and stirred followed by filtration to remove the IPCA which was calcined at
400 C in N2
PAC (0.25 g/L) Anatase TiO2 with
traces of brookite.
Bisphenol-A (36
mg/L)
0.25 L solar simulator
equipped with a 150W Xe arc lamp (Light intensity 1000
W/m2, UV/Vis intensity
approx 6.5%/40%). Additional light filters used to
TiO2, P25. Results expressed as C/C0
or efficiency (%). 1.5h dark adsorption not shown.
No photolysis or dark
IPCA controls. Effectiveness of different
(Yap et al.,
2010)

224
control certain wavelengths. light wavelengths
compared.
Chitosan/ACF composite films were prepared by adding
the ACF to a chitosan and pore forming agent solution. A
separate sol gel TiO2 solution was prepared and applied to the Chitosan/ACF using dip coating.
Chitosan/ACF
(Not explicitly
stated)
TiO2 (phase not
stated)
2,4–Dichlorophenol
(1-50 mg/L)
On-site regeneration: 0.1L
solution irritationed with 20W
UV light ( 254nm). Off-site regeneration: IPCA was
dipped in distilled water in a
shallow tank reactor under the same light source. Fenton
reagent was also investigated
for regeneration
Membrane
and C/ACF.
Membrane control
included for
recycle.
Results expressed
%removal. No TiO2 or
photolysis control. The adsorbent without TiO2 is
almost as effective as the
IPCA.
(Liu et al.,
2010)
Prepared by a one-step carbonization (at 450 C under
vacuum) of a self-assembled matrix consisting of titanium
tetra-isopropoxide and a triblock copolymer.
Form not stated
(0.25 g/L)
C doped Anatase
TiO2
Methylene blue (10
mg/L)
0.025 L (w/ 20 ml solution)
quartz photochemical reactor
with 150 W Xe lamp (180 mWcm-2) with UV-cut off
filter (<400 nm)
None Comparison between dark
adsorption and the start of
illumination appears convincing but there are no
controls.
(Lee et al.,
2010)
Ultrasonication used to apply P25 to GAC followed by oven drying, filtering and washing.
GAC (1.2 g/L) P25 Indomethacin (0.1 to 1.5 mmol/L)
1 L photoreactor and water cooled immersion well with
125 W medium pressure Hg lamp.
Photolysis, None for
recycle.
No P25 control. Convincing comparison
between dark adsorption and photodegradation.
(Basha et al., 2010)
Ultrasonication used to apply P25 to GAC followed by
oven drying, filtering and washing. Heat treatment
between 200 C - 700 C.
GAC (1.5 g/L) P25 Famotidine (50
mg/L)
1 L photoreactor and water
cooled immersion well with 125 W medium pressure Hg
lamp.
Photolysis. No P25 and dark adsorbent
control. Results expressed as remnant%, no error
bars.
(Keane et al.,
2010)
Two methods a conventional sol-gel method using a
triethylamine as a visible light sensitiser and a self
assembly method using poly(sodium styrene sulfonate) to
modify the AC surface and then adding N-TiO2 that was treated to have the opposite charge.
PAC (0.3 g/L) Anatase TiO2 Humic acid
(molecular weight
>2000 Da) (11.2
mg/L)
0.2 L cylindrical photoreactor
with 100 W Xe lamp (420-
630 nm, 570 mW)
TiO2s, Dark
IPCA. None
for recycle.
Results expressed as C/C0.
Useful XRD information.
Lacks necessary controls.
IPCAs and TiO2 results appear to be expressed the
same way using different
notation. Places great emphasis on surface
chemistry, the self
assembly IPCA works much better than the sol
gel.
(Zhang et al., 2011a)
Sol-gel method used to prepare TiO2. The AC was dipped in the TiO2 solution followed by drying and calcining at
300 C in N2 for 2h. This procedure was repeated up to 5
times, prior and a final cycle where the temperature, was
held at 500 C.
GAC (2 g/L IPCA, 0.4 g/L
TiO2)
Anatase TiO2 Humic acid (15 mg/L -5.04 mg/L TOC,
TOC 1.7-19.4 mg/L)
Photoreactor containing 0.5 L solution with a water-cooled
quartz jacket and a 500 W
mercury lamp (major
emission at 365 nm, 12.5
mW/cm2)
Photolysis, Mixture,
TiO2
Results expressed as C/C0 or % remnant. IPCA seems
to perform better than the
mixture and TiO2 however
there is no dark adsorption
and photolysis is not on the
same graph. It appears convincing however the
difference in TOC between
the IPCA and TiO2 is 20% or about 1mg/L so it may
(Xue et al., 2011)

225
not be significant. The
demonstration of “synergy” is not robust.
Separate adsorption
studies. L-M model. Sewage sludge was activated by 5M ZnCl2 and pyrolysed
in N2 atmosphere at 650ºC for 60min followed by
treatment with 1M HNO3 solution and washing with distilled water Mixture of 0.1 to 10 g/L AC and 0.001 to 8
g/L P25, Not IPCA, synergistic mixture.
GAC (0.1 to 10
g/L, )
P25 Hg(II) 10-120 mg/L 0.2 L cylindrical quarts bottle
irradiated with 16-light
Rayonet Photochemical Reactor (253.7 nm)
Light and
dark TiO2,
AC and IPCA.
No photolysis or
illuminated AC controls.
Mixture appears more effective than TiO2 or AC.
(Zhang et al.,
2004)
Mixture of TiO2 and AC, not IPCA synergistic mixture.. 5mg TiO2:5mg AC approximately 334mg/L IPCA.
PAC (167 mg/L)
P25 Cytarabine (50 mg/L) (Antineoplastic
pharmaceutical)
0.03 L solution irradiated with a 700 W medium
pressure Hg lamp (238-334
nm, I0 = 3.75×10⁻⁷ Einstein s−1).
(measures Pzc bubbles N2 through the solution)
Results expressed as C/C0.
Degradation of combined system is very effective, no
robost demonstration of
synergy.
(Ocampo-Pérez et al.,
2011)
The IPCA impregnation method applied a Ti precursor to
the AC which was then placed in water vapour. For
comparison a sol–gel method was also used to apply TiO2
to the AC. Both methods were followed by calcination at
400°C for 3h in vacuum.
PAC (0.04 g/L
TiO2 and
approx 0.5 g/L IPCA
containing 8%
TiO2)
Anatase TiO2 (N
doped TiO2
prepared in another
paper(Huang et
al., 2011a))
Methylene blue
(1×10⁻³ mol/L)
0.1 L of solution illuminated
with a halogen lamp (no other
information given)
Photolysis,
TiO2
10h dark adsorption, Only
one comparison and no
error bars. No adsorption time after a new solution
was added after dark
adsorption. It is likely that the photodegradation is in
fact residual adsorption.
(Huang et
al., 2011b)
Commercial TiO2 powder was dissolved by hydrofluoric acid. The precipitate was mixed with PAC. A separate
phenol solution was prepared and added to the TiO2/AC. Formaldehyde was added to the phenol carbon titania
slurry followed by calcinations at 500 C for 5h in N2.
PAC (10 g/L) Commercial TiO2
(SD fine
chemicals)
Phenolic syntan (50-1000 mg/L)
0.5 L quartz tube filled with 0.1 L solution illuminated by
five 25 W UV lamps (λ 254 nm)
Photolysis Results are average values. No TiO2 or adsorbent
control. 8h pre-saturation but no dark adsorption
time.
(Aruldoss et al., 2011)
Ultrasonication used to apply P25 to GAC followed by oven drying, filtering and washing.
GAC (1-2.5 g/L)
P25 Amoxicillin (149.6–151.1 mg/L)
1 L photoreactor and water cooled immersion well with
125 W medium pressure Hg
lamp.
TiO2, light AC, None
for recycle.
Convincing comparison between dark adsorption
and photodegradation.
Leaching from IPCA.
(Basha et al., 2011)
Sol gel method used to prepare the TiO2. The AC was
added to the solution and the coating was repeated twice.
Finally the vacuum-dried precipitates were calcined using a variety of temperatures and atmospheres.
PAC (0.25 g/L) Anatase and rutile Bisphenol-A (36
mg/L)
0.25 L “solar simulator” with
a 150 W Xe arc lamp.
P25, Dark
adsorption
Aeration not used because
it can cause evaporation.
Looks at effect of aqueous matrix species on BPA
photodegradation in terms
of kapp. Greater than 90%
removal occurred in 8h. No
raw data.
(Yap and
Lim, 2011)

226
As above PAC (0.15-
0.35 g/L)
As above As above As above, dichroic mirrors
were used to control light λ to 280–400 nm and visible-light
illumination (420–630 nm).
Photolysis,
Sunlight, dark
adsorption.
None for controls.
Results of C/C0. No
adsorbent or TiO2 controls.
(Yap et al.,
2011)
Carbon fibre was activated with nitric acid followed by
washing. The carbon fibres were then dipped into a Pd
solution followed by a SnCl2 solution. TiO2 sol was prepared using a sol gel method with dip-coating for
impregnation. The coated carbon fibre was calcined in N2
at 600 C
PAN carbon
fibre (not
explicitly stated)
Anatase TiO2 Acid orange II (100
mg/L)
0.025 L Pyrex tube irradiated
with a 500 W Hg lamp.
Non-doped
IPCA, None
for controls.
No photolysis or adsorbent
controls. Photodegradation
mainly takes place in the first 15min so is likely
adsorption as there is no
dark adsorption time.
(Zhu et al.,
2011)
Sol gel method used to prepare Sn(IV)TiO2. Tin
tetrachloride was added to Ti precursor followed by AC
(activated by nitric acid) addition. After drying the IPCA were calcined between 450-600°C. The dip coating
followed by calcination was repeated twice. The IPCA
was then cleaned using ultrasonication
GAC (5-15 g/L) Anatase and rutile
TiO2
Orange G (azo dye)
(10-60 mg/L)
2 L fluidized bed
photoreactor with 300 W
high-pressure Hg (λ max at 365 nm). 2.5L solution
flowed through at 0.3L/min
with H2O2 addition. Aeration of 0.2 m3/h. at a flow rate of
0.3 L/min.
None. Dark adsorption and error
bars not shown. No
controls no evidence. H2O2 addition complicates
interpretation of the
results.
(Sun et al.,
2006)
Sol gel method was used to prepare the TiO2. AC was added to this solution and mixed for impregnation. The
IPCA was then dried and ground down and calcined 4-
600°C different temperatures under N2 atmosphere.
PAC (0.5 g/L) Anatase TiO2 Acid Red 88 (azo dye) (not stated ?)
0.3 L photoreactor with 9W black-light (max λ 365 nm).
In organic ions were added as
sodium salts at 1×10⁻⁴ mol/L.
None, None for recycle.
Overnight pre-saturation not shown. Results
expressed as % removal.
Addition of inorganic ions is interesting as they
decrease performance.
(Gao et al., 2011)
Laboratory prepared AC. TiO2 nanoparticles were mixed with the AC and applied to the inside of the photoreactor
using a UV resistant binder.
PAC (not stated)
Commercial TiO2 Basic Red 18 and Basic Red 46 (azo
dye) (0.128 mM and
0.120 mM)
5 L Pyrex photoreactor with two 15 W UVC lamps (200–
280 nm). IPCA was adhered
to inside surface.
TiO2, UV spec.
Results expressed as C/C0. No control for H2O2
addition. Measurement of
intermediates and anions.
(Mahmoodi et al., 2011)
Sol gel method was used to prepare TiO2. Impregnation
using stirring followed by calcination at 500°C. Butyl
alcohol used as a “plugging agent”.
Not stated Mixed phase TiO2 Acid Red 27 (not
stated)
0.28 L cynical Pyrex reaction
cell (1.2 cm inter diameter, 28
cm height) containing 0.25 L solution equipped with an air-
aerated stopcock, 40 W UV
lamp, fixed in the middle of the quartz cell.
TiO2, P25 Dark adsorption not
shown. No dark IPCA
control. Results expressed as % remaining after t=0.
No evidence of synergy.
(LI et al.,
2011)
Sol gel TiO2 applied using ultrasonication. Followed by
ageing and calcination at 350 - 600°C for 5h.
PAC, GAC and
MWCNT
Mixed phase TiO2 Acid Blue 92 (AC
and MWCNTs) Wastewater
Concentration not
stated
Pyrex reactor with 125 W
high-pressure Hg lamp) with cooling water jacket.
None Dark adsorption time not
shown. No controls for dye or wastewater studies. No
proof of photodegradation.
(Zarezade et
al., 2011)
TiO2 prepared using sol gel method. GAC was added to
this solution for 1h and then dried. Followed by
calcination at 500°C.
GAC (8 g/L, 1
g/L for TiO2
control)
Anatase TiO2 Arsenite (As(III)) (3
mg/L)
0.2 L quartz tubes with 125
W UV Hg lamp (λ max 365
nm) containing 0.1 L of
Adsorbent,
TiO2 control.
Significant loss of BET
surface area in IPCA. Very
little difference with TiO2
(Yao et al.,
2012)

227
solution. control. Dark adsorption
not shown. Improved IPCA performance is likely
adsorption. Appears to
photodegrade but no evidence of synergy.
TiO2 prepared by hydrothermal or reflux sol gel method.
AC was added to sol gel solution and dried to create IPCA.
laboratory
prepared PAC (0.5g/L)
Anatase TiO2 Rhodamine B (50
mg/L)
0.05L suspension irradiated in
a solarbox with Xe lamp (690W/m2).
Photolysis,
adsorbent, TiO2
1:10 IPCA is best
performing. IPCAs show very little adsorption. Only
the IPCA prepared by the
reflux method shows promise and the difference
between the IPCA and AC
is likely just photolysis.
(Asiltürk and
Şener, 2012)
AC and P25 in a given ratio were added to 1.5M HNO3
solution in a Teflon reactor and heated to 150°C. The
resulting IPCA was then washed and dried.
GAC (0.4-1.2
g/L)
P25 Reactive black-5 (20-
130 mg/L)
0.5 L cylindrical photoreactor
(25 cm × 8 cm) with 125 W
low pressure Hg lamp (340–400 nm) containing 0.25 L
solution.
TiO2, P25 No photolysis or dark
adsorbent controls. Dark
adsorption time shown. Results expressed as
percentage removal.
Performance not much higher than AC
(Mahadwad
et al., 2011)
Sol gel method used to prepare Er3+:YFeO3-doped TiO2.
GAC was added to the solution during ultrasonication and then dried and calcined between 400-800°C
GAC (20 g/L)
(spherical activated
carbon)
Mixed phase
Er3+:YFeO3-doped TiO2
Methyl orange (500
mg/L)
0.05 L solution with 18W-
LED lamp (455 nm and 553 nm).
Dark IPCA,
Dark adsorbent,
Dark control
for regeneration.
Dark adsorption not shown
but would appear minimal. IPCA appears to show
synergy but there is no
photolysis control and the solution volume is very
small. Not much difference in the removal rate
between the light and dark
IPCA by the third regeneration cycle: shows
minor regeneration
potential.
(Hou et al.,
2012)
Titanium trichloride was added to a strong ion exchange
resin. The dried product was then carbonized at 700°C in
a tube furnace and then activated with steam at 900°C.
GAC (5-40 g/L)
(spherical
activated carbon)
Mixed phase TiO2,
P25 as reference
Methyl orange (50
mg/L)
2 L fluidized bed
photoreactor using either UV-
C, (λmax 254 nm) or UVA (λmax 365 nm) with aeration
(1 L/min).
UVA and
UVC light.
No control for regeneration
study. Dark adsorption not
shown but claimed to have reached equilibrium. No
controls, no proof.
(Yoon et al.,
2012)

228
Appendix B, IPCAs Prepared by Dry Method

229
Preparation method Adsorbent Photocatalyst Substrate Irradiation source Controls Notes Ref
AP-MOCVD (atmospheric pressure-metal organic
chemical vapour deposition) used to prepare the
IPCA.
PAC (2 g/L) Anatase TiO2 Methyl orange (100
mg/L)
1.5 L cylindrical glass
photoreactor, with a
central UV lamp (356 nm, 1.2 mW cm-2).
None,
IPCA
compared to mixture
for recycle
(10 cycles).
Results expressed as C/C0.
No TiO2 and photolysis
controls. No adsorbent control in the recycle of the
IPCA. Mixture was not
calcined at 400 C which might invalidate it as a
control. Recycle is
convincing everything else is not.
(Zhang
et al.,
2005b)
MOCVD (metal organic chemical vapour
deposition) was used to apply TiO2 to a commercial AC to create an IPCA.
PAC (2 g/L) Anatase TiO2 Methyl orange (100
mg/L)
1.5 L cylindrical glass
photoreactor, with a UV lamp (356 nm, 1.2
mWcm-2) in the centre.
Photolysis,
light adsorbent,
mixture.
Results expressed as C/C0.
No TiO2 control. 2h dark adsorption time not shown.
IPCA performance could be
due to adsorption. Lots of characterisation. TiO2
concentration. is lower in the
mixture.
(Zhang
et al., 2006)
As above. PAC (2 g/L) Anatase TiO2 Methyl orange (100
mg/L)
1 L cylindrical glass
photoreactor with a 300
W high-pressure Hg lamp (356 nm). Aeration at 1.2
m3h-1)
None Looks at the effect of
different surface treatments.
(Zhang
et al.,
2005c)
MOCVD – using tetrabutyl orthotitanate and N2 - was used to apply TiO2 onto pre-treated PAC.
PAC (2 g/L) Anatase TiO2 Methyl orange (100 mg/L)
1.5 L photoreactor with UV lamp (365nm, 1.2
W/cm-2)
None No raw data, all kinetics. (Zhang and
Lei, 2007)
TiCl4 was deposited onto ACFs using Molecular
Adsorption–Deposition (MAD), a form of CVD to create an IPCA.
ACF (weight not
stated)
Anatase/rutile
TiO2
Methylene blue
(2.498 mmol/L)
Pyrex reaction cell (80
mm diameter × 95 mm height) with 24 W low
pressure Hg lamp (254
nm)
Photolysis,
light adsorbent,
None for
recycle.
Results expressed as C/C0
and without error bars. Results seem convincing but
it is unclear if the IPCA had
the same starting point or how much is degraded.
(Fu et
al., 2004a)
As above. ACF (weight not
stated)
Anatase TiO2 Methylene blue (10 -
16 x 10-4 mol/L)
Two pieces of the IPCA,
were placed on a reaction cell and aerated at 90 ml
min-1)
Light and
dark IPCA
No photolysis or TiO2
control. Only 20min dark adsorption (no shown).
Slightly convincing.
(Fu et
al., 2004b)
TiO2 was applied to AC using Chemical Vapour Deposition (CVD). Ag was applied to the TiO2-AC
composite using the same method.
PAC (2 g/L) Anatase TiO2
doped with Ag. Methyl orange (200 mg/L)
1 L cylindrical photoreactor with UV
lamp (356 nm, 1.2
mWcm−2)
Mixture, P25, TiO2
IPCA.
None for recycle.
No photolysis or Ag-TiO2 control. Results expressed as
C/C0. 2h dark adsorption not
shown. Unclear if IPCA is effective at photodegradation
but doping appears to
improve performance.
(Zhang et al.,
2005a)

230
TiO2 was applied to AC using MOCVD. A sol gel
method was also used to prepare a TiO2 and AC was added using stirring. IPCA was then calcined at
873K.
PAC (2 g/L) Anatase TiO2 Methyl orange
(100 mg/L)
1 L cylindrical glass
reactor, with a 300 W high pressure Hg lamp
and aeration (1.2 m3 h-1)
None,
None for recycle.
Results expressed as C/C0.
Good comparison of Sol-gel and MOCVD methods. No
photodegradation controls.
Includes interesting schematic of MOCVD
IPCA. MOCVD seems to be
an improvement for both substrate reduction and
mineralisation.
(Zhang
and Lei,
2008)
CVD was used to apply TiO2 precursors to the support materials using various conditions for each
adsorbent.
EAC, Silica gel, g- Al2O3 (Not stated)
Anatase TiO2 Phenol (400 mg/L) Photoreactor with 8 W UV fluorescent tube
(λmax 356 nm). Oxygen
was bubbled through the system.
None Results expressed as C/C0. Experiments seem to have
been done only once and the
results are erratic.
(Ding et al.,
2001b)
Different preparation methods used Chemical
Vapour Deposition (CVD), Direct Air-Hydrolysis (DAH) and High Temperature Impregnation (HTI).
GAC (0.625 mg/L) Anatase TiO2 Methylene blue (10-
250 mg/L)
None None Study only looks at MB
adsorption. Uses Hg and N2 porosimetry.
(El-
Sheikh et al.,
2004)
Chemical Vapour Deposition (CVD) was used to prepare the IPCAs. The composites were dried and
then calcined at 150 C.
4 types of PAC: unoxidised, oxidised
by HNO3, H2SO4 or
H2SO4 and H2O2 (1-10 g/L).
Anatase TiO2 3-chlorophenol (40 mg/L)
0.25 L photoreactor with 100W Hg lamp (λ max
365 nm, 7 mWcm-2 of 365
nm) and 50 ml min-1 aeration.
TiO2 Measures Cl- production but the lack of a photolysis
control for this and TOC
means it could be this effect.
(El-Sheikh
et al.,
2007)
APCVD was then used to apply TiO2 precursor to
the ACF which was followed by calcination.
ACF (0.1 g/L) Anatase TiO2 Phenol (50 mg/L) Cylindrical shallow vessel
photoreactor irradiated with a 20 W low pressure
Hg lamp (254nm).
None Results expressed as C/C0.
30 min dark adsorption shown. It is likely that the
photodegradation is largely residual adsorption.
(Yang
et al., 2008)

231
Appendix C Emission Spectra
of UV lamps

232
The emission spectra of the UV lamps used in this study was provided by Ana
Carolina de Almeida. The method used to determine these results is documented below.
The emission spectra of the UV (low- and medium-pressure mercury) lamps were
obtained by using a spectrometer system from Ocean Optics (Dunedin, Florida, USA). The
system was equipped with an USB2000 spectrometer, a LS-I-CAL calibrated light source
(for applications with an integrated sphere), a FOS 1 Integrated sphere, an UV-NIR fiber
optics cable (600 µm), and a Spectra Suit software. The first step for the acquisition of
emission spectrum was to calibrate the spectrometer (Spectroscopy TV 2012). The fibre
optic sensor was positioned on a retort stand clamp facing the mercury lamps. A dark
control was acquired and the emission spectra of the low-pressure (Appendix C-0-1) and
the medium-pressure mercury lamp were recorded (Appendix C-0-2).
Appendix C-0-1 Emission Spectra of UV-C (15 W) lamp
Appendix C-0-2 Emission Spectra of UV-A/B (400 W) lamp

233
These results are similar to those provided by the lamp manufactures see Appendix
C-0-3 and other manufactures see Appendix C-0-4, Appendix C-0-5 and Appendix C-0-6.
A comparison with a Xe lamp is provided in Appendix C-0-7.
Appendix C-0-3 Test certificate provided by the manufacture for the medium
pressure Hg lamp (TQ-150) used for all studies.
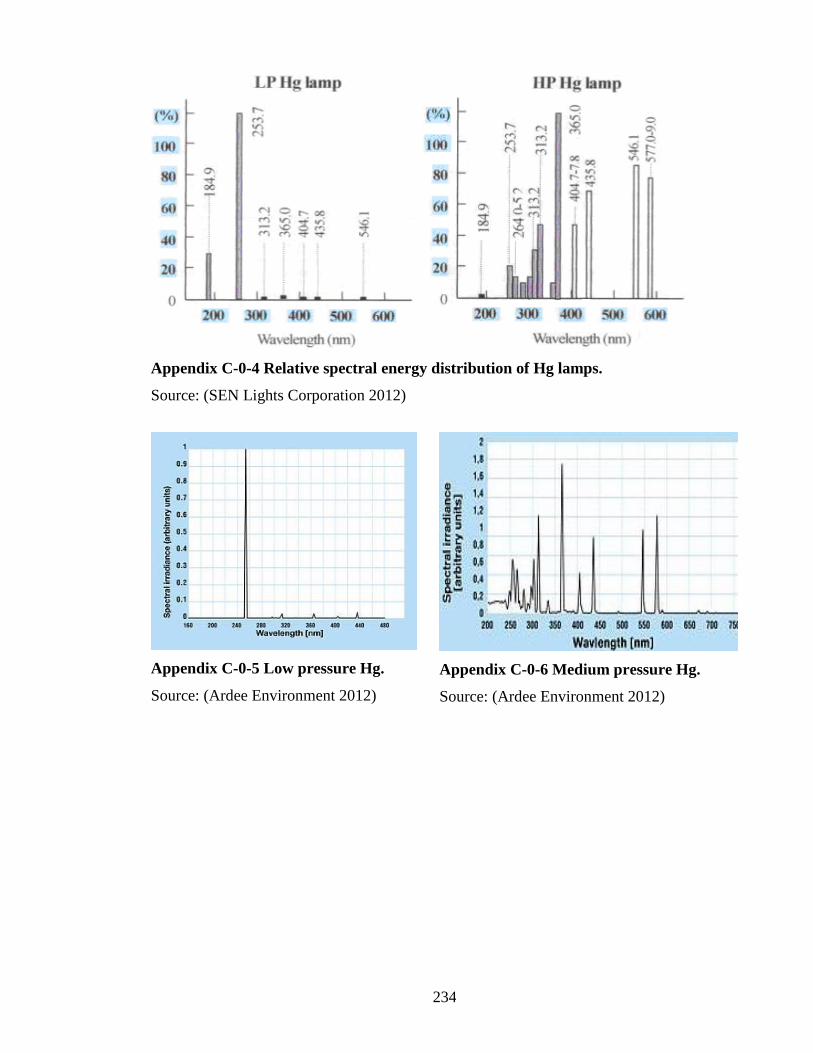
234
Appendix C-0-4 Relative spectral energy distribution of Hg lamps.
Source: (SEN Lights Corporation 2012)
Appendix C-0-5 Low pressure Hg.
Source: (Ardee Environment 2012)
Appendix C-0-6 Medium pressure Hg.
Source: (Ardee Environment 2012)

235
Appendix C-0-7 Spectral Irradiance of Arc-Discharge Lamps using 100 W Hg and 75
W Xe lamp
Source: (Olympus Microscopy Resource Center 2012)


![Activated Carbon[1]](https://img.dokumen.tips/doc/110x75/56d6be9b1a28ab301692d8de/activated-carbon1.jpg)