Embed Size (px)
Citation preview

EVALUATION OF THE NIDIS UPPER COLORADO RIVER BASIN DROUGHT
EARLY WARNING SYSTEMElizabeth McNie, PhD
Western Water Assessment Cooperative Institute for Research in Environmental Sciences
University of Colorado, Boulder
November 2014

Evaluation of the NIDIS Upper Colorado River BasinDrought Early Warning System
Elizabeth McNie, PhD
Western Water AssessmentCooperative Institute for Research in Environmental SciencesUniversity of Colorado, BoulderNovember 2014
Copyright © 2014 University of Colorado Boulder
Cover PhotosElizabeth McNie
Design and LayoutAmi Nacu-Schmidt

Table of Contents
EXECUTIVE SUMMARY 1I. OVER VIEW 3II. METHODS 5III. RESULTS FROM SURVEY AND INTERVIEWS 71. Demographics 72. Use of Drought Information Services 93. Drought and Climate-Related Products 154. Additional Information Needs and Improved Delivery Processes 25
IV. PROJECT GOALS, NIDIS-DEFINED OBJECTIVES AND PILOT PROTOCOLS 271. UCRB DEWS Project Goals 272. NIDIS-Defined Goals 28
V. RECOMMENDATIONS 31APPENDICES 33Appendix I 33Appendix II 37Appendix III 39

EXECUTIVE SUMMARY
Lake Powell, Utah. Photo: Wikimedia Commons, PRA.
The National Integrated Drought Information System (hereafter NIDIS) was created by public law in 2006 (Public Law 109-430, “National Integrated Drought Information System Act of 2006”) to “provide an effective drought information system that collects and integrates information on the key indicators of drought in order to make usable, reliable, and timely drought forecasts and assessment of drought, including assessments of the severity of drought conditions and impacts.” To complete its mission, NIDIS developed Drought Early Warning Systems (DEWS) in various regions around the country. The first pilot covers the Upper Colorado River Basin (UCRB) and is based out of the Office of the State Climatologist at Colorado State University, Fort Collins, CO. The purpose of this evaluation is to examine how the first NIDIS DEWS pilot (hereafter UCRB DEWS) met these overarching programmatic goals and, more specifically, how its efforts have improved drought preparedness in the UCRB.
Overall, the evaluation will address the following goals identified in the UCRB DEWS annual CIRES reports:
• Effectiveness in disseminating drought information
• Effectiveness at expanding partnerships
• Effectiveness at evaluating UCRB DEWS
NIDIS also established five more specific goals and metrics of success for the pilot projects; the evaluation will also focus on these goals:
• Providing education and raising public awareness
• Integrating monitoring and forecasting
• Develop risk assessment scenarios
• Engage preparedness community
• Conduct evaluation and feedback to improve operations
Multiple methods were used to collect data for this evaluation. A survey was conducted and sent to 414 users, of which 112 responded for a response rate of 27%. The survey collected demographic information; evaluated the use and usability of four UCRB DEWS and NIDIS
EVALUATION OF THE NIDIS UPPER COLORADO RIVER BASIN DROUGHT EARLY WARNING SYSTEM
1

service products; determined the value of drought-related information; and determined the value of specific products at different times during the water year. Additionally, 13 semi-structured interviews were conducted using purposive and snowball-sampling techniques.
Findings from these data identified several strengths of UCRB DEWS. It has:
• Raised awareness and understanding of drought and drought impacts among users in their sector, their region, and related to their job
• Improved the ability of users to educate their own stakeholders about drought
• Disseminated drought information that led to the conservation of resources or avoided losses, although quantifying such benefits is still too difficult to do
• Produced and refined The UCRB DEWS Webinar such that it is one of the most popular, trusted, and useful drought-information services available
• Developed and expanded public engagement processes
• Led to a high degree of satisfaction with
the processes used to convey drought information
• Produced or compiled a suite of data that effectively integrates monitoring and forecasting
This document concludes with eight recommendations to improve management and operations. These are:
1. Expand Demographic Coverage
2. Improve branding and streamline services
3. Target education toward specific products
4. Provide additional and more refined information and products
5. Create a strategic plan and base management decisions on the strategic plan
6. Develop a comprehensive recordkeeping and evaluation protocol
7. Develop risk assessment tools and processes, and engage preparedness community
8. Identify services overlap with other agencies and opportunities to improve efficiency
2
EXECUTIVE SUMMARY
I. OVERVIEW
The San Juan River near Mexican Hat, Utah. Photo: Wikimedia Commons, Finetooth.
The National Integrated Drought Information System (hereafter NIDIS) was created by public law in 2006 (Public Law 109-430, “National Integrated Drought Information System Act of 2006”) to “provide an effective drought information system that collects and integrates information on the key indicators of drought in order to make usable, reliable, and timely drought forecasts and assessment of drought, including assessments of the severity of drought conditions and impacts.” To complete its mission, NIDIS developed Drought Early Warning Systems (DEWS) in various regions around the country. The first pilot covers the Upper Colorado River Basin (UCRB) and is based out of the Office of the State Climatologist at Colorado State University, Fort Collins, CO. The purpose of this evaluation is to examine how the first NIDIS DEWS pilot met these overarching programmatic goals and, more specifically, how its efforts have improved drought preparedness in UCRB.
According to NIDIS documents, each pilot’s success will be “measured in local-to-regional success stories, increased awareness of drought-related risks across the nation,
and centralized and decentralized risk reduction approaches that recognize the value of moving beyond proof-of-concept to implementation of proactive management strategies.” Consequently, this evaluation will characterize the effectiveness of UCRB DEWS’ production and dissemination of useful climate and drought information aimed at improving users’ abilities to adapt to and manage impacts from climate variability today and from the 2012 drought. The evaluation will also identify UCRB DEWS future research and operational needs and opportunities aimed at sustaining UCRB DEWS beyond the pilot phase.
Overall, the evaluation will address the following goals identified in the UCRB DEWS annual CIRA reports, which will be discussed in more detail in section IV. These goals are:
• Disseminating Drought Information: “Develop and improve drought monitoring webinars for the purpose of providing timely status reports and drought early warning information for stakeholders and information providers and also to coordinate input for the USDM weekly update cycle.”
EVALUATION OF THE NIDIS UPPER COLORADO RIVER BASIN DROUGHT EARLY WARNING SYSTEM
3

• Expand Partnerships: “Expand active participation and strategically engage multiagency expertise from Utah and Wyoming to improve the quality and cross-border consistency of USDM products.”
• Evaluate UCRB DEWS: “Systematically conduct formative and summative evaluation with emphasis on stakeholder impact and changes in confidence and use of drought products and information over time.”
NIDIS also established five more specific goals and metrics of success for the pilot projects; the evaluation will discuss these goals in detail in section IV:
• Education and public awareness: “Assess and improve where necessary public awareness of drought related risks and sensitivities.”
• Integrate monitoring and forecasting: “Project emerging conditions in the physical environment and contribute to the better understanding of present conditions and past events.”
• Develop risk assessment: “Enable resource and other management authorities to generate risk and impact scenarios (e.g., monitoring and forecast tailoring for trigger definition).”
• Engage preparedness: “Outline and inform actions required to reduce the loss and damage expected from an impending hazard event.”
• Evaluation and feedback: “Work on subsystems to refine the NIDIS process and for transferability to similar locations/regions. This will help foster development of new technologies and technology transfer for more efficient water resource management.”
This document proceeds in the following sections: Section II provides an overview of the methods used for data collection and analysis. Section III presents the findings from the survey as well as related information from the semi-structured interviews. Section IV evaluates success based on the project and NIDIS-identified goals. Section V presents recommendations for moving ahead.
4
I. OVERVIEW

II. METHODS
The Green River at Mineral Bottom, a few kilometres north of where the river enters Canyonlands National Park. Photo: Wikimedia Commons, Urdangaray.
The evaluation utilized multiple methods to collect and analyze data:
• Archival online material
• NIDIS Weekly Climate, Water and Drought Assessment Summary, Upper Colorado River Basin (July 2012-August 2014)
• NIDIS UCRB Annual CIRA Reports (2010-2014)
• NIDIS Public Law 109-430 and program implementation documents
• Other NIDIS evaluations (Apalachicola-Chattahoochee-Flint River Basin)
• Webinar attendance statistics 2012-August 2014
• Usage statistics for the Colorado Climate Center (April 2013 – March 2014)
• Semi-structured interviews with UCRB personnel
• Semi-structured interviews (N=13) using purposive and snowball sampling methods
• Online survey (N=414)
Semi-structured interviews were conducted with climate information users—interviewees were identified through sources provided by UCRB, by the evaluator’s random selection of survey respondents, and by snowball sampling methods—in order to characterize users’ information needs and whether those needs were met. Interviewees were also asked about the drought information service providers and service products investigated in detail in the online survey. They were informed of confidentiality guidelines and assured that their identity, and any identifying information, would not be included in the results. Interviewees were also asked not to report that they had been interviewed, and they agreed not to self-disclose. For a list of protocol questions, see Appendix II.
An online survey was administered to assess UCRB DEWS stakeholders (N=414) using Qualtrics Online Survey software. Email contact information was collated from the Weekly Update distribution list, contacts from the ‘Dealing with Drought’ workshops, and from the ‘Drought Tournament’. The list was cleaned to eliminate duplication of email contacts and failed email addresses.
EVALUATION OF THE NIDIS UPPER COLORADO RIVER BASIN DROUGHT EARLY WARNING SYSTEM
5

A preliminary email was sent to the list to inform recipients that they would be receiving the survey. Additional contacts were removed from the distribution list based on returned emails and requests from some individuals not to receive the survey. Recipients were told about confidentiality and invited to seek additional information about the survey from
the evaluator or other contacts at Western Water Assessment (the evaluator’s organization) or NIDIS. Eventually, invitations to take the survey were sent to N=414 UCRB DEWS stakeholders. Two reminder emails were sent out. Ultimately, 112 stakeholders responded for a response rate of 27%.
6
II. METHODS

III. RESULTS FROM SURVEY AND INTERVIEWS
Colorado River from Dead Horse Point Overlook. Photo: flickr, John Menard.
This section summarizes the findings from the online survey and incorporates additional information from the semi-structured interviews.
1. Demographics
Respondents were asked to self-report the state in which they work, the work they do and the sector in which they work. Respondents were disproportionately from Colorado. Collectively, users from Utah constituted only 4% of the respondents and none reported in from Wyoming (See figure 1). Respondents reported that they learned about climate and drought on the job (49%), although 41% reported that they learned about it through their degree in engineering or other advanced degree. Only 10% reported having limited knowledge in climate and drought information. These findings suggest that the respondent population was fairly sophisticated in its knowledge of water issues.
State and Federal employees comprised 18% and 19% of respondents, respectively (see Table 1). The Bureau of Land Management, National Weather Service, USDA Farm Service Agency, and the USDA Natural Resource Conservation Service comprised 15% of total respondents.
Figure 1: State residency of respondents as percentage of total.
EVALUATION OF THE NIDIS UPPER COLORADO RIVER BASIN DROUGHT EARLY WARNING SYSTEM
7

The third largest work group consisted of business/private industry. 15% responded that their work was ‘other’, including such things as farming, journalism, NGO work, etc.
Not surprisingly, the water sector (public utility, municipal and industrial, agricultural uses) represented 85% of all respondents (note: double reporting was allowed with this question). Other second tier sectors
included farming and ranching (14%), education (17%), law/policy (16%), parks and recreation (13%), and public safety (12%). The fewest respondents represented energy (oil and gas, hydro), fisheries, forestry, public health, media, risk management, tourism, transportation and wildlife management, all of which were within 5%-8% of responses.
Table 1: Sector in which respondents work (note: values exceed 100% due to double and triple reporting)
Answer Responses %
Agriculture (farming) 14 13%
Agriculture (ranching) 8 8%
Agriculture (farming and ranching) 15 14%
Education 18 17%
Energy (hydro power) 8 8%
Energy (oil/gas/coal extraction) 8 8%
Energy (power plant operation or energy distribution) 6 6%
Fisheries 7 7%
Forestry 8 8%
Public Health 4 4%
Law/Policy 17 16%
Media 6 6%
Parks/Recreation 13 13%
Public safety (fire/police/emergency management/planning) 12 12%
Risk Management/Insurance 8 8%
Tourism 6 6%
Transportation 5 5%
Water (public utility) 29 28%
Water (municipal and industrial) 26 25%
Water (agricultural uses) 33 32%
Wildlife management 8 8%
8
III. RESULTS FROM SURVEY AND INTERVIEWS

2. Use of Drought Information Services
A. Familiarity with service providers in the UCRB
In an effort to understand their breadth of experience with climate and drought-related information, respondents were asked to indicate their familiarity with all major climate and drought-information service providers in the UCRB (see Table 2). Of the 23 agencies listed, >80% of respondents were familiar with the US Drought Monitor, the Colorado Climate Center, the Colorado State Climatologist, the Colorado Water Conservation Board, the NOAA Climate Prediction Center, and the National Resource Conservation Service Snow Survey Office. 78%, indicated familiarity with the Colorado Basin River Forecast Center, and 61% with the US Drought Portal. Only 77% were familiar with ‘NIDIS’, 74% with the
Drought Early Warning System, 63% with the ‘National Integrated Drought Information System’, and 59% with the National Drought Mitigation Center. Of note here is the difference between respondents’ familiarity with ‘NIDIS’ and with the ‘National Integrated Drought Information System’, particularly since the NIDIS logo was at the top of each page of the survey and both its full name and its acronym were included in every email sent to survey recipients. The 14% difference between ‘NIDIS’ and ‘National Integrated Drought Information System’ indicates that respondents are more familiar with the ‘NIDIS’ brand. Some of those interviewed were not aware that they were the same entity. “I just know it as NIDIS, not its full name. There are so many organizations out there that it is easier to just think about it as NIDIS,” said one respondent. The relatively higher familiarity of ‘NIDIS’ could be a source of leverage in future branding efforts.
Table 2: Familiarity with various climate-service providers.
Question Yes No Not sure Total ResponsesColorado Basin River Forecast Center 78 17 4 99Colorado Climate Center 83 17 2 102Colorado State Climatologist 87 11 1 99Colorado Water Institute 49 35 9 93Colorado Water Conservation Board 86 11 0 97CWCB Water Availability Task Force 58 33 3 94Drought Early Warning System 68 20 4 92High Plains Regional Climate Center 33 52 3 88Intermountain West Climate Dashboard 25 57 3 85National Drought Mitigation Center 54 28 10 92National Integrated Drought Information System 59 28 6 93NIDIS 73 19 2 94North Central Climate Science Center 14 62 6 82NOAA Climate Prediction Center 87 8 3 98NRCS Snow Survey Office 86 10 1 97US Drought Monitor 76 12 3 91US Drought Portal 54 28 6 88Utah Climate Center 10 66 4 80Utah State Climatologist 15 62 5 82USGS Water Science Center 52 30 7 89Western Water Assessment 40 36 9 85Wyoming State Climate Office 12 66 4 82Wyoming Water Forum 4 73 4 81
EVALUATION OF THE NIDIS UPPER COLORADO RIVER BASIN DROUGHT EARLY WARNING SYSTEM
9

B. Use of services
Respondents were asked to indicate whether they used various climate and drought-related services and how often they used the service (the US Drought Portal, US Drought Monitor, UCRB DEWS website, UCRB DEWS webinar). Respondents were shown screen grabs from four different providers (see Figures 2a-d). Respondents were allowed to select more than one answer. The most widely used services were the US Drought Monitor (85% of total responses) and the UCRB DEWS webinar (77%) (see Table 3). Less than half of respondents had ever used the UCRB DEWS website. Only 55% of respondents had used the Drought Portal. Respondents indicated that they tended to visit only one site to get most of their information, although a few people said they do scan a couple of sites.
C. Frequency of use
Respondents who indicated that they used a service were then asked how often they used the service (see Table 4). They were asked to choose between ‘used only once or a few times’, ‘quarterly’, ‘monthly’, or ‘more than once each month’. Only one selection per
service was allowed. The US Drought Portal had the highest rate of respondents who reported using it only once or just a few times (49%). The US Drought Portal also had the least number of respondents who used it more than once each month (14%). The UCRB DEWS website also had a high number of respondents who reported using it only once or a few times at 33%. The UCRB DEWS Webinar had the highest number of respondents indicating they used the service more than once each month at 37%. This most likely represents its core users and respondents who regularly attend every webinar. Archival research indicates there is a rather reliable population that participates in the webinars.
D. Reason for using or not using the service
If respondents indicated that they used a service, they were also asked why they used it (see Table 5). They were allowed to check all boxes that applied. The single largest reason for using any of the services was that the information came from a trusted source, with the US Drought Portal having the highest ‘trust’ score of 88% (of those respondents who had used the service), followed by the US Drought Monitor (81%), the UCRB DEWS Webinar (80%) and the UCRB DEWS website (69%). The US Drought Monitor received high marks for being easy to understand (82%) and for its convenience and ease of use (77%). The
Figure 2: Drought and climate-information services snapshots.
US Drought Portal
(drought.gov)
US Drought Monitor (droughtmonitor.
unl.edu)
UCRB DEWS
Website
UCRB DEWS
Webinar
Used the Service 55 85 48 77
Never Used Service 37 15 43 22
Not Sure 8 0 9 1
Table 3: Use of various climate and drought-related services (number of responses; more than one answer could be selected).
US Drought Portal
(drought.gov)
US Drought Monitor (droughtmonitor.unl.edu)
UCRB DEWS
Website
UCRB DEWS
WebinarsUsed only once or a few times 49 25 37 25
Quarterly 22 20 20 22
Monthly 16 33 20 16More than once
each month 14 22 24 37
Table 4: Frequency of use of the service (% responses; only one selection per service was allowed).
10
III. RESULTS FROM SURVEY AND INTERVIEWS

high trust, understandability, and ease of use scores for the Monitor appear to be consistent with a service that is used most frequently on a monthly (or more) basis by respondents. The US Drought Monitor was also credited for providing timely information (73%) and being easy to understand (62%). The UCRB DEWS website had a trust score of 69%, the lowest among the four services, and 11 points below the UCRB DEWS Webinar. The website also had a score of 69% for providing timely information, one of its strongest qualities. The UCRB DEWS Webinar received its highest marks for providing timely information (85%), containing a wide variety of information about drought conditions (70%), and being convenient and easy to use (70%). Overall, the UCRB DEWS website had among the lowest scores. The qualities that were least influential among the respondents’ reasons for using a service were that it allowed them to ask clarifying questions (avg. ~ 18%) followed by the service’s ability to allow respondents to search for the information they need (avg. ~ 45.5%). One working hypothesis about the popularity of the Webinar was that it allowed users to ask questions in ‘real time’, yet the survey suggests this is not a major factor driving its use.
If respondents indicated they did not use a service, they were asked why they did not use it (see Table 6). They were allowed to check all boxes that apply. Only three primary categories were indicated for reasons to not
use a service. First, respondents claimed that they were not aware that the service exists, particularly for the US Drought Portal (44%) and the UCRB DEWS Website (45%). Only 25% of respondents indicated that their lack of familiarity with the US Drought Monitor was a reason for not using the service. Second, respondents indicated that they did not use the service because they got their information from other sources. The UCRB DEWS Webinars had the lowest value in this category at 25%, while the other services ranged from 41-53%. Third, many respondents indicated that they had begun using the services just recently with values ranging from 16-19%. These results suggest that additional users could be developed if they are aware of the service and do not already get their information from other sources.
E. Webinar and web site analytics
Webinar attendance varied somewhat between years (See Figure 3). 2012, a major drought year, had consistently higher average attendance. The single largest month of attendance was April 2013, which may have drawn significant numbers due to the transition into the melt season after a year of drought in 2012. Trends of attendance from different quarters of the water year were fairly consistent for years 2012 through August 2014. April and July see the highest level of attendance, followed by June and August. Attendance drops significantly in September and remains low through
Table 5: Reason for using each service (Number of responses for each service. More than one reason could be selected).
US Drought Portal
(drought.gov)
N=26
US Drought Monitor (droughtmonitor.unl.
edu)
N=62
UCRB DEWS Website
N=29
UCRB DEWS Webinars
N=54Provides timely information 73 73 69 85
Is easy to understand 65 82 62 69Allows me to search for and use only
the information I need 54 40 45 43
Contains a wide variety of information about drought conditions 65 56 55 70
Is from a trusted source 88 81 69 80Contains information that is at an appropriate scale for my needs 50 53 52 67
Allows me to ask clarifying questions 15 11 21 24
Is convenient and easy to access 62 77 62 70
Provides adequate detail and description 54 63 62 69
EVALUATION OF THE NIDIS UPPER COLORADO RIVER BASIN DROUGHT EARLY WARNING SYSTEM
11

December. May through August 2012 saw the highest numbers, with the exception of April 2013, which was higher. The record rainfall event and flooding in September 2013 did not lead to any significant uptick on attendance. Attendance in webinars increases somewhat when Klaus Wolter presents information. Location of attendees was determined for the 2014 calendar year (See figure 3). 87% of all attendees were from Colorado, followed by 6% from Utah, 1% from Wyoming, and 6% from ‘other’ states, notably Missouri. The numbers are similar to the overall demographic breakdown of all respondents to this survey (see figure 4).
Usage statistics for the Colorado Climate Center indicate a robust following, with an
average of 1,242 hits per month over the period of April 2013 – March 2014. The site received a total of 14,894 hits during that period. It cannot be calculated how many are unique hits, nor how many were seeking UCRB DEWS web information specifically. User demographics cannot be calculated. The highest month received 1,455 visits in September 2013 and the lowest month was 1,104 visits in November 2013. High numbers for September could be a result of the record rainfall that occurred that month.
Figure 3: Number of Webinar Attendees by Month and Year.
Figure 4: Webinar attendance by state as percentage of total attendees (2014).
Table 6: Reason for not using each service (Number of total responses. More than one choice could be selected).
US Drought Portal (drought.gov)
US Drought Monitor (droughtmonitor.unl.
edu)UCRB DEWS
WebsiteUCRB DEWS
Webinars
Not aware that it exists 44 25 45 42Information not provided in a
timely manner 0 6 2 3Information is too technical and difficult to understand 4 3 4 0
Website difficult to navigate 2 3 2 3Not enough detail in the
information 4 9 4 3
I don't trust the source 2 0 0 3Information not provided at
the scale I need 7 3 4 8Information not relevant to
my sector 7 6 7 11I get my information from
other sources 53 41 46 25
Just began using it recently 16 19 16 17
12
III. RESULTS FROM SURVEY AND INTERVIEWS

F. How information was used
Understanding the impact that climate and drought-related information has with the users of the information is an important indicator of the value of the service (see table 7). Respondents were asked to identify the ways in which they used information related to emerging drought conditions. Specifically, respondents were asked to identify how information may have informed relevant triggers used in decision making. One user indicated that the information enabled them to “fast track” a drought designation, which in turn provided input for a Secretarial
Drought Designation request. Another used the information to confirm information they already got from another source (Denver Water) that was then used to inform the management team that made planning and operational decisions. The information also helped one community plan for spring floods and develop appropriate responses to drought in a WUI (Wildland Urban Interace)-impacted community. Respondents indicated that the information improved their understanding of drought in their region (82%) and conditions relevant to their job (75%). Information also enabled users to communicate relevant information to users (56%), and improve
Table 7: Benefits gained from using climate and drought-related information (% total respondents. More than one option could be selected.)
Answer Response %Improved understanding of drought-related conditions IN THIS REGION 70 82%
Improved understanding of drought-related conditions IN MY SECTOR 35 41%
Improved understanding of drought-related conditions RELEVANT TO MY JOB 64 75%
Identify a specific trigger that informed a management or operational decision. If possible, please provide an example of a trigger.
11 13%
Aid in the development of models, tools or other forecasts 12 14%
Adapt to current or emerging drought conditions in the UPCOMING WEEKS OR MONTH 28 33%
Adapt to current or emerging drought conditions SEASONALLY OR QUARTERLY 36 42%
Adapt to current or emerging drought conditions in the WATER YEAR 36 42%
Plan for future droughts IN THE NEXT 1 to 3 YEARS 25 29%
Plan for future droughts IN 3 to 5 YEARS 9 11%
Plan for future droughts MORE THAN 5 YEARS AWAY 5 6%
Increase profits and/or economic gains 4 5%
Reduce costs and/or avoid economic losses 10 12%
Conserve resources and/or avoid loss of resources 34 40%
Communicate relevant information to our customers, stakeholders or community 48 56%
Influence public policy decisions 29 34%
Improve my organization’s ability to use drought-related information in decision making 35 41%
Build or strengthen new relationships and collaborations with drought-information providers 21 25%
Build or strengthen new relationships and collaborations with other drought-related decision makers and organizations 17 20%
Prompt me to seek out additional drought or climate-related information 35 41%
Inform new research priorities 11 13%
EVALUATION OF THE NIDIS UPPER COLORADO RIVER BASIN DROUGHT EARLY WARNING SYSTEM
13

their organization’s ability to use drought-related information (41%). Information helped users adapt to current or emerging drought conditions. Ranchers (self identified) used the information to inform planning activities, irrigation practices, and predict likely water restrictions for grazing permittees.
Respondents were asked to indicate all of the value demands that were satisfied as a result of the information (See Appendix III for more information about value demands), such as learning, conserving resources, building relationships, etc. The most important ways that users benefited from the information was that it improved their understanding of drought-related conditions in their region, in their job and in their sector, at rates of 82%, 75% and 41% respectively, while 41% indicated the information prompted them to seek out additional information. 56% of respondents indicated that they used the information to communicate with their own stakeholders and user community. These numbers suggest that UCRB DEWS achieved one of its major goals of informing users about drought conditions. Results also indicate that users were able to improve adaptation to drought conditions seasonally, quarterly, and in the water year (42%), yet only 6% and 11% (respectively) indicated that the information was used for planning droughts more than five years away or for droughts in the next three to five years.
Users also indicated that information aided in the conservation of resources and/or avoiding loss of resources (40%), and 12% indicated they were able to reduce costs and/or avoid economic losses. Only 5% indicated that the information enabled them to increase profits and/or economic gains. Of those respondents who selected these three benefits, only 16% could quantify the ways in which profits were increased, costs reduced, losses avoided, or resources conserved. 53% said it would be difficult to do, and 32% said it couldn’t be done. Nevertheless, respondents did provide some estimates. One suggested that they were able to reduce water used by 22%-25% from the 2011 year (during the 2012 drought). Another used the forecasts (in particular) to reduce, from 2011 use, water used for irrigation. One user
indicated that they were better able to manage water storage and raise conservation restrictions earlier in the season. Another user indicated that as a result of the information, they were able to reduce water consumption by 15%-20% during the most recent drought. None provided any dollar value for such savings. In interviews one user described the challenge of quantifying the value of the information by saying that, “If we could do it, we would. We know the value of the information but it’s hard to explain exactly how it influences things.” Nevertheless, responses indicate that UCRB DEWS achieved another goal of reducing the impacts of drought.
G. Overall Comments About Each Service
1. UCRB DEWS Webinar
Interviewees indicated that the primary reason for using this service was due to the regularity of the webinars and perceived timeliness of the material. They also had high trust in the provider. Many of the respondents interviewed were regular attendees of the Webinars or attended them most frequently during the 2nd quarter of the water year. When they could not attend the webinar, some respondents got the information from the DEWS website, although this was not their preferred method of accessing information. One respondent explained that, “Listening in real time to the actual scientists gives me more confidence in the reports and in the information. I don’t know why, but being able to hear them matters to me.” When asked the follow-up question, ‘Do you ask questions during the webinar?’ they replied that they do not, “but having that option is a good one to know.” Respondents also perceived the information presented in the Webinar as more timely, and that is one reason for its use. In particular, they mentioned the US Drought Monitor as one example of “very timely” information.
2. UCRB DEWS Website
Respondents found the UCRB DEWS Website least appealing of all the services. Comments included that “it seems out of date”, is “difficult to use”, and that they get their information from other sources. Even those respondents
14
III. RESULTS FROM SURVEY AND INTERVIEWS

who used the Webinar had similar criticisms about the Website. One respondent explained, “Compared to the other sites, it [UCRB DEWS website] seems harder to get the information I need. Or maybe it’s just in how it’s presented. It’s just easier to attend the webinar or get my information from the Drought Monitor.” Most respondents got their information from other sources.
3. US Drought Monitor
The Monitor appeared to be popular ‘one-stop shopping’ for drought information. Respondents explained that they were able to get most of the information they needed about drought quickly and easily. They commented on the ease of navigating the web pages. One respondent explained, “There’s so much information to get out there it’s hard to know where to start. So I just go to one [source] for most of my information [US Drought Monitor] and check with the other [Dews Webinar]. Between them I get all the information I can use and understand.” Another explained, “I just want to get the pictures of the drought and it [Monitor] gives me just that.” Respondents also trust the Monitor and found most of the graphics easy to understand.
4. US Drought Portal (Drought.gov)
The Portal received mixed reviews. On one hand, respondents commented on how comprehensive the site is for all kinds of data. One explained, “If I know exactly what I’m looking for, it’s great. I can find the right links to get me there [source of the information].” Yet most of the respondents explained that the site is difficult to navigate. One respondent said, “It’s [drought portal] so hard to navigate the pages. I don’t know what a lot of the information means and I just figure out how to find the right links. It’s confusing. Have you tried it?” And another said, “I don’t bother with it because I can get the same material from other sources that are easier to use.” Yet respondents also indicated a fairly high degree of trust in the service.
3. Drought and Climate-Related Products
This section reports on the value of specific
information products used by the UCRB DEWS on its webpage and in its webinar. These products are shared throughout the water year, although there are occasionally other products shared by UCRB DEWS that are not listed here. The other services identified in the previous section also use most of these products, although they may include other products not used by UCRB DEWS. This section begins with a screen grab of each of the products (taken directly from the UCRB DEWS website) and follows with comments based on the semi-structured interviews conducted with users. They were asked about which aspects of the product they valued or did not value. Some users were familiar with the product by accessing other services (e.g. Drought Monitor), thus the comments here are not related directly to the DEWS Webinar or Website specifically, rather to the product itself.
During the interviews, a clear separation emerged between less educated users and more educated users (as self-reported in the demographics section, where they noted where they had learned about climate and drought). More educated users, who learned about these issues through advanced degree programs in science or engineering, appeared to have a deeper understanding of the development and construction of the product and of its potential use. Nevertheless, less educated users could still find value in most of the products because they “trusted the source of the information” and many had developed adequate skills and knowledge through their work ‘on the job’.
A. Users’ opinion about products
Respondents placed very high value in the drought information, which makes sense given the purpose of DEWS. But as one user explained, “If I can only get one piece of information or get one picture of what’s happening, then it [the drought information] is what I want to see. It’s the whole picture.” Respondents explained that the drought graphics were easy to read and could give them an instantaneous view of the drought landscape (see figure 5). Some users added that they really did not understand how the different color boundaries were drawn or
EVALUATION OF THE NIDIS UPPER COLORADO RIVER BASIN DROUGHT EARLY WARNING SYSTEM
15

what the boundaries actually mean, but that based on what they saw ‘on the ground’, the graphics made sense and they consequently trusted the information. Some were more savvy users and understood that the maps are drawn weekly through a collaborative process between the National Weather Service and other state and federal actors. For these users, understanding the processes gave an added level of legitimacy to the drought data.
Evapotranspiration ranked as one of the least useful products (see figure 6). Most users interviewed expressed ambivalence in using the product because they had at best only
a weak understanding of what it explains. Others said they did not understand how it was calculated, and many said that they did not know how to adequately incorporate this information into their own work. One asked, “Where are the boundaries?” of the source of the data and wondered how location of data collection could affect the area of his concern. Most users seemed satisfied in not using evapotranspiration given their belief that they could “get the information they wanted” from the other products. Nevertheless, some other users understood and valued the product, but believed that other products collectively told a more comprehensive story about drought
Figure 5: Drought. LEFT: Graphic showing the Drought Monitor for the Western United States. RIGHT: Graphic showing the Palmer Drought Severity Index.
Figure 6: Evapotranspiration. Colorado Evapotranspiration from CoAgMet.
16
III. RESULTS FROM SURVEY AND INTERVIEWS

conditions.
Temperature and precipitation forecasts were a popular product (see figure 7). All users interviewed were comfortable using the data and said they had a strong understanding of how it was created and could be used in their job. The shorter-term forecasts were more useful than the longer-term forecasts for most of the users. A few users asked what the “lead time” meant on the forecasts.
Recent precipitation was the second most valued product (see figure 8). Users
commented that the product was easy to read and understand, and that the color mapping gave them “an instant look” of recent trends. One user talked about the ability to do a “truth test” of the product against what they had experienced “on the ground”, as if checking accuracy of the product. Over time, they said, they came “to trust the map” and no longer feel the need to “truth test it”.
Users had similar comments for recent temperatures that they had for recent precipitation (see figure 9). They appreciated how easy it was to read and understand the
Figure 7: Temperature and Precipitation Forecasts and Outlooks. LEFT: Graphic showing the 8-14 day precipitation outlook. RIGHT: Graphic showing three-month temperature probability outlook.
Figure 8: Recent Precipitation. LEFT: Graphic showing previous month percent of normal precipitation. RIGHT: Graphic showing total precipitation current water year.
EVALUATION OF THE NIDIS UPPER COLORADO RIVER BASIN DROUGHT EARLY WARNING SYSTEM
17

product and knew how to use it for their purpose. One user lamented that the map wasn’t available at finer resolution, meaning that he wished he could do a better job locating his county on the map.
SNOTEL information was the most valuable product used in the first three quarters of the water year, but had minimal value in the fourth quarter of the year (see figure 10). Most users interviewed seemed to be fairly adept users of this product. Most could describe what the product was and how the data were collected, and had at least some understanding of what
a SNOTEL station was and how it worked. Some users were unsure how data from a single SNOTEL device could be extrapolated to describe conditions in surrounding areas. Several users commented that SNOTEL information was the most important product they use in their work and one said, “If I had to pick just one, that’s what it would be.” Several users noted that they wished they had more coverage with SNOTEL, while others said they were satisfied with existing coverage, presumably because the area of their concern was already well covered, or so they said. Overall, the agricultural water sector ranked
Figure 9: Recent Temperature. LEFT: Graphic showing departure from normal temperature previous month. RIGHT: Graphic showing average temperature previous 60 days.
Figure 10: SNOTEL and Snowpack. LEFT: Graphic showing Westwide SNOTEL current snow-water equivalent percent of normal. RIGHT: Graphic showing SNOTEL water-year percentile ranking for a specific date.
18
III. RESULTS FROM SURVEY AND INTERVIEWS

SNOTEL at higher importance at all times of the water year.
SPI, like SNOTEL, was a popular product (see figure 11). Users appreciated the ease in use of the SPI and its use of color to convey information. They also appreciated that counties were drawn on the map for ease of identifying their own location. Most users were not aware of how
SPI was calculated, but this did not affect their interest in the data. The more savvy users had a high degree of understanding of the data and valued it, along with SNOTEL, as one of their most reliable sources of information. A few users expressed curiosity about the resolution of the map and how accurate the information was across scales.
Figure 11: SPI (Standardized Precipitation Index). Western US 3-Month SPI.
Figure 12: Streamflow. Graphic showing hydrograph of 7-day average streamflow at three specific locations. RIGHT: Graphic showing Spring and Summer streamflow forecasts.
EVALUATION OF THE NIDIS UPPER COLORADO RIVER BASIN DROUGHT EARLY WARNING SYSTEM
19

Streamflow products had high value to the users during the 2nd, 3rd, and 4th quarters of the water years (see figure 12). They commented on the simplicity of the product and ability to understand the data through the use of “simple, straightforward graphics”. Most users had a strong understanding of how the data were collected, of the use of gages, and of how current information relates to historical flows. The most useful of the two products listed above was the basin-wide graphic, as few users had any direct need for data from the three stations on the Colorado, Green and San Juan Rivers. Many users expressed a need for installation of more gages, but overall thought this product was a good complement to other products they used.
Water storage was a popular product with consistent value throughout the year (see figure 13). Users really liked the teacup diagrams because, as one user said, “All I have to do is take one glance and I get a view of what’s happening in those lakes.” On the other hand, the same user also said, “But they don’t tell me what’s happening throughout the basin.” Users expressed a desire to see more teacup diagrams on more lakes, as those used right now represent a small portion of lakes that inform relevant decisions among users. Some users stated that looking at both diagrams helped them make better judgments about triggering events and policies, though they relied on numerous data to make such decisions.
Like other color-coded graphics, users
Figure 13: Water Storage, LEFT: Graphic showing teacup diagram of current reservoir levels. RIGHT: Graphic showing Lake Powell daily water levels and previous three years.
Figure 14: Soil Moisture. LEFT: Graphic showing initial soil moisture and liquid water in top 2 meters of soil. RIGHT: Graphic show-ing VIC soil moisture.
20
III. RESULTS FROM SURVEY AND INTERVIEWS

appreciated the ease of reading Initial Soil Moisture with little effort (see figure 14). The scale of the product posed the biggest challenge to users who wanted to have greater resolution of soil moisture in their specific area. “We have different soil types here [their ranch] and the ability to store moisture varies a lot. We don’t know which soil that map is good for,” explained one user. Other users were not so sure how to apply this product in relation to others, like the SPI. More savvy users, however, did not mention such limitations.
The ENSO products were the least valued by all users for several reasons (see figure 15). First, less savvy users did not understand what a multivariate index means or how to interpret it. Others were unsure about what the dynamical models represent and how they differ, and in that case, which one to use. The temporal dimension of the ENSO products was the biggest challenge for users; most of users’ decision making and planning were done in the short term, where other products have more value and relevance to decisions. Some products with longer time horizons, such as SNOTEL, were believed to be more accurate predictors of future near-term conditions. In these cases users felt that the ENSO forecast was too uncertain to rely on for decision making. Finally, as demonstrated in a previous question in the survey, most users do not do any short-term planning (up to five years ahead), so the ENSO products have only minimal value.
B. Value of products during each quarter
of the water year
Respondents were asked to identify which products are most useful at different times of the water year (October-December, January-March, April-June, July-September), by rating them as ‘most important’, ‘very important’, ‘somewhat important’, or ‘not important’. If respondents were not familiar with the product or its value during the year, they could also select ‘don’t know’ as an option. The following graphs show the value placed on the individual products presented in the UCRB website (and discussed in the previous section above) by quarter of the water year. Further analysis focuses on the value placed on the products by the three most populous sectors (based on demographic responses)—the water community that includes the public utilities, municipal and industrial users, and agriculture. Additional sectors can also be analyzed as necessary.
1. First Quarter of Water Year
SNOTEL information was the most important product in the first quarter of the water year for all users, with 70% stating it was the most/very important product (see figure 16). Recent precipitation also scored highly (64%), followed by drought and water storage at 51%. ENSO forecasts scored the lowest for most/very important and scored the highest for not important.
Responses from the water sector were largely
Figure 15: ENSO (El Niño Southern Oscillation). LEFT: Graphic showing plume model ENSO predictions. RIGHT: Graphic showing multivariate ENSO index.
EVALUATION OF THE NIDIS UPPER COLORADO RIVER BASIN DROUGHT EARLY WARNING SYSTEM
21

consistent with the overall averages reported here, with some exceptions listed below (% difference from average response. Only those differences over 10% from mean are listed). Of note is the variation in the M&I sector, where streamflow is 20% more important, and the temperature and precipitation forecasts are 39% less important than the mean. Overall, variation in the water sector was:
• Public Utilities: ° Greater importance: streamflow (+11%),
and water storage (+10%).
° Less importance: none.
• Municipal and Industrial: ° Greater importance: streamflow (+20%),
soil moisture (+12%).
° Less importance: temperature and precipitation forecast (-39%), ENSO (-11%).
• Agricultural: ° Greater importance: SPI (+10%),
° Less importance: none.
2. Second Quarter of Water Year
88% of respondents rated SNOTEL products
Figure 16: Value of product during 1st quarter of water year, October – December.
Figure 17: Value of product during 2nd quarter of water year, January – March.
22
III. RESULTS FROM SURVEY AND INTERVIEWS

as most/very important, and 46% of that group indicated that it was most important (see figrue 17). Drought products also rated very highly (74%), along with recent precipitation, water storage, and temperature & precipitation forecasts. Evapotranspiration and ENSO products ranked least important, with more than half of respondents indicating that both products were only somewhat or not very important.
Responses from the water sector were largely consistent with the overall averages reported here, with some notable exceptions. M&I users ranked SNOTEL as 100% most important and very important for this quarter of the water year. No other product ranks that highly at any other time. Additional deviations from the mean are listed below (% difference from average response. Only those differences over 10% from mean are listed). A notable result is that public utilities rank drought as 14% more important than the mean, and M&I users rated streamflow as 16% more important than the mean.
• Public Utilities: ° Greater importance: Drought (+14%)
° Less importance: none.
• Municipal and Industrial: ° Greater importance: SNOTEL (+12%);
Streamflow (+16%)
° Less importance: none.
• Agricultural: ° Greater importance: Streamflow (=12%)
° Less importance: Recent Temperature (-12%)
3. Third Quarter of Water Year
In this quarter, SNOTEL products dropped from the highest ranked product to the middle (see figure 18). Its overall score decreased, but more importantly, other products increased in importance—drought (83%) streamflow (78%), temperature and precipitation forecasts (74%) and recent precipitation (73%). ENSO and evapotranspiration products remain the least important, and more than half of respondents indicated that ENSO was only somewhat or not very important.
Responses from the water sector were largely consistent with the overall averages reported here, with some exceptions (% difference from average response. Only those differences over 10% from mean are listed), notably that M&I users’ rank SNOTEL as 17% more important than the mean.
• Public Utilities: ° Greater importance: Evapotranspiration
(+11%)
° Less importance: ENSO (-12%)
Figure 18: Value of product during 3rd quarter of the water year, April – June.
EVALUATION OF THE NIDIS UPPER COLORADO RIVER BASIN DROUGHT EARLY WARNING SYSTEM
23

• Municipal and Industrial: ° Greater importance: Evapotranspiration
(+12%); SNOTEL (+17%); Streamflow (+15%)
° Less importance: ENSO (-10%)
• Agricultural: ° Greater importance: Evapotranspiration
(+13%); Streamflow (+11%)
° Less importance: none
4. Fourth Quarter of Water Year
Drought remains the most important product, followed by recent precipitation (74%) (see figure 19). Streamflow, water storage, and temperature and precipitation forecasts share the number three spot at 68%. In this quarter, SNOTEL drops to the bottom, with more than 70% indicating that it is only somewhat or not very useful. Fewer than half of respondents indicate that evapotranspiration, SPI, and ENSO were most or very important.
Responses from the water sector show some sharp contrasts with averages. The water sector overall ranked Evapotranspiration as at least 10% more important than indicated by the mean. Other variations are listed below (% difference from average response. Only those differences over 10% from mean are listed). Among those variations, M&I water users ranked Streamflow as most important by 25%
points during the last quarter of the water year, the highest ranking it gave to any product at this time of the water year. Agricultural users gave evapotranspiration 14% greater value than the mean.
• Public Utilities: ° Greater importance: Evapotranspiration
(+12%)
° Less importance: none
• Municipal and Industrial: ° Greater importance: Evapotranspiration
(+13%); Streamflow (+25%)
° Less importance: ENSO (-13%)
• Agricultural: ° Greater importance: Evapotranspiration
(+14%); Streamflow (+13%)
° Less importance: ENSO (-11%)
C. Overview of importance of product by quarter of the water year
Overall, drought information ranked as the most important product delivered by UCRB DEWS, consistently ranking in the top three of all products throughout the year (see figure 20). Its lowest ranking occurs during the first quarter of the year. The high ranking of drought is not surprising, given the purpose of the UCRB DEWS. Recent precipitation
Figure 19: Value of product during 2nd quarter of water year, January – March.
24
III. RESULTS FROM SURVEY AND INTERVIEWS

was also ranked highly, and had consistently strong levels of importance throughout the year. Temperature and precipitation forecasts, as well as water storage, shared the number three spot in importance. SNOTEL products had overall higher numbers for the first three quarters, dropping significantly in the fourth quarter. ENSO and evapotranspiration products remained consistently low throughout the year, with ENSO ranking the lowest overall of all products.
4. Additional Information Needs and Improved Delivery Processes
Results for this section were taken from the online survey and the semi structured interviews.
A. Additional information needs
Users were asked to identify what additional climate or drought-related information they needed in order to improve their understanding of, or decisions relating to, emerging or existing drought conditions. These answers were not derived from UCRB DEWS users alone, but represent those users who may use the other services identified section 2B. Answers ranged from very detailed responses to proposals that are somewhat difficult or even unrealistic to achieve. Filling the needs of some of the requests can already
be done using existing data, suggesting that some users were simply unaware of it or didn’t understand how to use it.
By far the most requested need was to get information at smaller scales and greater resolution. Some users wanted information scaled to specific watersheds or municipal areas, particularly smaller cities. Others wanted finer scale information related to SNOTEL data and soil moisture. They also wanted site-specific evapotranspiration estimates—for example, by creating CoCoRahs ET stations. Some users wanted more data from existing individual climate stations, particularly historical data from which current conditions could be compared. One example cited was more historical data at SNOTEL sites. One user called for more information for SE Colorado. One user expressed a desire to see information (precipitation and soil moisture data) aimed at mountain elevations of between 8,000 and 10,000 feet, where a significant amount of rangeland is located. He noted that most SNOTEL sites are above these elevations.
Rivers and reservoirs also influenced information demands. Several users expressed the desire to see more teacup diagrams used for more reservoirs. They liked the ease in using these data, but thought that the existing number of diagrams significantly limited their usefulness for anyone beyond a very
Figure 20: Importance of Product by Quarter of Water Year.
EVALUATION OF THE NIDIS UPPER COLORADO RIVER BASIN DROUGHT EARLY WARNING SYSTEM
25
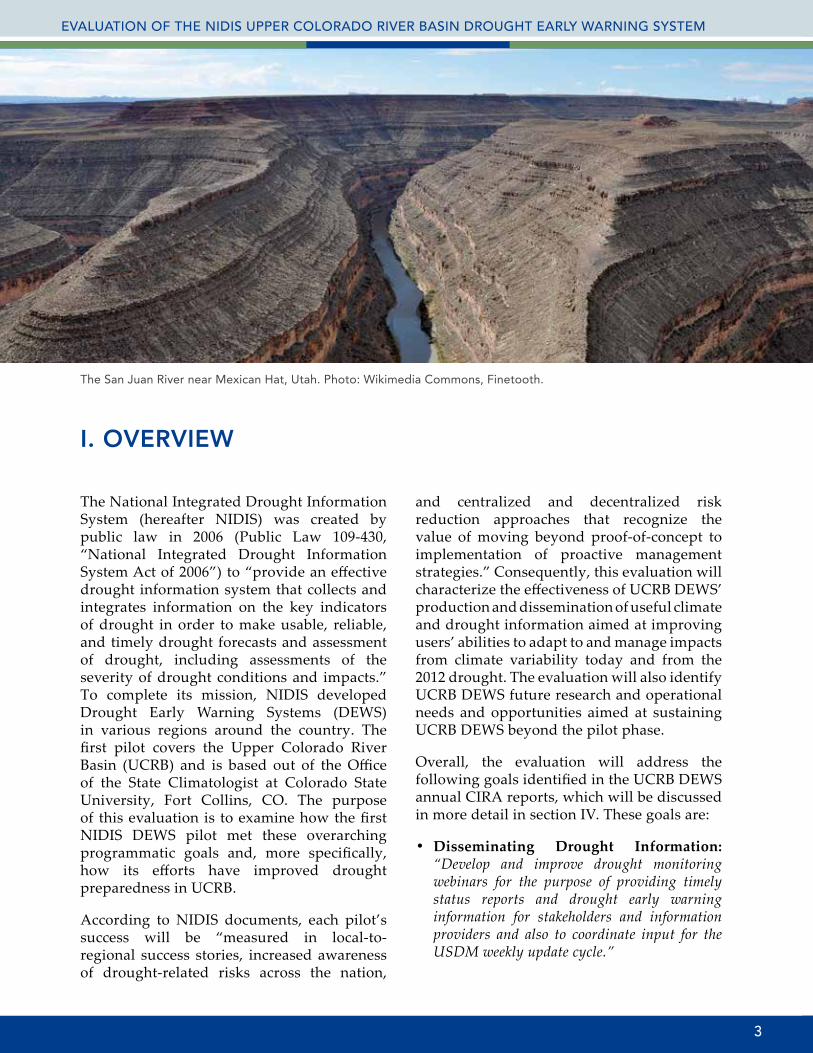
small population of decision makers. Users also expressed a desire for more information scaled to specific river basins and sub-basins, e.g. Poudre/Big Thompson, because of the importance of individual basins in supplying water for irrigation purposes. One identified the Bureau of Rec river basin data as an example to strive for. One user also requested information about aquifer levels to better inform irrigation decisions. Another user suggested developing current or recent “unregulated, virgin or natural” streamflow information at various stations. Another requested better estimates of mountain spring runoffs.
Additional climate information was another identified need. Several users expressed the need for climate information that general or lay audiences could use to communicate and educate the public about climate change. Several users also wanted to learn more about the information that is available, how to access it, how to understand it, and how to use it. These respondents self-identified as new users of climate information for decision making applications. One related request was to get better-forecasted impacts related to climate change. More user-friendly graphics could aid in this goal. Several respondents requested better forecasts, especially through winter months, and earlier warnings for climate variability on seasonal scales. On a related note, they also wanted greater accuracy in forecasts and better long-range outlooks that could help improve decision making.
Users also request a range of other data. One requested that existing data be linked, where possible, with regional storm information. One identified the need for more dust on snow reports and data showing how dust is affecting snowpack, e.g. using comparison charts. They also wanted to know about the impacts of ‘red flag’ warning weather on snowpack in the spring and soil moisture content in summer. One user requested sea surface temperature anomaly patterns and trends in hydro-climate
indices, e.g. PDO, AMO, AO, NAO. One user wanted to see predicted wind speeds, and another wanted to see information on upper air patterns in the Northern hemisphere, the number of disturbances, and height departures from normal. They noted that this information used to be shared in the Water Availability Task Force meetings. Finally, one user requested monthly weather forecasts.
B. Improving the process of information delivery
Users were asked to identify the ways in which the delivery of climate information could be improved. Most users expressed satisfaction with how information is delivered, commenting that “They do a great job”, or, “They provide great information.” Other ‘greats’ include the graphics, web interface and simplicity in using the tabs, compilation of resources, and how such information has helped improve decision making. Additionally, users said they were grateful to be asked for feedback in the process of this evaluation, indicating that this represents “their open and transparent” processes that the UCRB DEWS seems to use. Users also said that through this evaluation they have learned about additional tools and data that they will begin to access.
Two users expressed a desire be a part of the broader discussion of weather and climate-related events. One asked to be notified when local, state, and national representatives discuss related issues so that they could participate in the conversation. Several users expressed a desire to be notified more often when data or other information is updated or when webinars are scheduled. One explained this as conference call updates or “ask the climatologist” reports that could be aimed at a radio audience and delivered once a month. Another wanted better navigation or a ‘site guide’ to help them find the information more easily.
26
III. RESULTS FROM SURVEY AND INTERVIEWS

IV. PROJECT GOALS, NIDIS-DEFINED OBJECTIVES AND PILOT PROTOCOLS
After 14 years of drought, Lake Powell was at 42 percent of its capacity as of May 20, 2014. Photo: NASA Earth Observatory, Robert Simmon, using Landsat data from the U.S. Geological Survey.
This section of the evaluation identifies and discusses project goals established by UCRB DEWS and goals established by NIDIS for the pilot programs (these are not, however, specific to UCRB DEWS). The goals are listed in the UCRB DEWS annual reports, in several NIDIS documents, and in early program planning material. The NIDIS goals and metrics were not the central focus of this evaluation, but it is worth leveraging the data collected to examine them for the purpose of understanding more about UCRB DEWS and future pilot programs. The section begins by looking at the UCRB DEWS project goals, then the NIDIS-defined goals.
1. UCRB DEWS Project Goals
The following goals are stated in the UCRB DEWS annual CIRA reports. No metrics, milestones, or other guiding information were listed in the reports.
A. Disseminating Drought Information
“Develop and improve drought monitoring webinars for the purpose of providing timely status reports and drought early warning information for stakeholders
and information providers and also to coordinate input for the USDM weekly update cycle.”
UCRB DEWS has demonstrated the ability to develop and revise, on an ongoing basis, new information, drought products and delivery mechanisms. Examples include the tea-cup diagrams and the Colorado-Utah-Wyoming drought maps. They have consistently provided weekly drought updates for several years, most of which are webinars. The webinar format enables UCRB DEWS to inform the development of the US Drought Monitor via ongoing and iterative interaction with its authors and other users in the region. UCRB DEWS has also sought feedback from its users through informal interaction, and has made some adjustments to the web format accordingly, for example, by adding the ‘tab’ features on the most recently updated web site.
B. Expand Partnerships
“Expand active participation and strategically engage multiagency expertise from Utah and Wyoming to improve the quality and cross-border consistency of USDM products.”
EVALUATION OF THE NIDIS UPPER COLORADO RIVER BASIN DROUGHT EARLY WARNING SYSTEM
27

Expansion of UCRB DEWS activities into Wyoming and Utah remains problematic, as evidenced by the demographic results from the survey. This raises questions, however, about what constitutes adequate ‘coverage’ for UCRB DEWS. Though only a portion of each of the three states (Colorado, Utah, Wyoming) comprises the Upper Colorado River Basin, UCRB DEWS from the outset has attempted to provide more comprehensive information for all of the states and for areas both inside and outside of the basin, particularly in Colorado, where the UCRB DEWS is located. Despite UCRB DEWS’ efforts to include all three states, and even though Utah and Wyoming share partial spatial coverage of the UCRB, Colorado is still disproportionately represented among users. This problem of gaining adequate access to resources, partners and users in Utah and Wyoming is not unique to the UCRB DEWS. Other climate-service providers (e.g. Western Water Assessment) have faced similar challenges for a variety of reasons, including lack of human and financial capital to extend outreach to Utah and Wyoming, and lack of human capital, interest, and expertise in those states. UCRB DEWS has informal and formal partnerships both inside and outside of Colorado, including such organizations as the Colorado Basin River Forecasting Center, Colorado Water Conservation Board, and the National Weather Service in all three states, among others. Cross-state collaboration appears to be strong.
C. Evaluate UCRB DEWS
“Systematically conduct formative and summative evaluation with emphasis on stakeholder impact and changes in confidence and use of drought products and information over time.”
UCRB DEWS initiated this summative evaluation in 2013 to meet this goal. Delay in completion of this evaluation (on the evaluator’s part) has limited UCRB DEWS’s ability to move forward with the evaluation information. Other limitations inherent to UCRB DEWS, however, limit comprehensive evaluation opportunities. First, UCRB DEWS’ internal record keeping is limited and somewhat ad-hoc, lacking adequate
systematicity necessary for longitudinal evaluation. Second, it is somewhat unclear to this evaluator what goals and metrics UCRB DEWS would use in ongoing evaluation. This evaluation provides a comprehensive baseline from which to build future evaluations in order to track changes in perceptions, and use, of drought information. Ad-hoc and somewhat arbitrary evaluation protocols are not unusual in new, entrepreneurial organizations, so it is not entirely surprising to see this level of evaluation undertaken in UCRB DEWS.
2. NIDIS-Defined Goals
Results from this section of the evaluation are drawn from archival material, the survey, and semi-structured interviews. Evaluating the NIDIS-defined goals for the DEWS pilots (see Table 8) was difficult for several reasons. First, the only guidance NIDIS gives for pursuing these goals is somewhat limited, in that how to achieve them is left to the interpretation of the UCRB DEWS pilot. This is not unusual, however, given that UCRB DEWS was the first pilot for the NIDIS program, and first/early programs tend to be much more entrepreneurial than older, established programs. To this extent, latitude in pursuing goals is actually useful so that the program can experiment with various approaches. Second, NIDIS does provide extensive metrics for evaluating success, but the availability of data from the UCRB DEWS makes it very difficult to use such metrics in evaluation. In many cases there just aren’t enough data. To simplify the use of metrics, the evaluator summarized key metrics for purposes of evaluation (see the third column in Table 8). Finally, the evaluator also identified the methods for gathering the data (see the fourth column in Table 8). What follows is a general overview of UCRB DEWS’s work to achieve the goals for each sub-system.
A. Engagement and Public Awareness
Engagement with the public has been strong, particularly in Colorado, and less so in Utah and Wyoming. Attendance at the webinars remained fairly consistent over the past few years, although it does change seasonally. Participation also increased during the 2012
28
IV. PROJECT GOALS, NIDIS-DEFINED OBJECTIVES AND PILOT PROTOCOLS

drought year, but numbers of attendees shrank in the following year. (See section III for more detailed information about webinar attendance and web site visits). Determining overall impact on education and public awareness is difficult because of a lack of a baseline from which to evaluate progress, and lack of any comparison with similar groups.
UCRB DEWS did improve users’ understanding of drought and drought conditions in their region, their sector and in their job, suggesting that it has met a major goal. Many of the more savvy users, as self-described in the survey, were already familiar with many of the products provided by UCRB DEWS. They used the UCRB DEWS Webinar because of the ease in accessing multiple products simultaneously from the UCRB DEWS site, and the added benefit of being able to interact with UCRB DEWS personnel during the webinar. Webinar interactions
also benefited the less savvy users. Several noted that their understanding of drought has improved over the past couple of years, prompted by the 2012 drought. The greatest improvement in their understanding of drought conditions and impacts is related to thresholds—that is, “when we need to start thinking about a drought scenario”—and to triggers. One stakeholder explained, “We have a better idea about what to look for with drought indicators because of what [UCRB DEWS] put on its webinars.”
B. Integrate Monitoring and Forecasting
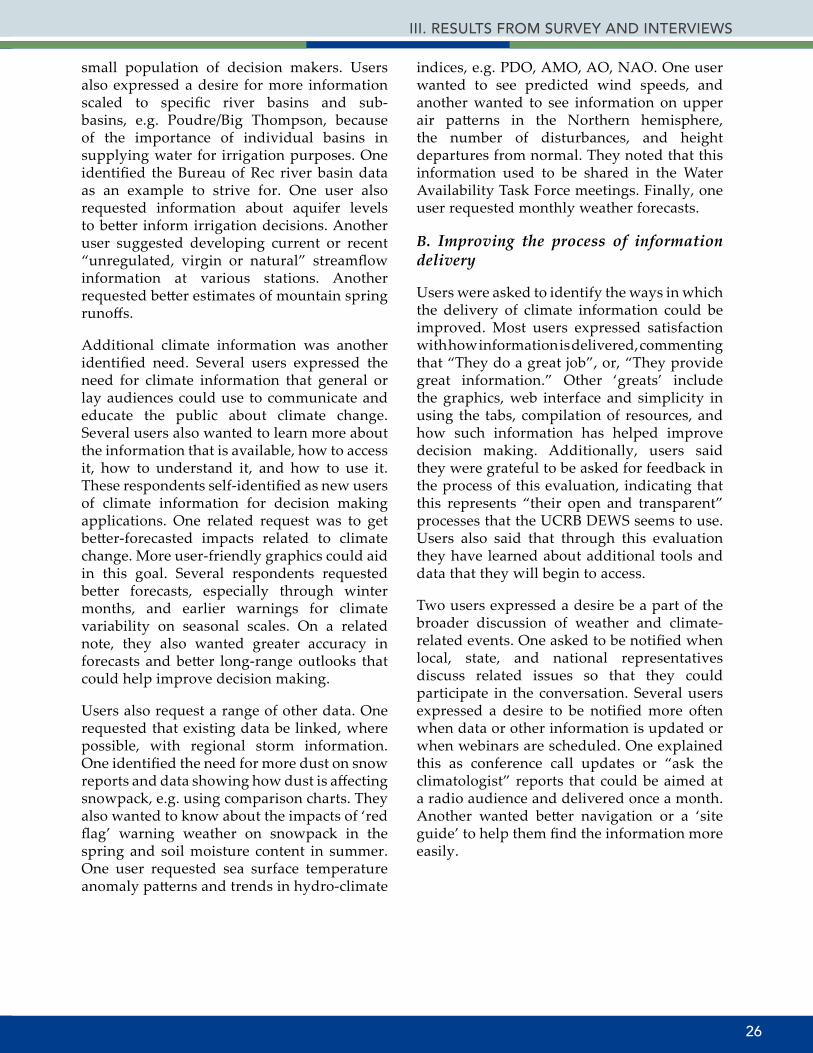
Overall, UCRB DEWS’ ability to provide information that integrates monitoring and forecasting is strong. Eight of its products reflect current conditions (see Table 9), and two others project future conditions. Results from the survey and semi-structured interviews indicate a high degree of satisfaction with
Table 8: NIDIS Goals for Each Sub-System.
Sub-system Goals Metrics (coarse)
SUMMARIZED BY EVALUATOR
Method/process to assess
IDENTIFIED BY EVALUATOR
Education and public awareness
Raise necessary public awareness of drought- related risks and sensitivities
Public engagement with UCRB Drought Portal, Weekly Summaries, changed understanding of droughts, or identified use of drought information
Web metrics (# of hits, trends, # webinar attendees vs online access), characterization of stakeholder community, outreach material produced, number of talks to non-academic audiences, media outreach and press releases, outcomes reporting from online survey, semi-structured interviews (SSIs)
Integrate monitoring and forecasting
Project emerging conditions in the physical environment and contribute to the better understanding of present conditions and past events
Weekly Summaries, research and synthesis outputs, new understanding of monitoring and forecast conditions
Characterization of content from Weekly Summaries, identification of additional information needs of stakeholders, results from online survey, white papers and peer-reviewed publications
Develop risk assessment
Enable resource and other management authorities to generate risk and impact scenarios (e.g., monitoring and forecast tailoring for trigger definition)
Triggers identified, information tailored to triggers
White papers and reports, outreach material, identification of interested authorities, SSIs, development of risk scenarios
Engage preparedness
Outline and inform actions required to reduce the loss and damage expected from an impending hazard event
Contribution to emergency drought plans or products, characterization of impacts
Identification of actions taken by UCRB, outreach activities aimed at intended communities, # of communities engaged, characterization of resources likely impacted, plans informed or altered, SSIs
Evaluation and feedback
Work on subsystems to refine the NIDIS process and for transferability to similar locations/regions. This will help foster development of new technologies and technology transfer for more efficient water resource management
Using these goals, conduct planning, develop objectives, identify metrics, evaluate, report, and revise goals as necessary.
Develop material from NIDIS, documents and MOUs between NIDIS and UCRB, internal planning documents of UCRB, evidence of evaluation process, reports
EVALUATION OF THE NIDIS UPPER COLORADO RIVER BASIN DROUGHT EARLY WARNING SYSTEM
29
the information products provided by UCRB DEWS. ENSO and Evapotranspiration products consistently ranked low in value for users, despite their potential value to inform future conditions, especially with ENSO. Opportunities exist to educate users about how to use these products. The forecasts (T and P) were two of the most valued products. As discussed in section III, most users’ needs for additional information related to data produced at finer resolutions and more historical data. In terms of forecasts, users wanted better (more accurate) outlooks and better projections of climate change impacts. Opportunities exist for UCRB DEWS to explore additional forecast products or to present existing data in novel ways. Informing users about how to use products that report current conditions is one point of leverage for improving the integration of monitoring and forecasting.
C. Develop risk assessment
It is unclear in this evaluation if and how users are leveraging UCRB DEWS products in order to generate risk and impact scenarios. Not a single user in the survey mentioned them, and only two mentioned them during the semi-structured interviews. In those cases they indicated that their organization was planning to develop risk assessment tools but had not yet done so. Only a small percentage of users are using drought information for planning. According to survey results, only 6% and 11% indicated they are using information to plan for droughts in 1 to 3 years or in 3 to 5 years (respectively).
D. Engage preparedness
Archival data and interviews with UCRB DEWS personnel indicate that at this time there is little activity related to engaging
preparedness. Opportunities exist to begin comprehensive engagement activities.
E. Evaluation and feedback
UCRB DEWS has no formal evaluation protocol in place, nor has it established adequate processes to support it. Data collection of outputs is minimal, and many opportunities to record operational successes are missed due to the lack of systematic tracking efforts. For example, UCRB DEWS engages with local media and conducts outreach with the public dozens of times each year, but none of these is recorded formally. Improvements in reporting could improve ability to evaluate and to disseminate best practices to other DEWS pilots—through better tracking of press releases and mentions in the press, workshops attended or talks given, informal phone interactions, white papers, peer-reviewed publications, and reports. The annual reports, in their present format, do not adequately convey UCRB DEWS’ successes and or highlight leveraged opportunities. Moreover, UCRB DEWS lacks any strategic plan or implementation process, which also inhibits evaluation and feedback. It is also unclear how formal feedback occurs from NIDIS to UCRB DEWS, although informal feedback and engagement is ongoing and iterative. Feedback from users occurs informally, through telephone conversations initiated by both UCRB DEWS and the user, but not necessarily for that purpose alone. Improved evaluation protocols will also enable UCRB DEWS to provide more credible responses about whether or not they reached the goals of Integration of Monitoring and Forecasting, Develop Risk Assessment, and Engaging Preparedness.
Table 9: List of Monitoring and Forecasting Products.
Current Conditions ForecastsDrought T and P Forecasts and OutlooksEvapotranspirationRecent PrecipitationRecent TemperatureSNOTEL and SnowpackStandardized Precipitation IndexStreamflowWater StorageSoil MoistureENSO
30
IV. PROJECT GOALS, NIDIS-DEFINED OBJECTIVES AND PILOT PROTOCOLS

V. RECOMMENDATIONS
Glen Canyon Bridge Photo: Wikimedia Commons, Ba’Gamnan.
This section reviews the findings from sections III and IV. The following recommendations are considered to be within the capacity of UCRB DEWS to accomplish. UCRB DEWS will not be able to respond effectively to all of these recommendations, but should respond to those that are informed by a robust strategic plan.
1. Expand Demographic Coverage
Utah and Wyoming are underrepresented among survey respondents and webinar attendees. UCRB DEWS should develop strategies that increase representation in those states. It should also continue to build relationships with climate-service providers in those states. It is possible that both efforts could result in synergistic benefits.
2. Branding and Streamlining
Responses from the survey indicate that some brand ambiguity exists. ‘NIDIS’, ‘National Integrated Drought Information Service’, ‘Drought Early Warning System’ and the ‘US Drought Portal’ are all the same, or part of the same family of services and products. UCRB DEWS and NIDIS should consider ways to
improve brand identity to clarify purpose, products, and services, and where possible, eliminate redundancy between them or, alternatively, add value to each.
3. Targeted Education
Some products, for example ENSO and Evapotranspiration, are potentially useful for improving understanding of drought and for informing decisions, but they are not valued by users. UCRB DEWS should develop short educational modules or other outreach activities to raise users’ understanding of such products and their potential value for planning.
4. Additional Information Needs
Users indicated a desire to see some products produced at more refined scales, e.g. reservoir levels, streamflow, and spatial coverage in river basins. Doing so will require more resources and capabilities than the UCRB DEWS, and perhaps even NIDIS, has at this time. Nevertheless it is worth exploring if and how such products could be used, or how existing products could serve some of these needs.
EVALUATION OF THE NIDIS UPPER COLORADO RIVER BASIN DROUGHT EARLY WARNING SYSTEM
31
5. Strategic Planning
UCRB DEWS lacks a strategic plan. UCRB DEWS should conduct a strategic planning process and adopt a plan to help guide decision making, operations, and evaluation.
6. Evaluation and Accountability
Aside from this evaluation, UCRB DEWS does not currently have the mechanisms in place to conduct either longitudinal or episodic evaluation. While some goals have been set, overall there is a lack of metrics to help guide evaluation. Additionally, UCRB DEWS needs to improve its recordkeeping of activities to inform evaluation. Evaluation processes should be tied to the goals, objectives, and strategies identified in the strategic plan.
7. Develop Risk Assessment and Engage Preparedness
Greater attention needs to be paid to the development and deployment of risk assessment tools and procedures. UCRB DEWS should also expand its capabilities and develop necessary relationships to improve activities related to engaging preparedness.
8. Identify Services Overlap
As the climate-services market expands, opportunities exist to explore ways in which to streamline services, identify services overlap, and increase efficiency in the development and deployment of climate and drought-related services with non-NIDIS entities.
32
V. RECOMMENDATIONS

APPENDIX IRaw Data of Importance of Product During Each Quarter of the Water Year
Drought
Evapotranspiration
Temperature and Precipitation Forecasts and Outlooks
Question Most important
Very important
Somewhat important
Not important
Don’t know Total Responses
October – December 8 32 34 1 4 79
January – March 18 43 14 3 4 82
April – June 37 31 9 1 4 82
July – September 30 35 14 0 4 83
Question Most important
Very important
Somewhat important
Not important
Don’t know Total Responses
October – December 1 13 29 21 12 76
January – March 0 16 27 23 11 77
April – June 23 17 18 11 11 80
July – September 28 11 19 12 9 79
Question Most important
Very important
Somewhat important
Not important
Don’t know
Total Responses Mean
October – December 11 28 30 3 5 77 2.52
January – March 17 29 23 3 5 77 2.35
April – June 26 32 14 2 5 79 2.09
July – September 22 31 19 2 5 79 2.20
EVALUATION OF THE NIDIS UPPER COLORADO RIVER BASIN DROUGHT EARLY WARNING SYSTEM
33

Recent Precipitation
Recent Temperature
SNOTEL and Snowpack
Question Most important
Very important
Somewhat important
Not important
Don’t know
Total Responses Mean
October – December 13 36 25 2 1 77 2.25
January – March 18 38 23 1 0 80 2.09
April – June 26 33 21 1 0 81 1.96
July – September 23 36 19 2 0 80 2.00
Question Most important
Very important
Somewhat important
Not important
Don’t know
Total Responses Mean
October – December 10 19 38 7 3 77 2.66
January – March 11 20 34 9 4 78 2.68
April – June 20 22 28 7 3 80 2.39
July – September 18 22 27 7 4 78 2.45
Question Most important
Very important
Somewhat important
Not important
Don’t know
Total Responses Mean
October – December 23 31 20 4 1 79 2.10
January – March 39 31 7 2 1 80 1.69
April – June 25 28 21 3 2 79 2.10
July – September 6 10 26 30 4 76 3.21
34
APPENDIX I

APPENDIX IRaw Data of Importance of Product During Each Quarter of the Water Year
SPI (Standard Precipitation Index)
Streamflow
Water Storage
Question Most important
Very important
Somewhat important
Not important
Don’t know Total Responses
October – December 4 29 27 7 11 78
January – March 8 30 23 7 11 79
April – June 15 27 20 7 11 80
July – September 12 25 24 7 11 79
Question Most important
Very important
Somewhat important
Not important
Don’t know Total Responses
October – December 6 23 33 14 3 79
January – March 8 32 23 12 4 79
April – June 36 26 10 5 3 80
July – September 22 33 16 7 2 80
Question Most important
Very important
Somewhat important
Not important
Don’t know Total Responses
October – December 13 28 24 11 3 79
January – March 17 34 18 9 2 80
April – June 25 29 16 8 2 80
July – September 21 34 14 9 2 80
EVALUATION OF THE NIDIS UPPER COLORADO RIVER BASIN DROUGHT EARLY WARNING SYSTEM
35

Soil Moisture
ENSO (El Niño Southern Oscillation)
Question Most important
Very important
Somewhat important
Not important
Don’t know Total Responses
October – December 8 28 30 10 3 79
January – March 9 29 28 9 4 79
April – June 25 29 18 5 3 80
July – September 20 33 18 6 3 80
Question Most important
Very important
Somewhat important
Not important
Don’t know Total Responses
October – December 11 13 26 10 20 80
January – March 13 13 23 11 20 80
April – June 11 12 26 11 20 80
July – September 11 13 25 10 20 79
36
APPENDIX I

APPENDIX IITotal Webinar Attendance 2012-2014
Week 2012 2013 2014January 1-7
January 8-14 16
January 15-21 22 26
January 22-28
January 29-31 14
February 1-7
February 8-14 13 13
February 15-21 10 30
February 22-28 10 11
March 1-7
March 8-14 17 28
March 15-21 12 27
March 22-28 9 22
March 29-31
April 1-7 16
April 8-14 10 38
April 15-21 16
April 22-28 14 32
April 29-31 33
May 1-7 14
May 8-14 19 18
May 15-21 7 17
May 22-28 16 20
May 29-31 17
June 1-7 12
June 8-14 24 14
June 15-21 21 20
June 22-28 24 19
June 29-30
July 1-7 22
July 8-14 17 20
July 15-21 26 20
EVALUATION OF THE NIDIS UPPER COLORADO RIVER BASIN DROUGHT EARLY WARNING SYSTEM
37
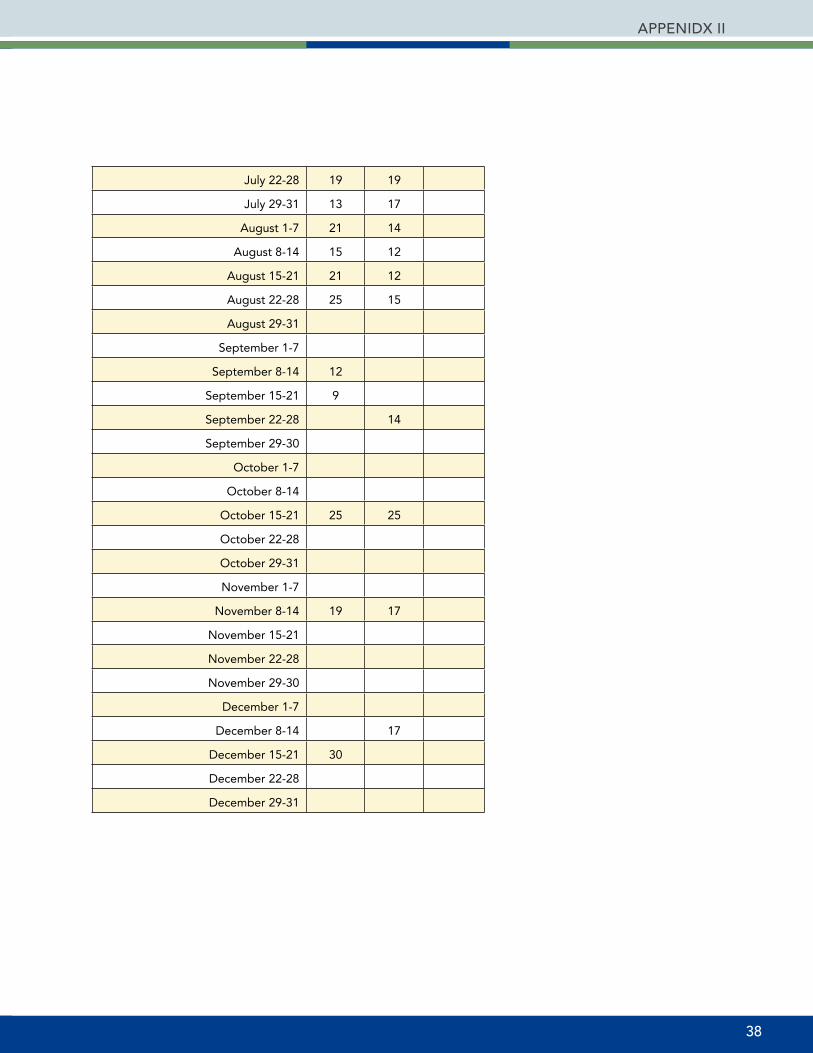
July 22-28 19 19
July 29-31 13 17
August 1-7 21 14
August 8-14 15 12
August 15-21 21 12
August 22-28 25 15
August 29-31
September 1-7
September 8-14 12
September 15-21 9
September 22-28 14
September 29-30
October 1-7
October 8-14
October 15-21 25 25
October 22-28
October 29-31
November 1-7
November 8-14 19 17
November 15-21
November 22-28
November 29-30
December 1-7
December 8-14 17
December 15-21 30
December 22-28
December 29-31
38
APPENIDX II

APPENDIX IIIUsers’ Value Demands Framework
Identifying specific outcomes or longer-term accomplishments from outputs of UCRB activities is particularly challenging for several reasons. The complicated nature of climate change and drought forecasting involving varied temporal, spatial, and governance scales and complex coupled-human and environmental systems, makes attribution of outcomes to any specific UCRB activity difficult. Some outcomes may elide clear evaluation, for example, when stakeholders seek to reduce vulnerabilities to harms that never occur.
Evaluating programmatic effectiveness based on stakeholders’ satisfaction with their value
demands for policies is a reasonably good proxy for evaluating outcomes. The ‘Policy Sciences’ was developed over several decades by the late Harold Lasswell to provide a heuristic for robust, problem-oriented policy analysis. Put simply, a policy is a commitment to a course of action by actors seeking specific value demands which may be short term objectives, longer-term outcomes, or may also be a means by which to accomplish other value demands and goals (1971).
Policy Sciences uses a typology of eight value categories to encompass the complete array of desired values and goals sought in a policy. Eliciting stakeholder feedback on the attainment or deprivation of these value demands provides a robust proxy for identifying and assessing outcomes of UCRB activities. Some of the value demands
Table 1: Value Demands Framework(Adapted from Lasswell, 1971)
Value Description UCRB-Related Examples
AffectionFriendliness, giving and
receiving friendship, loyaltyDevelopment of relationships between UCRB and stakeholders or among stakeholder networks, development of social capital
EnlightenmentInformativeness, gathering and spreading information,
learning
New understanding of climate systems, knowledge of future likely drought impacts, clarification of vulnerabilities,
understanding of how drought information matters in a particular knowledge system
PowerMaking decisions that can be enforced, alignment, politics
Developing drought mitigation policies, justifying adoption of specific policy alternatives, justifying previous policy decisions,
invocation and application of drought-mitigation policies
RectitudeMorality, responsibility of
conduct
Production of credible scientific, drought-related information, meeting ethical standards, providing moral justification for
decisions
RespectDistinction, recognition and mutual honoring of freedom
of choice
Attention to contextual needs of decision makers, perception of UCRB as legitimate actor, development and deployment of
social capital
SkillCraftsmanship, ability to gain and exercise excellence in a
specialized operation
Development of decision tools, regional climate or drought models, synthesizing drought information, etc.
WealthProduction and distribution of
goods and services
Money or resources saved or avoided by adopting and implementing drought-mitigation plans, improving operations
of hydropower facilities, education and training activities
Well-beingSalubrity, safety, health and
comfortHarm to humans or environment mitigated or avoided,
improved resilience to droughts, improved public safety
EVALUATION OF THE NIDIS UPPER COLORADO RIVER BASIN DROUGHT EARLY WARNING SYSTEM
39

are obvious in evaluating outcomes, such as “wealth” (has the use of UCRB outputs or information led to any cost-savings?) and “well-being” (has UCRB outputs or information led to enhanced resilience, improved public health or a reduction in environmental harms?). Other value demands may not be as obvious, such as “respect” and “affection”, “power” or “enlightenment”, yet each points to important outcomes that are valuable alone, but more importantly, valued for their currency in achieving more value demands and improved outcomes.
“Enlightenment” describes the accumulation of knowledge and understanding and is an important means to achieving other value demands. Changing mental models, paradigms, values, beliefs and attitudes toward climate change is critical in preparing individuals and organizations to integrate, operationalize, and deploy climate-related information in actual decisions.
The value “power” also serves dual purposes in outcomes. Obtaining and exercising power, or the ability to make decisions and exercise choice, whether within an organization or concerning a larger policy alternative, lies at the heart of policy-making and hence improving adaptive responses to climate variability and change. Power may be gained by acquiring knowledge, establishing knowledge networks, acquiring new skills or wealth, or may result in the attainment of additional social capital. Power in turn increases the likelihood that additional value demands can be acquired by stakeholders.
The semi-structured interview protocol was designed to elicit feedback on each of the eight value demands in order to identify outcomes of UCRB work.
40
APPENDIX III

Western Water Assessment
http://wwa.colorado.edu