Embed Size (px)
Citation preview

Seediscussions,stats,andauthorprofilesforthispublicationat:https://www.researchgate.net/publication/316239789
EvaluationoftheminiatureparticlecounterLOACforthesurveyofstratosphericaerosolswithmeteorologicalballoons
Poster·January2017
CITATIONS
0
READS
102
13authors,including:
Someoftheauthorsofthispublicationarealsoworkingontheserelatedprojects:
ANRTRO-PicoViewproject
ContrailsViewproject
DamienVignelles
CNRSOrleansCampus
22PUBLICATIONS66CITATIONS
SEEPROFILE
J.P.Vernier
ScienceSystemsandApplications,Inc.
67PUBLICATIONS1,242CITATIONS
SEEPROFILE
SergeyKhaykin
LATMOS
80PUBLICATIONS496CITATIONS
SEEPROFILE
AllcontentfollowingthispagewasuploadedbyDamienVignelleson19April2017.
Theuserhasrequestedenhancementofthedownloadedfile.
● Summary:
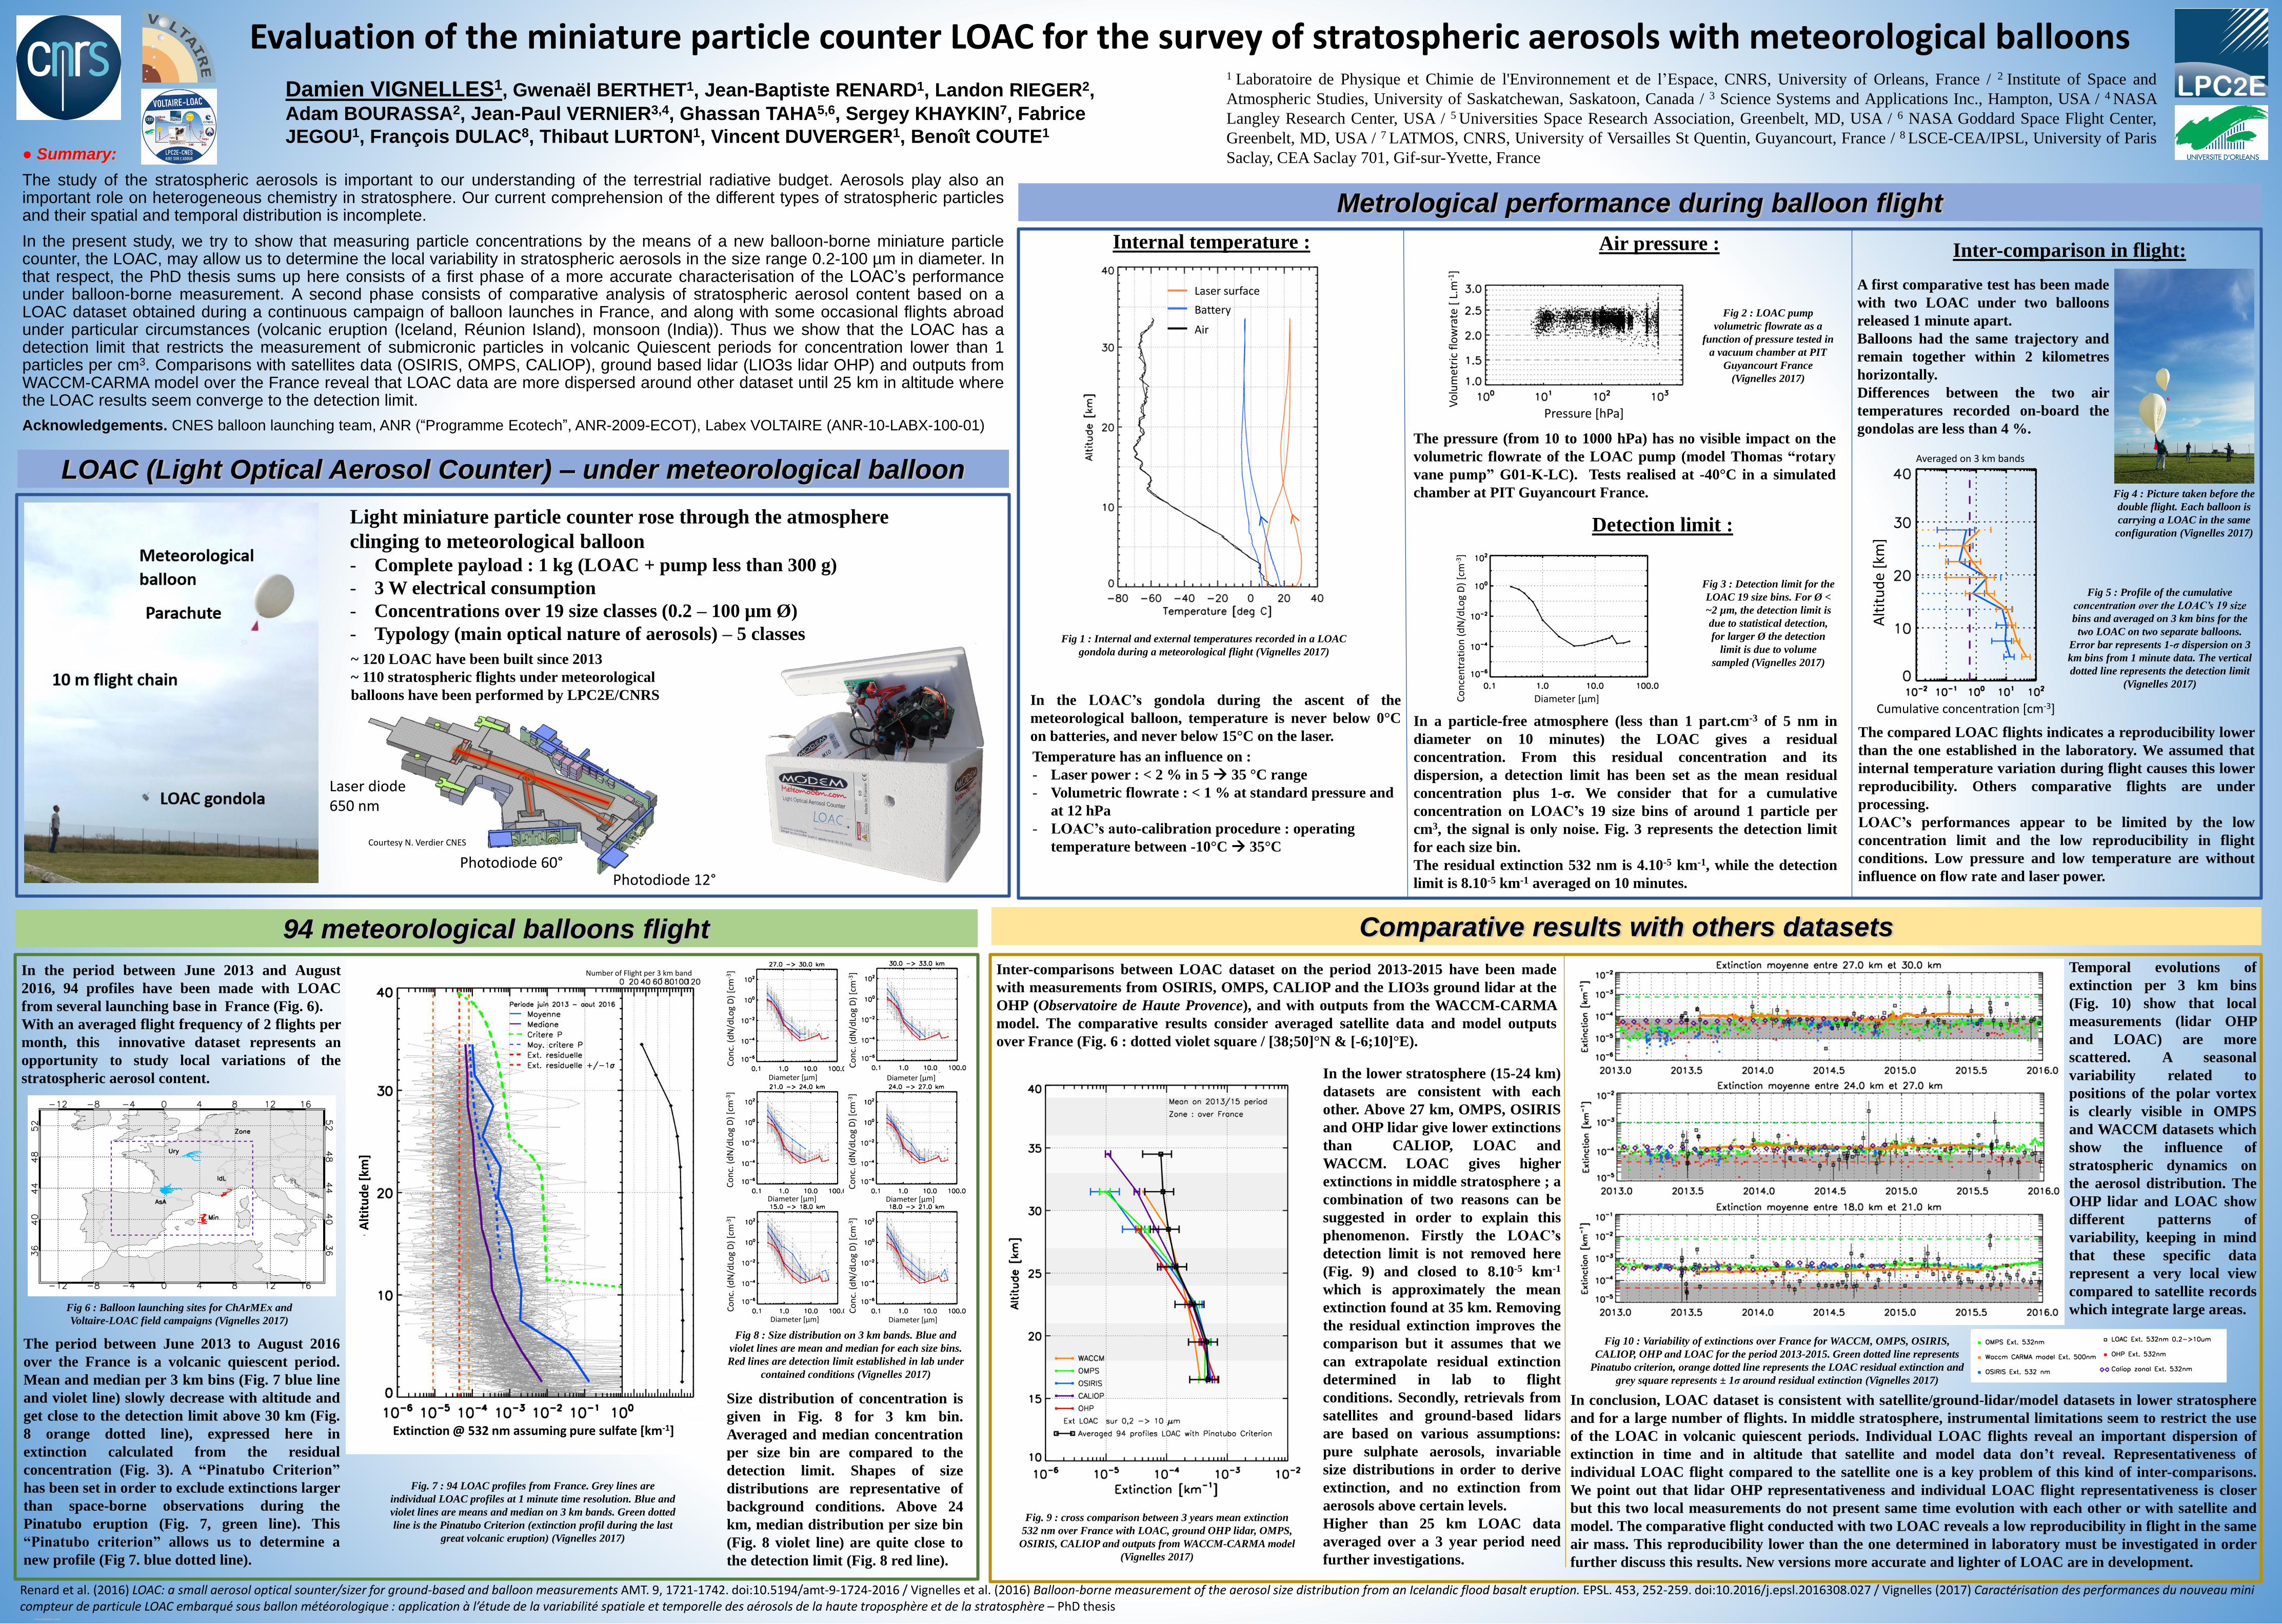
The study of the stratospheric aerosols is important to our understanding of the terrestrial radiative budget. Aerosols play also animportant role on heterogeneous chemistry in stratosphere. Our current comprehension of the different types of stratospheric particlesand their spatial and temporal distribution is incomplete.
In the present study, we try to show that measuring particle concentrations by the means of a new balloon-borne miniature particlecounter, the LOAC, may allow us to determine the local variability in stratospheric aerosols in the size range 0.2-100 µm in diameter. Inthat respect, the PhD thesis sums up here consists of a first phase of a more accurate characterisation of the LOAC’s performanceunder balloon-borne measurement. A second phase consists of comparative analysis of stratospheric aerosol content based on aLOAC dataset obtained during a continuous campaign of balloon launches in France, and along with some occasional flights abroadunder particular circumstances (volcanic eruption (Iceland, Réunion Island), monsoon (India)). Thus we show that the LOAC has adetection limit that restricts the measurement of submicronic particles in volcanic Quiescent periods for concentration lower than 1particles per cm3. Comparisons with satellites data (OSIRIS, OMPS, CALIOP), ground based lidar (LIO3s lidar OHP) and outputs fromWACCM-CARMA model over the France reveal that LOAC data are more dispersed around other dataset until 25 km in altitude wherethe LOAC results seem converge to the detection limit.
Acknowledgements. CNES balloon launching team, ANR (“Programme Ecotech”, ANR-2009-ECOT), Labex VOLTAIRE (ANR-10-LABX-100-01)
Evaluation of the miniature particle counter LOAC for the survey of stratospheric aerosols with meteorological balloons
Damien VIGNELLES1, Gwenaël BERTHET1, Jean-Baptiste RENARD1, Landon RIEGER2,
Adam BOURASSA2, Jean-Paul VERNIER3,4, Ghassan TAHA5,6, Sergey KHAYKIN7, Fabrice
JEGOU1, François DULAC8, Thibaut LURTON1, Vincent DUVERGER1, Benoît COUTE1
1 Laboratoire de Physique et Chimie de l'Environnement et de l’Espace, CNRS, University of Orleans, France / 2 Institute of Space and
Atmospheric Studies, University of Saskatchewan, Saskatoon, Canada / 3 Science Systems and Applications Inc., Hampton, USA / 4 NASA
Langley Research Center, USA / 5 Universities Space Research Association, Greenbelt, MD, USA / 6 NASA Goddard Space Flight Center,
Greenbelt, MD, USA / 7 LATMOS, CNRS, University of Versailles St Quentin, Guyancourt, France / 8 LSCE-CEA/IPSL, University of Paris
Saclay, CEA Saclay 701, Gif-sur-Yvette, France
LOAC (Light Optical Aerosol Counter) – under meteorological balloon
Light miniature particle counter rose through the atmosphere
clinging to meteorological balloon
- Complete payload : 1 kg (LOAC + pump less than 300 g)
- 3 W electrical consumption
- Concentrations over 19 size classes (0.2 – 100 µm Ø)
- Typology (main optical nature of aerosols) – 5 classes
~ 120 LOAC have been built since 2013
~ 110 stratospheric flights under meteorological
balloons have been performed by LPC2E/CNRS
Metrological performance during balloon flight
Air pressure :
Vo
lum
etri
c fl
ow
rate
[ L
.m-1
]
Pressure [hPa]
The pressure (from 10 to 1000 hPa) has no visible impact on the
volumetric flowrate of the LOAC pump (model Thomas “rotary
vane pump” G01-K-LC). Tests realised at -40°C in a simulated
chamber at PIT Guyancourt France.
Fig 2 : LOAC pump
volumetric flowrate as a
function of pressure tested in
a vacuum chamber at PIT
Guyancourt France
(Vignelles 2017)
Detection limit :
In a particle-free atmosphere (less than 1 part.cm-3 of 5 nm in
diameter on 10 minutes) the LOAC gives a residual
concentration. From this residual concentration and its
dispersion, a detection limit has been set as the mean residual
concentration plus 1-σ. We consider that for a cumulative
concentration on LOAC’s 19 size bins of around 1 particle per
cm3, the signal is only noise. Fig. 3 represents the detection limit
for each size bin.
The residual extinction 532 nm is 4.10-5 km-1, while the detection
limit is 8.10-5 km-1 averaged on 10 minutes.
Co
nce
ntr
atio
n (
dN
/dLo
gD
) [c
m-3
]
Diameter [µm]
Fig 3 : Detection limit for the
LOAC 19 size bins. For Ø <
~2 µm, the detection limit is
due to statistical detection,
for larger Ø the detection
limit is due to volume
sampled (Vignelles 2017)
Internal temperature :
In the LOAC’s gondola during the ascent of the
meteorological balloon, temperature is never below 0°C
on batteries, and never below 15°C on the laser.
Laser surface
Battery
Air
Temperature has an influence on :
- Laser power : < 2 % in 5 35 °C range
- Volumetric flowrate : < 1 % at standard pressure and
at 12 hPa
- LOAC’s auto-calibration procedure : operating
temperature between -10°C 35°C
Fig 1 : Internal and external temperatures recorded in a LOAC
gondola during a meteorological flight (Vignelles 2017)
Fig 5 : Profile of the cumulative
concentration over the LOAC’s 19 size
bins and averaged on 3 km bins for the
two LOAC on two separate balloons.
Error bar represents 1-σ dispersion on 3
km bins from 1 minute data. The vertical
dotted line represents the detection limit
(Vignelles 2017)
Inter-comparison in flight:
A first comparative test has been made
with two LOAC under two balloons
released 1 minute apart.
Balloons had the same trajectory and
remain together within 2 kilometres
horizontally.
Differences between the two air
temperatures recorded on-board the
gondolas are less than 4 %.
Alt
itu
de
[km
]
Cumulative concentration [cm-3]
Averaged on 3 km bands
The compared LOAC flights indicates a reproducibility lower
than the one established in the laboratory. We assumed that
internal temperature variation during flight causes this lower
reproducibility. Others comparative flights are under
processing.
LOAC’s performances appear to be limited by the low
concentration limit and the low reproducibility in flight
conditions. Low pressure and low temperature are without
influence on flow rate and laser power.
Fig 4 : Picture taken before the
double flight. Each balloon is
carrying a LOAC in the same
configuration (Vignelles 2017)
94 meteorological balloons flight
Laser diode650 nm
Photodiode 12°Photodiode 60°
Courtesy N. Verdier CNES
Comparative results with others datasets
In the period between June 2013 and August
2016, 94 profiles have been made with LOAC
from several launching base in France (Fig. 6).
With an averaged flight frequency of 2 flights per
month, this innovative dataset represents an
opportunity to study local variations of the
stratospheric aerosol content.
Alt
itu
de
[km
]
Extinction @ 532 nm assuming pure sulfate [km-1]
Number of Flight per 3 km band
Fig. 7 : 94 LOAC profiles from France. Grey lines are
individual LOAC profiles at 1 minute time resolution. Blue and
violet lines are means and median on 3 km bands. Green dotted
line is the Pinatubo Criterion (extinction profil during the last
great volcanic eruption) (Vignelles 2017)
Co
nc.
(d
N/d
Log
D)
[cm
-3]
Co
nc.
(d
N/d
Log
D)
[cm
-3]
Co
nc.
(d
N/d
Log
D)
[cm
-3]
Co
nc.
(d
N/d
Log
D)
[cm
-3]
Co
nc.
(d
N/d
Log
D)
[cm
-3]
Co
nc.
(d
N/d
Log
D)
[cm
-3]
Diameter [µm] Diameter [µm]
Diameter [µm] Diameter [µm]
Diameter [µm] Diameter [µm]
Fig 8 : Size distribution on 3 km bands. Blue and
violet lines are mean and median for each size bins.
Red lines are detection limit established in lab under
contained conditions (Vignelles 2017)
Fig 6 : Balloon launching sites for ChArMEx and
Voltaire-LOAC field campaigns (Vignelles 2017)
The period between June 2013 to August 2016
over the France is a volcanic quiescent period.
Mean and median per 3 km bins (Fig. 7 blue line
and violet line) slowly decrease with altitude and
get close to the detection limit above 30 km (Fig.
8 orange dotted line), expressed here in
extinction calculated from the residual
concentration (Fig. 3). A “Pinatubo Criterion”
has been set in order to exclude extinctions larger
than space-borne observations during the
Pinatubo eruption (Fig. 7, green line). This
“Pinatubo criterion” allows us to determine a
new profile (Fig 7. blue dotted line).
Inter-comparisons between LOAC dataset on the period 2013-2015 have been made
with measurements from OSIRIS, OMPS, CALIOP and the LIO3s ground lidar at the
OHP (Observatoire de Haute Provence), and with outputs from the WACCM-CARMA
model. The comparative results consider averaged satellite data and model outputs
over France (Fig. 6 : dotted violet square / [38;50]°N & [-6;10]°E).
Fig. 9 : cross comparison between 3 years mean extinction
532 nm over France with LOAC, ground OHP lidar, OMPS,
OSIRIS, CALIOP and outputs from WACCM-CARMA model
(Vignelles 2017)
In the lower stratosphere (15-24 km)
datasets are consistent with each
other. Above 27 km, OMPS, OSIRIS
and OHP lidar give lower extinctions
than CALIOP, LOAC and
WACCM. LOAC gives higher
extinctions in middle stratosphere ; a
combination of two reasons can be
suggested in order to explain this
phenomenon. Firstly the LOAC’s
detection limit is not removed here
(Fig. 9) and closed to 8.10-5 km-1
which is approximately the mean
extinction found at 35 km. Removing
the residual extinction improves the
comparison but it assumes that we
can extrapolate residual extinction
determined in lab to flight
conditions. Secondly, retrievals from
satellites and ground-based lidars
are based on various assumptions:
pure sulphate aerosols, invariable
size distributions in order to derive
extinction, and no extinction from
aerosols above certain levels.
Higher than 25 km LOAC data
averaged over a 3 year period need
further investigations.
Temporal evolutions of
extinction per 3 km bins
(Fig. 10) show that local
measurements (lidar OHP
and LOAC) are more
scattered. A seasonal
variability related to
positions of the polar vortex
is clearly visible in OMPS
and WACCM datasets which
show the influence of
stratospheric dynamics on
the aerosol distribution. The
OHP lidar and LOAC show
different patterns of
variability, keeping in mind
that these specific data
represent a very local view
compared to satellite records
which integrate large areas.
Fig 10 : Variability of extinctions over France for WACCM, OMPS, OSIRIS,
CALIOP, OHP and LOAC for the period 2013-2015. Green dotted line represents
Pinatubo criterion, orange dotted line represents the LOAC residual extinction and
grey square represents ± 1σ around residual extinction (Vignelles 2017)
Renard et al. (2016) LOAC: a small aerosol optical sounter/sizer for ground-based and balloon measurements AMT. 9, 1721-1742. doi:10.5194/amt-9-1724-2016 / Vignelles et al. (2016) Balloon-borne measurement of the aerosol size distribution from an Icelandic flood basalt eruption. EPSL. 453, 252-259. doi:10.2016/j.epsl.2016308.027 / Vignelles (2017) Caractérisation des performances du nouveau mini compteur de particule LOAC embarqué sous ballon météorologique : application à l’étude de la variabilité spatiale et temporelle des aérosols de la haute troposphère et de la stratosphère – PhD thesis
Size distribution of concentration is
given in Fig. 8 for 3 km bin.
Averaged and median concentration
per size bin are compared to the
detection limit. Shapes of size
distributions are representative of
background conditions. Above 24
km, median distribution per size bin
(Fig. 8 violet line) are quite close to
the detection limit (Fig. 8 red line).
In conclusion, LOAC dataset is consistent with satellite/ground-lidar/model datasets in lower stratosphere
and for a large number of flights. In middle stratosphere, instrumental limitations seem to restrict the use
of the LOAC in volcanic quiescent periods. Individual LOAC flights reveal an important dispersion of
extinction in time and in altitude that satellite and model data don’t reveal. Representativeness of
individual LOAC flight compared to the satellite one is a key problem of this kind of inter-comparisons.
We point out that lidar OHP representativeness and individual LOAC flight representativeness is closer
but this two local measurements do not present same time evolution with each other or with satellite and
model. The comparative flight conducted with two LOAC reveals a low reproducibility in flight in the same
air mass. This reproducibility lower than the one determined in laboratory must be investigated in order
further discuss this results. New versions more accurate and lighter of LOAC are in development.
View publication statsView publication stats