Embed Size (px)
Citation preview

Miami-Dade County Public SchoolsOffice of Evaluation and Research
1500 Biscayne BoulevardMiami, Florida 33132
Evaluation of the Comprehensive Reading Plan
Third Interim Report: 2000-01 School Year
April 2002
Principal Evaluator/Author: Marjorie K. Hanson, Ph.D.Computer Programmer: Vilma Rubiera


4 Evaluation of the Comprehensive Reading Plan

Evaluation of the Comprehensive Reading Plan v
Table of contents
Executive summary . . . . . . . . . . . . . . . . . . . . . . . . . . . . . . . . . . . . . . . . . . . . . . . . . . . . . . . . . . . . . ix
IntroductionReview of the literature . . . . . . . . . . . . . . . . . . . . . . . . . . . . . . . . . . . . . . . . . . . . . . . . . . . . . . . . 1Description of the program . . . . . . . . . . . . . . . . . . . . . . . . . . . . . . . . . . . . . . . . . . . . . . . . . . . . . 2Design of the evaluation . . . . . . . . . . . . . . . . . . . . . . . . . . . . . . . . . . . . . . . . . . . . . . . . . . . . . . . 4
Results of the evaluationTeacher training . . . . . . . . . . . . . . . . . . . . . . . . . . . . . . . . . . . . . . . . . . . . . . . . . . . . . . . . . . . . . 9Implementation of the plan . . . . . . . . . . . . . . . . . . . . . . . . . . . . . . . . . . . . . . . . . . . . . . . . . . . . 13Students’ independent reading . . . . . . . . . . . . . . . . . . . . . . . . . . . . . . . . . . . . . . . . . . . . . . . . . 20Provision of remediation . . . . . . . . . . . . . . . . . . . . . . . . . . . . . . . . . . . . . . . . . . . . . . . . . . . . . . 21Comparative efficacy of the plan . . . . . . . . . . . . . . . . . . . . . . . . . . . . . . . . . . . . . . . . . . . . . . . . 32Impact of the plan . . . . . . . . . . . . . . . . . . . . . . . . . . . . . . . . . . . . . . . . . . . . . . . . . . . . . . . . . . 33
Summary and recommendations . . . . . . . . . . . . . . . . . . . . . . . . . . . . . . . . . . . . . . . . . . . . . . . . . . . 41
References . . . . . . . . . . . . . . . . . . . . . . . . . . . . . . . . . . . . . . . . . . . . . . . . . . . . . . . . . . . . . . . . . . . 45
Appendix A: Comprehensive Reading Plan workshops offered by MDCPS . . . . . . . . . . . . . . . . . . 47
Appendix B: Elementary teachers receiving training in the methodology of teaching reading . . . . . . . . 51
Appendix C: Surveys of Reading Practices in Elementary and Secondary Schools . . . . . . . . . . . . . . 59
Appendix D: Scholastic Reading Inventory Standards . . . . . . . . . . . . . . . . . . . . . . . . . . . . . . . . . . . 69
Bureau Response/Plans of Action . . . . . . . . . . . . . . . . . . . . . . . . . . . . . . . . . . . . . . . . . . . . . . . . . . 75


Evaluation of the Comprehensive Reading Plan vii
List of tables
Table 1 Sources of data for the evaluation questions . . . . . . . . . . . . . . . . . . . . . . . . . . . . . . . . 5
Table 2 Elementary schools by level of need categories . . . . . . . . . . . . . . . . . . . . . . . . . . . . . . 7
Table 3 Teachers responding to the surveys, year 3 . . . . . . . . . . . . . . . . . . . . . . . . . . . . . . . . 13
Table 4 Time from the reading/language arts block devoted to various reading-relatedinstructional activities by elementary teachers, year 3 . . . . . . . . . . . . . . . . . . . . . . . 16
Table 5 Time devoted each week to various reading-related instructional activities bysecondary teachers, year 3 . . . . . . . . . . . . . . . . . . . . . . . . . . . . . . . . . . . . . . . . . . . . . 17
Table 6 Frequency that various reading-related instructional strategies are used byelementary teachers, year 3 . . . . . . . . . . . . . . . . . . . . . . . . . . . . . . . . . . . . . . . . . . . . 18
Table 7 Frequency that various reading-related instructional strategies are used by secondaryteachers, year 3 . . . . . . . . . . . . . . . . . . . . . . . . . . . . . . . . . . . . . . . . . . . . . . . . . . . . . 18
Table 8 Elementary teachers’ ranking of instructional strategies on their effectiveness inimproving students’ reading proficiency, year 3 . . . . . . . . . . . . . . . . . . . . . . . . . . . . 19
Table 9 Secondary teachers’ ranking of instructional strategies on their effectiveness inimproving students’ reading proficiency, year 3 . . . . . . . . . . . . . . . . . . . . . . . . . . . . 19
Table 10 Percentage of students reading a minimum of 5 books during the second 9-weekgrading period, year 3 . . . . . . . . . . . . . . . . . . . . . . . . . . . . . . . . . . . . . . . . . . . . . . . . 20
Table 11 Percentage of students taking the Scholastic Reading Inventory (SRI), years 1, 2 and3 . . . . . . . . . . . . . . . . . . . . . . . . . . . . . . . . . . . . . . . . . . . . . . . . . . . . . . . . . . . . . . . . . 21
Table 12 Student Performance Plan Conferences conducted for students scoring below and ator above the standard on the Scholastic Reading Inventory (SRI) administered inSeptember, years 1, 2 and 3 . . . . . . . . . . . . . . . . . . . . . . . . . . . . . . . . . . . . . . . . . . . . 24
Table 13 Summer school enrollment and retention for students in grades 1 through 8 scoringbelow and at or above the standard on the Scholastic Reading Inventory (SRI)administered in May, years 1, 2 and 3 . . . . . . . . . . . . . . . . . . . . . . . . . . . . . . . . . . . 26

Third Interim Report: 2000-01 School Year
viii Evaluation of the Comprehensive Reading Plan
Table 14 Summer school enrollment and retention for students in grades 9 through 11 scoringbelow and at or above the standard on the Scholastic Reading Inventory (SRI)administered in May, years 1, 2 and 3 . . . . . . . . . . . . . . . . . . . . . . . . . . . . . . . . . . . . 27

Evaluation of the Comprehensive Reading Plan ix
Table 15 Percentage of elementary students scoring below the standard on the ScholasticReading Inventory (SRI) by the school’s level of need, years 1, 2 and 3 . . . . . . . . . . 29
Table 16 Student performance on the SAT Reading Comprehension subtest at 20 selectedschools by reading program, year 3 . . . . . . . . . . . . . . . . . . . . . . . . . . . . . . . . . . . . . 33
Table 17 Availability of SAT test scores for cohort students scoring below the standard on theSeptember, 1998 Scholastic Reading Inventory (SRI), years 1, 2 and 3 . . . . . . . . . . 34
Table 18 Percentile scores on the SAT Reading Comprehension subtest of cohort studentsscoring below the standard on the September, 1998 Scholastic Reading Inventory(SRI) by participation in Student Performance Plan Conferences and retention ingrade, years 1, 2 and 3 . . . . . . . . . . . . . . . . . . . . . . . . . . . . . . . . . . . . . . . . . . . . . . . . 36
Table 19 Percentile scores on the year 2 and year 3 SAT Reading Comprehension subtest ofcohort students scoring below the standard on the September, 1998 ScholasticReading Inventory (SRI) by summer school completion in years 1 and 2 . . . . . . . . . 37
Table 20 Percentage of cohort 2 and 3 students scoring above the 25th percentile on the SATReading Comprehension subtest despite scoring below the standard on theSeptember, 1998 Scholastic Reading Inventory (SRI) by reading program and school’slevel of need, years 1, 2 and 3 . . . . . . . . . . . . . . . . . . . . . . . . . . . . . . . . . . . . . . . . . . 40

Third Interim Report: 2000-01 School Year
10 Evaluation of the Comprehensive Reading Plan

Evaluation of the Comprehensive Reading Plan xi
List of figures
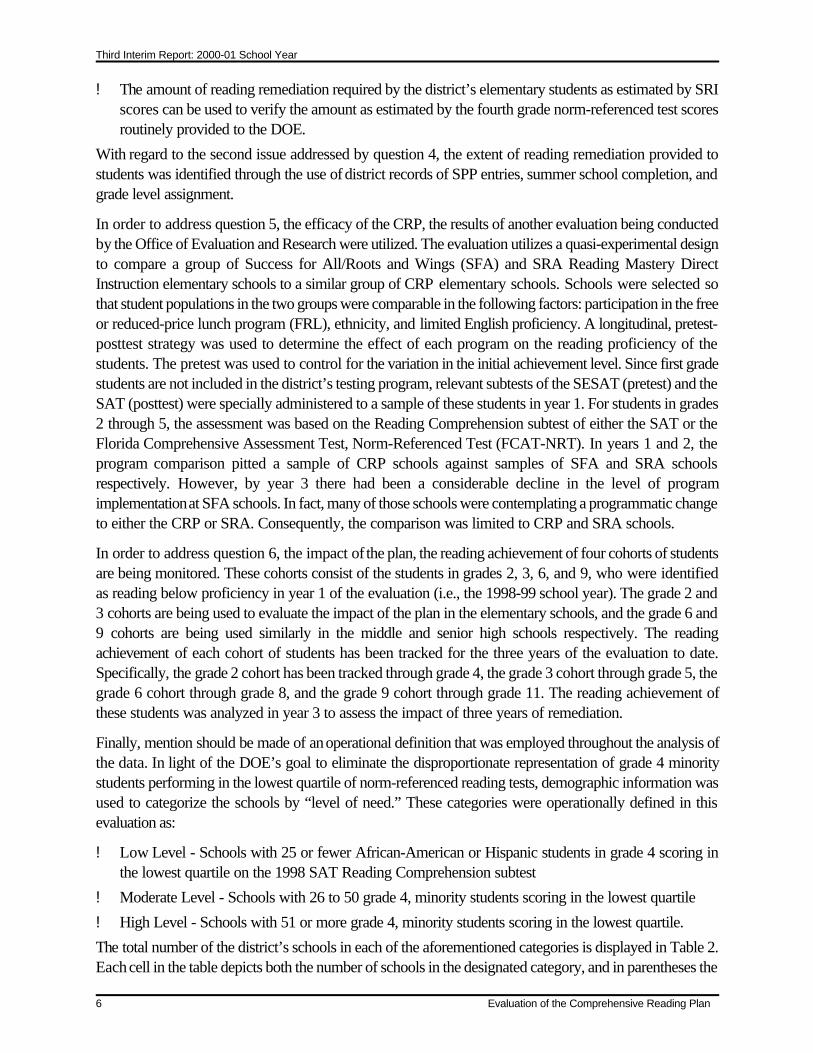
Figure 1 Teachers earning master plan points from Comprehensive Reading Plan workshops bythe end of years 1, 2 and 3 . . . . . . . . . . . . . . . . . . . . . . . . . . . . . . . . . . . . . . . . . . . . . 10
Figure 2 Teachers earning master plan points from Comprehensive Reading Plan workshopsby the end of year 3: Success for All/Roots and Wings (SFA) and SRA ReadingMastery Direct Instruction (SRA) elementary schools vs. Comprehensive ReadingPlan (CRP) elementary schools . . . . . . . . . . . . . . . . . . . . . . . . . . . . . . . . . . . . . . . . . 11
Figure 3 Teachers earning master plan points from Comprehensive Reading Plan workshopsby the end of year 3: Elementary schools implementing the plan by level of need (seeTable 2) . . . . . . . . . . . . . . . . . . . . . . . . . . . . . . . . . . . . . . . . . . . . . . . . . . . . . . . . . . . 12
Figure 4 Distribution of elementary classroom teacher respondents by grade level and subjectarea, year 3 . . . . . . . . . . . . . . . . . . . . . . . . . . . . . . . . . . . . . . . . . . . . . . . . . . . . . . . . 14
Figure 5 Distribution of secondary classroom teacher respondents by grade level and subjectarea, year 3 . . . . . . . . . . . . . . . . . . . . . . . . . . . . . . . . . . . . . . . . . . . . . . . . . . . . . . . . 14
Figure 6 Percentage of teachers who reported having attended reading and writing workshopsfrom 1992 through early 2001 . . . . . . . . . . . . . . . . . . . . . . . . . . . . . . . . . . . . . . . . . . 15
Figure 7 Students’ performance relative to the established standards on the Septemberadministration of the Scholastic Reading Inventory (SRI), year 3 . . . . . . . . . . . . . . . 22
Figure 8 Students’ performance relative to the established standards on the Mayadministration of the Scholastic Reading Inventory (SRI), year 3 . . . . . . . . . . . . . . . 23
Figure 9 Percentage of students by race/ethnicity scoring below the standard on the ScholasticReading Inventory (SRI) administered in September who had Student PerformancePlan Conferences, years 1, 2 and 3 . . . . . . . . . . . . . . . . . . . . . . . . . . . . . . . . . . . . . . 28
Figure 10 Percentage of students by race/ethnicity scoring below the standard on the ScholasticReading Inventory (SRI) administered in May who completed summer school, years 1,2 and 3 . . . . . . . . . . . . . . . . . . . . . . . . . . . . . . . . . . . . . . . . . . . . . . . . . . . . . . . . . . . . 29
Figure 11 Student Performance Plan Conferences conducted for elementary students scoringbelow the standard on the Scholastic Reading Inventory (SRI) administered inSeptember by the school’s level of need, years 1, 2 and 3 . . . . . . . . . . . . . . . . . . . . . 30
Figure 12 Summer school enrollment for elementary students scoring below the standard on theScholastic Reading Inventory (SRI) administered in May by the school’s level of need,years 1, 2 and 3 . . . . . . . . . . . . . . . . . . . . . . . . . . . . . . . . . . . . . . . . . . . . . . . . . . . . . 31
Figure 13 Summer school enrollment for elementary students scoring at or above the standardon the Scholastic Reading Inventory (SRI) administered in May by the school’s levelof need, years 1, 2 and 3 . . . . . . . . . . . . . . . . . . . . . . . . . . . . . . . . . . . . . . . . . . . . . . 31

Third Interim Report: 2000-01 School Year
xii Evaluation of the Comprehensive Reading Plan
Figure 14 Percentile scores on the SAT Reading Comprehension subtest of cohort studentsscoring below the standard on the September, 1998 Scholastic Reading Inventory(SRI), years 1, 2 and 3 . . . . . . . . . . . . . . . . . . . . . . . . . . . . . . . . . . . . . . . . . . . . . . . . 35
Figure 15 Percentage of cohort 2 students scoring above the 25th percentile on the SAT ReadingComprehension subtest despite scoring below the standard on the September, 1998Scholastic Reading Inventory (SRI) by the school’s level of need, years 1, 2 and 3 . 38
Figure 16 Percentage of cohort 3 students scoring above the 25th percentile on the SAT ReadingComprehension subtest despite scoring below the standard on the September, 1998Scholastic Reading Inventory (SRI) by the school’s level of need, years 1, 2 and 3 . 39

Evaluation of the Comprehensive Reading Plan xiii
Executive summary
The primary goal of the Comprehensive Reading Plan (CRP) is for every student to read at grade levelbefore entering grade 3. The key features of the plan encompass developmental, accelerated, andpreventive strategies that are consistent with both advances in reading research and the thrust of thedistrict’s reading program in recent years. The plan, furthermore, is intended to comply with the state’sdirectives under the provisions of the Florida Educational Equity Act. Following the implementation of theCRP in January, 1998, the Bureau of Elementary, Secondary, and Workforce Development Educationrequested that an evaluation of the plan be conducted by the Office of Evaluation and Research. Theevaluation subsequently undertaken is longitudinal in nature. The data collection to date has spanned threeschool years: 1998-99 (year 1), 1999-00 (year 2), and 2000-01 (year 3).
The evaluation of the CRP yielded data on both the implementation and impact of the plan. Regarding itsimplementation, the analysis of the data revealed that considerable progress had been made by theconclusion of year 3 in providing training for the teachers. Approximately 86% of the district’s school-based staff had earned master plan points for attending workshops associated with the plan. Additionally,the analysis identified comparatively more trained teachers in schools with more students in need ofremediation. This is a reversal of the situation in year 1, and it reflects favorably on the efforts of theprogram staff. The training appears to be making an impact on the teachers’ classroom practices.Substantial numbers of teachers reported utilizing various instructional activities and strategies which areassociated with the plan. The results also revealed that in general appropriate students are being targetedfor remediation, but there is disturbing evidence that the quantity of remediation activities at elementaryschools with a high level of need is below expectations. Nevertheless, various remediation activities arebeing utilized; and these activities seem to have resulted in improvements in the students’ readingperformance. Additionally, controlled comparisons of the efficacy of the CRP have yielded encouragingresults. The CRP seems to attain results that are either comparable to or better than those of well-regarded,established reading programs. Based on these findings, the following recommendations are proposed:
1. All teachers who provide time in their classes for students to read independently should maintain orhave access to records documenting the students’ accomplishments. At the secondary level, wheresuch monitoring is not common, a systematic plan should be implemented to ensure accountability forthis activity.
2. All schools need to bolster their efforts to ensure that students who score below the standard areadequately served by Student Performance Plan Conferences and subsequent remediation activities.The latter is particularly important for elementary schools with a high level of need.
3. While there has been improvement each year, still less than half of the students in grades 1-8 who areidentified as reading below standard subsequently complete summer school. The district shouldstrengthen its efforts to enforce the mandated completion of summer school by these students, ordevelop alternative means for ensuring that they get additional support beyond the regular school year.

Evaluation of the Comprehensive Reading Plan 1
Introduction
The Florida Department of Education (DOE) “designated reading at the fourth grade level as the 1997-98area of concentration under the requirements of the Florida Educational Equity Act.” Specifically, thestate’s school districts are required to “develop and implement methods and strategies to eliminate anydisproportionate representation” of African-American and Hispanic students in the lowest quartile ofreading performance at the fourth grade level (Commissioner’s Memorandum, December 19, 1997).Additionally, school districts must submit to the state reports that address the success of their methods andstrategies.
Prior to receiving this directive from the DOE, the Miami-Dade County Public Schools (MDCPS) hadundertaken the development of the Comprehensive Reading Plan (CRP). This plan, which has similarobjectives to the DOE directive, was approved by the School Board at its January 14, 1998 meeting.Implementation began immediately. At the same time, the Bureau of Elementary and Secondary Educationof the MDCPS requested that the Office of Evaluation and Research conduct an evaluation of the plan’simpact.
The following report has been prepared to comply with this request. The report addresses year 3 of theplan’s implementation, the 2000-01 school year. It begins with a brief description of the CRP and thedesign for evaluating the program elements. The majority of the report, however, is devoted to reviewingdata on the teacher training and student achievement during year 3.
Review of the literature
Guidelines for improving reading instruction can be readily drawn from the literature in the field. Forexample, it has been demonstrated that if children do not read at grade level by the end of the primarygrades, their reading achievement will continue to deteriorate in subsequent years (Chall, Jacobs &Baldwin, 1990; Parker, 1995; Pearson, 1992). Thus, the research generally advocates that every studentbe able to read independently and well by the end of third grade (Wasik, 1998). Early intervention inaddressing a student’s reading problems is the general principle behind such popular programs as ReadingRecovery (Clay, 1993; Shannahan & Barr, 1995) and Success For All (Slavin, Madden, Karweit, Dolan& Wasik, 1992; Slavin, Madden, Dolan, Wasik, Ross, Smith & Dianda, 1996). Although the pedagogicalmethods for achieving such an end are varied, some methods are clearly endorsed by the research. Thefollowing are some examples:
! A rich oral language is a prerequisite for success in learning to read (Snow, Burns & Griffin, 1998;Whitehurst & Lonigan, 1998). This “oral language base” includes experiences with books, knowledgeof the alphabet, recognition of common symbols (e.g., stop signs), and phonemic awareness.
! The results of assessments should be used in modifying the instructional content to ensure that thestudents’ individual needs are being met (National Reading Panel, 2000). These assessments “mustreflect advances in the understanding of the reading process” (West, 1998).
! Instructional approaches for developing successful readers include: (a) working with words throughphonics and vocabulary activities, which is important in developing the prerequisites for comprehensionand reading fluency (National Reading Panel, 2000); (b) reading aloud, which enables students to buildtheir fluency skills through modeling and direct practice (Radencich, McKay & Paratore, 1995);

Third Interim Report: 2000-01 School Year
2 Evaluation of the Comprehensive Reading Plan
(c) teacher-directed interactive reading activities, or reciprocal teaching, which features “guidedpractice in applying simple, concrete strategies to the task of text comprehension” (Rosenshine &Meister, 1994, p. 479). These approaches are designed to enhance such characteristics of skilledreading as drawing on prior experiences, reading words rapidly and accurately, monitoring one’s owncomprehension, enjoying reading, and frequent practice (Anderson, Hiebert, Scott & Wilkinson,1985).
! Flexible groups allow teachers to implement the aforementioned approaches to meet the individualliteracy needs of students. Depending on the purpose, the instructional configuration for the readinglesson may consist of the whole class, a teacher-facilitated needs-based group, a cooperative learninggroup, or the individual student (Snow, et al., 1998).
! Independent reading should be promoted through such tactics as providing reading materials that arebelow the students’ frustration level (Snow, et al., 1998). Studies to date, however, have not examinedthe impact of specific programs that encourage students to read independently at their fluency level(National Reading Panel, 2000).
! The success of a reading tutorial program staffed by volunteers depends upon certain key components.They include: (a) the supervision of tutors by a reading specialist; (b) ongoing training and feedback fortutors; (c) structured tutoring sessions; and (d) the inclusion of such key elements as rereading a familiarstory or text, word analysis, writing, and introduction of new stories. Such a program should not,however, be expected to solve the reading problems of students with severe reading difficulties, whogenerally need assistance from a reading specialist (Snow, et al., 1998; Wasik, 1998).
! “Nurturing effective parental involvement in young children’s early reading experiences surfaces as aviable alternative for both struggling readers and their more able counterparts” (Fitton & Gredler, 1996,p. 331). Parental involvement in a reading program should encompass the following key elements:support for what parents are already doing to promote learning, the rationale for suggested literacypractices and activities, modeling of good literacy practices, and opportunities to voice questions andconcerns (Danielson, 1997).
! The most successful reading instruction for limited English proficient (LEP) students includes suchelements as: direct instruction in combination with literature-based activities, word identificationactivities to build sight vocabulary, multicultural literature, and the use of predictable texts. Researchon literacy instruction for LEP students seems to indicate that these students will learn to read betterif the initial reading instruction is in their native language. It is not clear whether LEP students need tospeak English fluently before they can read it (Nichols, Rupley & Weaver, 1996; Snow, et al., 1998).
Description of the program
The primary goal of the CRP is for every student to read at grade level before entering grade 3. This goalboth anticipates and is consistent with research findings regarding the importance of identifying and treatinga student’s reading problem before it becomes virtually insurmountable in the later years of schooling. Thekey features of the plan encompass developmental, accelerated, and preventive strategies that areconsistent with both the advances in reading research outlined above and the thrust of the district’s readingprogram in recent years. A secondary goal of the plan is to improve the reading performance of studentscurrently in grades 3 through 12 who are not yet reading at grade level. The following are five key featuresof the plan:

Third Interim Report: 2000-01 School Year
Evaluation of the Comprehensive Reading Plan 3
1. The plan augments current staff development for teachers of grades K through 2. The intent is toenhance the teachers’ abilities to deliver early reading instruction, to diagnose reading difficulties earlyin a child’s school career, and to intervene effectively so that the child may overcome them by the thirdgrade.
2. The plan augments current staff development for teachers of grades 3 through 12. The intent is toenhance their abilities to organize higher level and subject area reading instruction, to diagnose readingdifficulties that persist or develop in the latter part of a child’s school career, and to intervene effectivelyso that these difficulties may be overcome. This staff development (as well as that cited in the previousitem) is provided by district staff, reading specialists at the region level, and feeder pattern readingspecialists. The specialists also provide instructional support. In addition, money is provided to pay forsubstitutes, so that teachers may attend the workshops. Finally, collaboration with two local universities,Florida International University and the University of Miami, has resulted in opportunities for selectedMDCPS teachers to obtain master or specialist degrees in reading.
3. The plan calls for a formal assessment of the students’ reading proficiency in the fall and the spring. Theassessment targets grades 2 through 11 in the fall, and grades 1 through 11 in the spring. Theassessment of grade 1 students is delayed until they have completed one year of schooling. The firstassessment was conducted in the spring of the 1997-98 school year. The assessment is based on thestudents’ performance on the Scholastic Reading Inventory (SRI). The SRI is a key tool for identifyingthe students who are performing below proficiency in reading. It provides the teachers with initialinformation regarding the reading needs of their students. In addition, the teachers conduct diagnosesof reading difficulties by applying the skills they have acquired in the workshops. These diagnoses areparticularly important for assessing the needs of students performing below proficiency on the SRI andof students who have yet to be tested. Benchmark books are provided so that the teachers can gaugethe students’ reading levels at various times throughout the school year.
4. The teaching methods which are introduced in the workshops are facilitated by the provision ofresources and the revision of requirements. For example, a two-hour reading/language arts block ismandated for elementary schools by the CRP. This requirement makes it easier for the teachers toutilize a variety of instructional methods. In addition, a program of independent reading has beenimplemented. It requires students in grades 1 through 12 to read five books during each nine-weekgrading period. This requirement is supported daily by the mandated 30-minute independent readingperiod in school and the 30-minute independent reading homework assignment.
5. A Student Performance Plan Conference is mandated for students who are identified as reading belowproficiency. At this conference, a plan is developed that may include such activities as: (a) an intensivereading summer school program; (b) additional instructional time during the regular school year throughone-to-one tutoring; (c) extended day or Saturday instruction; (d) home instruction; and (e) instructionfor LEP students while they are learning English. The methods prescribed in the plan are to be recordedin the student’s permanent record of the district’s Student Information System.
With the exception of Feature 4 above, which deals with the provision of resources and the revision ofrequirements, all the features of the CRP encompass strategies for addressing the DOE directive. Thespecific features and the relevant strategies are the following:
! Features 1 and 2. Classroom teachers receive ongoing staff development in effective reading strategiesto assist them in improving the students’ reading performance.

Third Interim Report: 2000-01 School Year
4 Evaluation of the Comprehensive Reading Plan
! Feature 3. Following the administration of the SRI in the fall and the spring, the students’ performanceon the inventory, together with their performance on the Reading Comprehension subtest of theStanford Achievement Test (SAT) and the MDCPS Writing Prompt, are used to identify the studentswho are below proficiency. The teachers’ judgments are also a factor in this determination.
! Feature 5. Students who are below proficiency in reading are further diagnosed to identify the specificareas in need of intervention/remediation. For these students, a Student Performance Plan Conferenceis conducted and a Student Performance Plan (SPP) completed. The plan may incorporate one ormore of the following activities in its remediation strategy:
Home instruction based on strategies developed jointly by the teacher and parents/guardian duringthe Student Performance Plan Conference
Additional instructional time (e.g., extended day services, Saturday program)
Enrollment in an intensive reading summer school program
Placement in an intensive care reading program, which involves the suspension of curriculum areasother than reading and mathematics
Referral to the Limited English Proficient (LEP) Committee
Referral to the Child Study Team.
Design of the evaluation
The evaluation of the CRP examines both the implementation of the program and its impact on the students’reading proficiency. The following series of questions was designed to address both the interests of thedistrict and the DOE. These questions delineate the specific focus of the evaluation.
1. To what extent do teachers complete the training on the methodology of teaching reading which isprovided by the various district and university sources? To what extent is the training completed byteachers at elementary schools that serve high proportions of low-achieving minority students?
2. How appropriate is the training? To what extent do the teachers utilize their training in the classrooms?
3. To what extent do students read independently?
4. What is the distribution of minority and non-minority students who are not reading at grade levelproficiency? Are minority and non-minority students assigned proportionately to each of the remedialactivities?
5. How does the CRP compare to other programs in preparing students to read at grade level by grade2?
6. Does the instruction received through remedial activities result in an improvement in the readingachievement of students in grades 3 through 12?
In order to address these questions, data were obtained from the following sources: (a) records of teachertraining; (b) a survey of the teachers; (c) Stanford Early School Achievement Test (SESAT) scores; (d)Reading Comprehension scores on the Stanford Achievement Test, Eighth and Ninth Editions (SAT); (e)Scholastic Reading Inventory (SRI) scores; (f) records of the remedial activities assigned to the students;

Third Interim Report: 2000-01 School Year
Evaluation of the Comprehensive Reading Plan 5
and (g) demographic data on the students (e.g., gender, ethnicity). A conceptual summary of the sourcesof data and the specific evaluation questions they address is displayed on a matrix in Table 1.
Table 1
Sources of data for the evaluation questionsSources of data
Evaluation questions
Teachertrainingrecords
Teachersurvey
SESATscores
District archival data
SATscores
SRIscores
SPPentries Demographics
1. Teacher training X
2. Implementation of the plan X
3. Independent reading X
4. Provision of remediation X X X X
5. Comparative efficacy of theplan X X X
6. Impact of the plan X X X XNote. See page 4 for the full text of the evaluation questions. SESAT = Stanford Early School Achievement Test; SAT = StanfordAchievement Test; SRI = Scholastic Reading Inventory; SPP = Student Performance Plan.
Questions 1 and 2 address the implementation of two key features of the plan. Respectively, they deal withthe training received by the teachers, and the application of the training in the classrooms. For question 1,the records of teacher training, including those from master or specialist degree programs, were analyzed.The intent was to ascertain the amount of training received by the teachers in general; and, specifically, bythe teachers from elementary schools where there is a disproportionate number of minority students whoare below proficiency.
In order to address question 2, a survey was forwarded to a 15% random sample of classroom teachersat regular school sites implementing the CRP. The total number of teachers surveyed was 1,969. Twoforms of the survey were used: Survey of Reading Practices in Elementary Schools, which targetselementary teachers (grades K through 5 or 6), and Survey of Reading Practices in Secondary Schools,which targets secondary teachers (grades 6 or 7 through 12). Both forms focus on the strategies introducedin the training and on the extent to which they are being applied in the classroom.
Question 3, which deals with the students’ independent reading, was addressed by two items in the survey.Teachers were asked to report the proportion of their students who had fulfilled the requirement to readfive books during the prior grading period. They were also asked to identify the source of their data,whether it was classroom documentation or some less formal method.
Question 4 deals with two issues. The first is the distribution of students who were not reading at grade levelproficiency during the 2000-01 school year. The second is the extent to which these students were assignedto remediation through such methods as additional instructional time and summer school. The studentsreading below proficiency in grades 2 through 11 were identified through the use of the SRI. Although otherfactors were also taken into consideration when making this determination (e.g., teacher judgment, SATscores), only the SRI scores are used in this report for two reasons:
! Of the available measures of the students’ reading proficiency, the SRI is the single, most content-specific indicator.
Third Interim Report: 2000-01 School Year
6 Evaluation of the Comprehensive Reading Plan
! The amount of reading remediation required by the district’s elementary students as estimated by SRIscores can be used to verify the amount as estimated by the fourth grade norm-referenced test scoresroutinely provided to the DOE.
With regard to the second issue addressed by question 4, the extent of reading remediation provided tostudents was identified through the use of district records of SPP entries, summer school completion, andgrade level assignment.
In order to address question 5, the efficacy of the CRP, the results of another evaluation being conductedby the Office of Evaluation and Research were utilized. The evaluation utilizes a quasi-experimental designto compare a group of Success for All/Roots and Wings (SFA) and SRA Reading Mastery DirectInstruction elementary schools to a similar group of CRP elementary schools. Schools were selected sothat student populations in the two groups were comparable in the following factors: participation in the freeor reduced-price lunch program (FRL), ethnicity, and limited English proficiency. A longitudinal, pretest-posttest strategy was used to determine the effect of each program on the reading proficiency of thestudents. The pretest was used to control for the variation in the initial achievement level. Since first gradestudents are not included in the district’s testing program, relevant subtests of the SESAT (pretest) and theSAT (posttest) were specially administered to a sample of these students in year 1. For students in grades2 through 5, the assessment was based on the Reading Comprehension subtest of either the SAT or theFlorida Comprehensive Assessment Test, Norm-Referenced Test (FCAT-NRT). In years 1 and 2, theprogram comparison pitted a sample of CRP schools against samples of SFA and SRA schoolsrespectively. However, by year 3 there had been a considerable decline in the level of programimplementation at SFA schools. In fact, many of those schools were contemplating a programmatic changeto either the CRP or SRA. Consequently, the comparison was limited to CRP and SRA schools.
In order to address question 6, the impact of the plan, the reading achievement of four cohorts of studentsare being monitored. These cohorts consist of the students in grades 2, 3, 6, and 9, who were identifiedas reading below proficiency in year 1 of the evaluation (i.e., the 1998-99 school year). The grade 2 and3 cohorts are being used to evaluate the impact of the plan in the elementary schools, and the grade 6 and9 cohorts are being used similarly in the middle and senior high schools respectively. The readingachievement of each cohort of students has been tracked for the three years of the evaluation to date.Specifically, the grade 2 cohort has been tracked through grade 4, the grade 3 cohort through grade 5, thegrade 6 cohort through grade 8, and the grade 9 cohort through grade 11. The reading achievement ofthese students was analyzed in year 3 to assess the impact of three years of remediation.
Finally, mention should be made of an operational definition that was employed throughout the analysis ofthe data. In light of the DOE’s goal to eliminate the disproportionate representation of grade 4 minoritystudents performing in the lowest quartile of norm-referenced reading tests, demographic information wasused to categorize the schools by “level of need.” These categories were operationally defined in thisevaluation as:
! Low Level - Schools with 25 or fewer African-American or Hispanic students in grade 4 scoring inthe lowest quartile on the 1998 SAT Reading Comprehension subtest
! Moderate Level - Schools with 26 to 50 grade 4, minority students scoring in the lowest quartile
! High Level - Schools with 51 or more grade 4, minority students scoring in the lowest quartile.
The total number of the district’s schools in each of the aforementioned categories is displayed in Table 2.Each cell in the table depicts both the number of schools in the designated category, and in parentheses the

Third Interim Report: 2000-01 School Year
Evaluation of the Comprehensive Reading Plan 7
total number of African-American and Hispanic fourth graders scoring in the lowest quartile. In thesubsequent sections of the report, the level of need categories will be used in the examination of such issuesas teacher training and summer school attendance.
Table 2
Elementary schools by level of need categories
Level of need
Reading program
Low Moderate High Total
Schools (Students) Schools (Students) Schools (Students) Schools (Students)
ComprehensiveReading Plan 71 (965) 38 (1,373) 40 (2,697) 149 (5,035)
Success for All/Rootsand Wings 0 (0) 17 (697) 21 (1,249) 38 (1,946)
SRA Reading MasteryDirect Instruction 2 (43) 8 (294) 2 (134) 12 (471)
Total 73 (1,008) 63 (2,364) 63 (4,080) 199 (7,452)Note. The table is based on the number of African-American and Hispanic fourth graders scoring in the lowest quartile of the ReadingComprehension subtest of the 1998 Stanford Achievement Test.

Third Interim Report: 2000-01 School Year
8 Evaluation of the Comprehensive Reading Plan

Evaluation of the Comprehensive Reading Plan 9
Results of the evaluation
The evaluation of the Comprehensive Reading Plan (CRP) is a longitudinal study. The data collection todate has spanned three school years: 1998-99 (year 1), 1999-00 (year 2), and 2000-01 (year 3). Thisreport contains cumulative data through the conclusion of year 3. The data are used to address the issuesraised in the evaluation questions listed in the Design of the Evaluation section. These issues include: (a) theteacher training, (b) the implementation of the plan, (c) the students’ independent reading, (d) the provisionof remediation, (e) the comparative efficacy of the plan, and (f) the impact of the plan. Each issue will beindividually examined.
Teacher training
In January 1998, the Miami-Dade Country Public Schools (MDCPS) initiated training sessions designedto prepare teachers to implement the CRP. These sessions have continued throughout each subsequentschool year and summer session. The training includes both workshops offered by the district, and speciallypackaged advanced degree programs offered by Florida International University and the University ofMiami. The workshops fall into three basic categories, which are listed below. Accompanying eachcategory is a description of the general course content, which was obtained from program documents(Miami-Dade/Monroe Teacher Education Center, 1998).
! Best Teaching Practices for K-2/3-5. A major collaboration between the Teacher EducationCenter and the Division of Language Arts/Reading, this course provides specific strategiesfor implementing the Comprehensive Reading Plan. Emphasis will be on using benchmarksto guide instruction and assessing progress with benchmark books. Participants will learntechniques for:
! teaching direct-interactive reading and word study
! making grade-level text accessible to less proficient students
! conducting guided reading with instructional level text.
Practice and specific classroom applications will be provided for each strategy taught.
! Best Practices in Teaching Reading Across the Curriculum for All Secondary Teachers.A major collaboration between the Teacher Education Center and the Division of LanguageArts/Reading, this course provides specific strategies for augmenting the readingcomprehension of students in support of the Comprehensive Reading Plan. Emphasis willbe on skills for teaching students to read and comprehend a variety of texts. Participants willlearn techniques for teaching content to students and helping students to guide themselvesthrough content-specific text. Practice and specific classroom applications will be providedfor each strategy taught.
! CRISS (CReating Independence through Student-owned Strategies): An Across-the-Curriculum Course for Grades 3-12. Project CRISS, a National Diffusion Network project,is designed to develop thoughtful and independent readers and learners. Participants willreceive a training manual which provides a number of strategies to help students understanddifficult text across the content and grades. CRISS is a component of the Miami-Dade CountyPublic School's Comprehensive Reading Plan and is being offered to teachers of grades 3-12.
The specific workshops which comprise these three basic categories are catalogued in Appendix A. The“best practices” workshops ( i.e., the first and second categories) range from one to five days in length.Teachers who complete one of them may receive up to 60 master plan points for their participation,depending on the length of the workshop. The CRISS category consists of a single three-day seminar,
Third Interim Report: 2000-01 School Year
10 Evaluation of the Comprehensive Reading Plan
which earns the participants 24 points. In addition to receiving master plan points, three hundred teachers,who are randomly selected from all who apply, receive a daily stipend of $100 for participating in one ofthe workshops offered during the summer.
The evaluation of the CRP included an examination of the district’s personnel databases to determine thenumber of teachers who received master plan points for completing reading instruction workshops duringthe period ranging from January, 1998 through August, 2001. The intent was to estimate the proportionof trained teachers in the schools. The personnel data provide a viable estimate of the extent to which thetraining goals of the CRP have been accomplished to date. Since January, 1998, a total of 19,452 staffmembers employed in the fall of 2001 had attended one or more workshops for which master plan pointswere awarded. Of these, 89% (n=17,239) were assigned to a regular school site. The rest were assignedprimarily to alternative, special, charter, or adult school sites (n=1,083). Some were assigned to region ordistrict offices (n=633). And, a few (n=497) could not be identified with a particular school site, becausethey were day-to-day substitutes.
The individuals who were identified with a particular school site comprised about 86% of the district’sinstructional staff. This is a substantial increase over the 42% that was identified in year 1. This groupadmittedly includes some media specialists, counselors, exceptional education teachers, principals, andassistant principals. However, the overwhelming majority consists of classroom teachers. For this reason,the individuals in this group will be referred to as “teachers” in this report. The proportional distribution ofthe group among elementary, middle, and senior high schools in years 1 through 3 is portrayed in Figure 1.As can be seen from examining the year 3 data in this figure, at least 85% of the teachers at each levelearned some master plan points. And, over 60% of the teachers at each school level received intensivetraining (i.e., 13 or more master plan points). Furthermore, between 40 and 50% of the teachers at eachlevel have earned from 25 to 413 master plan points, which represents considerable exposure to readingmethodology.

Third Interim Report: 2000-01 School Year
Evaluation of the Comprehensive Reading Plan 11
Elementary Middle Sr. HighY1 Y2 Y3 Y1 Y2 Y3 Y1 Y2 Y3
0
1 0
2 0
3 0
4 0
5 0
6 0
7 0
8 0
9 0
100
Master plan points
1 to 6
7 to 12
13 to 24
25 to 413
Figure 1. Teachers earning master plan points fromComprehensive Reading Plan workshops by the end ofyears 1, 2, and 3
It should be noted that not all the district’s schools are implementing the CRP. During year 3, 50 elementaryschools were implementing either the Success for All/Roots and Wings (SFA) or the SRA Reading MasteryDirect Instruction (SRA). These programs require specialized training. Therefore, teachers at participatingschools have been encouraged to attend training for their program rather than the training for the CRP. But,despite this recommendation, the data in Figure 2 reveals that about 94% of these teachers earned masterplan points from CRP workshops. Surprisingly, this percentage is greater than that of teachers in CRPschools (84%). This may be due to the fact that SFA is being phased out of many schools. Therefore, itis likely that the staff of these schools are participating in the CRP training in preparation for the transition.In the case of SRA, the training for this program utilizes one of the general reading component numbersused by the CRP. This precludes the partitioning of master plan points associated with the SRA from thoseassociated with the CRP.

Third Interim Report: 2000-01 School Year
12 Evaluation of the Comprehensive Reading Plan
Elementary schoolsCRP SFA/SRA
0
10
20
30
40
50
60
70
80
90
100
Master plan points
1 to 6
7 to 12
13 to 2425 to 413
Figure 2. Teachers earning master plan points fromComprehensive Reading Plan (CRP) workshops by theend of year 3: Success for All/Roots and Wings (SFA)and SRA Reading Mastery Direct Instruction (SRA)elementary schools vs. Comprehensive Reading Plan(CRP) elementary schools
In light of the DOE’s goal to eliminate the disproportionate representation of grade 4 minority studentsperforming in the lowest quartile of norm-referenced reading tests, a third analysis of the training data wasundertaken. Figure 3 portrays the proportions of trained teachers at CRP elementary schools across thelevel of need categories (see Table 2). About 78% of the teachers at schools with a low level of need and90% at schools with a high level have received training. This compares with 41% and 38% respectivelyin year 1. At that time, the latter percentage was a source of concern, because the number of minority
students in need of remediation at schools categorized as high level is more than four times the number atschools categorized as low level. However, the subsequent increase in the percentage of trained teachersin the high level of need schools has been impressive. It clearly reflects an effort by CRP administrators tofocus the training where the need is greatest. Lists of the specific schools that fall in each level of needcategory by reading program, along with the proportion of trained staff, appear in Appendix B.

Third Interim Report: 2000-01 School Year
Evaluation of the Comprehensive Reading Plan 13
Elementary schools by level of needLow Moderate High
0
10
20
30
40
50
60
70
80
90
100
Master plan points
1 to 67 to 12
13 to 2425 to 413
Figure 3. Teachers earning master plan points fromComprehensive Reading Plan workshops by the end ofyear 3: Elementary schools implementing the plan by levelof need (see Table 2)
In addition to the workshops, collaboration between the district and both Florida International Universityand the University of Miami has resulted in opportunities for a number of teachers to pursue master orspecialist degrees in reading. Project READS (Reading to Energize and Accelerate DevelopmentalStrategies) was initiated during the 1997-98 school year in collaboration with Florida International
University. This program was specially designed to meet the needs of teachers implementing the CRP. Fourcohorts of teachers have enrolled in the program: 40 beginning during 1997-98, 67 during 1998-99, 23during 1999-00, and 25 during 2000-01. The collaboration with the University of Miami involved itsReading/LD Masters Program. A committee comprised of faculty members and MDCPS representativesselected 30 candidates from applicants wishing to enroll in this program beginning in January 1999. Anadditional 12 candidates were selected during the 1999-00 school year. The program, which is approvedby the National Council for Accreditation of Teacher Education, is designed to help teachers meet thereading needs of both regular students and learning disabled students. Full or partial tuition reimbursementwas provided by the district for both of these university programs. Of the 197 teachers who enrolled in orcompleted one of these programs, 95% (n=188) were assigned to regular school sites. The rest wereassigned to alternative school sites (n=3), or district or region offices (n=6). The teachers who wereidentified with a particular school site comprised about 0.9% of the district’s instructional staff.
In summary, the data on teacher training revealed that 19,452 teachers earned master plan points forattending CRP workshops during the period between January, 1998 and August, 2001. Of these, 17,239were teachers assigned to regular school sites. This group comprised about 86% of the district’s school-based professional staff in year 3, which is more than double the 42% in year 1. At each school level (i.e.,elementary, middle and senior high school), at least 85% of the teachers earned some master plan points.And, over 60% of teachers at each level received intensive training (i.e., 13 or more master plan points).Among elementary schools implementing the CRP, 78% of the teachers at schools with a low level of needreceived training, and 90% at schools with a high level of need. This compares with 41% and 38%

Third Interim Report: 2000-01 School Year
14 Evaluation of the Comprehensive Reading Plan
respectively in year 1. Consequently, both percentages have increased dramatically, and the latterpercentage has overtaken the former. Finally, approximately 0.9% of the district’s teachers had beenenrolled in graduate university programs which were affiliated with the CRP.
Implementation of the plan
Data on the implementation of the CRP were derived from a set of teacher surveys. The set consisted ofthe Survey of Reading Practices in Elementary Schools, and the Survey of Reading Practices inSecondary Schools. Copies of these two surveys may be found in Appendix C. The surveys were sent toa 15% random sample of teachers, which consisted of 1,969 individuals. A total of 1,105 of these teachersor 56% responded. The sample numbers by school level and the corresponding respondents aresummarized in Table 3.
Table 3Teachers responding to the surveys, year 3School level Sample Respondents %Elementary 1,008 559 56Secondary 959 546 57Total 1,969 1,105 56
The distributions of the survey respondents across various grade levels and subject areas are portrayed inFigures 4 and 5. As can be seen in Figure 4, elementary teachers by grade level comprised from 8 to 16%of the respondents. ESOL teachers comprised 10% of the respondents, and pre-kindergarten teacherscomprised 1%. Teachers of individual subjects, such as the arts, Spanish, and bilingual education,comprised 14% of the respondents. Approximately 3% of the respondents were permanent substitutes whocould not be classified. Incidently, the 2% of respondents without classrooms consisted primarily of full-timereading leaders, who provided training and support to classroom teachers.
The distribution of secondary teachers is displayed in Figure 5. At 22%, language arts (which includesreading teachers) comprised the largest group of respondents among the major subject areas at thesecondary level. Respondents were fairly evenly divided among the other major subject areas: mathematics,science, and social studies. Comparably represented were vocational teachers (e.g., business education,home economics, industrial arts, agriculture, driver education, and health). Teachers of miscellaneoussubjects (e.g., arts, bilingual education, foreign language, and physical education) comprised 16% of therespondents. In addition, 2% of the respondents were permanent substitutes who could not be classified.

Third Interim Report: 2000-01 School Year
Evaluation of the Comprehensive Reading Plan 15
Figure 4. Distribution of elementary teacher respondents by grade level and subject area, year 3
Figure 5. Distribution of secondary teacher respondents by grade level and subject area, year 3

Third Interim Report: 2000-01 School Year
16 Evaluation of the Comprehensive Reading Plan
Course titleCRISS
Best PracticesReading Leader
Writing InstituteDistrict workshop
School workshop0
20
40
60
80
100
Elementary Secondary
Figure 6. Percentage of teachers who reported havingattended reading or writing workshops from 1992through early 2001
An important part of the implementation of the CRP was the training provided to the teachers. One surveyitem asked them to report their participation between 1992 and early 2001 in district-sponsoredworkshops on topics related to the CRP. Their responses are portrayed in Figure 6. The teachers reportedattending intensive courses, including CRISS, Best Practices, Reading Leader training (elementary levelonly), and the Writing Institute, as well as reading or writing workshops presented by either district orschool staff. As can be seen in the figure, a higher proportion of elementary teachers than secondaryreceived training. The three-day CRISS courses were the exception to this generalization, with 40% ofsecondary teachers attending and only 38% of elementary teachers. The CRISS courses also exhibited thegreatest increase in attendance over the year 1 when it was just over 20% for both school levels.
Further analysis of the survey responses revealed that elementary teachers with no classrooms, most of
whom were reading leaders, were most likely to have attended reading or writing workshops. The oneexception to this was the Writing Institute, which grade 4 teachers were most likely to have attended.Among the secondary teachers, language arts and ESOL teachers, as well as those with no classrooms,were most likely to have attended reading or writing workshops.
Time devoted to instructional activities
The instructional practices introduced by the CRP include various activities during the two-hourreading/language arts block in the elementary classes and during the content areas in the secondary classes.The teachers reported the time they routinely devote to these activities in the survey responses.Unfortunately, the responses from certain categories of teachers were not useful. For example, since thesurvey of elementary teachers focused solely on reading instruction and not on reading in the content areas,the individual subject teachers were not able to respond knowledgeably. Consequently, the responses fromindividual subject teachers, teachers whose class assignments were unknown, and teachers with noclassrooms were removed from the analysis. As a result, the analysis was based on only 456 surveys atthe elementary level and 528 at the secondary level. Tables 4 and 5 present the distribution of time devoted

Third Interim Report: 2000-01 School Year
Evaluation of the Comprehensive Reading Plan 17
to specific instructional activities at the elementary and secondary levels respectively. A review of Table 4reveals that at the elementary level, the amount of time generally devoted to these instructional activitiesduring the reading/language arts block was 20 minutes or less. The only exceptions were writing andinteractive reading instruction at grade level; between 21 and 40 minutes was generally devoted to eachof these activities. Therefore, survey results of year 3 generally concur with those of both year 1 and year2. Finally, it should be noted that the pooling of the responses from all the elementary teachers in Table 4tends to mask some trends. Most notably, although pre-kindergarten, kindergarten, grade 1, and ESOLteachers generally spend 20 minutes or less on independent reading, teachers of grades 2 through 6generally spend between 21 and 40 minutes on this activity.
Table 4
Time from the reading/language arts block devoted to various reading-relatedinstructional activities by elementary teachers, year 3
% of teachers a
Instructional activitybTime:c
None
20minutesor less
Between21 and 40minutes
Between41 and 60minutes
Morethan an
hour
Interactive reading instruction at grade level(whole class) 3 25 52 15 5
Guided reading at instructional level (groups) 6 52 33 7 2
Working with words (phonemic awareness,spelling, vocabulary) 2 57 34 6 1
Writing 2 28 50 18 3
Independent reading 4 47 45 3 2
Activating students’ prior knowledge 2 88 8 1 1
Debriefing about the effectiveness of areading/study technique 10 73 15 2 1
Reading poems, stories, etc. aloud to students 2 58 33 6 1aPercentages may not total 100 because they are rounded. The most common responses are shaded.bSee Appendix C for a full text of the activities.cThe time period spans the two-hour reading/language arts block.
A review of Table 5 reveals that at the secondary level, teachers generally devoted between 21 and 40minutes per week to each of the following activities: interactive reading instruction focused on coursecontent, structured reading in pairs or groups, and independent reading. In addition, they devoted between41 and 60 minutes to writing. The latter is an increase over years 1 and 2, when teachers generally devotedbetween 21 and 40 minutes to this activity. The teachers generally devoted 20 minutes or less to theremaining activities, which included: working with words, activating students’ prior knowledge, debriefingabout the effectiveness of a reading/study technique, reading aloud to students, and conducting individualstudent progress conferences. Once again, it should be noted that the pooling of the responses in the tabletends to mask some trends. For example, language arts, ESOL, science, and social studies teachersgenerally devoted between 21 and 40 minutes to working with words. This contrasts with the 20 minutesor less generally devoted by all the secondary teachers as a group. A second example can be drawn fromthe mathematics teachers. They generally devoted no time to interactive reading instruction focused oncourse content, structured reading in pairs or groups, activating students’ prior knowledge, reading aloud

Third Interim Report: 2000-01 School Year
18 Evaluation of the Comprehensive Reading Plan
to students, or conducting individual student progress conferences. This, needless to say, does not reflectthe general practice of the secondary teachers as a group.
Table 5
Time devoted each week to various reading-related instructional activities bysecondary teachers, year 3
% of teachers a
Instructional activitybTime:c
None
20minutesor less
Between21 and 40minutes
Between41 and 60minutes
Morethan an
hour
Interactive reading instruction focused oncourse content 11 20 31 19 20
Structured reading in pairs or groups 17 19 34 16 14
Working with words 10 30 29 18 13
Writing 7 15 25 28 25
Independent reading 11 14 45 12 19
Activating students’ prior knowledge 12 40 24 16 8
Debriefing about the effectiveness of areading/study technique 17 44 24 11 5
Reading aloud to students 28 31 22 10 10Conducting individual student progressconferences
20 45 24 7 4
aPercentages for each group may not total 100 because they are rounded. The most common responses are shaded.bSee Appendix C for a full text of the activities.cThe time period spans 5 class sessions.
Instructional strategies used to teach reading
The instructional practices introduced by the CRP included a number of innovative strategies. Thefrequencies with which these strategies are used by elementary and secondary teachers are depictedrespectively in Tables 6 and 7. A review of both tables reveals that generally the strategies are used moreoften by the elementary teachers than by the secondary teachers. As can be seen in Table 6, a majority ofthe elementary teachers made weekly use of the following strategies: FCAT exercises (85%), read andretell (83%), summary frames (60%), journals (86%), book sharing with a partner (67%), the MDCPS’“FCAT Instructional Procedure” (61%), and rereading with a partner (68%). In contrast, Table 7 revealsthat only FCAT exercises (68%) and reading aloud (54%) were used weekly by a majority of thesecondary teachers.
Table 6 also reveals that the elementary teachers tended not to use student-scored writing or student-selected spelling or vocabulary words. In general, the elementary teachers made weekly use of nine of thethirteen strategies. As for secondary teachers, Table 7 reveals that they tended not to use student-scoredwriting, learning logs, or book sharing. There were also increases from year 2 to year 3 in the reported useof certain strategies. Among elementary teachers, the use of FCAT exercises, student-generated questions,and journals increased. Among secondary teachers, the use of graphic organizers, learning logs, and readingaloud increased.

Third Interim Report: 2000-01 School Year
Evaluation of the Comprehensive Reading Plan 19
Table 6
Frequency that various reading-related instructional strategies are used byelementary teachers, year 3
% of teachers a
Instructional strategyb Frequency: Never Occasionally Monthly Weekly
FCAT exercises 6 5 5 85
Reciprocal teaching 13 22 18 48
Read and retell 1 6 10 83
Summary frames 13 12 15 60
Student-generated questions 10 21 18 50
Student-scored writing 39 24 18 20
Student-selected spelling or vocabularywords 33 31 11 25
Assessment with Benchmark books 9 40 34 17
Journals 4 4 6 86
Book sharing with a partner 4 13 16 67
Book talks 14 34 21 31
MDCPS’ “FCAT Instructional Procedure” 14 14 12 61
Rereading with a partner 4 14 14 68aPercentages may not total 100 because they are rounded. The most common responses are shaded.bSee Appendix C for a full text of the strategies.
Table 7
Frequency that various reading-related instructional strategies are used bysecondary teachers, year 3
% of teachers a
Instructional strategyb Frequency: Never Occasionally Monthly Weekly
FCAT exercises 7 13 13 68
Reciprocal teaching 20 27 20 33
Note-taking strategies 21 28 22 29
Summary frames 21 27 16 36
Student-generated questions 15 24 21 40
Student-scored writing 38 30 20 13
Graphic organizers 22 25 22 31
Learning logs 39 24 12 25
Reading aloud 15 24 14 54
Book sharing 32 30 17 21aPercentages may not total 100 because they are rounded. The most common responses are shaded.bSee Appendix C for a full text of the strategies.
Particularly effective strategies
The teachers were also asked to identify a strategy that had been particularly effective in improving theirstudents’ reading proficiency. The results in rank order appear in Tables 8 and 9, which reflect respectivelythe responses of the elementary teachers and the secondary teachers. For comparison purposes, the survey

Third Interim Report: 2000-01 School Year
20 Evaluation of the Comprehensive Reading Plan
responses from years 1 and 2 are listed in the second and third columns of each table. A review of thetables reveals that the FCAT exercises was the strategy most frequently selected as effective by both theelementary and the secondary teachers in years 2 and 3, but not in year 1. In that year, the most commonresponse for elementary teachers was read and retell; and for secondary teachers, it was reading aloud.In general, all of the strategies selected by at least 7% of the teachers in years 1 and 2 remained popularin year 3. These strategies included FCAT exercises, read and retell, summary frames, and reciprocalteaching among elementary teachers. Among secondary teachers, they included FCAT exercises, readingaloud, student-generated questions, and summary frames. Two strategies included in the elementary surveyfor the first time in year 3, the MDCPS’ “FCAT Instructional Procedure” and rereading with a partner,were also popular. In addition, graphic organizers appeared to increase in popularity with secondaryteachers in year 3.
Table 8Elementary teachers’ ranking of instructional strategies on theireffectiveness in improving students’ reading proficiency, year 3
Instructional strategya
% of teachersb
Year 3 Year 2 Year 1FCAT exercises 16.2 19.7 8.3Read and retell 14.5 17.2 28.7Summary frames 12.9 14.2 12.5MDCPS’ “FCAT Instructional Procedure” 7.7 -c -c
Reciprocal teaching 6.4 7.0 8.7Rereading with a partner 6.1 -c -c
Journals 5.7 4.8 4.0Book sharing with a partner 3.5 4.4 7.8Student-generated questions 3.3 3.3 2.7Assessment with Benchmark books 1.3 3.5 5.2Book talks 1.3 2.0 2.2Student-scored writing 1.1 2.0 1.5Student-selected spelling or vocabulary words 0.0 0.4 0.6Effective strategy not identified 20.0 21.6 17.7aSee Appendix C for a full text of the strategies.bPercentages may not total 100 because they are rounded.cItem was not included in the survey this year.
Table 9Secondary teachers’ ranking of instructional strategies on theireffectiveness in improving students’ reading proficiency, year 3
Instructional strategya
% of teachersb
Year 3 Year 2 Year 1FCAT exercises 15.3 18.0 8.9Reading aloud 12.9 12.1 14.9Graphic organizers 7.6 5.8 5.0Student-generated questions 7.6 8.8 9.3Summary frames 7.4 8.1 8.0Reciprocal teaching 5.5 8.1 9.3Note-taking strategies 4.9 5.6 5.7Learning logs 1.7 1.5 4.1

Third Interim Report: 2000-01 School Year
Evaluation of the Comprehensive Reading Plan 21
Student-scored writing 1.7 1.5 2.8Book sharing 0.9 2.7 2.8Effective strategy not identified 34.5 27.4 29.2aSee Appendix C for a full text of the strategies.bPercentages may not total 100 because they are rounded.
In summary, elementary teachers tended to devote the most time to two instructional activities: interactivereading instruction at grade level, and writing. Several instructional strategies were used weekly by amajority of these teachers. They included: FCAT exercises, read and retell, summary frames, journals,book sharing with a partner, the MDCPS’ “FCAT Instructional Procedure,” and rereading with a partner.The single strategy they perceived to be most effective in improving the students’ reading proficiency wasFCAT exercises. The secondary teachers, on the other hand, tended to devote the most time to fourinstructional activities: interactive reading instruction focused on course content, structured reading in pairsor groups, writing, and independent reading. The majority of the secondary teachers made weekly use ofFCAT exercises and reading aloud. Like the elementary teachers, they perceived FCAT exercises to bethe most effective in improving the students’ reading proficiency.
Students’ independent reading
The CRP stipulates that students in grades 1 through 12 “read a minimum of five books during each nine-week grading period” (MDCPS, January, 1998, p. 8). This issue was addressed in both the Survey ofReading Practices in Elementary Schools and the Survey of Reading Practices in Secondary Schools.The respondents reported the percentage of their students who had complied with this requirement in thegrading period prior to the administration of the survey (i.e., the second nine-week period of year 3). Theteachers’ responses ranged from 0 to 100% of their students. The mean percentage for the elementarystudents was 73%; and, for the secondary students, it was 34%. These percentages were almost identicalto those reported in years 1 and 2. Since the accuracy of the teachers’ responses may have varied due totheir source of information, Table 10 partitions their responses accordingly. As the table illustrates, 80%of the elementary teachers consulted records for the information. These records were primarily their own,but records from the Accelerated Reader program were also consulted. In contrast, only 29% of thesecondary teachers consulted such records. Consequently, 41% of them gave estimates; and, 30% simplydid not respond to the item.
Table 10
Percentage of students reading a minimum of 5 books duringthe second 9-week grading period, year 3
Source of data: % of respondents a
School level % of students Records Estimate No response
Elementary 73 80 11 9
Secondary 34 29 41 30aPercentages may not total 100 because they are rounded.
Provision of remediation
Under the provisions of the CRP, the Scholastic Reading Inventory (SRI) is to be administered early eachfall to the students in grades 2 through 11, and late each spring to the students in grades 1 through 11. Theresults of these administrations through year 3 are summarized in this section of the report. Additionally,the need for remediation indicated by the SRI scores prompted a review of the Student Performance Plan

Third Interim Report: 2000-01 School Year
22 Evaluation of the Comprehensive Reading Plan
Conferences, the instructional modifications, and the summer school enrollment. The intent of the reviewwas to ascertain the extent of remediation provided during years 1, 2, and 3.
Unlike other tests administered by the district, which may exclude exceptional education and limited Englishproficient students, the SRI is administered to all students. As can be seen in Table 11, of the studentsofficially enrolled in October, 2000, 93% had taken the September SRI, and 90% subsequently took theMay SRI. These percentages are comparable to those for year 1, which were 95% and 88% respectively,and for year 2, which were 94% and 90%. The lower percentage in May of each year may be due towithdrawals, or to the promotion of some students from grade 11 to grade 12. As previously noted, thedistrict does not administer the SRI in grade 12.
The CRP utilizes the SRI to measure the students’ reading proficiency in order to fulfill the following threepurposes (Miami-Dade County Public Schools, January, 1998, p. 4):
! To assist teachers in recommending books for independent reading which are within each student’slexile range
! To provide information, in addition to the SAT scores, the FCAT scores, and the teacher’s ownjudgment, that can help teachers identify students who should receive further diagnosis and possibleremediation
! To serve as one indicator, along with the district’s other standardized test scores, of the effectivenessof reading instruction at district schools.
Table 11Percentage of students taking the Scholastic Reading Inventory (SRI), years 1, 2and 3
% of studentsYear 1 Year 2 Year 3
School levelSeptember
1998 May 1999September
1999 May 2000September
2000 May 2001
Elementarya 96 (grades 2-5)
93 (grades 1-5)
95 (grades 2-5)
94(grades 1-5)
96(grades 2-5)
95(grades 1-5)
Middle (grades 6-8) 97 90 97 93 95 93Senior high(grades 9-11) 90 76 90 79 88 79All relevantgrades 95 88 94 90 93 90Note. The percentages are based on the district’s official enrollment in October of each school year.aThe district administers the SRI in the fall to students in grades 2 through 11, and in the spring to students in grades 1 through11.
In accordance with the second purpose above, performance on the SRI is one piece of information usedto judge which students are eligible to receive appropriate remediation. In order to identify these students,district reading and testing experts determined the range of SRI scores that is appropriate for each gradelevel. Charts illustrating the various ranges across the grade levels for the September and Mayadministrations of the SRI appear in Appendix D. For grades 1 through 5, the lowest score of the rangein the student’s current grade serves as the standard for determining whether or not a student needsremediation. For grades 6 through 11, however, there appears to be a discrepancy in the standard.According to the Comprehensive Reading Plan (Miami-Dade County Public Schools, January, 1998,

Third Interim Report: 2000-01 School Year
Evaluation of the Comprehensive Reading Plan 23
Figure 7. Students’ performance relative to the established standardson the September administration of the Scholastic Reading Inventory(SRI), year 3
p. 40), the standard is the lowest score of the range one grade prior to the student’s current grade. But,according to the Pupil Progression Plan (Miami-Dade County Public Schools, October, 2000,pp. I-31, I-46), the standard is the lowest score of the range two grades prior to the student’s currentgrade.
To facilitate the data analysis, the elementary level’s “at grade” standard was used exclusively in this report.Given this condition, the data revealed that in year 3 the proportion of all students that scored below thestandard for their grade level on the SRI was about 46% for the September administration and 51% forthe May administration. These percentages compare to 49% and 38% respectively for the administrationsin year 1 and 47% and 51% in year 2. While the percentages for the September administration arecomparable for all three years, the May percentage exhibited a distinct increase in year 2. This increase,however, may be misleading, since the SRI instrument was revised in that year. The publisher introduceda new “wide range” format in the test form for grades 1 through 6. The new format was designed to capturethe reading levels of students reading as much as three years above or below their current grade. The oldformat had only accommodated reading levels one year above or below the current grade. There were nochanges made in the forms for grades 7 through 11. The intent of the change in the forms for the elementarygrades was to increase the proportion of students for whom scores could be obtained. It is entirelypossible, however, that there were also unintended consequences of the change. An analysis of thedifferences in the SRI results by grade level from year 1 to year 2 reveals distinct changes in grade 2through 6 scores. It is therefore possible that the increase in the percentage of students scoring below thestandard on the May administration of year 2 is due, at least in part, to the changes in the instrument andnot to changes in instruction or in student achievement.
The students’ performance on the SRI in year 3 is portrayed across grade levels in Figures 7 and 8 for the
September and May administrations respectively. For both administrations, the distribution of studentsscoring below the standard displayed a range of about 30 percentage points across the grade levels. In the

Third Interim Report: 2000-01 School Year
24 Evaluation of the Comprehensive Reading Plan
Figure 8. Students’ performance relative to the established standardson the May administration of the Scholastic Reading Inventory (SRI),year 3
September administration, the distribution ranged from a high of 65% in grade 2 to a low of about 34% ingrade 8. In the May administration, it ranged from a high of 71% in grade 1 to a low of 40% in grade 9.Finally, as can be seen from an examination of Figures 7 and 8, the application of the two different “belowgrade” standards in grades 6 through 11 yields lower proportions of students in need of remediation. Thisis of interest, but once again, the data analysis in this report adheres exclusively to the “at grade” standard.
As previously noted, the SRI score is one of several factors taken into consideration when making adecision regarding a student’s need for remediation. Consequently, not every student scoring below thegrade level standard on the SRI will participate in a Student Performance Plan conference. About 14.9%of the students who scored below the standard on the September SRI had a conference during year 3. Thisfigure is 1.9 percentage points higher than in year 1. Table 12 summarizes the distribution by school levelof Student Performance Plan Conferences conducted for students who took the SRI in September of eachyear. A review of the table reveals that, among students scoring below the standard, the highest percentagereceiving conferences were in elementary school (grades 2 through 5). This was true for all three years;moreover, the percentage increased nearly 4 points from year 1 to year 3. In contrast, the lowestpercentage of conferences were in the senior high schools (grades 9 through 11), where the percentageactually declined more than 3 points from year 1 to year 3. Additionally, conferences for students inelementary school were more likely than not to include their parents. This was not the case in theconferences for students in middle or senior high schools. Finally, among the students scoring at or abovethe grade level standard on the SRI in year 3, 3.5% had a Student Performance Plan Conference. Thisfigure reflects an increase of only 0.9 percentage points over year 1. Overall, among students scoring at

Third Interim Report: 2000-01 School Year
Evaluation of the Comprehensive Reading Plan 25
or above the standard, less than 5% participated in conferences at each school level during any of the threeyears.

Third Interim Report: 2000-01 School Year
26 Evaluation of the Comprehensive Reading Plan
Table 12
Student Performance Plan Conferences conducted for students scoring belowand at or above the standard on the Scholastic Reading Inventory (SRI)administered in September, years 1, 2, and 3
Student Performance PlanConference
School levelElementary (2-5)
%(N)aMiddle (6-8)
%(N)aSenior high (9-11)
%(N)aTotal%(N)a
Students scoring below the grade level standard on the SRI
Year 1
With parent 12.3 (7,346) 2.1 (835) 1.9 (658) 6.5 (8,839)Without parent 7.9 (4,745) 6.5 (2,573) 4.2 (1,483) 6.5 (8,801)None 79.8 (47,740) 91.4 (36,262) 94.0 (33,386) 86.9 (117,388)
Total 100.0 (59,831) 100.0 (39,670) 100.0 (35,527) 100.0 (135,028)
Year 2
With parent 14.3 (8,679) 2.8 (843) 0.4 (157) 7.6 (9,679)Without parent 9.2 (5,603) 6.2 (1,858) 3.7 (1,403) 6.9 (8,864)None 76.4 (46,340) 91.0 (27,188) 95.8 (35,970) 85.5 (109,498)
Total 100.0 (60,622) 100.0 (29,889) 100.0 (37,530) 100.0 (128,041)
Year 3
With parent 13.1 (7,948) 2.6 (827) 0.2 (84) 6.7 (8,859)Without parent 11.0 (6,689) 9.8 (3,082) 2.4 (960) 8.2 (10,731)
None 75.9 (46,005) 87.5 (27,423) 97.3 (38,280) 85.1 (111,708)Total 100.0 (60,642) 100.0 (31,332) 100.0 (39,324) 100.0 (131,298)
Students scoring at or above the grade level standard on the SRI
Year 1
With parent 1.2 (591) 0.6 (253) 1.2 (438) 1.0 (1,282)
Without parent 0.8 (364) 1.1 (456) 2.1 (745) 1.3 (1,565)None 98.0 (47,562) 98.2 (38,992) 96.7 (34,855) 97.7 (121,409)Total 100.0 (48,517) 100.0 (39,701) 100.0 (36,038) 100.0 (124,256)
Year 2
With parent 1.9 (897) 1.1 (522) 0.3 (95) 1.2 (1,514)Without parent 1.2 (559) 2.8 (863) 2.3 (763) 1.7 (2,185)None 97.0 (46,753) 97.2 (47,419) 97.4 (32,533) 97.2 (126,705)Total 100.0 (48,209) 100.0 (48,804) 100.0 (33,391) 100.0 (130,404)
Year 3
With parent 2.1 (1,059) 1.0 (498) 0.1 (29) 1.2 (1,586)Without parent 1.6 (781) 3.9 (1,976) 1.0 (340) 2.3 (3,097)None 96.3 (48,029) 95.1 (47,630) 98.9 (33,002) 96.5 (128,661)
Total 100.0 (49,869) 100.0 (50,104) 100.0 (33,371) 100.0 (133,344)aPercentages may not total 100 because they are rounded.
The Student Performance Plan resulting from the conference may include a number of remedial activities.Some of these activities are recorded in the district’s Student Case Management System (SCMS). Twoof the recorded activities are: additional instructional time (e.g., extended day services, Saturday program),and suspension of curriculum areas other than reading and mathematics. According to the SCMS in year3, 6.2% of the students who scored below the standard on the September SRI received additionalinstructional time, and 0.6% of these students were assigned suspension of curriculum areas. Bycomparison, about 1.6% of the students scoring at or above the standard received additional instructionaltime, and 0.2% were assigned suspension of curriculum areas. The respective percentages for both setsof students were essentially the same for all three years.

Third Interim Report: 2000-01 School Year
Evaluation of the Comprehensive Reading Plan 27
Remediation might also involve completion of summer school. Table 13 summarizes the distribution bygrade level of summer school completion and subsequent promotion or retention for students in grades 1through 8. The table partitions the students by those scoring below and at or above the standard on theMay SRI for each year. A review of the table reveals that students scoring below the standard were mostlikely to complete summer school. Overall, 43.3% (n=54,001) of the students scoring below the standardin year 3 subsequently completed summer school that year. This percentage is higher than the 38.7%(n=31,654) in year 1 and the 41.8% (n=51,218) in year 2. The rate of summer school completion amongstudents scoring at or above the standard remained relatively stable in year 1 and year 2 at 18.8%(n=22,790) and 18.6% (n=15,928) respectively. However, the rate rose to 20.0% (n=17,854) in year 3,although the number of students actually declined as compared to year 1.
For students who are still below the standard after the completion of summer school, their remediation mayinvolve retention in grade. Of the students in grades 1 through 8 who scored below the standard in year3, 2.3% not only completed summer school but were also retained. By comparison, only 0.3% of thestudents who scored at or above the standard completed summer school and were retained. A review ofTable 13 reveals that there is a general relationship between retention and reading performance, asmeasured by the SRI. Specifically, poor performance in reading appears to be related to the decision toretain students, even though they completed summer school.
Table 14 uses the same format as Table 13 to address the upper grade levels, i.e., grades 9 through 11.A review of Table 14 reveals that, in general, students in these grades are more likely to attend summerschool than students in the lower grade levels, i.e., grades 1 through 8. Still, even among the upper gradelevels, students scoring below the standard were more likely to complete summer school. Overall, 55.0%(n=18,917) of the students scoring below the standard in year 3 subsequently completed summer schoolthat year. This percentage is slightly higher than the 54.9% (n=17,978) for year 2 and the 54.1%(n=17,936) for year 1. By comparison, the rate of summer school completions among students scoring ator above the standard declined slightly from 45.9% (n=12,497) in year 1 to 43.9% (n=13,569) in year 3,but the number of students actually rose.
Retention in grade is also a remediation option for students in the upper grade levels. Of the students inthese grades who scored below the standard in year 3, 9.3% completed summer school and were retained.By comparison, only 3.3% of the students who scored at or above the standard completed summer schooland were retained. For both groups, these percentages are much higher than those in the lower gradelevels. Still, retention in the upper grades does not hold exactly the same meaning as it does in the lowergrades. Specifically, in a senior high school, students are assigned to grade levels according to the numberof courses that they have successfully completed. Therefore, it is possible, for example, that the assignmentof a student to grade 9 for two years may be due to reasons unrelated to their reading ability per se.Nevertheless, a review of Table 14 reveals that there is indeed a general relationship between retention andreading performance, as measured by the SRI. Poor performance in reading appears to be related to thedecision to retain students, even though they completed summer school.

Third Interim Report: 2000-01 School Year
Evaluation of the Comprehensive Reading Plan 27
Table 14Summer school enrollment and retention for students in grades 9through 11 scoring below and at or above the standard on theScholastic Reading Inventory (SRI) administered in May, years 1, 2,and 3
Summer schoolcompleted . . .
Grade
Total%(N)
9%(N)
10%(N)
11%(N)
Year 1: Students scoring below the grade level standard on the SRIBut not promoted 7.8 (849) 8.0 (935) 4.1 (428) 6.7 (2,212)
And promoted 49.0 (5,352) 48.1 (5,627) 44.9 (4,745) 47.4 (15,724)Not enrolled 43.2 (4,713) 43.9 (5,145) 51.0 (5,389) 45.9 (15,247)Total 100.0 (10,914) 100.0 (11,707) 100.0 (10,562) 100.0 (33,183)
Year 2: Students scoring below the grade level standard on the SRIBut not promoted 12.7 (1,628) 6.3 (664) 5.4 (499) 8.5 (2,791)And promoted 44.8 (5,746) 48.9 (5,165) 45.9 (4,276) 46.4 (15,187)Not enrolled 42.6 (5,465) 44.8 (4,734) 48.7 (4,532) 45.0 (14,731)
Total 100.0 (12,839) 100.0 (10,563) 100.0 (9,307) 100.0 (32,709)Year 3: Students scoring below the grade level standard on the SRI
But not promoted 14.3 (1,982) 7.5 (796) 4.3 (427) 9.3 (3,205)And promoted 43.7 (6,036) 48.6 (5,130) 45.3 (4,546) 45.7 (15,712)
Not enrolled 42.0 (5,799) 43.8 (4,624) 50.4 (5,063) 45.0 (15,486)Total 100.0 (13,817) 100.0 (10,550) 100.0 (10,036) 100.0 (34,403)
Year 1: Students scoring at or above the grade level standard
But not promoted 2.8 (402) 2.6 (217) 1.3 (56) 2.5 (675)And promoted 47.7 (6,963) 42.6 (3,592) 30.0 (1,267) 43.4 (11,822)Not enrolled 49.6 (7,234) 54.9 (4,629) 68.7 (2,898) 54.2 (14,761)Total 100.0 (14,599) 100.0 (8,438) 100.0 (4,221) 100.0 (27,258)
Year 2: Students scoring at or above the grade level standardBut not promoted 5.0 (668) 2.3 (231) 2.1 (133) 3.4 (1,032)And promoted 45.7 (6,107) 42.0 (4,280) 34.3 (2,206) 42.0 (12,593)
Not enrolled 49.3 (6,580) 55.7 (5680) 63.7 (4,098) 54.6 (16,358)Total 100.0 (13,355) 100.0 (10,191) 100.0 (6,437) 100.0 (29,983)
Year 3: Students scoring at or above the grade level standardBut not promoted 5.2 (718) 2.2 (233) 1.1 (73) 3.3 (1,024)
And promoted 44.0 (6,099) 40.5 (4,211) 33.5 (2,235) 40.6 (12,545)Not enrolled 50.9 (7,057) 57.2 (5,949) 65.4 (4,361) 56.1 (17,367)Total 100.0 (13,874) 100.0 (10,393) 100.0 (6,669) 100.0 (30,936)
Remediation activities from the perspective of the state’s directives
In light of the DOE’s goal to eliminate the disproportionate representation of fourth grade minority studentsperforming in the lowest quartile of norm-referenced reading tests, additional analyses of the SRI andremediation data were undertaken. First, the groups of students who participated in conferences orattended summer school were examined by racial/ethnic category. Then, the SRI results were compared

Third Interim Report: 2000-01 School Year
28 Evaluation of the Comprehensive Reading Plan
African-American Hispanic White Other0
10
20
30
40
50
60
Year 1
Year 2
Year 3
Figure 9. Percentage of students by race/ethnicity scoringbelow the standard on the Scholastic Reading Inventory (SRI)administered in September who had Student Performance PlanConferences, years 1, 2, and 3
with those of the 1998 SAT Reading Comprehension subtest, which were used to operationally define thelevels of need of the elementary schools. Finally, the Student Performance Plan Conferences and summerschool enrollment data for the elementary schools were examined by the school’s level of need.
The percentage of students scoring below the standard on the September SRI who had StudentPerformance Plan Conferences is illustrated in Figure 9. The figure partitions the students by racial/ethniccategory. A review of the figure reveals that the highest percentage of conferences in a category wasexhibited by the African-American students in year 3, when approximately 16% of them had conferences.The proportion of students in each category who had conferences increased by at least 2 percentage pointsfrom year 1 to year 3. Overall, the white students had the lowest rate of conferences. With regard to the
actual quantity of conferences, the Hispanic students had the highest number. This is understandable, sincethey represent the largest ethnic group.
Figure 10 illustrates the percentage of students scoring below the standard on the May SRI who completedsummer school. This figure, like the previous one, partitions the students by racial/ethnic category. A reviewof the figure reveals that the highest percentage of enrollment for a category is exhibited by the African-American students, who had a 47% enrollment in year 1 and 52% in years 2 and 3. This group also hadthe highest growth in enrollment from year 1 to year 3. The Hispanic students had a slightly higherpercentage of enrollment in year 3 than in years 1 and 2. They also had the highest number of studentsenrolled. Once again, this is due to the fact that they represent the largest ethnic group.

Third Interim Report: 2000-01 School Year
Evaluation of the Comprehensive Reading Plan 29
African-American Hispanic White Other0
10
20
30
40
50
60
Year 1
Year 2
Year 3
Figure 10. Percentage of students by race/ethnicity scoringbelow the standard on the Scholastic Reading Inventory (SRI)administered in May who completed summer school, years 1,2, and 3
In order to ascertain the SRI’s utility in the identification of pockets of need for reading instruction, theelementary students’ performance on the test was examined by the schools’ levels of need. As can be seenin Table 15, for each administration of the SRI, the proportion of students scoring below the standardincreases progressively as the level of need rises. This is an indication that there is a positive correlationbetween the SRI scores and the Stanford Achievement Test (SAT) scores which were used to establishthe levels of need. Nevertheless, further analysis revealed a discrepancy in the results. There is generalconcurrence on the percentages of students requiring remediation in the schools at the high and themoderate levels of need. But at the low level, the SRI scores ranged from 28 to 44%, which isapproximately double the 17% yielded by the SAT scores. Consequently, it appears that either the SRIis overestimating the need for remediation in the schools with a low level of need, or the SAT isunderestimating it.
Table 15Percentage of elementary students scoring below thestandard on the Scholastic Reading Inventory (SRI) bythe school’s level of need, years 1, 2, and 3
School’s Level of NeedEvaluation year Test date Low Moderate High
1September 38 57 62May 28 43 48
2September 39 56 62May 44 62 67
3September 38 56 62May 44 62 66
Figure 11 displays the percentage of Student Performance Plan Conferences conducted for elementarystudents who scored below the standard. The figure partitions the students by the schools’ levels of need.

Third Interim Report: 2000-01 School Year
30 Evaluation of the Comprehensive Reading Plan
Figure 11. Student Performance Plan Conferences conducted forelementary students scoring below the standard on the ScholasticReading Inventory (SRI) administered in September by the school’slevel of need, years 1, 2, and 3
A review of the figure reveals that the percentage of students served by conferences increased across theyears for schools with low and moderate levels of need. However, at schools with a high level of need, thepercentage of students served declined from year 2 to year 3. In fact, the percentage of students servedin year 3 at schools with a high level of need was actually lower than at schools with a moderate level ofneed. This is an alarming development, since the proportion of students served by conferences shouldideally reflect the school’s level of need - the hgher the need, the greater the proportion. This generalpattern, which previously had been stable, is an indication that progress was being made in the remediationof students’ reading deficiencies. The break from the pattern in year 3 is cause for concern. It raisesquestions regarding the proper concentration of resources where the needs are greatest.
The Student Performance Plan Conferences recorded for all elementary students who scored at or abovethe standard increased from 400 in year 1 to 1,939 in year 3. The percentage of students scoring at orabove the standard who received conferences in year 3 ranged from 3% at low need schools to 5% at highneed schools. These percentages are quite low when compared to those for students scoring below thestandard.
Figure 12 displays the percentage of elementary students scoring below the standard who completed thesummer school sessions. This figure, like the previous one, partitions the students by the schools’ levels ofneed. A review of the figure reveals that the percentage of students completing summer school increasedacross the years for schools with moderate and high levels of need. At low need schools, the percentageof students enrolled decreased from year 1 to year 2, but increased again in year 3. Of greater interest isthe fact that in year 3 the percentage of students enrolled at schools with a high level of need is exceededby schools with a moderate level of need. This development mirrors the situation with the conferencesdepicted in Figure 11. And, it is llikewise a cause for concern, because it once again raises the issue of theproper deployment of resources.

Third Interim Report: 2000-01 School Year
Evaluation of the Comprehensive Reading Plan 31
Figure 13. Summer school enrollment for elementary studentsscoring at or above the standard on the Scholastic Reading Inventory(SRI) administered in May by the school’s level of need, years 1, 2,and 3
Figure 12. Summer school enrollment for elementary studentsscoring below the standard on the Scholastic Reading Inventory(SRI) administered in May by the school’s level of need, years 1, 2,and 3
Figure 13 displays the percentage of elementary students scoring at or above the standard who completedthe summer school sessions across the years. This figure, like the previous figure, partitions the students bythe schools’ levels of need. A review of the figure reveals that, as would be expected, the percentage ofstudents attending summer school is much smaller than that of students scoring below the standard.Nevertheless, the pattern of change across the years for both groups is similar.

Third Interim Report: 2000-01 School Year
32 Evaluation of the Comprehensive Reading Plan
In summary, about 46% of the students in grades 2 through 11 scored below the standard for their gradeon the SRI in the September, 2000 administration; and about 51% of the students in grades 1 through 11scored likewise in the May, 2001 administration. About 14.9% of the students scoring below the standardin September participated in a Student Performance Plan Conference during year 3. And, 43.3% of thegrade 1-8 students scoring below the standard in May subsequently completed summer school. In addition,2.3% of the grade 1-8 students scoring below the standard were retained in grade despite completingsummer school. Among grade 9-11 students, 55.0% of those scoring below the standard subsequentlycompleted summer school, and 9.3% completed summer school but were retained in grade. Finally, thedata revealed that in year 3 both the number of Student Performance Plan Conferences and the summerschool completion rate at elementary schools with a high level of need were exceeded by elementaryschools with a moderate level of need. This surprising development is cause for concern, since it raisesquestions about the proper deployment of resources in the district’s effort to remediate students withreading deficiencies.
Comparative efficacy of the plan
Not all of the elementary schools in Miami-Dade County have implemented the CRP. A few schools haveelected to implement the Success for All/Roots and Wings Program (SFA) or the SRA Reading MasteryDirect Instruction Program (SRA). During years 1 and 2, the Office of Evaluation and Research conducteda separate evaluation designed to compare the performance of students participating in the CRP with thatof students participating in the SFA or SRA programs. The evaluation included 18 schools selected for theirdemographically similar student populations and their implementation of one of the three programs. Six ofthe schools implemented the CRP, three implemented SRA, and nine implemented SFA. Additionally, sixof the nine SFA schools implemented an ancillary component, which is designed to give students time onclassroom-based micro-computers using software from either the Computer Curriculum Corporation orJostens Learning Corporation (Urdegar, 2000, 2001).
Over the course of the evaluation, the performance of the students from this sample of schools wasanalyzed to assess the comparative effectiveness of the CRP. The results of years 1 and 2 revealed that,when the prior level of reading performance is taken into consideration, the students in each of the threeprograms generally performed equally well. Still, two statistically significant differences were identified. Ingrade 1 in year 1, and grade 2 in year 2, students in the SRA program outperformed students in the CRP(Urdegar, 2000, 2001).
In year 3, there was a shift in the reading programs offered by the schools. Although SFA continued to havea presence in the district, most of the SFA schools were considering making a transition to either the CRPor SRA. As a result of this change, an alternate strategy was needed for the program comparison in year3. The comparison was confined to only the CRP and SRA. Ten schools from each program wereselected. The SAT Reading Comprehension subtest scores of the students in grades 3 through 5 at theCRP schools were compared to those of the students at the SRA schools. Since the year 2 scores for thetwo groups were found to be indistinguishable, it was deemed appropriate to compare the year 3 scoresto assess differences in improvement for the school year. The results by grade level are summarized inTable 16. A review of the table reveals that in grade 4 SRA students outperformed CRP students.Nevertheless, as in earlier years, no pattern emerges that would suggest the clear superiority of oneprogram over the other.

Third Interim Report: 2000-01 School Year
Evaluation of the Comprehensive Reading Plan 33
Table 16
Student performance on the SAT Reading Comprehensionsubtest at 20 selected schools by reading program, year 3
Grade Reading program
SAT mean scale score
Comparison0(N of students)
3Comprehensive Reading Plan 613.81 (817)
SRA Direct Instruction 613.80 (770)
4Comprehensive Reading Plan 631.62 (793)
p < .05SRA Direct Instruction 638.33 (781)
5Comprehensive Reading Plan 640.44 (831)
SRA Direct Instruction 641.47 (799)
Impact of the plan
In addition to the comparative study on the efficacy of the CRP, the evaluation also encompassed alongitudinal assessment of the plan to gauge its impact. Data on the students’ improvement in reading werederived from the measures of four cohorts consisting of all the students in grades 2, 3, 6, and 9 who scoredbelow proficiency on the SRI administered in September of year 1. The grade designation obviouslychanged for nearly all of these students in years 2 and 3. However, for the sake of simplicity, the fourgroups will be referred to as cohorts 2, 3, 6, and 9 throughout this report. The following aspects of thecohorts’ reading progress are addressed in this section: (a) their performance on the SAT ReadingComprehension subtest, (b) the remedial services provided to them, and (c) variations in readingperformance and services provided across the levels of need of the elementary schools attended byselected cohorts. Finally, it must be emphasized that this section of the report deals exclusively with theimpact of the CRP on students initially identified as having difficulty with reading.
Achievement on the norm-referenced test
Despite both the inevitable student attrition due to withdrawal from the school system and shifts in the gradelevels targeted by the district’s testing program, SAT scores for year 3 were available for nearly 64% ofthe students in the cohorts. The availability of test score data for each of the four cohorts is summarized inTable 17. It should also be recalled that not all of the students take the SAT. Normally, exceptionaleducation students (other than gifted, and speech and language impaired) and limited English proficient(LEP) students are excluded from the test. However, students in these categories may take the test, ifrespectively their Individualized Educational Plan (IEP) or their LEP committee specify it. Furthermore,once LEP students have received two years of English language instruction, they are no longer exempt fromtesting. The scores of exempt students who are tested are coded “tested but ESE” or “tested but LEP.”These scores are not generally included in the calculation of a school’s overall achievement level. For thepurpose of this study, however, the scores of all students in the cohorts are included in the analysis.

Third Interim Report: 2000-01 School Year
34 Evaluation of the Comprehensive Reading Plan
Table 17
Availability of SAT scores for cohort students scoring below thestandard on the September, 1998 Scholastic Reading Inventory(SRI), years 1, 2 and 3
CohortSeptember 1998
NYear 1%(N)
Year 2%(N)
Year 3%(N)
2 17,996 90.3 (16,254) 89.4 (16,091) 86.5 (15,561)
3 12,312 86.3 (10,622) 89.3 (10,986) 86.6 (10,657)
6 11,737 86.2 (10,119) 81.5 (9,570) 79.8 (9,364)
9 13,664 -a 55.6 (7,598) -a
Total 55,709 66.4 (36,995) 79.4 (44,245) 63.9 (35,582)aIn the specified year, the district’s SAT testing program did not target this grade level.
Another factor that affected the availability of SAT scores was grade assignment. The grade assignmentsof some students in year 3 were simply not logical. For example, two cohort 2 students were tested as 2nd
graders in year 3, which would be virtually impossible. Since such exceptions were few and may have beendue to error, it was decided not to include these scores in the analysis. Additionally, as Table 17 illustrates,SAT scores were not available for cohort 9 in grade 9 (i.e., year 1) or grade 11 (i.e., year 3), because thedistrict’s SAT testing program did not target either grade level. Furthermore, the high proportion of missingscores in year 2, when this cohort entered grade 10, may be due to grade assignment issues unique to thesenior high level.
A synopsis of the SAT Reading Comprehension subtest results for the four cohorts in years 1, 2, and 3 isportrayed in Figure 14. The general upward trend in the number of students scoring above the 25th
percentile of the test reflects favorably on their 2½ years of remediation under the CRP. Unfortunately, itmay also reflect a difference in the testing instrument. The district used the 8th edition of the SAT in year1, but in year 2 the Florida Comprehensive Achievement Test Norm-Referenced Test (FCAT-NRT) wasimplemented. The FCAT-NRT is actually a form of the 9th edition of the SAT; so, for the sake of simplicity,it will be referred to as the SAT in this report. Thus, the differences in reading performance from year 1 toyear 2 may reflect both improvement under the CRP and differences between the scaling properties of thetwo editions of the SAT. However, the fact that the FCAT-NRT results continued to generally improvefrom year 2 to year 3 is evidence that the CRP has had a distinct impact on the students’ readingachievement.
A closer review of Figure 14 reveals that the majority of cohort 2 students (62.8%) scored above the 25th
percentile in year 3. In contrast, in each of the other cohorts, the majority of the students scored at or belowthe 25th percentile. For cohort 3, the percentage of students scoring above the 25th percentile decreasedfrom 42.9% in year 2 to 36.4% in year 3. While this result is disappointing, the year 3 performance is stillsubstantially better than that of year 1. The percentage of cohort 6 students scoring above the 25th
percentile increased from 26.9% in year 2 to 39.6% in year 3. It is not possible to make adequatecomparisons for cohort 9, which lacked the necessary scores for years 1 and 3.

Third Interim Report: 2000-01 School Year
Evaluation of the Comprehensive Reading Plan 35
Figure 14. Percentile scores on the SAT Reading Comprehensionsubtest of cohort students scoring below the standard on theSeptember, 1998 Scholastic Reading Inventory (SRI), years 1, 2 and3
Provision of services
Table 18 displays the percentile scores on the SAT Reading Comprehension subtest of the students in thecohorts partitioned by whether or not they had Student Performance Plan Conferences. Since theconferences may have taken place at any time during years 1 through 3, it is not possible to definitively linkthe subsequent provision of remedial services with the students’ performance on the SAT for any of thethree years. Nevertheless, it is interesting to note the success rate of students receiving different services.The table reveals that in all three years, students who scored at or below the 25th percentile on the SATwere more likely to have participated in a Student Performance Plan Conference than students who scoredabove the 25th percentile. This was the case for cohorts 2, 3 and 6, but not cohort 9. For the latter, thesituation was the reverse in year 2, the only year for which SAT data were available. The table alsoillustrates that, given the increase in conferences from year to year, by the end of year 3 the majority of thecohort 2 and 3 students scoring at or below the 25th percentile have had a Student Performance PlanConference. In year 3, the proportions were 61.8% in cohort 2 and 55.8% in cohort 3. In cohort 6,however, only 29.2% of students scoring at or below the 25th percentile had participated in a StudentPerformance Plan Conference. Finally, with regard to retention in grade, the table does not reveal anyconsistent relationship between this factor and the SAT test results.

Third Interim Report: 2000-01 School Year
36 Evaluation of the Comprehensive Reading Plan
Table 18Percentile scores on the SAT Reading Comprehension subtest of cohort students scoring below thestandard on the September, 1998 Scholastic Reading Inventory (SRI) by participation in StudentPerformance Plan Conferences and retention in grade, years 1, 2, and 3
Student PerformancePlan Conference
SAT Percentile scoreYear 1 Year 2 Year 3
0 to 25 26 to 100 0 to 25 26 to 100 0 to 25 26 to 100% (N) % (N) % (N) % (N) % (N) % (N)
Cohort 2Conference Gr. 2 30.4 (2,674) 15.6 (1,159) 2.1 (152) 2.2 (193)
Gr. 3 46.5 (3,353) 25.2 (2,237) 7.4 (429) 4.0 (394)Gr. 4 54.4 (3,146) 35.3 (3,456)Total 30.4 (2,674) 15.6 (1,159) 48.6 (3,505) 27.4 (2,430) 61.8 (3,575) 39.4 (3,850)
Noconference
Gr. 2 69.6 (6,130) 84.4 (6,291) 1.3 (91) 1.4 (123)Gr. 3 50.1 (3,613) 71.3 (6,329) 2.1 (124) 1.6 (160)Gr. 4 36.0 (2,085) 59.0 (5,767)Total 69.6 (6,130) 84.4 (6,291) 51.4 (3,704) 72.6 (6,452) 38.2 (2,209) 60.6 (5,927)
Total incohort
Gr. 2 100.0 (8,804) 100.0 (7,450) 3.4 (243) 3.6 (316)Gr. 3 96.6 (6,966) 96.4 (8,566) 9.6 (553) 5.7 (554)Gr. 4 90.4 (5,231) 94.3 (9,223)Total 100.0 (8,804) 100.0 (7,450) 100.0 (7,209) 100.0 (8,882) 100.0 (5,784) 100.0 (9,777)
Cohort 3Conference Gr. 3 28.6 (2,233) 15.2 (428) 2.9 (181) 3.3 (155)
Gr. 4 42.9 (2,691) 30.0 (1,411) 4.1 (278) 6.8 (263)Gr. 5 51.7 (3,507) 33.1 (1,284)Total 28.6 (2,233) 15.2 (428) 45.7 (2,872) 33.3 (1,566) 55.8 (3,785) 39.9 (1,547)
Noconference
Gr. 3 71.4 (5,570) 84.8 (2,391) 1.5 (96) 1.7 (80)Gr. 4 52.7 (3,310) 65.0 (3,062) 1.2 (84) 2.8 (109)Gr. 5 42.9 (2,911) 57.3 (2,221)Total 71.4 (5,570) 84.8 (2,391) 54.3 (3,406) 66.7 (3,142) 44.2 (2,995) 60.1 (2,330)
Total incohort
Gr. 3 100.0 (7,803) 100.0 (2,819) 4.4 (277) 5.0 (235)Gr. 4 95.6 (6,001) 95.0 (4,473) 5.3 (362) 9.6 (372)Gr. 5 94.7 (6,418) 90.4 (3,505)Total 100.0 (7,803) 100.0 (2,819) 100.0 (6,278) 100.0 (4,708) 100.0 (6,780) 100.0 (3,877)
Cohort 6Conference Gr. 6 11.7 (943) 7.7 (159) 2.6 (184) 1.7 (44)
Gr. 7 16.5 (1,152) 10.3 (266) 5.1 (289) 3.3 (121)Gr. 8 24.1 (1,360) 19.3 (715)Total 11.7 (943) 7.7 (159) 19.1 (1,336) 12.0 (310) 29.2 (1,649) 22.5 (836)
Noconference
Gr. 6 88.3 (7,109) 92.3 (1,908) 5.6 (392) 3.7 (96)Gr. 7 75.3 (5,267) 84.2 (2,169) 9.4 (534) 5.9 (220)Gr. 8 61.4 (3,469) 71.6 (2,656)Total 88.3 (7,109) 92.3 (1,908) 80.9 (5,659) 88.0 (2,265) 70.8 (4,003) 77.5 (2,876)
Total incohort
Gr. 6 100.0 (8,052) 100.0 (2,067) 8.2 (576) 5.4 (140)Gr. 7 91.8 (6,419) 94.6 (2,435) 14.6 (823) 9.2 (341)Gr. 8 85.4 (4,829) 90.8 (3,371)Total 100.0 (8,052) 100.0 (2,067) 100.0 (6,995) 100.0 (2,575) 100.0 (5,652) 100.0 (3,712)
Cohort 9Conference Gr. 9 3.0 (196) 3.9 (44)
Gr. 10 9.2 (598) 9.4 (105)Total 12.2 (794) 13.4 (149)
Noconference
Gr. 9 17.3 (1,120) 19.4 (216)Gr. 10 70.5 (4,569) 67.3 (750)Total 87.8 (5,689) 86.6 (966)
Total incohort
Gr. 9 20.3 (1,316) 23.3 (260)Gr. 10 79.7 (5,167) 76.7 (855)

Third Interim Report: 2000-01 School Year
Evaluation of the Comprehensive Reading Plan 37
Total 100.0 (6,483) 100.0 (1,115)Table 19 displays the year 2 and year 3 percentile scores on the SAT Reading Comprehension subtest ofthe students in the cohorts partitioned by whether or not they completed summer school in year 1 or year2. Since individual students may have attended summer school during either year, it is not possible todefinitively link the summer school attendance with the students’ performance on the SAT for either years2 or 3. Nevertheless, it is interesting to note the success rate of students attending summer school. The tablereveals that in both years 2 and 3, students who scored at or below the 25th percentile on the SAT weremore likely to have attended summer school than students who scored above the 25th percentile. The tablealso illustrates that, given the increase in summer school attendance from year to year, by the end of year3 about two-thirds of the cohort 2, 3 and 6 students scoring at or below the 25th percentile had attendedsummer school. However, the table also illustrates that a substantial proportion of the students scoring ator below the 25th percentile have not completed summer school. The percentages range from a low of27.4% in cohort 2 to a high of 38.7% in cohort 3.
Table 19Percentile scores on the year 2 and year 3 SAT ReadingComprehension subtest of cohort students scoring below thestandard on the September, 1998 Scholastic Reading Inventory(SRI) by summer school completion in years 1 and 2
Summer school completion,year 1 and/or year 2
SAT percentile scoreYear 2 Year 3
0 to 25%(N)
26 to 100%(N)
0 to 25%(N)
26 to 100%(N)
Cohort 2Completed 54.6 (3,937) 30.3 (2,688) 72.6 (4,202) 47.9 (4,681)
Not enrolled 45.4 (3,272) 69.7 (6,194) 27.4 (1,582) 52.1 (5,096)Total in cohort 100.0 (7,209) 100.0 (8,882) 100.0 (5,784) 100.0 (9,777)
Cohort 3Completed 53.7 (3,374) 37.2 (1,752) 61.3 (4,159) 43.5 (1,685)
Not enrolled 46.3 (2,904) 62.8 (2,956) 38.7 (2,621) 56.5 (2,192)Total in cohort 100.0 (6,278) 100.0 (4,708) 100.0 (6,780) 100.0 (3,877)
Cohort 6Completed 53.1 (3,716) 37.5 (966) 70.9 (4,007) 60.1 (2,232)
Not enrolled 46.9 (3,279) 62.5 (1,609) 29.1 (1,645) 39.9 (1,480)Total in cohort 100.0 (6,995) 100.0 (2,575) 100.0 (5,652) 100.0 (3,712)
Cohort 9Completed 56.2 (3,642) 49.7 (554)
Not enrolled 43.8 (2,841) 50.3 (561)Total in cohort 100.0 (6,483) 100.0 (1,115)
Achievement by level of need
In order to ascertain how well the students did in elementary schools with different levels of need, the SATperformance of cohorts 2 and 3 was examined. The percentages of students scoring above the 25th
percentile on the SAT Reading Comprehension subtest despite scoring below the standard on theSeptember 1998 SRI are displayed by the schools’ levels of need in Figures 15 and 16 for cohorts 2 and3 respectively. A review of these figures reveals that in cohort 2 the percentages of students scoring abovethe 25th percentile increased from year 1 to year 3 across every level of need. The increases ranged from15 percentage points at low need schools to 17 points at moderate and high need schools. For cohort 3,the percentages of students scoring above the 25th percentile increased from year 1 to year 2 and then

Third Interim Report: 2000-01 School Year
38 Evaluation of the Comprehensive Reading Plan
Figure 15. Percentage of cohort 2 students scoring above the 25th
percentile on the SAT Reading Comprehension subtest despitescoring below the standard on the September, 1998 ScholasticReading Inventory (SRI) by the school’s level of need, years 1, 2,and 3
declined from year 2 to year 3 across every level of need. Still, the increases from year 1 to year 3 rangedfrom 8 percentage points at both moderate and high need schools to 14 points at low need schools.Clearly, every level of need category made progress from year 1 to year 3 in the remediation of students’reading performance. However, in terms of overall success (i.e., the total percentage of students scoringabove the 25th percentile on the SAT), both Figures 15 and 16 exhibit an inverse relationship between theschool’s level of need and its students’ success on the SAT. Specifically, the students’ success on the SAT
increases as the school’s level of need decreases. It seems logical that a school with fewer students toremediate is likely to be more successful in meeting their needs.
As previously noted, the CRP is not the only reading program being implemented in the district. Of the25,702 students in cohorts 2 and 3 with test data in year 3, the vast majority (i.e., 74%) attend schools thatare implementing the CRP. However, about 20% attend schools that were still implementing SFA in year3; and, about 6% attend schools that are implementing SRA. Table 20 includes a synopsis of the students’reading achievement by the school’s reading program and level of need. A review of the table reveals thatthe percentage of students in either cohort who scored above the 25th percentile in year 3 ranges from alow of 22% for cohort 3 students at the high need schools implementing SFA to a high of 85% for cohort2 students at low need schools implementing SRA. Overall, given comparable levels of need acrossschools, higher percentages of both CRP and SRA students scored above the 25th percentile than SFAstudents. This pattern held for both cohorts 2 and 3. This comparison, incidently, was not possible with thecohort 6 students; because 90% of them were enrolled in middle schools, which implement the CRP almostexclusively. Finally, it is interesting to note that both the SFA and SRA programs generally manifest thesame inverse relationship between the school’s level of need and its students’ SAT success that wasexhibited by the CRP in Figures 15 and 16.

Third Interim Report: 2000-01 School Year
Evaluation of the Comprehensive Reading Plan 39

Third Interim Report: 2000-01 School Year
40 Evaluation of the Comprehensive Reading Plan
Figure 16. Percentage of cohort 3 students scoring above the 25th
percentile on the SAT Reading Comprehension subtest despitescoring below the standard on the September, 1998 ScholasticReading Inventory (SRI) by the school’s level of need, years 1, 2,and 3
In summary, the majority of the cohort 2 students identified by the SRI as below grade level in Septemberof year 1 scored above the 25th percentile on the SAT Reading Comprehension subtest in year 3. Incontrast, the majority of the students in both cohorts 3 and 6 scored at or below the 25th percentile in year3. Nevertheless, it was encouraging to note that the success rate improved from year 1 to year 3 for everycohort, except 9 which lacked the years 1 and 3 scores necessary for the comparison. With regard toretention in grade, the data revealed no consistent relationship between retention and scoring above the 25th
percentile. However, students who scored at or below the 25th percentile on the Reading Comprehensionsubtest were more likely to have completed summer school. The likelihood of students, who were identifiedby the SRI as below grade level, of scoring above the 25th percentile on the SAT decreased as theirschool’s level of need increased. It is understandable that schools with fewer students in need ofremediation are more likely to be successful in their efforts. Finally, greater proportions of CRP and SRAstudents scored above the 25th percentile on the SAT than SFA students enrolled in schools withcomparable levels of need. Thus, the CRP to date continues to exhibit results that are either comparableto or better than those of well-regarded, established reading programs.

Evaluation of the Comprehensive Reading Plan 41
Summary and recommendations
The evaluation of the Comprehensive Reading Plan (CRP) is a longitudinal study. The data collection todate has spanned three school years: 1998-99 (year 1), 1999-00 (year 2), and 2000-01 (year 3). Thisinterim report contains cumulative data through the conclusion of year 3. The report consists of a summaryof data on the teacher training and the students’ reading proficiency. The specific focus of the report waspresented in the Design of the Evaluation as a series of six questions. These questions can now beaddressed for the initial three years of the plan.
1. To what extent do teachers complete the training on the methodology of teaching reading which isprovided by the various district and university sources? To what extent is the training completed byteachers at elementary schools that serve high proportions of low-achieving minority students?
A total of 19,452 teachers earned master plan points for attending CRP workshops during the periodranging from January, 1998 through August, 2001. Of these, 17,239 were teachers assigned to regularschool sites. This group comprised about 86% of the district’s school-based professional staff. Over 60%of the teachers at each school level received intensive training (i.e., 13 or more master plan points).Furthermore, approximately 0.9% (197) of the district’s instructional staff were enrolled in graduateprograms in reading instruction. Finally, the analysis of the teacher training from the perspective of theschools’ levels of need revealed a promising outcome. Among elementary schools implementing the CRP,78% of the teachers at schools with a low level of need received training. This compared to 84% at schoolswith a moderate level of need, and 90% at schools with a high level of need. Thus, the emphasis in thetraining is appropriately distributed across schools with different levels of need, with the greatest proportionat the schools with the highest level of need. This outcome contrasts with that of year 1, when the CRP wasfaulted for its “somewhat misplaced” emphasis with regard to training. At that time, the schools with a highlevel of need had the lowest percentage of trained teachers. The reversal of this situation in the subsequentyears reflects favorably on the efforts of the program staff.
2. How appropriate is the training? To what extent do the teachers utilize their training in the classrooms?
In year 3, substantial numbers of the teachers reported utilizing various instructional activities and strategieswhich are associated with the CRP training. Elementary teachers tended to devote the most time to twoinstructional activities: interactive reading instruction at grade level, and writing. With regard to instructionalstrategies, the majority of the elementary teachers used several each week. The strategy that they perceivedto be most effective in improving the students’ reading proficiency was FCAT exercises. The secondaryteachers, on the other hand, tended to devote the most time to four instructional activities: interactivereading instruction focused on course content, structured reading in pairs or groups, writing, andindependent reading. The majority of the secondary teachers made weekly use of FCAT exercises andreading aloud. Like the elementary teachers, they perceived FCAT exercises to be the most effective inimproving the students’ reading proficiency.
3. To what extent do students read independently?
The CRP stipulates that students in grades 1 through 12 read at least five books every nine-week gradingperiod. According to the teachers’ survey responses, about 73% of the elementary students and 34% ofthe secondary students did so in the grading period prior to the survey. Among the elementary teachers,80% consulted their own records regarding the number of books that the students had read. In contrast,

Third Interim Report: 2000-01 School Year
42 Evaluation of the Comprehensive Reading Plan
only 29% of the secondary teachers consulted such records. These results are nearly identical to those ofyears 1 and 2. Thus, it is once again concluded that the elementary schools appear to be doing a better jobthan the secondary schools in both implementing and monitoring this objective.
4. What is the distribution of minority and non-minority students who are not reading at grade levelproficiency? Are minority and non-minority students assigned proportionately to each of the remedialactivities?
The data revealed that in year 3 about 46% of the students in grades 2 through 11 scored below thestandard for their grade on the September administration of the Scholastic Reading Inventory (SRI), andabout 51% of the students in grades 1 through 11 scored likewise on the May administration. Theoverwhelming number of these students are either Hispanic or African-American, since these tworacial/ethnic groups comprise respectively 56% and 31% of the district’s total student enrollment. Withregard to planning for remedial activities, about 14.9% of the students scoring below the standard inSeptember participated in a Student Performance Plan Conference during year 3. The Hispanic studentsunderstandably had the highest number of conferences, since they represent the largest ethnic group.However, African-American students had the highest proportion of conferences (i.e., the percentage ofstudents in the group with a conference). Summer school represents perhaps the most common form ofremedial activity. Of the grade 1-8 students scoring below the standard in May of year 3, 43.3%subsequently completed summer school. This compares with 55.0% of the grade 9-11 students. Onceagain, the Hispanic students had the highest numerical enrollment, but the African-American students hadthe highest proportional enrollment. Consequently, the overwhelming number of the students who wereidentified as reading below the standard are minority students. However, they are also the ones most likelyto be assigned to remedial activities, which mirrors the results of both years 1 and 2. Nevertheless, theanalysis of the remediation activities by the school’s level of need yielded a disturbing new development.The data revealed that in year 3 both the number of Student Performance Plan Conferences and the rateof summer school completion at elementary schools with a high level of need were exceeded by elementaryschools with a moderate level of need. This is cause for concern, since it raises questions about the properdeployment of resources. More importantly, given that minority students are generally concentrated inschools with a high level of need, it raises questions about the proportional distribution of remediationservices to these students.
5. How does the CRP compare to other programs in preparing students to read at grade level by grade2?
Not all of the elementary schools in the district have implemented the CRP. A few schools have electedto implement the Success for All/Roots and Wings Program (SFA) or the SRA Reading Mastery DirectInstruction Program (SRA). During years 1 and 2, the Office of Evaluation and Research conducted aseparate evaluation to compare the reading performance of CRP students with that of SFA and SRAstudents (Urdegar 2000, 2001). In year 3, a similar comparison of the reading performance of CRP andSRA students was made. The results of each of the comparisons revealed little or no differences. Therespective groups of students have performed comparably at most of the grade levels. Comparative dataon the efficacy of these reading programs were also obtained from the longitudinal monitoring of the twocohorts of elementary students initially identified as needing remediation. The analysis revealed that, givencomparable levels of need across schools, the CRP and SRA students tested higher in reading performancethan SFA students. Consequently, the CRP continues to exhibit results that are either comparable to orbetter than those of well-regarded, established reading programs.

Third Interim Report: 2000-01 School Year
Evaluation of the Comprehensive Reading Plan 43
6. Does the instruction received through remedial activities result in an improvement in the readingachievement of students in grades 3 through 12?
Data on the impact of the plan during the three years of the evaluation were derived from monitoring thereading progress of three cohorts consisting respectively of selected students in grades 2, 3, and 6. At theend of year 3, about 2½ years had elapsed since these students were identified as needing remediation. Theimpact of their remediation during this time is reflected in the percentages of these students whosubsequently scored above the 25th percentile on the Reading Comprehension subtest of the StanfordAchievement Test (SAT). The percentages for each cohort were respectively 62.8%, 36.4%, and 39.6%.While these individual percentages may not seem impressive, the longitudinal results are. The percentageof students scoring above the 25th percentile increased considerably from year 1 to year 3 in every cohort.Consequently, the preponderance of the data seems to indicate that the remedial activities have resultedin a general improvement in the students’ reading achievement.
In summary, to date the evaluation of the CRP has yielded data on both the implementation and impact ofthe plan. Regarding its implementation, the analysis of the data revealed that considerable progress hadbeen made by the conclusion of year 3 in providing training for the teachers. Approximately 86% of thedistrict’s school-based staff had earned master plan points for attending workshops associated with theplan. Additionally, the analysis identified comparatively more trained teachers in schools with more studentsin need of remediation. This is a reversal of the situation in year 1, and it reflects favorably on the effortsof the program staff. The training appears to be making an impact on the teachers’ classroom practices.Substantial numbers of teachers reported utilizing various instructional activities and strategies which areassociated with the plan. The results also revealed that in general appropriate students are being targetedfor remediation, but there is disturbing evidence that the quantity of remediation activities at elementaryschools with a high level of need is below expectations. Nevertheless, various remediation activities arebeing utilized; and these activities seem to have resulted in improvements in the students’ readingperformance. Additionally, controlled comparisons of the efficacy of the CRP have yielded encouragingresults. The CRP seems to be attaining results that are either comparable to or better than those of well-regarded, established reading programs. Based on these findings, the following recommendations areproposed:
1. All teachers who provide time in their classes for students to read independently should maintain orhave access to records documenting the students’ accomplishments. At the secondary level, wheresuch monitoring is not common, a systematic plan should be implemented to ensure accountability forthis activity.
2. All schools need to bolster their efforts to ensure that students who score below the standard areadequately served by Student Performance Plan Conferences and subsequent remediation activities.The latter is particularly important for elementary schools with a high level of need.
3. While there has been improvement each year, still less than half of the students in grades 1-8 who areidentified as reading below standard subsequently complete summer school. The district shouldstrengthen its efforts to enforce the mandated completion of summer school by these students, ordevelop alternative means for ensuring that they get additional support beyond the regular school year.

Third Interim Report: 2000-01 School Year
44 Evaluation of the Comprehensive Reading Plan

Evaluation of the Comprehensive Reading Plan 45
References
Anderson, R. C., Hiebert, E. H., Scott, J. A., and Wilkinson, I. A. G. (1985). Becoming a nation ofreaders: The report of the Commission on Reading. Champaign, IL: Center for the Study of Reading.
Chall, J. S., Jacobs, V., & Baldwin, L. (1990). The reading crisis: Why poor children fall behind.Cambridge, MA: Harvard University Press.
Clay, M. M. (1993). Reading Recovery: A guidebook for teachers in training. Portsmouth, NH:Heinemann.
Commissioner’s Memorandum to District Superintendents: 1997-98 Educational Equity Act Update(December 19, 1997). Tallahassee, FL: Florida Department of Education.
Danielson, K. E. (1997). Improving parental involvement in children’s literacy, Reading Horizons,37(4), 274-280.
Fitton, L. & Gredler, G. (1996). Parental involvement in reading remediation with young children,Psychology in the Schools, 33(4), 325-332.
Miami-Dade County Public Schools. (January, 1998). Comprehensive reading plan. Miami, FL:Author.
Miami-Dade County Public Schools. (October, 2000). Pupil progression plan. Miami, FL: Author.
Miami-Dade/Monroe Teacher Education Center. (1998). Summer Intensive Seminars. MiamiSprings, FL: Author.
National Reading Panel. (2000). Teaching children to read: An evidence-based assessment of thescientific research literature on reading and its implications for reading instruction, NIH Pub. No.00-4754. U.S. Department of Health and Human Services, Public Health Service, National Institutes ofHealth, National Institute of Child Health and Human Development.
Nichols, W. D., Rupley, W. H., & Weaver, L. R. (1996). Embracing cultural and linguisticdiversity: Culturally responsive reading instruction. Paper presented at the Annual Meeting of theSociety for the Scientific Study of Reading, New York.
Parker, D. (Summer 1995). Politics and pedagogy. The bookends of California’s literacy crisis. Ajournal of the California Literature Project.
Pearson, P. D. (1992). Reading. In Alkin, M. C. (Ed.), Encyclopedia of Educational Research, 6thEdition (pp. 1075-1085). New York: Macmillan Publishing Company.
Radencich, M. C., McKay, L. J., & Paratore, J. R. (1995). Keeping flexible groups flexible: Groupingoptions. In Radencich, M.C., & McKay, L. J. (Ed.), Flexible grouping for literacy in the elementarygrades (pp. 25-42). Boston: Allyn and Bacon.
Rosenshine, B. and Meister, C. (Winter 1994). Reciprocal teaching: A review of the research, Reviewof Educational Research, 64(4), 479-530.

Third Interim Report: 2000-01 School Year
46 Evaluation of the Comprehensive Reading Plan
Shannahan, T., & Barr, R. (1995). Reading Recovery: An independent evaluation of the effects of anearly instructional intervention for at-risk learners. Reading Research Quarterly, 30, 958-996.
Slavin, R. E., Madden, N.A., Karweit, N. L., Dolan, L. J., & Wasik, B.A. (1992). Success for all:A relentless approach to prevention and early intervention in elementary schools. Arlington, Virginia:Educational Research Service.
Slavin, R.E., Madden, N. A., Dolan, L. J., Wasik, B. A., Ross, S., Smith, L. & Dianda, M. (1996).Success for all: A summary of research. Journal of Education for Students Placed at Risk, 1, 41-76.
Snow, C. E., Burns, M. S., & Griffin, P., Eds. (1998). Preventing reading difficulties in youngchildren. Washington, DC: National Academy Press.
Urdegar, S. M. (January 2000). Evaluation of the Success For All Program, 1998-99. Miami, FL:Miami-Dade County Public Schools, Office of Evaluation and Research.
Urdegar, S. M. (March 2001). Evaluation of the Success For All Program, 1999-00. Miami,FL: Miami-Dade County Public Schools, Office of Evaluation and Research.
Wasik, B. A. (April 1998). Using volunteers as reading tutors: Guidelines for successful practices. TheReading Teacher, 51(7), 562-570.
West, K. R. (1998). Noticing and responding to learners: Literacy evaluation and instruction in theprimary grades. The Reading Teacher, 51, 550-561.
Whitehurst, G. J. & Lonigan, C. J. (1998). Child development and emergent literacy, ChildDevelopment, 69, 848-872.

Evaluation of the Comprehensive Reading Plan 47
Appendix A
Comprehensive Reading Plan workshops offered by MDCPS


Third Interim Report: 2000-01 School Year
Evaluation of the Comprehensive Reading Plan 49
Comprehensive Reading Plan Workshop Components Offered fromJanuary, 1998 through August 2001
Title Number
Workshop enrollment through
8/31/99 8/31/00 8/31/01
Language Arts/Reading Collegial Support 5-07-31-2-00 269
Professional Workshop-Basic Skills, Reading(including Accelerated Reader) 5-14-02-2-00 2185a 3949 4672
Professional Conference (District/State/National) BasicSkills, Reading 5-14-03-5-00 124 124
Professional Seminar (District/State/National) BasicSkills, Reading 5-14-04-5-00 8 8
Summer Intensives 5-14-05-2-00 1024 1462 2014
America Reads 5-14-09-2-00 322 322
Teachers as Readers 5-14-14-2-00 80 96 104
Region: Reading Leaders as Trainers 5-14-15-2-00 97 246 430
School Site: Reading Leaders Training (CRP) 5-14-16-2-00 860 1028 1089
Best Practices: Reading Pt. I (Elementary) 5-14-17-2-00 159 579 1273
Best Practices: Reading Pt. II (Elementary) 5-14-18-2-00 0 47 82
Best Practices: Reading Pt. III (Secondary) 5-14-19-2-00 49 289 289
Comprehensive Reading Plan (up to 18 MPPs) 5-14-20-2-00 133 610 1670
Comprehensive Reading Plan (19-60 MPPs) 5-14-20-5-00 0 818
FL Writes! 5-15-01-2-00 380 794 893
FL Writes! 5-15-02-2-00 634 1133 1152
Writing Institute 5-15-05-5-00 245 363 471
ESOL Professional Workshop: Reading 5-17-02-2-00 334 807 1282
Reciprocal Teaching 5-18-01-2-00 48 259 269
CRISS (old number) 5-18-02-2-00 1990 3916 4478
CRISS (new number) 5-18-05-2-00 508 2288
Assisting School Improvement Through InstructionPart I (school site - new number) 5-23-04-2-00 3781
Assisting School Improvement Through InstructionPart II (school site) 5-23-05-2-00 792
Assisting School Improvement Through InstructionPart I (school site - old number) 5-23-06-2-00 7239 8145 8145
Assisting School Improvement Through InstructionPart III (school site - new number) 5-23-06-5-00 2482 3723
Assisting School Improvement Through InstructionPart II (early release days) 5-23-07-2-00 3628 7384
FCAT and Alternative Assessment 5-85-20-2-00 3231
Project Right Beginnings (Kindergarten) 5-97-04-5-03 2483
Total 15457 30795 90669

Third Interim Report: 2000-01 School Year
50 Evaluation of the Comprehensive Reading Plan
aOnly Master Plan Points for 1998 were reported for this component in 1999, because it was used for most of the ComprehensiveReading Plan workshops until the other components had been developed. This component reverted to Professional WorkshopBasic Skills, Reading in 1999 and is used for miscellaneous programs, such as Accelerated Reader. It was decided to include theseprograms in the analysis for Years 2 and 3.

Evaluation of the Comprehensive Reading Plan 51
Appendix B
Elementary teachers receiving training in the methodology ofteaching reading


Third Interim Report: 2000-01 School Year
Evaluation of the Comprehensive Reading Plan 53
Percentage of Teachers Earning Master Plan Points from ComprehensiveReading Plan Workshops: Success for All/Roots and Wings Elementary Schools,by Level of Need
Points
Need Region Name 1 to 6 7 to 12 13 to 24 25 to 413 TotalHigh 1 NORTH COUNTY 9 15 13 58 95High 2 BISCAYNE GARDENS 10 12 32 38 91
High 2 OAK GROVE 16 13 27 46 103High 3 ARCOLA LAKE 7 6 13 40 66High 3 BROADMOOR 12 17 32 61 122
High 3 EARLINGTON HEIGHTS 12 5 12 70 98High 3 LILLIE C. EVANS 5 22 11 84 122High 3 BENJAMIN FRANKLIN 11 9 19 35 74High 3 MARTIN LUTHER KING 7 32 29 64 132
High 3 HENRY E. S. REEVES 16 8 67 33 124High 3 POINCIANA PARK 16 9 12 36 72High 3 WEST LITTLE RIVER 17 11 20 49 97High 4 PAUL LAWRENCE DUNBAR 6 16 20 33 76
High 4 EDISON PARK 4 33 18 49 104High 4 THENA CROWDER 12 6 24 53 94High 4 LITTLE RIVER 7 29 11 55 102
High 4 TOUSSAINT L'OUVERTURE 0 8 31 47 86High 4 SANTA CLARA 16 13 16 20 65High 4 SHADOWLAWN 22 5 22 29 78High 6 LEISURE CITY 24 13 16 39 92
High 6 LAURA C. SAUNDERS 6 11 14 46 77Moderate 1 BUNCHE PARK 5 7 10 34 56Moderate 1 LAKE STEVENS 6 12 28 53 100
Moderate 3 FLORAL HEIGHTS 17 6 8 72 103Moderate 3 LAKEVIEW 0 5 27 56 88Moderate 3 LIBERTY CITY 23 10 10 42 84Moderate 3 MELROSE 14 32 22 76 143
Moderate 3 OLINDA 29 6 15 68 118Moderate 3 WESTVIEW 6 3 29 82 121Moderate 4 ALLAPATTAH 11 14 18 30 73
Moderate 4 ENEIDA MASSAS HARTNER 22 7 12 31 73Moderate 4 MORNINGSIDE 15 17 17 43 91Moderate 4 KELSEY L. PHARR 6 3 17 50 75Moderate 4 RIVERSIDE 5 15 21 29 71
Moderate 5 BECKFORD, E.F./RICHMOND 26 8 23 69 126Moderate 6 WILLIAM A. CHAPMAN 14 10 14 34 73Moderate 6 FLORIDA CITY 2 2 27 46 76Moderate 6 WEST HOMESTEAD 4 7 14 17 43

Third Interim Report: 2000-01 School Year
54 Evaluation of the Comprehensive Reading Plan
Percentage of Teachers Earning Master Plan Points from Comprehensive ReadingPlan Workshops: SRA Reading Mastery Direct Instruction Elementary Schools, byLevel of Need
Points
Need Region School 2-6 7-12 13-24 25-413 Total
High 3 SOUTH HIALEAH 9 7 27 72 115High 4 CITRUS GROVE 1 8 10 88 107
Moderate 1 NORTH GLADE 20 7 32 63 122
Moderate 2 FIENBERG/FISHER 29 19 24 41 113Moderate 2 GREYNOLDS PARK 5 17 31 70 123Moderate 2 NORLAND 6 16 20 69 110Moderate 2 PARKVIEW 22 11 22 53 108
Moderate 2 PARKWAY 18 12 16 56 102Moderate 2 SCOTT LAKE 15 13 29 46 102Moderate 4 AUBURNDALE 4 13 26 39 82
Low 1 TWIN LAKES 23 9 36 64 132Low 2 SOUTH POINTE 21 16 21 47 105

Third Interim Report: 2000-01 School Year
Evaluation of the Comprehensive Reading Plan 55
Percentage of Teachers Earning Master Plan Points from Comprehensive readingPlan workshops: Elementary schools Implementing the Plan, by Level of Need
Points
Need Region School 2-6 7-12 13-24 25-413 Total
High 1 BRENTWOOD 9 23 18 34 84High 1 JAMES H. BRIGHT 0 4 17 67 88High 1 CAROL CITY 8 5 23 68 105
High 1 HIALEAH GARDENS 8 6 28 33 76High 1 JOELLA C. GOOD 2 5 20 56 83High 1 MEADOWLANE 2 10 31 32 75High 1 OPA-LOCKA 11 7 20 33 72
High 1 PALM LAKES 6 14 20 38 77High 1 PALM SPRINGS 5 11 29 67 113High 1 RAINBOW PARK 0 9 14 52 75
High 1 BEN SHEPPARD 6 20 21 38 85High 1 ERNEST R GRAHAM 2 13 22 48 86High 1 MAE M. WALTERS 5 18 16 41 80High 2 W. J. BRYAN 13 8 23 41 86
High 2 GRATIGNY 8 14 12 29 63High 2 MYRTLE GROVE 10 10 15 43 78High 2 NATURAL BRIDGE 8 7 11 58 84
High 2 NORTH MIAMI 13 9 33 55 109High 3 VAN E. BLANTON 7 9 16 36 68High 3 CHARLES R. DREW 4 19 15 33 71High 3 HIALEAH 6 13 22 67 108
High 3 HOLMES 0 27 9 84 120High 3 MIAMI PARK 17 14 20 45 97High 3 STIRRUP, E. W. F. 29 19 26 38 112
High 3 SWEETWATER 0 16 12 82 110High 4 MAYA ANGELOU 5 19 10 59 93High 4 FREDERICK DOUGLASS 11 21 20 70 121High 4 KENSINGTON PARK 5 35 25 54 118
High 4 MIAMI SHORES 4 1 1 75 83High 4 PHYLLIS RUTH MILLER 2 28 21 59 109High 4 SHENANDOAH 4 5 20 64 93High 4 PHILLIS WHEATLEY 14 16 19 37 86
High 5 MARJORY STONEMAN DOUGLAS 1 0 7 84 93High 6 BEL-AIRE 5 35 21 35 95High 6 CAMPBELL DRIVE 1 5 22 69 97
High 6 CARIBBEAN 5 12 16 58 91High 6 MIAMI HEIGHTS 4 12 8 31 55High 6 NARANJA 8 8 13 60 90High 6 PINE VILLA 6 6 14 71 98
High 6 DR. EDWARD L. WHIGHAM 2 8 12 45 67Moderate 1 JOHN G. DUPUIS 9 7 21 36 72Moderate 1 FLAMINGO 6 0 17 74 96

Third Interim Report: 2000-01 School Year
Need Region School 2-6 7-12 13-24 25-413 Total
56 Evaluation of the Comprehensive Reading Plan
Moderate 1 GOLDEN GLADES 13 16 16 53 97
Moderate 1 MIAMI GARDENS 10 3 17 66 97Moderate 1 MIAMI LAKES 0 7 6 89 102Moderate 1 M. A. MILAM 4 9 12 50 75Moderate 1 BARBARA J. HAWKINS/NO. CAROL CITY 9 9 11 63 91
Moderate 1 NORTH HIALEAH 11 11 11 37 70Moderate 1 NORTH TWIN LAKES 8 5 20 53 86Moderate 1 PALM SPRINGS NORTH 10 4 21 45 80
Moderate 1 SKYWAY 2 2 5 91 100Moderate 1 NATHAN B. YOUNG 6 15 24 45 91Moderate 1 CHARLES DAVID WYCHE JR. 16 0 16 61 92Moderate 2 CRESTVIEW 8 11 18 39 76
Moderate 2 FULFORD 0 21 35 77 133Moderate 2 HIBISCUS 5 5 5 73 88Moderate 2 MADIE IVES 11 20 16 30 77
Moderate 2 SABAL PALM 9 4 2 61 76Moderate 2 TREASURE ISLAND 17 11 20 23 72Moderate 3 CHARLES R. HADLEY 10 6 17 51 84Moderate 3 LORAH PARK 5 5 11 97 118
Moderate 3 ORCHARD VILLA 14 21 16 37 88Moderate 4 COMSTOCK 8 8 15 53 85Moderate 4 CORAL WAY 10 10 18 56 95
Moderate 4 HENRY M. FLAGLER 10 8 19 62 98Moderate 4 KINLOCH PARK 7 10 17 53 87Moderate 4 SILVER BLUFF 7 11 25 33 75Moderate 5 BENT TREE 2 2 31 44 80
Moderate 5 BOWMAN FOSTER ASHE 7 11 15 24 57Moderate 5 CORAL TERRACE 7 12 27 29 76Moderate 5 ZORA NEALE HURSTON 2 12 12 58 84Moderate 5 ROBERT RUSSA MOTON 10 27 14 55 106
Moderate 5 ROYAL GREEN 2 10 16 69 96Moderate 6 JACK D. GORDON COMMUNITY 4 13 10 24 51Moderate 6 IRVING AND BEATRICE PESKOE 2 4 8 57 71
Moderate 6 PINE LAKE 8 17 23 38 85Moderate 6 REDONDO 4 4 4 74 87Moderate 6 SOUTH MIAMI HEIGHTS 4 5 33 49 91
Low 1 AMELIA EARHART 9 16 16 26 66
Low 1 NORTH DADE CML 3 6 21 41 71Low 2 RUTH K. BROAD/BAY HARBOR 12 8 19 34 73Low 2 BISCAYNE 11 11 11 32 65
Low 2 VIRGINIA A. BOONE/HIGHLAND OAKS 5 0 2 84 90Low 2 NORTH BEACH 6 7 12 27 52Low 2 NORWOOD 4 8 12 30 54Low 2 OJUS 5 2 16 81 105
Low 3 BANYAN 18 18 13 40 88

Third Interim Report: 2000-01 School Year
Need Region School 2-6 7-12 13-24 25-413 Total
Evaluation of the Comprehensive Reading Plan 57
Low 3 CORAL PARK 8 16 24 43 90
Low 3 EVERGLADES 9 4 14 44 71Low 3 MIAMI SPRINGS 10 29 19 36 95Low 3 ROCKWAY 13 10 8 38 68Low 3 SEMINOLE 9 25 7 77 118
Low 3 JOHN I. SMITH 4 4 22 49 79Low 3 SPRINGVIEW 20 25 25 40 110Low 4 GEORGE WASHINGTON CARVER 6 15 15 64 100
Low 4 COCONUT GROVE 7 15 22 26 70Low 4 CORAL GABLES 7 16 11 42 76Low 4 FAIRLAWN 2 6 19 73 100Low 4 KEY BISCAYNE 6 8 21 47 82
Low 4 SOUTHSIDE 3 3 33 87 127Low 4 SUNSET 8 10 13 19 49Low 4 FRANCES S. TUCKER 11 16 30 43 100
Low 4 WEST LABORATORY 4 11 14 57 86Low 5 ETHEL KOGER BECKHAM 8 15 13 52 88Low 5 BLUE LAKES 6 9 2 50 67Low 5 COLONIAL DRIVE 8 8 22 46 84
Low 5 CORAL REEF 2 7 7 69 84Low 5 CYPRESS 0 9 21 50 79Low 5 DEVON AIRE 0 19 15 74 109
Low 5 EMERSON 0 0 33 58 92Low 5 DAVID FAIRCHILD 6 6 12 62 85Low 5 DANTE B. FASCELL 3 8 11 46 69Low 5 FLAGAMI 4 24 13 40 82
Low 5 GLORIA FLOYD 12 8 10 59 88Low 5 GREENGLADE 0 20 31 43 94Low 5 JOE HALL 4 15 15 46 79Low 5 HOWARD DRIVE 9 19 19 34 81
Low 5 KENDALE 10 8 15 55 88Low 5 KENWOOD 4 9 11 49 73Low 5 LEEWOOD 2 9 14 32 57
Low 5 WILLIAM LEHMAN 0 6 17 57 79Low 5 LUDLAM 3 8 18 72 100Low 5 FRANK CRAWFORD MARTIN 17 17 20 46 100Low 5 WESLEY MATTHEWS 6 13 18 46 84
Low 5 OLYMPIA HEIGHTS 2 2 18 57 80Low 5 PALMETTO 2 6 28 57 92Low 5 PERRINE 10 5 22 46 83
Low 5 PINECREST 2 15 11 28 57Low 5 JANE S. ROBERTS 6 10 26 34 76Low 5 ROYAL PALM 3 18 21 33 74Low 5 SNAPPER CREEK 5 14 8 46 73
Low 5 SOUTH MIAMI 6 11 11 46 74

Third Interim Report: 2000-01 School Year
Need Region School 2-6 7-12 13-24 25-413 Total
58 Evaluation of the Comprehensive Reading Plan
Low 5 SUNSET PARK 5 5 21 55 86Low 5 SYLVANIA HEIGHTS 10 20 22 10 61Low 5 TROPICAL 3 41 17 27 88
Low 5 VILLAGE GREEN 10 13 13 38 73Low 5 VINELAND 4 10 21 48 83Low 6 AIR BASE 4 38 15 46 102Low 6 AVOCADO 6 20 12 49 86
Low 6 CALUSA 2 11 13 40 65Low 6 CLAUDE PEPPER 6 6 10 46 67Low 6 CUTLER RIDGE 2 16 16 56 89
Low 6 GULFSTREAM 8 10 6 26 50Low 6 OLIVER HOOVER 3 12 16 25 56Low 6 KENDALE LAKES 12 9 9 28 58Low 6 DR. GILBERT L. PORTER 6 4 14 44 68
Low 6 REDLAND 4 22 10 24 60Low 6 WHISPERING PINES 4 13 2 65 85Low 6 WINSTON PARK 8 12 17 23 60
Not rated 2 LINDA LENTIN 7 6 9 70 93Not rated 5 DR. CARLOS J. FINLAY 9 6 16 72 103Not rated 6 CHRISTINA M. EVE 3 10 7 80 100

Third Interim Report: 2000-01 School Year
Need Region School 2-6 7-12 13-24 25-413 Total
Evaluation of the Comprehensive Reading Plan 59

60 Evaluation of the Comprehensive Reading Plan
Appendix C
Surveys of Reading Practices in Elementary and SecondarySchools

Evaluation of the Comprehensive Reading Plan 69
Appendix D
Scholastic Reading Inventory Standards

Evaluation of the Comprehensive Reading Plan 75
Bureau Response/Plans of Action
To Address Evaluation Findings*
*The following section was developed by program staff. It consists of a bureau/office response and plans of actionwhich are to be (or have already been) initiated by the relevant bureau/office.