Embed Size (px)
Citation preview

1
Evaluation of the Benefits of Automated VehicleLocation Systems for Small and Medium Sized Transit
Agencies
Zhong-Ren PengSimi Octania
Richard J. ZygowiczEdward A. Beimborn
Center For Urban Transportation StudiesUniversity of Wisconsin - MilwaukeePO Box 784 • Milwaukee, WI 53201
Phone (414) 229-4978
http://www.uwm.edu/Dept/cuts
Submitted for the78th Annual Meeting
Transportation Research BoardWashington, D.C.
January 1999
This project was funded by the Wisconsin Department of Transportation.

2
ABSTRACT
The present study specifically addresses the issue of AVL applications in small and mediumsized transit agencies. Small to medium transit agencies were contacted to determine theirperception of their experience with AVL and the benefits it has provided. All contacted transitagencies that deployed AVL system perceive great benefits of AVL, especially in the areas ofimproved efficiency of the system by permitting automated dispatch and scheduling, improvedcustomer services and communication, more efficient use of resources and improved on-timeperformance. In addition a survey was conducted of transit users in a Wisconsin community toassess the level of importance that they place on features of transit service which AVL canaffect. The transit riders consider on-time performance and having real-time information as themost important factor in transit service. A framework for conducting benefits costs analysis isalso provided based on data from the City of Racine, Wisconsin and some assumptions. It wasfound that consistent with cost-benefit analysis of highway investment, AVL benefits largelyoccur to transit users if their waiting time can be reduced by even a small amount. AVL systemsfor small transit agencies also have the potential of sharing the system with other governmentagencies, such as public works departments, law enforcement agencies and other transitagencies.
Key Words: Public Transportation, Automatic Vehicle Location System (AVL), AdvancedPublic Transportation System (APTS), Benefits Costs Analysis, Intelligent TransportationSystems (ITS).
INTRODUCTION
Automated Vehicle Location (AVL) systems have been increasingly utilized in the transitagencies as a means of tracking the locations of transit vehicles in real time (Casey, et al. 1996).They have been promoted as being beneficial to the transit industry by offering transit agenciesmore flexibility in monitoring and managing their vehicles and by reducing customers’ wait timeand increasing riders’ (perceived) security (Gomez, Zhao and Shen, 1998). These systems arebeing implemented primarily in large transit systems where the AVL can provide obviousefficiencies in managing a large fleet of vehicles (Casey, et al. 1996, 1998).
However, there is little or no prior work that specifically dealt with AVL applications in smalland medium sized transit agencies, i.e., transit agencies with fleet size less than 50 vehicles(according to the Federal Transit Administration’s definition, Casey et al, 1996). In large transitagencies owing to larger fleets and employment, the efficiency gain from the use of AVL couldbe large enough to justify the costs to implement the technology. But the median and small sizetransit agencies have much small work force and less fleet vehicles. The question still remains ifthe AVL system can benefit small and medium size transit agencies as well.
This study specifically addresses the issue of AVL applications in small and medium sizedtransit agencies. Small to medium transit agencies were contacted to determine their perceptionof their experience with AVL and the benefits it has provided. In addition a survey wasconducted of transit users in a Wisconsin community to assess the level of importance that theyplace on features of transit service which AVL can affect. This information was used to identify

3
the costs and benefits of AVL to the transit riders and service providers. This information thenprovides a framework for conducting benefits costs analysis. The study concludes withsuggestions for transit agencies that are thinking of adopting AVL systems.
REVIEW OF LITERATURE
Many studies in the literature focus on the development of the AVL technology. For example,Cain and Pekilis (1993) in their article on the development history of AVL give a gooddescription of the shift from Loran C, Signpost and Dead reckoning to the present global positionsystems (GPS) with enhanced real time location tracking and schedule monitoring. Dana (1997),Okunieff (1997) and Khattak et al (1993, 1996, 1998) also provide a good overview of the GPStechnology and the role of AVL for bus transit. These studies on AVL systems highlighted thefact that GPS was the most popular technology available in the market at present. A wide varietyof features can be included in the basic AVL system. Smart cards, electronic billing etc are someof the examples.
On the other hand, very limited literature is available on the cost-benefit analysis for theapplications of AVL systems in transit agencies. One reason for this could be that it is arelatively new technology, and there is little data available for detailed cost-benefit analysis.Gomez, Zhao and Shen (1998) cite the example of six transit agencies in their paper andhighlight the different service configurations, fleet, objectives, and other requirements that woulddetermine the cost of an AVL system. Their survey of transit agencies that are using AVL or inthe implementation stage showed that improving schedule adherence, emergency response andproviding real-time travel information were the three most important factors in opting for AVLtechnology.
Some transit agencies have compiled reports on the evaluation of their advanced publictransportation systems (APTS) technology. Potomac and Rappahannock TransportationCommission (PRTC) presented their findings to the TRB in April 1996. They were successful inimplementing flex-routing and feeder services because of the AVL system. They estimatedannual savings of $869,148 for the Fiscal Year 1997. McKeen (1997) from the University ofNew Mexico cites another success story in his evaluation report on the Urban Rural IntelligentCorridor Application (URICA) prepared for the city of Albuquerque. The main factorinfluencing implementation of AVL technology in this case study was to determine the ability ofan advanced regional management and response center. A study conducted by the University ofCalifornia, Berkeley, assessed an annual saving of $488,000 from the installation of AVL atOutreach, Santa Clara Valley- California in the year 1996-97 (Chira-Chavala, 1997). However,the transit management feels that this is not an if-then relationship because the benefits aredifficult to measure. While they could attribute improved efficiency and increased ridership tothe new system, the task of measuring it in revenue dollars saved was perceived as difficult,because there are other factors such as increasing fleet capacity that are in effect at the sametime.
Outreach has also successfully implemented a Broker Model to serve fifteen cities within thevalley region as a shared AVL system (Chira-Chavala, 1997). This gave rise to the idea of

4
considering a multi-agency model or AVL system shared between other departments in the citybesides the transit agency. Not much information was available on this front and therefore thisquestion was included in the survey of agencies using AVL to know if they were consideringsomething on these lines.
TRANSIT AGENCY PERCEPTION OF AVL BENEFITS
A telephone survey was undertaken of small and medium sized transit agencies who arecurrently using AVL systems to obtain information about the experiences of agencies using AVLsystems. Since the focus of this study is on small and medium sized transit agencies, wesurveyed only those agencies that meet the criteria. The list of agencies contacted is shown inTable 1. The survey was conducted in an interview format and provided qualitative information.Prior to the survey, a list of questions was mailed to these agencies to prepare them for thequestions during the telephone interview. A copy of the question list is given in the appendix 1.Most managers were willing to share their experiences in an informal discussion following thequestions in the survey. A few agencies even followed up the interview by mailing in otherrelevant documents. Highlights of the survey results are summarized below.
TABLE 1: List of Agencies Contacted and Identified Benefits
City/ System Automateddispatch &scheduling
On-timeperformance
Real-timeinformation
Efficientuse ofresources
Customercommunication
Automatedbilling &payroll
Napa, CA - The Vine X X XSan Jose, CA -Outreach
X X X X X X
Santa Monica, CA -SMMBL
X X X X X
Cocoa, FL - SCAT X X XPalatka, FL - ArcTransit
X X X
Winston-Salem, NC -WSTA
X X X X X
Albuquerque, NM -SunVan
X X X X X
Rochester, PA -Beaver CTA
X X X X X
Scranton, PA -COLTS
X X X
Woodbridge, VA -PRTC
X X X X X X
Sheboygan, WI - STS X X X X
PERCEIVED BENEFITS OF THE AVL SYSTEM
The major benefits of AVL systems cited by the managers are related to the serviceproviders. Customer benefits occur through improved services, as the AVL technology is in

5
nearly all cases a hidden system. From the perspective of the management the major benefits ofAVL systems cited were:
• Improved efficiency of the system. The monitoring capability of the AVL system allows theagency to make better decision about scheduling and routing. Routes that show poorpatronage can be rescheduled to demand-response or flex route.
• Improved customer communication. Disputes about non-arrival of vehicles and similarcustomer complaints can be better handled because documented evidence of the real-timelocation of vehicles is available from the AVL system.
• Better flex routing services. The AVL technology allows the flexibility of incorporatingsome demand-responsive services such as route deviation into the regular fixed-route service.This is particularly important for small agencies and para-transit services that operate in alow-density environment. Agencies like Woodbridge, VT (PRTC) that operate in low densityareas could encourage choice riders by offering flex route services and convenient pick-uppoints. It is very useful for paratransit services where the vehicles can be guided to thecorrect address.
• Decreased reservation time. Para-transit services usually required 24 to 48 hour advancereservations prior to the AVL system. With the AVL the reservation time has been broughtdown to one or half an hour in many cases. Occasionally real-time scheduling can also bedone, which is a great time saving to passengers.
• Efficient use of resources. Most small and medium sized agencies are operating on tightbudgets and cannot generate enough revenue to improve the services. They felt that an AVLsystem would help utilize the resources more efficiently by improving the vehicle milestraveled (VMT) by introducing demand responsive services in regular fixed routes (COLTS,1997).
• Monitor and improve on-time performance through fleet tracking. The GPS output helpsidentify trouble areas and can be used to improve on-time performance.
• AVL permits automated dispatch and scheduling (Nelson 1995; Khattak et al 1998;Tellechea and Stone 1998).
• AVL enhances the ability to do automated billing and payroll.
DRAWBACKS OF THE SYSTEM
The system has proved quite beneficial to most agencies although there have been problemsat the implementation stage. System managers reported that integrating the new system with anexisting system was not a very easy task. Integrating the AVL system with automated schedulingand dispatching, the radio system and other software and hardware components have oftenproved to be a big hurdle. One system for example, has been struggling to get their system fullyoperational for the past three years. The major problem zone was the integration of the AVLsystem with a pre-existing analog radio system. Digital radio communications fit better with theAVL system. Then again some agencies had different vendors supplying different parts of theAVL system and often the products did not integrate well. But agencies that acquired entirelynew systems have had little difficulty. This however would increase the price of the entireproject. Some agencies have had their system for 10 years and never had a major breakdown tillrecently. One compared their system to a kitchen appliance in reliance and durability.
FUNDING SOURCES:
6
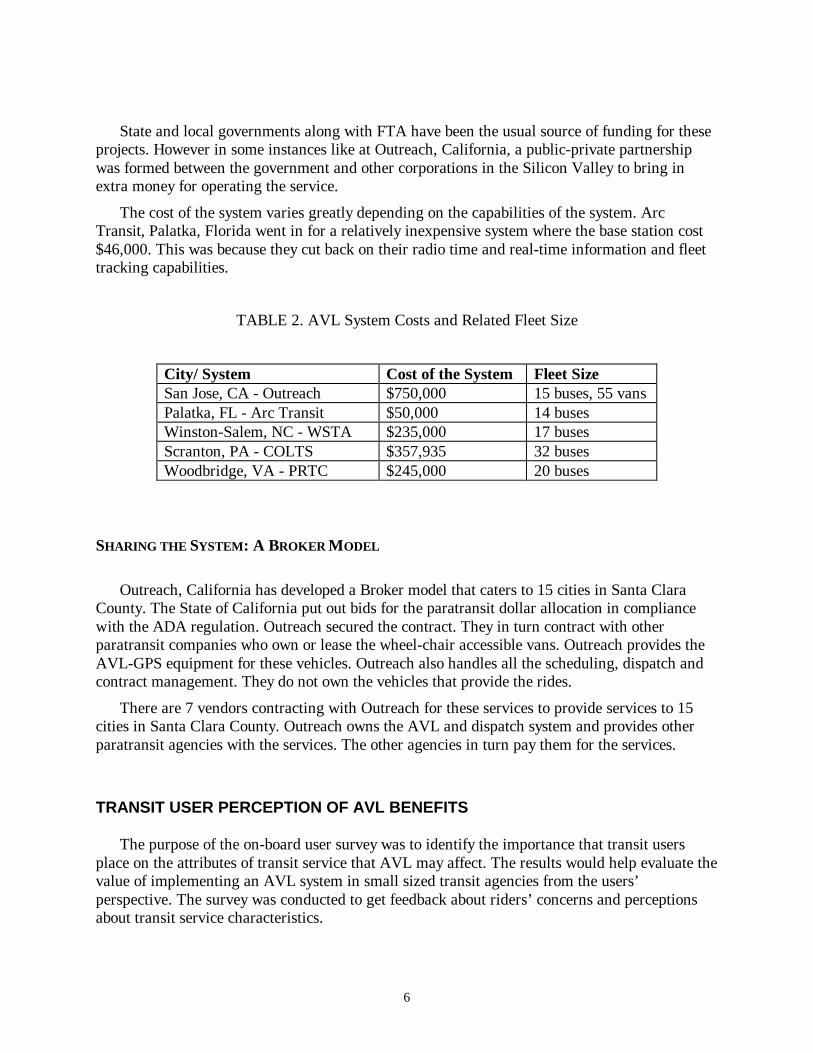
State and local governments along with FTA have been the usual source of funding for theseprojects. However in some instances like at Outreach, California, a public-private partnershipwas formed between the government and other corporations in the Silicon Valley to bring inextra money for operating the service.
The cost of the system varies greatly depending on the capabilities of the system. ArcTransit, Palatka, Florida went in for a relatively inexpensive system where the base station cost$46,000. This was because they cut back on their radio time and real-time information and fleettracking capabilities.
TABLE 2. AVL System Costs and Related Fleet Size
City/ System Cost of the System Fleet SizeSan Jose, CA - Outreach $750,000 15 buses, 55 vansPalatka, FL - Arc Transit $50,000 14 busesWinston-Salem, NC - WSTA $235,000 17 busesScranton, PA - COLTS $357,935 32 busesWoodbridge, VA - PRTC $245,000 20 buses
SHARING THE SYSTEM: A BROKER MODEL
Outreach, California has developed a Broker model that caters to 15 cities in Santa ClaraCounty. The State of California put out bids for the paratransit dollar allocation in compliancewith the ADA regulation. Outreach secured the contract. They in turn contract with otherparatransit companies who own or lease the wheel-chair accessible vans. Outreach provides theAVL-GPS equipment for these vehicles. Outreach also handles all the scheduling, dispatch andcontract management. They do not own the vehicles that provide the rides.
There are 7 vendors contracting with Outreach for these services to provide services to 15cities in Santa Clara County. Outreach owns the AVL and dispatch system and provides otherparatransit agencies with the services. The other agencies in turn pay them for the services.
TRANSIT USER PERCEPTION OF AVL BENEFITS
The purpose of the on-board user survey was to identify the importance that transit usersplace on the attributes of transit service that AVL may affect. The results would help evaluate thevalue of implementing an AVL system in small sized transit agencies from the users’perspective. The survey was conducted to get feedback about riders’ concerns and perceptionsabout transit service characteristics.
7
The City of Manitowoc, Wisconsin was selected as the site of an on-board user surveybecause it is a representative of a small sized agency. The system operates five full-timededicated buses and one van with flex scheduling. The on-board user survey was conducted onFriday 23rd January 1998. The survey began at 6:15am with the first trip of the day and continuedto approximately 2:00 p.m. The questionnaires were handed out on board the bus and collectedback during the ride. The administering team was on board to help the respondents if necessary.The overall response rate was around 80 percent. The survey questionnaire is attached inAppendix 2. The following are the highlights of the on-board survey.
RIDERS PROFILE
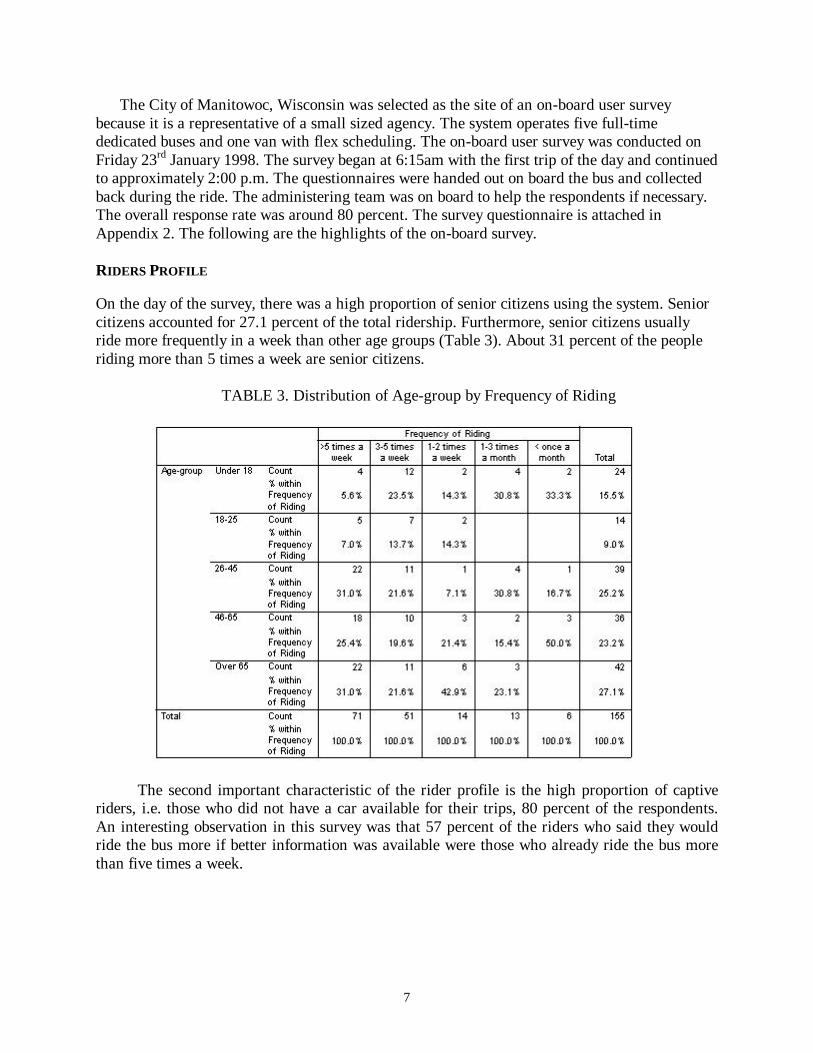
On the day of the survey, there was a high proportion of senior citizens using the system. Seniorcitizens accounted for 27.1 percent of the total ridership. Furthermore, senior citizens usuallyride more frequently in a week than other age groups (Table 3). About 31 percent of the peopleriding more than 5 times a week are senior citizens.
TABLE 3. Distribution of Age-group by Frequency of Riding
The second important characteristic of the rider profile is the high proportion of captiveriders, i.e. those who did not have a car available for their trips, 80 percent of the respondents.An interesting observation in this survey was that 57 percent of the riders who said they wouldride the bus more if better information was available were those who already ride the bus morethan five times a week.

8
TABLE 4. Distribution of Frequency of Riding by Availability of Car
RIDERS’ PERCEPTIONS
The responses to questions regarding the riders’ expectations from an efficient transit servicewere weighted and ranked in order to identify the relative importance of the major factors thataffect riders’ decision to ride a bus. The most important ranking is scored 1 and the leastimportant ranking is scored 5. These scores were then weighted using the frequency ofrespondents who selected the factors. It can be seen that the bus arrivals on-time and real-timeinformation are the two most important factors. However it should be noted that all the factorsrange between 1.48 and 2.82 implying that all were considerably important in the riders’ decisionin using transit.
The on-time performance of the bus service emerged as a very important factor for the transitriders. In fact the occasional riders tended to mark it as very important in their decision to ride abus. Overall 61 percent of the respondents considered the on-time performance as veryimportant.
TABLE 5. Weighted Importance Index
Variable Weighted ImportanceScore
Bus is on-time 1.48Real-time Information 1.55Low Fares 1.62Replacement on breakdown 1.66Emergency Response 1.68Exact Delay Time 1.78Availability of Seat 1.91Latest technology 2.01Display Next Stop 2.39Calling out Stop 2.82

9
Having real-time information on the bus service ranked second on the list. About half, 51percent, of the respondents felt this was very important in their decision to riding a bus.Frequent users are particularly interested in real-time information (Fig. 1).
Frequency of Riding
< once a month
1-3 times a m
onth
1-2 times a w
eek
3-5 times a w
eek
>5 times a w
eek
Cou
nt
80
70
60
50
40
30
20
10
0
Real-Time informatio
Very Unimportant
Somewhat Unimportant
Neutral
Somewhat Important
Very important
Figure 1. Real-time Information
About fifty seven percent of the respondents marked low fares as very important. Once againthe highest proportion was in the frequent riders category. This was a surprising observationas they were mostly monthly pass holders and could get unlimited rides with their pass. Thesenior citizens and students got a further discount rate. The percentage of people consideringfares as very important in their decision to ride a bus was high across all age groups.
TABLE 6. Distribution of Response to Low Fares by Age-group
10
The idea that a bus could be equipped to contact an emergency response service was highlyranked by respondents. It appeared as the third most important factor on the list.
The transit agency and on-board survey indicate that transit agencies are usually positive aboutthe benefits of the use of AVL technology, while transit users are generally in need of betterservices that AVL could provide. The following section summarizes the AVL benefits to transitproviders and riders.
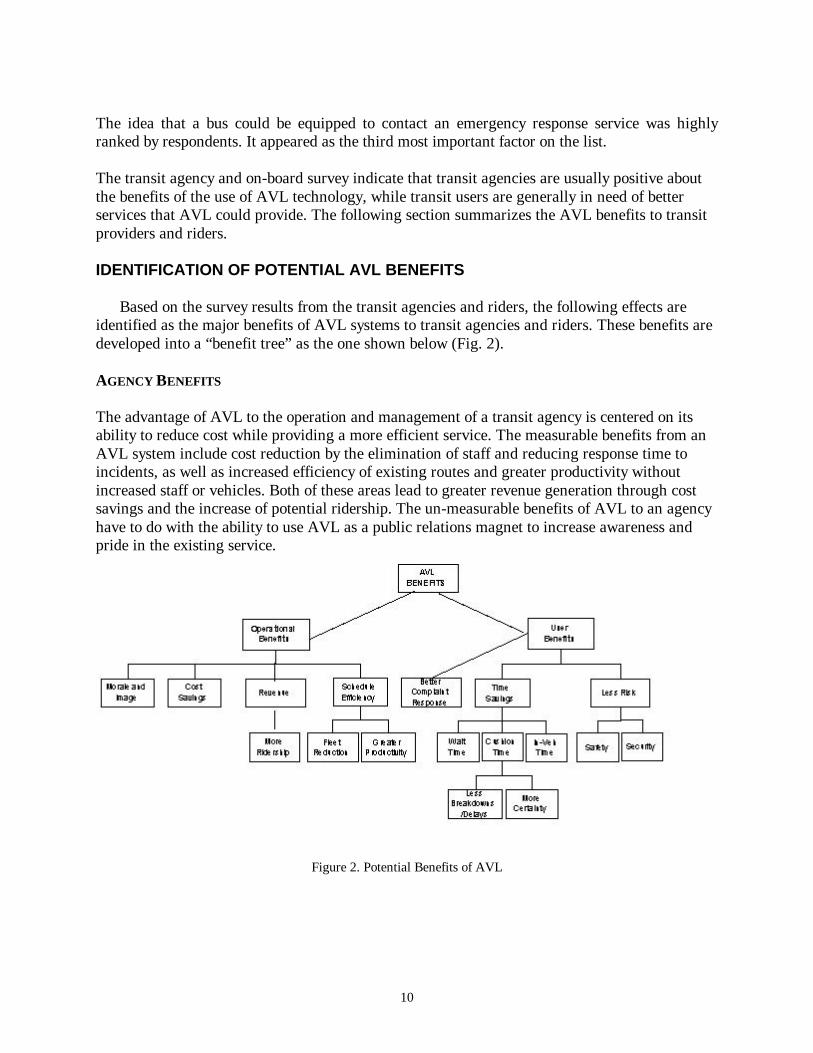
IDENTIFICATION OF POTENTIAL AVL BENEFITS
Based on the survey results from the transit agencies and riders, the following effects areidentified as the major benefits of AVL systems to transit agencies and riders. These benefits aredeveloped into a “benefit tree” as the one shown below (Fig. 2).
AGENCY BENEFITS
The advantage of AVL to the operation and management of a transit agency is centered on itsability to reduce cost while providing a more efficient service. The measurable benefits from anAVL system include cost reduction by the elimination of staff and reducing response time toincidents, as well as increased efficiency of existing routes and greater productivity withoutincreased staff or vehicles. Both of these areas lead to greater revenue generation through costsavings and the increase of potential ridership. The un-measurable benefits of AVL to an agencyhave to do with the ability to use AVL as a public relations magnet to increase awareness andpride in the existing service.
Figure 2. Potential Benefits of AVL

11
Cost Savings
AVL has the potential of reducing the cost of managing a transit system in several ways. Thefirst is the ability to reduce or reassign existing staff. With the use of AVL existing staffpositions can be evaluated and assessed since it is no longer necessary to manually monitor theon-time performance. Another area of cost savings comes from the reduction in response time toincidents which may require police, fire, medical, or insurance personnel. In this case the abilityto determine the exact location of an incident, takes much of the guesswork out of directingresponse personnel. Cost savings can also come in a more efficient use of radio systems. In manycases AVL reduces the need for direct communication between the base and the vehicle. Thus itsave airtime and its related expenses.
Revenue
With better efficiency and reliable service comes additional revenue. AVL allows the agency toprovide a better service. This better service gives it the ability to offer higher standards of serviceand a means to promote more demand for it.
Schedule Efficiency
AVL systems can provide better productivity for an agency through improving servicescheduling. By tracking vehicles as they move an agency can locate ways of modifying existingroutes and service, such as relocating existing routes to help acquire more riders and modifyingtransfer times to better serve transfers.
Better Complaint Response
AVL gives an agency a tool to validate customer complaints and to proceed with a course ofaction. The transit agency can acknowledge or dismiss claims with the documentation from AVLto back them.
Morale and Image
There are many perceptions by the general public that place stigmas on public transportation thatnot only tarnish transit image but can also effect the morale of staff and employees. Many ofthese perceptions are unfounded, yet hard to dismiss and counter. Some of these misguided ideasinclude the believe that waiting and riding on the bus is not safe, too much time is wastedwaiting for the vehicles to arrive, and that it costs too much to ride. AVL can address many ofthese perceptions as well as give the agency a modern appeal, which helps to improve moraleand image of the service offered.
USER BENEFITS
Benefits to transit riders are classified as those that reduce wait time and improve security. AVLcan improve on-time performance and help reduce the uncertainty of waiting at the bus stop.

12
Safety issues are addressed by reducing the amount of time one waits for the vehicle and theassurance that once on board the vehicle is equipped with emergency response system.
Time Savings
AVL has the potential of saving wait time in three respects. With efficient scheduling anddispatching, AVL can help improve on-time performance, which translate into users’ wait timesaving. On the other hand, the real-time information display can reduce the anxiety of waiting forbuses once there is a delay. Riders perceive delay differently if they are informed how long thedelay would be from uninformed blind wait. For example, two field surveys in London found(Nelson 1995) that the average customer perceived waiting time is 10.13 minutes, but theaverage actual waiting time is 6.70 minutes. The difference is more than 3.4 minutes, or morethan 50% longer. The survey further shows that passengers are willing to wait as long as 20minutes if they know bus will come exactly in 20 minutes. Furthermore, the increased reliabilityand confidence of bus arriving on time will reduce the need of users to arrive early to a stop infear of missing a bus.
Less Risk
Less wait time at a bus stop allows for more secure feeling and a more relaxed environment.AVL also can provide greater passenger security on the vehicle because of the emergencyresponse system inside the vehicle.
A FRAMEWORK OF BENEFIT COST ANALYSIS OF AVL SYSTEMS
Assessing the costs and benefits for AVL technology in public transportation is a challengingtask because a large number of benefits associated with the use of AVL are not quantifiable andtherefore difficult to assign a dollar value. Moreover, bringing in new technology such as AVLsystem in an organization often acts as a catalyst that sets in motion a whole process of changes,which is not usually accounted for the final results in the cost-benefit analysis. For example,since Outreach, California decided to expand and brought in an AVL system, the ridership hasincreased significantly. But it would be difficult to attribute the increase in ridership or servicesto the AVL system alone in a cost-benefit analysis. The ridership and service increase could bethe result of the complete revamping of the system, in which the new AVL system played acritical role. This point has been raised by most of the transit agencies and they strongly feel thatthis is not an ‘if-then’ relationship.
Examining the costs and benefits for technology changes is also a comparative study that has tocompare the before and after figures. This essentially implies that in order to evaluate thebenefits of an AVL system, one needs to have conducted a similar study before implementing thesystem, to make a direct comparison. Even there, a direct comparison is difficult because it ishard to measure the organizational impact that AVL has brought in. Furthermore, the before andafter comparison also depends on the operation efficiency of the before situations. A moreefficient before-operation would make the impact of new technology smaller, while a lessefficient before-operation would make the impact of new technology larger.

13
Nevertheless, there is a need for transit agencies and decision-makers to determine if the newtechnology is worth the investment. A parametric benefit-cost analysis was conducted todetermine the relative magnitude of AVL benefits and costs. This process allows some estimatesof the relative magnitudes of benefits and costs and the relative contribution of different factorsto benefits and costs. To do such an analysis, assumptions were made of different factors andthen varied to determine their relative importance. So the purpose of this exercise is not to comeup with an absolute value of benefit/cost ratio, rather it is an evaluation framework. It presentsthe possible break-even points under different cost benefit scenario. The purpose is to serve as arough guidance for policy makers to make decisions on whether AVL should be deployed in thesmall and medium sided transit agencies.
BENEFITS ANALYSIS OF AVL
AVL has benefits to the transit users and transit agencies. From the transit agency survey AVL isperceived to be able to improve on-time performance, which can benefit transit users by reducingthe wait time. The time saving transforms to the benefits of AVL to transit users. AVL can alsobenefit transit agencies by increasing operating efficiencies, which transform to the reduction ofoperating or administrative expense. It can also increase the response time to vehicle incidents,thus reduce incidents costs.
User Benefits
The amount of user benefits depends on the number of trips made, the value of time and theamount of wait-time saving. The more transit trips made, the more wait time saved and the morevaluable that time is, the greater the user benefits. The number of trips, or transit ridership, canbe obtained directly from transit agencies. Ridership data can also be broken down into differenttrip purposes such as home-based work, school, others and non-home based trips. The value oftime and the wait time for every trip purpose can be derived from a mode split model such as thatdeveloped by metropolitan planning organizations for transportation planning purposes. Thecritical question is how much wait time can be saved by using the AVL technology. Thisrequires a detailed study on wait time changes before and after AVL is installed. Since there isno published number on wait time saving, some assumptions have to be made as a starting point.
An example of user benefits is given in Table7, using data from the City of Racine, Wisconsin asa case study. The annual fixed-route ridership in Racine is 1,771,000 trips and paratransitridership is about 19,500. Among those, 29 percent are home-based work trips, 40 percent areschool trips, 26 percent are shopping or other trips, and 4 percent are non-home-based trips.Parameters to convert time savings into dollar benefits were derived from the SoutheasternWisconsin Regional Planning Commission (SEWRPC)’s transportation mode split model(SEWRPC 1995). This model was calibrated by SEWRPC based on home interview surveydata, to simulate how travelers make tradeoffs between travel time, travel cost, waiting time andother factors when they choose a means of travel. Parameters were developed from the calibrateddisutility equations by factoring out the in-vehicle time multiplier and looking at the relativevalues of other coefficients in their model. These led to a value of travel time for work trips of$2.09 per hour, and $0.41, $0.42 and $2.05 for school, shop/other and non-home based trips

14
Figure 3: Distribution of Benefits
User87%
Paratransit4%
Incident5%
Admin4%
respectively. Since people perceive wait time longer than the actual wait time, a wait weight isused to adjust for the perceived wait time. The SEWRPC model implies that people perceivewait time about 2.62 times longer than the actual wait time for work trips. In other words, waittime is about 2.62 times more valuable than the in-vehicle time. Parameters for other trippurposes are 1.00 for school trips, 7.36 for shopping trips and 7.00 for non-home based trips.
The critical question is how much wait time can users save by AVL? Since there is no data on it,a parametric analysis was conducted with an initial savings of 2 minutes per trip are assumed inthis analysis as a starting point. Therefore, for the work trips, there is a wait time saving of(518,901 trips * 2 minutes =) 1,037,802 minutes. Since wait time is 2.62 times more valuablethan the in-vehicle travel time, the dollar value of the wait time saving is (1,037,802 minutes /60* $2.09 * 2.62 =) $94,713. A similar calculation is done for other trip purposes and leads to auser benefit of all trip purposes for fixed route service about $187,000 with an AVL saving of 2minutes per trip, or about $95,000 per minute of time savings.
For the paratransit users, there is no data on its breakdown of trip purposes, so the sameproportion of trip purposes as the fixed route is assumed. Similarly, the weighted value time(using the proportion of trip purposes as the weight) is assumed for the paratransit trips. The totalbenefit of paratransit users in the City of Racine is $9,730 if an AVL time saving of 10 minutesper trip is assumed.
Transit Agency Benefits
Two benefits of AVL on transit agencies can be quantified depending on the availability of data:savings on vehicle incident responses and administrative expenses. The number of vehicleincidents including vehicle breakdowns, police/fire calls and medical calls and associated costscan be obtained from transit agencies. AVL can speed up the response time to those incidents byquickly locating the incidents and by reducing the time to inform the emergency response team.It is difficult to determine the benefitsassociated with quicker response timewithout specific system data. In theabsence of reliable data, this exerciseassumes a ten-percent reduction ofincident costs. As shown in the case ofRacine (Table 7), if one assumes a ten-percent reduction of incident costs anda cost per incident of $1000, thiswould save about $10,800 per year.The amount of savings is dependenton the current incident related expenseand savings from adopting the AVLtechnology.
It is widely anticipated that AVL canincrease the administrative efficiencyof transit agencies. Transit managersand dispatchers are able to be more
15
Figure 4: Distribution of Costs
capital72%
maint28%
responsive to incidents and schedule changes. AVL allows transit managers check schedule androuting adherence more easily. Some work, such as checking on-time performance manually canbe eliminated by AVL. On the other hand, the installation of AVL will add expense toadministrate AVL equipment. There is a lack of detailed data to demonstrate exactly how muchadministrative expense can be changed by AVL. In the example, a ten-percent reduction ofadministrative expense is assumed. In addition, a $50,000 is added as a new administrativeexpense to manage the AVL system. Therefore, there will be about $9500 net administrativeexpense in the case of the City of Racine.
As can be seen in Figure 3, the vast majority (91 percent) of AVL benefits result from timesavings from transit users. Only 9 percent of savings belong to transit agencies in the form of thereduction of vehicle incident costs and administrative expenses. It also indicates that the abilityof AVL to deliver more reliable service to users is key to its success in generating substantialbenefits.
The results are consistent with the benefit cost processes used for highway investment analysis.In such studies, time savings from a highway improvement tend to be the most significantelement of highway benefits.
COST ANALYSIS OF AVL
The costs of AVL include capital costs and ongoing maintenance costs. The system costs includethe expense of installing GPS units on buses, the expense of equipping the dispatch center, andother miscellaneous expenses. The GPS unit costs depends on the number of vehicles; the greaterthe number of vehicles, the less the cost per unit. The GPS cost per bus ranges from $2000 to$5000. This analysis uses $4,000 as the assumed base unit cost. The total GPS and associatedother costs to equip all buses in Racine is $184,000 ($4,000 * 46 vehicles).
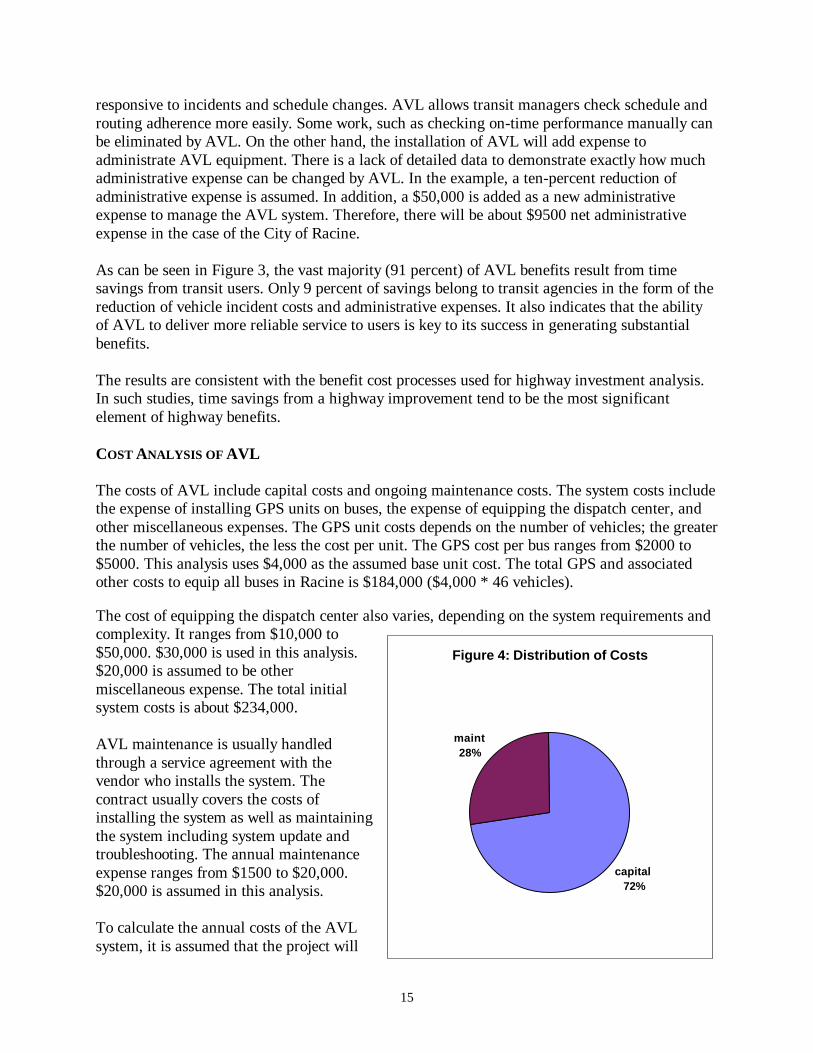
The cost of equipping the dispatch center also varies, depending on the system requirements andcomplexity. It ranges from $10,000 to$50,000. $30,000 is used in this analysis.$20,000 is assumed to be othermiscellaneous expense. The total initialsystem costs is about $234,000.
AVL maintenance is usually handledthrough a service agreement with thevendor who installs the system. Thecontract usually covers the costs ofinstalling the system as well as maintainingthe system including system update andtroubleshooting. The annual maintenanceexpense ranges from $1500 to $20,000.$20,000 is assumed in this analysis.
To calculate the annual costs of the AVLsystem, it is assumed that the project will

16
Figure 5. Benefits vs. user time saved/trip
$0
$100,000
$200,000
$300,000
$400,000
$500,000
$600,000
$700,000
$800,000
1 3 5 7 9 11 13 15
Minutes saved per trip
benefitscost
last for 5 years and that the discount rate is four percent. Therefore, the annual system cost isabout $52,513 and the maintenance cost is $20,000, for a total annual cost of $72,563. The costdistribution chart (Figure 4) shows that the system cost is about two-thirds (72 percent) of thetotal cost and the maintenance cost is about one-third (28 percent).
BENEFIT COST ANALYSIS
In the above analysis there are total annual benefits of $217,077 and annual costs of $72,563.The net benefits are about $144,515, with a benefit/cost ratio of about 3.0 for the City of RacineTransit System.
Sensitivity Analysis
Because of the lack of reliable before and after data, many of the numbers used to calculate costsand benefits are assumed. Therefore, it is important to have a sensitivity analysis to test howsensitive the analysis is to the underlying assumptions. The sensitivity analysis has beenconducted for the following factors: the wait-time savings, discount rate, projected project life,and transit ridership. Sensitivity analysis helps to indicate how important the differentassumptions are and how different assumptions might affect the benefits and costs of the system
As shown in Figure 5, Benefit vs. User Time Saved/Trip, user benefits are very sensitive to thewait-time savings. As the wait-time savings increase, the user benefits increase dramatically. Inthe example given, the break-even point is when the wait-time saving is about 0.45 minute or 27seconds per trip. Given that this is a very small number, it indicates that the potential for AVLwait time savings to exceed its cost is high. It is not difficult to imagine an AVL system toincrease the on-time performance to reduce the wait time by less than a half minute.

17
Figure 7. Benefits. Costs vs Project Life
$0
$50,000
$100,000
$150,000
$200,000
$250,000
1 3 5 7 9 11 13 15
Project Life in Years
benefits
cost
Figure 6. Benefits, Costs vs Discount Rate
$0
$50,000
$100,000
$150,000
$200,000
$250,000
0% 3% 6% 9% 12%
Discount Rate
benefits
cost
As shown in Figure 6, the discount rate has a very small impact on the annual cost estimation.The projected system life, Figure 7, has a larger impact on the annual costs. Systems that last forvery short time periods will have much higher annual costs. In the example shown, if the projectlife is over 1 year, the benefits of AVL exceed the costs.
Figure 8 shows that the increases of transit ridership will increase both benefits and costs, but theincrease of benefits occurs faster than the increase in costs. These calculations were madeassuming that user benefits, incident benefits and fleet size will vary directly with annual trips.With the assumptions made in the example, the break-even point is at about 220,000 trips peryear, or 4200 trips per week. Smaller transit systems should take careful consideration ofpotential thresholds of usage when considering adoption of AVL technology.
Figure 8. Benefits, Costs vs Annual Ridership
$0
$10,000
$20,000
$30,000
$40,000
$50,000
$60,000
100 140 180 220 260 300 340 380
Annual Ridership in 1000s
benefits annual cost
18
SOME CAVEATS
This analysis is based on limited data and many assumptions. It is intended as an analysisframework only. More rigorous cost benefit number needs more detailed and reliable data. Oneshortcoming of the sensitivity analysis is that only one variable can vary at a time. For example,when we analyze the sensitivity of ridership, we assume the wait-time savings are constant. It ismore difficult to vary ridership and time-savings at the same time to see their impacts on benefitsand costs.
Furthermore, many potential benefits have not been taken into account in this analysis because ofthe lack of data or because of the difficulty of quantification. For example, the installation of asilent alarm system can increase the sense of security for both passengers and drivers. Thispsychological effect is difficult to put a dollar value on. The introduction of AVL may provide abasis for other new technologies, which may further help the transit agency realize furtherefficiencies. This effect is also difficult to quantify. Other non-quantifiable benefits includeimproved agency image, employee satisfaction, better handling of customer complaints andreduction in their number.
CONCLUSIONS
Transit users place a high degree of importance on features that minimize waiting uncertaintyand increase their feeling of security. Features that AVL may provide such as: vehicles operatingon schedule, knowing when a bus will arrive if late, knowing another bus can be dispatched ifthere is a breakdown and knowing there is an emergency communications system were ratedhighly by transit users based on the survey done as part of this study.
The implementation of AVL technology involves significant human factors and managementissues that should not be underestimated. AVL provides more control of vehicles and maychange the way in which transit systems acquire and use information. Transit agenciesconsidering the use of AVL need to examine their entire operating procedure to assure that themaximum potential of AVL is utilized.
AVL systems for small transit agencies have the potential of sharing the system with othergovernment agencies. Cooperative arrangements with public works departments, lawenforcement agencies and other transit agencies should be explored before an AVL system isimplemented. AVL systems should be designed to be easily adaptable to other users.
The costs of an AVL system include a fixed cost for dispatch center equipment and a cost pervehicle for on board equipment. In addition there would also be an annual cost for maintenanceand dispatch center operation. The actual cost will depend on the features included, the extent towhich existing radio systems can be used and the availability of existing base maps. The life ofthe project is an important variable in project costs. Discount rate has a small effect on annualcosts.

19
AVL systems potentially can have large benefits, which exceed the costs of the systems. Thesebenefits largely occur to transit users if their vehicle waiting time can be reduced by even a smallamount. Other effects such as increased sense of security and reduced response time for incidentscannot be easily quantified but would add to the benefits of an AVL system. In addition AVLsystems have the potential for better management information which can lead to more productiveservice and better planning for future needs.
The potential benefits for paratransit service are also great. AVL has the potential to increasevehicle productivity by facilitating more trip combinations. In addition, AVL can reduce theadvance time needed for a trip reservation and reduce the uncertainty of vehicle arrival time.
The benefits of AVL systems are chiefly a direct function of annual system ridership while coststend to vary only slightly with ridership. They are also most likely to occur on systems that haveproblems maintaining schedules and service reliability.
AVL systems should be implemented in a way to maximize their impact on passenger waitingtimes. This is an area of high potential benefits. Mechanisms to increase awareness of vehiclearrival times should be actively explored to provide the best use of an AVL system
REFERENCES
Cain, David A and Pekilis, Barry R. 1993. AVLC Technology Today: A Developmental Historyof Automatic Vehicle Location and Control Systems for the Transit Environment. IEEE-IEEVehicle Navigation & Information Systems Conference, Ottawa.
Casey, RF., et al. 1996. Advanced Public Transportation Systems. State of the Art Update ’96.United States Department of Transportation, Washington DC.
Casey, RF., et al. 1998. Advanced Public Transportation Systems. State of the Art Update ’98.United States Department of Transportation, Washington DC.
Chira-Chavala, T, Venter, C and Gosling, G. 1997. Advanced paratransit System: AnApplication of Digital Map, Automated Vehicle Scheduling and location Systems. Institute ofTransportation Studies, University of California at Berkeley.
Dana, P.H. An Overview of the Global Positioning System (GPS).Http://www.utexas.edu/depts/grg/gcraft/notes/gps.
Farwell, Randall G, and Marx, Eric. Planning, Implementation and Evaluation of OmniRideDemand Driven Transit Operations: Feeder and Flex Route Services. TRB, April 1996.
Gomez, A, Zhao, F, and Shen LD. 1998. Benefits of Transit AVL and Transit AVLImplementation in the U.S. Paper presented at the 77th annual meeting of the TransportationResearch Board, Washington, DC.

20
Khattak, A., H. Noeimi, H. Al-Deek, and R. Hall. 1993. Advanced Public TransportationSystems: A Taxonomy and Commercial Availability, Partners in Advanced Transit andHighways (PATH) Research Report UCB-ITS-PRR-93-9, Institute of Transportation Studies,University of California at Berkeley, California.
Khattak, A., H. Noeimi, and H. Al-Deek. 1996. A Taxonomy for Advanced PublicTransportation Systems, Journal of Public Transportation, 1 (1): 39-64.
Khattak, A. and M. Hickman. 1998. Automatic Vehicle Location and Computer Aided DispatchSystems: Commercial Availability and Deployment in Transit Agencies. Paper presented at the77th annual meeting of the Transportation Research Board, Washington, DC.
McKeen, RG. 1997. Urban/Rural Intelligent Corridor Application (URICA) Evaluation Report.ATR Institute, University of New Mexico.
Nelson, John D., 1995. “The Potential for Real-Time Passenger Information as Part of anIntegrated Bus-Control/Information System”, Journal of Advanced Transportation, Vol. 29, No.1, pp. 13-25.
Okunieff, Paula E. TCRP Synthesis 24: AVL Systems for Bus Transit. Transportation ResearchBoard, Washington DC: National Academy Press, 1997.
SEWRPC, SEWRPC Planning Report #41, A Regional Transportation System Plan forSoutheastern Wisconsin: 2010, Chapter VII, p313, Feb, 1995
Tellechea, Suzanne B. and John R. Stone. 1998. AVL Planning for the Winston-Salem MobilityManager. Paper presented at the 77th annual meeting of the Transportation Research Board,Washington, DC.

21
Table 7. Benefits Costs Analysis -- Racine ExampleSystem Information Fixed Paratransit Total
Annual ridership 1,770,993 17,731 1,788,724
Fleet size 38 8 46
SEWRPC mode split #'s AVL effect AVL savings per year
User Benefits Pct Trips Value Time Wait wt wait min/trip min wait min dollars
Work trips 29% 518,901 $2.09 2.62 2.00 1,037,802 2,719,041 $94,713
School Trips 40% 715,481 $0.41 1.00 2.00 1,430,962 1,430,962 $9,778
Shop/other 26% 464,000 $0.42 7.36 2.00 928,000 6,830,082 $47,811
Non-Home based 4% 72,611 $2.05 7.00 2.00 145,221 1,016,550 $34,732
100% 1,770,993 Totals 3,541,986 11,996,636 $187,034
Paratransit Users $0.97 3.39 10 177,310 600,545 $9,730
AVL effect
Vehicle incidents/yr before AVL Cost /incident Annual cost pct reduced
Breakdowns 36 $1,000 $36,000 10% $3,600
Police/fire calls 36 $1,000 $36,000 10% $3,600
Medical calls 36 $1,000 $36,000 10% $3,600
108 $108,000 $10,800
AVL effect
Administrative Expense pct reduced
Fixed route $495,134 10% $49,513
Paratransit $100,000 10% $10,000
AVL admin $0 ($50,000) $9,513
AVL system costs Total benefits $217,077
Capital total
Cost /vehicle $4,000 $184,000 Annual cost
Equipment $30,000 $30,000 capital $52,563
Other $20,000 $20,000 maint $20,000
$234,000 total $72,563
Annual Maintenance $20,000 net $144,515
Project life-yrs 5 Benefit/cost 2.99
Discount rate 4.00% Break even min/trip 0.45
Refs: Bellebus spreadsheet derived from Racine transit data, SEWRPC Planning Assistance Report #79, table 20
Parameters are derived from SEWRPC mode split models
Grey cells are estimates used as input to calculations

22
Appendix 1. Survey of Transit Agencies Using AVL Technology
Technology Information
1. What kind of AVL system are you using?
Name of System Vendor: ____________________________
2. What are the components of your AVL system?
A. Location Technology◊ Signpost◊ Global Positioning Satellites (GPS)◊ Ground Based Radio◊ Dead-reckoning
B. Communication SystemRadio
◊ Analog◊ Digital
Trunked channels? (Yes / No )Cellular
◊ Analog◊ Digital
Other type of system, explain: ________________________________
C. How was your base map information created?◊ Purchased a ready to use map
Vendor: ______________________________________◊ Digitized a customized map specifically for your use
Implementation
3. What were the agency’s initial reasons for seeking to adopt an AVL technology?
4. How did you gather support from the local government officials for the system? What kind ofpromotion strategy did you use?
5. What unexpected problems did you encounter when you implemented the AVL system?
6. Which of these caused major cost problems?
7. Has the system performed as expected?
23
8. Do you feel that your agency had adequate training and background to implement the new system?
9. Did you have any problems with the employees about using a new system / technology?
10. How were the workers trained to use the new technology?
11. Did you need to reallocate staff after implementing the AVL system?
12. What was the cost involved in installing the system?
13. How long did it take to install the system?
Benefits
14. What do you think are the benefits of your AVL system?a. For Management
b. For Employees
c. For Customers
Use of the system
15. What do you think are the drawbacks of your AVL system?
16. How often does the system break down during normal operating hours?
17. Do you have Vendor support for maintenance?
18. What is your annual Vendor cost?
19. How much of the output data do you use? Do you face any difficulty in managing the informationoutput?
Advice for other Agencies
20. What advice would you have for other transit agencies that may be considering the use of AVL?
21. How important do you think an AVL system is to a small transit agency?
22. Do you share the system with any other agencies? If yes, how do you go about cost sharing? Staffing?
23. Do you have any bid documents or any other information that you could share with us?

24
Appendix 2. Manitowoc Transit System-On-board Survey
The purpose of this survey is to assess the impact of using improved technology in transitfacilities to provide better service to the riders. By filling out this form you are givinginformed consent to be in this study. All information will be anonymous.
How often do you ride the bus?r More than 5 times a week. r 3-5 times a week. r 1-2 times
a week r 1-3 times a month. r Less than once a month
What is the purpose of your trip today? r Work r Shopping r School r Medicalr Other
3. How do you get information about the bus service? (check all that apply)________I have a copy of the bus schedule________I call the bus company________From other people________From information displayed at the bus stop_______ Other__________________________Do you use the bus schedule for planning your trip?r Yes r No r Sometimes
How long did you have to wait for the bus today?r Less than 5 min r 5-10 min r 10- 15 min r Morethan15 minIs the schedule information displayed on-board the bus adequate?
r Yes r No
How would better information about when the bus actually arrives at the stop affect your use oftransit? r Ride more r Ride less rRide the same
Please rate how important the following are in your decision to ride the bus.VeryImportant
SomewhatImportant
Neutral SomewhatUnimportant
VeryUnimportant
To have information at the bus stop on when the buswill actually arrive
r r r r r
Bus arrives at the scheduled time r r r r rKnowing how late the bus is in case of a delay r r r r rDisplaying the next stop inside the bus r r r r rHaving the driver call out the stops r r r r rKnowing the bus is equipped with a 911 emergencysystem
r r r r r
Knowing that another bus can be immediatelydispatched if there is a breakdown
r r r r r
Knowing the transit system uses the latest vehiclelocation technology
r r r r r

25
Having a seat available at all times r r r r rLow bus fares r r r r r
9. Did you have a car available that you could have used for the trip you are makingtoday?
r Yes r No
Are you a: r Male r Female
What is your age group:r Under 18 r 18-25
r 26-45 r 46-65 r Over 65
12. Please use the back of this page to let us know if you have any additional suggestions orinformation you think will be helpful in providing better bus service.
The Center for Urban Transportation Studies at UWM will be conducting a small groupdiscussion. You will be paid $20 for participating. If you are interested in taking part in thediscussion please provide the following information:Name:_____________________________________ Phone Number:_____________I would be able to attend on:______Tue. Mar 10, 3:30 - 5:00pm _________Tue. Mar.10, 6:00 - 7:30pm at ManitowocTransit Center.Please return this form to the driver or mail into the following address:Center for Urban Transportation StudiesUniversity of Wisconsin - MilwaukeeMilwaukee, WI 53211-784