Embed Size (px)
Citation preview

Final Report
Evaluation of the Altimeter for Measuring Bridge Deflections
FDOT Contract No. BDK83 TWO #988-05
FSU Project ID 028434
Submitted to:
Florida Department of Transportation
Research Center
605 Suwannee Street, MS 30
Tallahassee, FL 32399-0450
Stephen Eudy
FDOT Structures Research Center
Prepared by:
Sungmoon Jung, Ph.D.
Principal Investigator
Michelle D. Roddenberry, Ph.D., P.E.
Co-Principal Investigator
Austin Stilson
Research Assistant
November 10, 2011

ii
Disclaimer
The opinions, findings, and conclusions expressed in this publication are those of the authors and
not necessarily those of the State of Florida Department of Transportation.
Prepared in cooperation with the State of Florida Department of Transportation.

iii
SI* (Modern Metric) Conversion Factors
Approximate conversions to SI units
SYMBOL WHEN YOU KNOW MULTIPLY BY TO FIND SYMBOL
LENGTH
in inches 25.4 millimeters mm
ft feet 0.305 meters m
yd yards 0.914 meters m
mi miles 1.61 kilometers km
AREA
in2 squareinches 645.2 square millimeters mm
2
ft2 squarefeet 0.093 square meters m
2
yd2 square yard 0.836 square meters m
2
ac acres 0.405 hectares ha
mi2 square miles 2.59 square kilometers km
2
VOLUME
fl oz fluid ounces 29.57 milliliters mL
gal gallons 3.785 liters L
ft3 cubic feet 0.028 cubic meters m
3
yd3 cubic yards 0.765 cubic meters m
3
NOTE: volumes greater than 1000 L shall be shown in m3
MASS
oz ounces 28.35 grams g
lb pounds 0.454 kilograms kg
T short tons (2000 lb) 0.907 Megagrams
(or metric ton)
Mg (or "t")
TEMPERATURE (exact degrees)
oF Fahrenheit 5(F-32)/9 or (F-32)/1.8 Celsius
oC
ILLUMINATION
fc foot-candles 10.76 lux lx
fl foot-Lamberts 3.426 candela/m2 cd/m
2
FORCE and PRESSURE or STRESS
lbf poundforce 4.45 newtons N
lbf/in2 poundforce per square 6.89 kilopascals kPa
*SI is the symbol for the International System of Units. Appropriate rounding should be made to
comply with Section 4 of ASTM E380.

iv
SI* (Modern Metric) Conversion Factors
Approximate conversions from SI units
SYMBOL WHEN YOU KNOW MULTIPLY BY TO FIND SYMBOL
LENGTH
mm millimeters 0.039 inches in
m meters 3.28 feet ft
m meters 1.09 yards yd
km kilometers 0.621 miles mi
AREA
mm2 square millimeters 0.0016 square inches in
2
m2 square meters 10.764 square feet ft
2
m2 square meters 1.195 square yards yd
2
ha hectares 2.47 acres ac
km2 square kilometers 0.386 square miles mi
2
VOLUME
mL milliliters 0.034 fluid ounces fl oz
L liters 0.264 gallons gal
m3 cubic meters 35.314 cubic feet ft
3
m3 cubic meters 1.307 cubic yards yd
3
MASS
g grams 0.035 ounces oz
kg kilograms 2.202 pounds lb
Mg (or "t") megagrams (or "metric
ton") 1.103 short tons (2000 lb) T
TEMPERATURE (exact degrees)
oC Celsius 1.8C+32 Fahrenheit
oF
ILLUMINATION
lx lux 0.0929 foot-candles fc
cd/m2 candela/m
2 0.2919 foot-Lamberts fl
FORCE and PRESSURE or STRESS
N newtons 0.225 poundforce lbf
kPa kilopascals 0.145 poundforce per
square inch lbf/in2
*SI is the symbol for the International System of Units. Appropriate rounding should be made to
comply with Section 4 of ASTM E380.

v
Technical Report Documentation Page 1. Report No.
2. Government Accession No.
3. Recipient's Catalog No.
4. Title and Subtitle
Evaluation of the Altimeter for Measuring Bridge Deflections 5. Report Date
November 10, 2011
6. Performing Organization Code
7. Author(s)
S. Jung, M. D. Roddenberry, and A. Stilson 8. Performing Organization Report No.
FSU Project ID 028434 9. Performing Organization Name and Address
FAMU-FSU College of Engineering Department of Civil and Environmental Engineering 2525 Pottsdamer St. Rm. 129 Tallahassee, FL 32310-6046
10. Work Unit No. (TRAIS)
11. Contract or Grant No.
BDK83 TWO #988-05
12. Sponsoring Agency Name and Address
Florida Department of Transportation Research Center 605 Suwannee Street, MS 30 Tallahassee, FL 32399-0450
13. Type of Report and Period Covered
Final Report May 2010 – August 2011
14. Sponsoring Agency Code
15. Supplementary Notes
16. Abstract
The Florida Department of Transportation frequently measures the displacements of bridges to monitor
their condition or perform load ratings. Due to the limitations and cost associated with conventional
sensors, a low-cost, rugged altimeter was evaluated as an alternative displacement sensor. The tested
altimeter is the ZipLevel Pro 2000 high-precision model manufactured by Technidea Corporation.
A brief guide on using the device and extensive testing results are presented in this report. The
testing results include verification of the accuracy of the device, and the effects of sloped conditions,
temperature, wind, vibration, and localized pressure applied on the sensor cable.
The device is expected to measure the displacement with a ±0.02” (0.508mm) accuracy
provided that the sensor cable remains relatively straight and lies on a flat surface, and that care is taken
to minimize the effects of the pressure, temperature and wind. Error due to the rotation of the
measurement module was 4.5% for a rotation of 44.3°. The error was much higher when the base
module was rotated. The error for the base module was 10.6% after a rotation of 44.3°. Distributed
loading of 80 lb/ft applied on the sensor cable decreased the displacement reading up to 0.33”
(8.38mm). If the device was calibrated at a certain temperature but is used at a different temperature, the
measurement will have errors. The error will be 0.03” (0.762mm) or less if the temperature difference is
10°F or less. This error exponentially increases if the temperature difference is greater. For example, a
20°F difference will cause close to a 1/4" (6.35mm) error. When the sensor cable is subjected to a 20
mph wind, the measurements may have up to 20% error for the displacement up to 0.5”, and 10% error
for the displacement greater than 0.5”.
17. Key Word
Bridge deflection, altimeter, sensor 18. Distribution Statement
No restrictions.
19. Security Classif. (of this report)
Unclassified 20. Security Classif. (of this page)
Unclassified 21. No. of Pages
44 22. Price
Form DOT F 1700.7 (8-72) Reproduction of completed page authorized

vi
Acknowledgements
The authors would like to thank the Florida Department of Transportation (FDOT) for providing
the funding for this research. The authors are grateful to the FDOT Structures Research
Laboratory crew for their help and for performing the tests that were the basis for this study.

vii
Executive Summary
The Florida Department of Transportation frequently measures the displacements of bridges to
monitor their condition or perform load ratings. Due to the limitations and the cost associated
with conventional sensors, a low-cost, rugged altimeter was evaluated as an alternative
displacement sensor. The tested altimeter is the ZipLevel Pro 2000 high-precision model
manufactured by Technidea Corporation.
A brief guide on using the device and extensive testing results are presented in this report.
The testing results include verification of the accuracy of the device, and the effects of sloped
conditions, temperature, wind, vibration, and localized pressure applied on the sensor cable.
The device is expected to measure the displacement with a ±0.02” (0.508mm) accuracy
provided that the sensor cable remains relatively straight and lies on a flat surface, and that care
is taken to minimize the effects of the pressure, the temperature and wind. Error due to the
rotation of the measurement module was 4.5% for a rotation of 44.3°. The error was much higher
when the base module was rotated. The error for the base module was 10.6% after a rotation of
44.3°. Distributed loading of 80 lb/ft applied on the sensor cable decreased the displacement
reading up to 0.33” (8.38mm). If the device was calibrated at a certain temperature but is used at
a different temperature, the measurement will have errors. The error will be 0.03” (0.762mm) or
less if the temperature difference is 10°F or less. This error exponentially increases if the
temperature difference is greater. For example, a 20°F difference will cause close to a 1/4"
(6.35mm) error. When the sensor cable is subjected to a 20 mph wind, the measurements may
have up to 20% error for the displacement up to 0.5”, and 10% error for the displacement greater
than 0.5”.

viii
Table of Contents
ACKNOWLEDGEMENTS ......................................................................................................................................... VI
EXECUTIVE SUMMARY ......................................................................................................................................... VII
TABLE OF CONTENTS ........................................................................................................................................... VIII
LIST OF FIGURES .................................................................................................................................................... IX
LIST OF TABLES ...................................................................................................................................................... X
1. INTRODUCTION .................................................................................................................................................. 1
1.1. BACKGROUND ........................................................................................................................................................ 1
1.2. OBJECTIVES ............................................................................................................................................................ 1
2. GUIDE ON USING THE DEVICE ............................................................................................................................ 2
2.1. TO OBTAIN THE VERTICAL DISPLACEMENT.................................................................................................................... 2
2.2. CALIBRATION DUE TO THE TEMPERATURE CHANGE ........................................................................................................ 3
2.3. TO RECORD AND DOWNLOAD THE DATA ..................................................................................................................... 6
3. VERIFICATION OF THE ACCURACY IN INDOOR CONDITIONS ............................................................................... 8
3.1. OVERVIEW OF EXPERIMENTS ..................................................................................................................................... 8
3.2. TEST A: FLAT SURFACE ............................................................................................................................................. 8
3.3. TEST SET B: ANGLED SURFACE ................................................................................................................................. 10
3.4. TEST C: ROTATIONAL TESTING ................................................................................................................................. 14
3.5. TEST D: CANTILEVER TESTING .................................................................................................................................. 17
3.6. TEST E: BEAM SLAB TESTING IN THE LABORATORY ....................................................................................................... 20
4. EFFECTS OF ENVIRONMENTAL AND FIELD CONDITIONS ................................................................................... 22
4.1. OVERVIEW OF EXPERIMENTS ................................................................................................................................... 22
4.2. TEST F: TEMPERATURE ........................................................................................................................................... 22
4.3. TEST G: WIND ...................................................................................................................................................... 25
4.4. TEST H: VIBRATION ............................................................................................................................................... 30
4.5. TEST I: INDUCED PRESSURE ON THE CORD .................................................................................................................. 32
5. CONCLUSIONS .................................................................................................................................................. 34
APPENDIX: RAW DATA FROM THE TESTS ............................................................................................................. 35

ix
List of Figures
FIGURE 1. ZIPLEVEL PRO 2000 HIGH-PRECISION MODEL........................................................................................................... 1
FIGURE 2. TO ACCESS THE MEASUREMENT MODULE .................................................................................................................. 2
FIGURE 3. THE MEASUREMENT MODULE OF THE ZIPLEVEL PRO 2000 ........................................................................................... 3
FIGURE 4. ORIENTATION OF THE ZIPLEVEL PRO WHEN CALIBRATING FOR THE TEMPERATURE CHANGE ................................................. 4
FIGURE 5. SETTING UP THE MEASUREMENT MODULE FOR THE TEMPERATURE CALIBRATION ............................................................... 4
FIGURE 6. INITIAL ORIENTATION OF THE MEASUREMENT MODULE WHEN CALIBRATING FOR THE TEMPERATURE CHANGE ......................... 4
FIGURE 7. TEMPERATURE CALIBRATION: TO RAISE THE MODULE AGAINST A FLAT SURFACE ................................................................. 5
FIGURE 8. COMPLETION OF THE TEMPERATURE CALIBRATION ...................................................................................................... 5
FIGURE 9. TO ACCESS THE SERIAL-LINK CABLE FROM THE TOP COMPARTMENT OF THE DEVICE............................................................. 6
FIGURE 10. LINK SOFTWARE PROVIDED BY THE MANUFACTURER .................................................................................................. 7
FIGURE 11. SET UP FOR TEST A: FLAT SURFACE ......................................................................................................................... 8
FIGURE 12. TEST A: FLAT SURFACE RESULTS. TOP: LARGE DISPLACEMENT, BOTTOM: SMALL DISPLACEMENT ......................................... 9
FIGURE 13. TEST B1 (LEFT): THE MEASUREMENT MODULE IS RAISED AT A FIXED ANGLE, TEST B2 (RIGHT): THE BASE MODULE IS RAISED AT A
FIXED ANGLE........................................................................................................................................................... 10
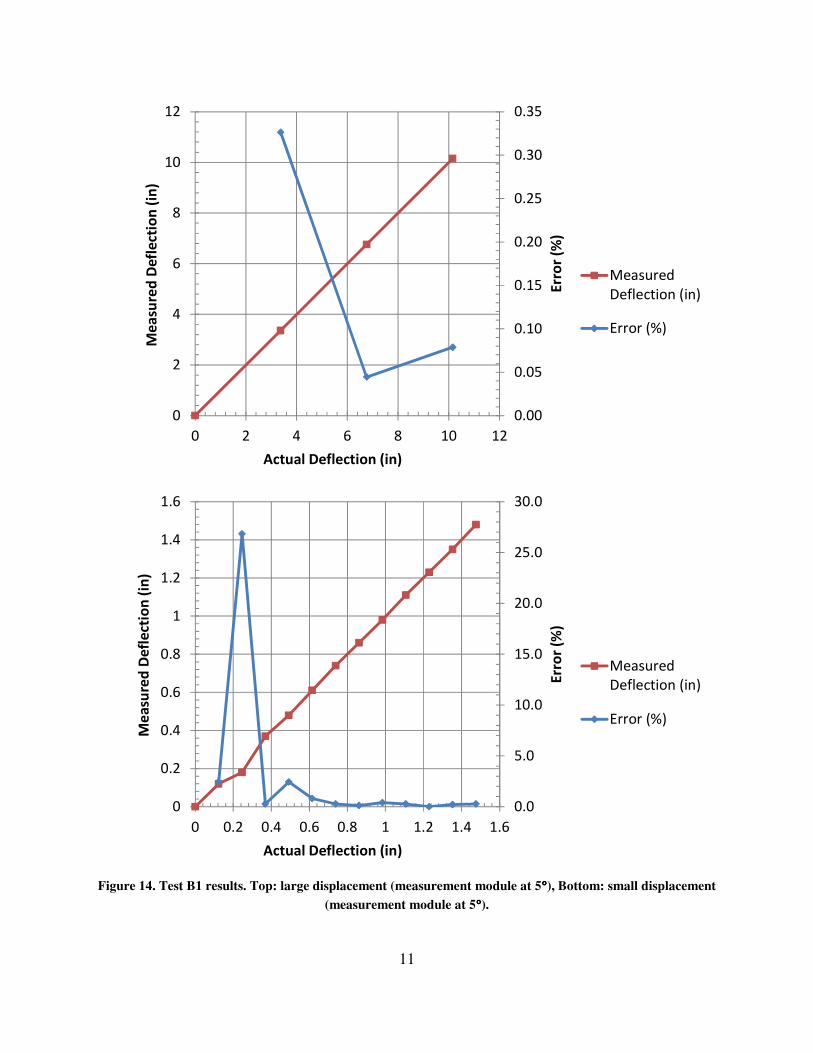
FIGURE 14. TEST B1 RESULTS. TOP: LARGE DISPLACEMENT (MEASUREMENT MODULE AT 5°), BOTTOM: SMALL DISPLACEMENT
(MEASUREMENT MODULE AT 5°). .............................................................................................................................. 11
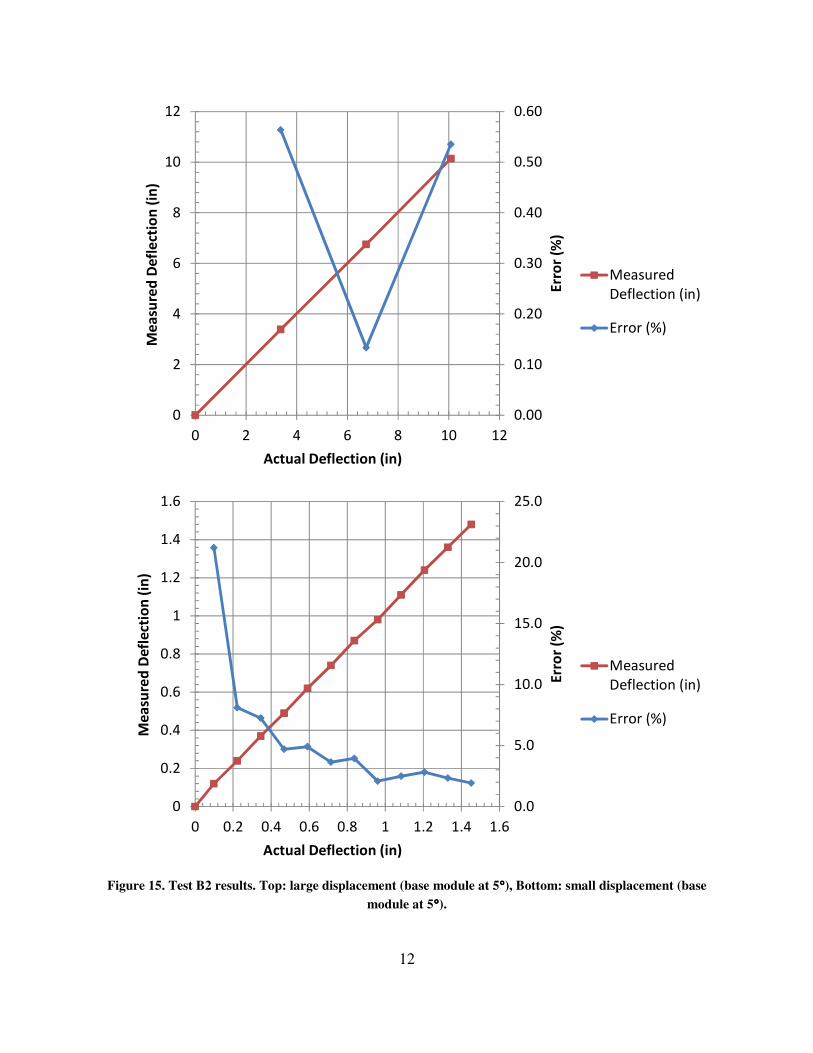
FIGURE 15. TEST B2 RESULTS. TOP: LARGE DISPLACEMENT (BASE MODULE AT 5°), BOTTOM: SMALL DISPLACEMENT (BASE MODULE AT 5°).
........................................................................................................................................................................... 12
FIGURE 16. TEST B3 RESULTS. TOP: LARGE DISPLACEMENT (10° FOR BOTH THE BASE AND THE MEASUREMENT MODULE), BOTTOM: SMALL
DISPLACEMENT (10° FOR BOTH THE BASE AND THE MEASUREMENT MODULE) ..................................................................... 13
FIGURE 17. TEST C: ROTATIONAL TESTING SET-UP (ROTATED RIGHT). THE BASE MODULE WAS ROTATED SIMILARLY. ............................. 14
FIGURE 18. TEST C: ROTATION OF THE MEASUREMENT MODULE, TOP: ROTATED LEFT, BOTTOM: ROTATED RIGHT. .............................. 15
FIGURE 19. TEST C: ROTATION OF THE BASE MODULE, TOP: ROTATED LEFT, BOTTOM: ROTATED RIGHT. ............................................ 16
FIGURE 20. SCHEMATIC ILLUSTRATION OF THE CANTILEVER TESTING ........................................................................................... 18
FIGURE 21. TEST D: CANTILEVER TESTING RESULTS FROM THREE SPECIMENS ................................................................................ 19
FIGURE 22. PLACEMENT OF THE MEASUREMENT MODULE (LEFT) AND THE BASE MODULE (RIGHT) IN THE EXPERIMENT ......................... 20
FIGURE 23. TEST E: RESULTS FROM THE CONCRETE SLAB TESTING ............................................................................................... 21
FIGURE 24. TEST F: THE EFFECT OF NOT RE-CALIBRATING AFTER 20°F REDUCTION IN THE AIR TEMPERATURE. TOP: LARGE DISPLACEMENT,
BOTTOM: SMALL DISPLACEMENT ................................................................................................................................ 23
FIGURE 25. TEST F: THE EFFECT OF NOT RE-CALIBRATING AFTER VARIOUS INCREASES IN THE DEVICE TEMPERATURE .............................. 24
FIGURE 26. THE FAN AT 0 DEGREE AND 90 DEGREE ORIENTATIONS............................................................................................. 25
FIGURE 27. TEST G: THE EFFECT OF THE 20 MPH WIND, LARGE DISPLACEMENT. FROM TOP TO BOTTOM, 0, 30, 60, AND 90 DEGREES. ... 27
FIGURE 28. TEST G: THE EFFECT OF THE 20 MPH WIND, SMALL DISPLACEMENT. FROM TOP TO BOTTOM, 0, 30, 60, AND 90 DEGREES. ... 29
FIGURE 29. VIBRATIONS APPLIED TO THE CABLE ...................................................................................................................... 30
FIGURE 30. TEST H: THE EFFECT OF THE CABLE VIBRATION. TOP: LARGE DISPLACEMENT, BOTTOM: SMALL DISPLACEMENT .................... 31
FIGURE 31. PLACEMENT OF THE SENSOR CABLE IN TEST I .......................................................................................................... 32
FIGURE 32. TEST I: THE EFFECT OF NEAR-CONSTANT PRESSURE APPLIED ON THE CABLE ................................................................... 33

x
List of Tables
TABLE 1. TEST A: FLAT SURFACE, LARGE DISPLACEMENT ........................................................................................................... 35
TABLE 2. TEST A: FLAT SURFACE, SMALL DISPLACEMENT ........................................................................................................... 35
TABLE 3. TEST B1, LARGE DISPLACEMENT (MEASUREMENT MODULE AT 5°) ................................................................................. 35
TABLE 4. TEST B1, SMALL DISPLACEMENT (MEASUREMENT MODULE AT 5°) ................................................................................. 36
TABLE 5. TEST B2, LARGE DISPLACEMENT (BASE MODULE AT 5°) ............................................................................................... 36
TABLE 6. TEST B2, SMALL DISPLACEMENT (BASE MODULE AT 5°) ............................................................................................... 37
TABLE 7. TEST B3, LARGE DISPLACEMENT (10° FOR BOTH THE BASE AND THE MEASUREMENT MODULE) ............................................ 37
TABLE 8. TEST B3, SMALL DISPLACEMENT (10° FOR BOTH THE BASE AND THE MEASUREMENT MODULE) ........................................... 38
TABLE 9. TEST C, ROTATION OF THE MEASUREMENT MODULE ................................................................................................... 38
TABLE 10. TEST C, ROTATION OF THE BASE MODULE ................................................................................................................ 38
TABLE 11. TEST D: CANTILEVER TESTING OF THREE SPECIMENS .................................................................................................. 39
TABLE 12. TEST E: BEAM SLAB TESTING ................................................................................................................................. 40
TABLE 13. TEST F: TEMPERATURE EFFECT (20°F REDUCTION IN THE AIR TEMPERATURE), LARGE DISPLACEMENT .................................. 40
TABLE 14. TEST F: TEMPERATURE EFFECT (20°F REDUCTION IN THE AIR TEMPERATURE), SMALL DISPLACEMENT ................................. 41
TABLE 15. TEST F: TEMPERATURE EFFECT (VARIOUS INCREASES OF THE DEVICE TEMPERATURE), SMALL DISPLACEMENT ......................... 41
TABLE 16. TEST G: WIND EFFECT, LARGE DISPLACEMENT .......................................................................................................... 41
TABLE 17. TEST G: WIND EFFECT, SMALL DISPLACEMENT .......................................................................................................... 42
TABLE 18. TEST H: CABLE VIBRATION EFFECT, LARGE DISPLACEMENT .......................................................................................... 42
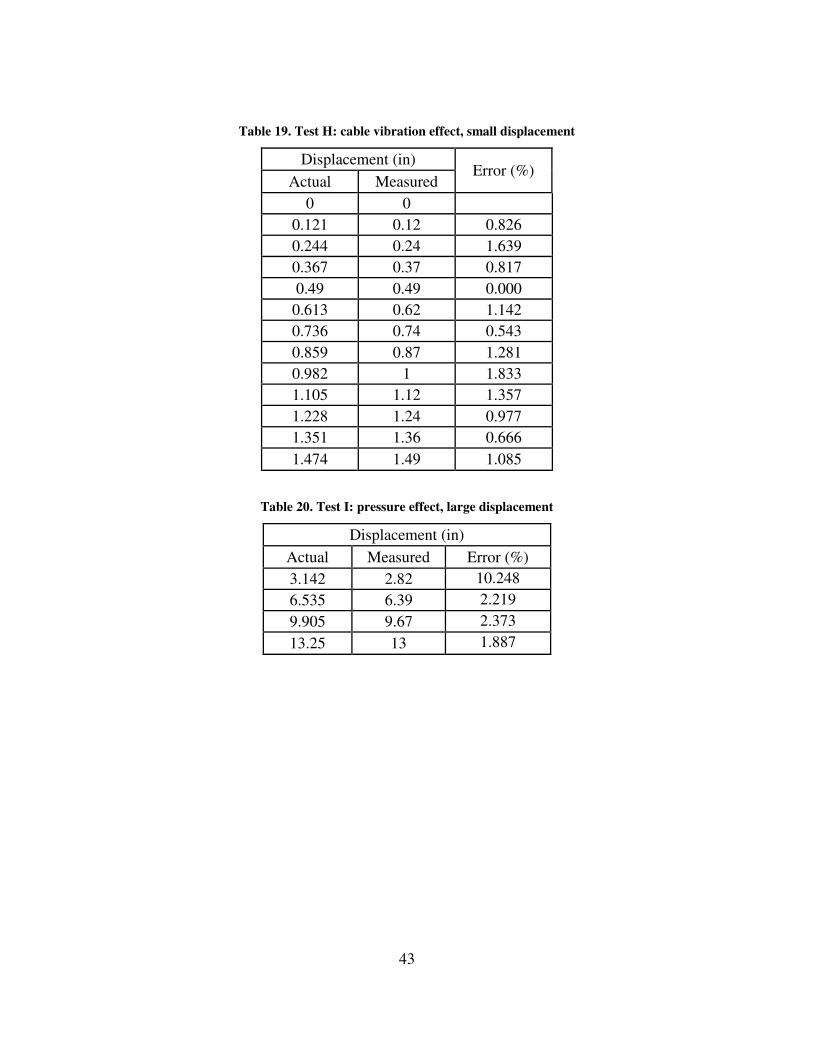
TABLE 19. TEST H: CABLE VIBRATION EFFECT, SMALL DISPLACEMENT .......................................................................................... 43
TABLE 20. TEST I: PRESSURE EFFECT, LARGE DISPLACEMENT ...................................................................................................... 43
TABLE 21. TEST I: PRESSURE EFFECT, SMALL DISPLACEMENT ...................................................................................................... 44

1
1. Introduction
1.1. Background
The Florida Department of Transportation (FDOT) frequently measures the displacements of
bridges to monitor their condition or perform load ratings. Conventional sensors such as LVDTs
require a fixed reference point that is often difficult to access. Other technologies such as laser
scanners exist, but they may not be practical to implement due to their high cost.
As an alternative, the FDOT Structures Research Center identified a low-cost, rugged
altimeter that could potentially be used as a displacement sensor. That altimeter is the ZipLevel
Pro 2000 high-precision model manufactured by Technidea Corporation. The device was
originally designed for surveying applications with much lower precision. The company later
created a high-precision model to address the demand of the customers who needed higher
precision. Its advertised specification is 0.005” (0.127mm) precision up to a distance of 200’
(60m) and a maximum relief of 4’ (1.2m) between base station and measurement module.
Figure 1. ZipLevel Pro 2000 High-Precision Model
1.2. Objectives
The overall goal of the project is to test the ZipLevel Pro High-Precision Model in various
conditions that reflect experiments that the FDOT conducts. Specific objectives are: first, to test
the performance of the altimeter rigorously by collecting and analyzing the data in various
conditions, including the effect of challenging environmental conditions such as wind, vibration,
or the temperature; and second, to develop a guide including calibration, data collection, and
downloading of the data to a computer.

2
2. Guide on Using the Device
2.1. To Obtain the Vertical Displacement
2.1.1. Zeroing
Whenever the device is used in a new site, it requires “zeroing” which sets the current location of
the measurement module as zero-elevation. All subsequent measurements will report the
difference in elevation, which may be used to measure the displacement.
The steps for the zeroing are shown below.
1) Place the device on a flat surface.
2) Press and hold the button located in the middle of the device with one hand and pull up
on the lower door with the other hand, to access the measurement module.
Figure 2. To access the measurement module
3) Carefully take out the measurement module and lay face up exposing the screen. Then,
momentarily press the ON/OFF key to turn the device on.
4) Press and hold ZERO for 2 seconds to set the current location as the reference. Wait until
the unit makes one beeping sound.
3
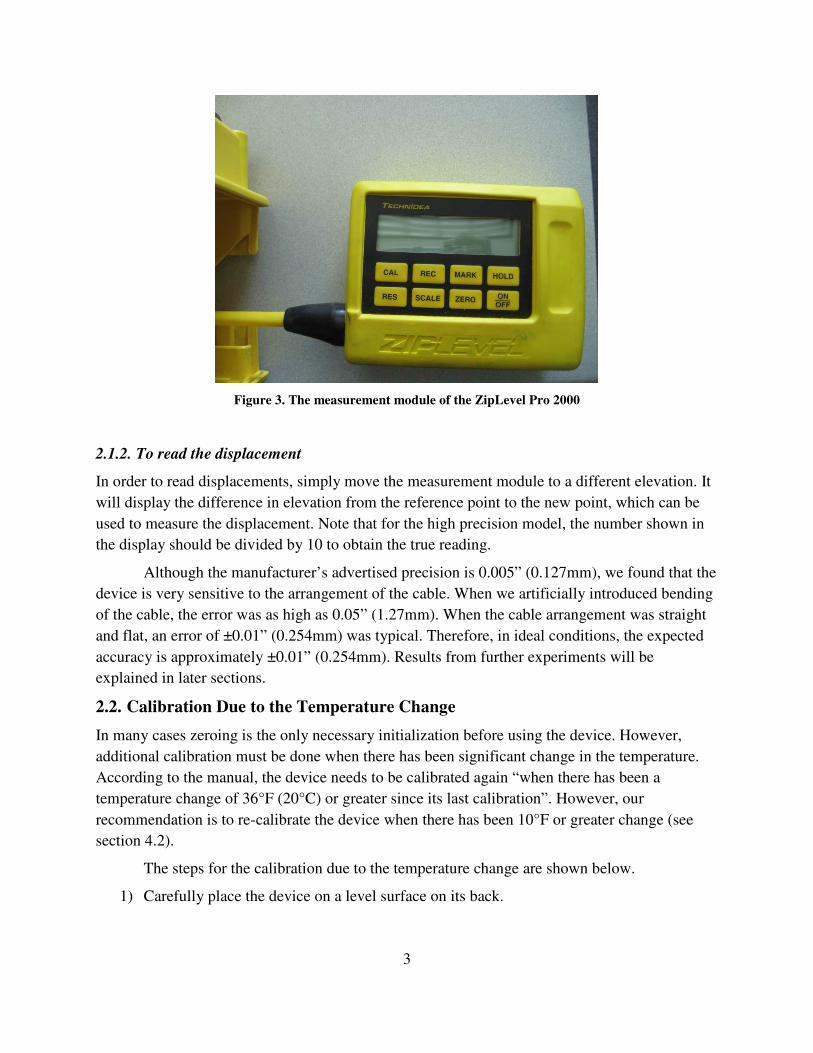
Figure 3. The measurement module of the ZipLevel Pro 2000
2.1.2. To read the displacement
In order to read displacements, simply move the measurement module to a different elevation. It
will display the difference in elevation from the reference point to the new point, which can be
used to measure the displacement. Note that for the high precision model, the number shown in
the display should be divided by 10 to obtain the true reading.
Although the manufacturer’s advertised precision is 0.005” (0.127mm), we found that the
device is very sensitive to the arrangement of the cable. When we artificially introduced bending
of the cable, the error was as high as 0.05” (1.27mm). When the cable arrangement was straight
and flat, an error of ±0.01” (0.254mm) was typical. Therefore, in ideal conditions, the expected
accuracy is approximately ±0.01” (0.254mm). Results from further experiments will be
explained in later sections.
2.2. Calibration Due to the Temperature Change
In many cases zeroing is the only necessary initialization before using the device. However,
additional calibration must be done when there has been significant change in the temperature.
According to the manual, the device needs to be calibrated again “when there has been a
temperature change of 36°F (20°C) or greater since its last calibration”. However, our
recommendation is to re-calibrate the device when there has been 10°F or greater change (see
section 4.2).
The steps for the calibration due to the temperature change are shown below.
1) Carefully place the device on a level surface on its back.

4
Figure 4. Orientation of the ZipLevel Pro when calibrating for the temperature change
2) Obtain the Calibration bolt located in the storage area behind the base unit door and
screw into the bottom of the measurement module until snug.
Figure 5. Setting up the measurement module for the temperature calibration
3) Place the measurement module on the flat surface as shown below. Turn on the device,
and then press and hold the CAL key for two seconds and then release.
Figure 6. Initial orientation of the measurement module when calibrating for the temperature change

5
4) When the display flashes [0], press the CAL key momentarily. The display will then flash
[48] at which time the measurement module should be raised 4.8 inches. (The unit must
not be raised until [48] flashes.) Balance the measurement module on the Calibration
Bolt and hold it steady against a flat surface so that the measurement module is
completely level.
Figure 7. Temperature calibration: to raise the module against a flat surface
5) After raising the module 4.8 inches, press the CAL button once more. When the display
stops flashing and shows 4.8 inches, Calibration is complete. Note that the displayed
number should be divided by 10 in order to obtain the true reading for the high precision
model.
Figure 8. Completion of the temperature calibration
6
2.3. To Record and Download the Data
2.3.1. Record
To record the measured data, the unit first should enter the recording mode. Press and hold the
REC & MARK keys for 2 seconds. The word “REC” will appear on the left side of the display.
Press the HOLD key momentarily to store the measurement of the current location. Wait until a
series of beeps stop, and then move the measurement module to the next location.
To exit the recording mode, press and hold the REC & MARK keys for 2 seconds.
2.3.2. Inspect
The user may inspect the recorded data before downloading it to a computer. Press and hold
CAL & REC keys simultaneously for 2 seconds to enter/exit the inspect mode. Use MARK/REC
keys to cycle through data one by one. Use CAL/HOLD keys to sequence up or down in 10 point
increments.
2.3.3. Dump
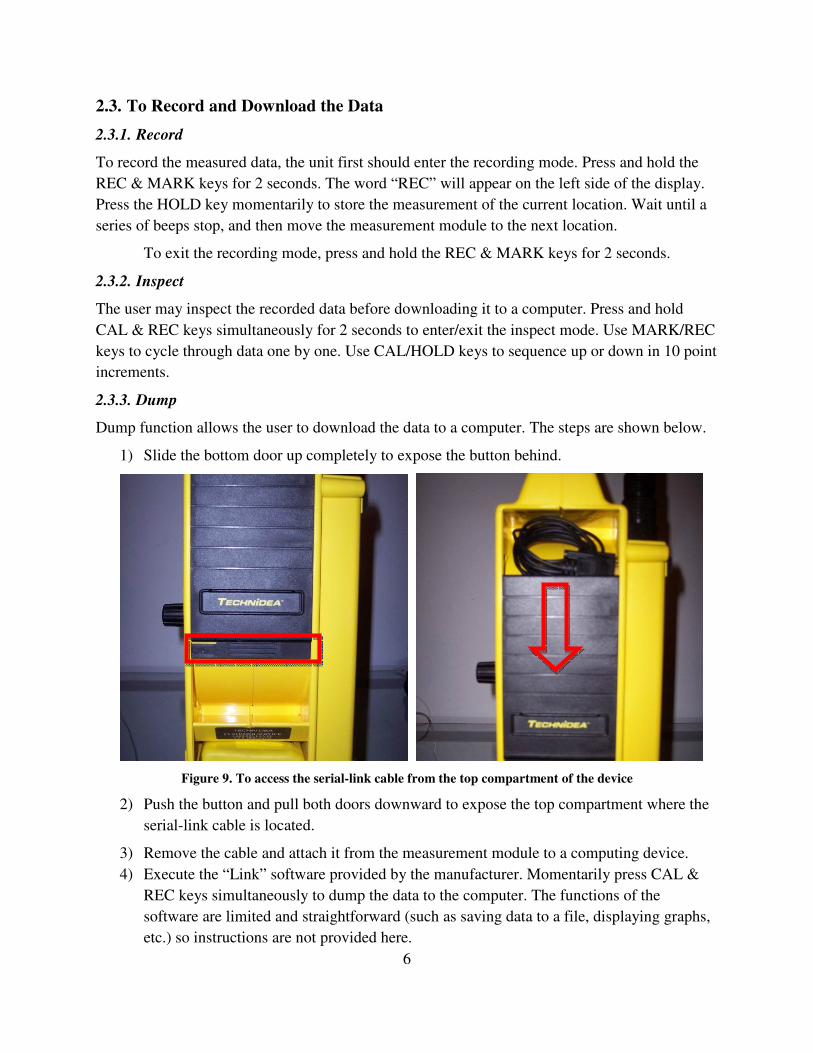
Dump function allows the user to download the data to a computer. The steps are shown below.
1) Slide the bottom door up completely to expose the button behind.
Figure 9. To access the serial-link cable from the top compartment of the device
2) Push the button and pull both doors downward to expose the top compartment where the
serial-link cable is located.
3) Remove the cable and attach it from the measurement module to a computing device.
4) Execute the “Link” software provided by the manufacturer. Momentarily press CAL &
REC keys simultaneously to dump the data to the computer. The functions of the
software are limited and straightforward (such as saving data to a file, displaying graphs,
etc.) so instructions are not provided here.

7
Figure 10. Link software provided by the manufacturer
2.3.4. Real-time monitoring and recording
The software has an option to record the data to a file in real time. Since the recording is done in
fixed sampling frequency, this option can potentially be used to synchronize the data obtained
from the device and the data from other sensors. However, the synchronization needs to be done
after completing the experiment, because the data from the device is stored to an external file.
In order to use this function, press ON/OFF & CAL for two seconds. From the software,
select “Monitor” from the menu. Check “Log Monitor Data To File” option to store the
monitored data with the frequency specified in “Log Interval”.

8
3. Verification of the Accuracy in Indoor Conditions
3.1. Overview of Experiments
The purpose of each experiment in this section is to verify the accuracy of the device operating
in ideal indoor conditions. This category includes the testing of the altimeter in response to
angled conditions, and comparison to other sensors in two different lab experiments.
3.2. Test A: Flat Surface
The pictures below depict the flat surface testing for both large displacement (left) and small
displacement (right) scenarios. Three 3 inch thick wood blocks were used to test large
displacements while twelve 1/8 inch thick steel plates were used to test small displacements. For
the exact increment of the thickness, refer to the first columns of Table 1 and Table 2 in the
Appendix. The entire measurement module rests on a 30.5 inch 4”x4” wood cross member and is
lifted in fixed increments.
Figure 11. Set up for Test A: flat surface
The results are summarized in the figures below. All raw data is presented in the
Appendix. The error for the large displacement test was less than 0.4%. For the small
displacement test, the error was less than 2.5% except for 1/8” displacement, in which the error
was 7.4%.

9
0.00
0.05
0.10
0.15
0.20
0.25
0.30
0.35
0.40
0.45
0
2
4
6
8
10
12
0 2 4 6 8 10 12
Err
or
(%)
Me
asu
red
De
fle
ctio
n (
in)
Actual Deflection (in)
Measured
Deflection (in)
Error (%)
0.0
1.0
2.0
3.0
4.0
5.0
6.0
7.0
8.0
0
0.2
0.4
0.6
0.8
1
1.2
1.4
1.6
0 0.2 0.4 0.6 0.8 1 1.2 1.4 1.6
Err
or
(%)
Me
asu
red
De
fle
ctio
n (
in)
Actual Deflection (in)
Measured
Deflection (in)
Error (%)
Figure 12. Test A: flat surface results. Top: large displacement, Bottom: small displacement

10
3.3. Test Set B: Angled Surface
Test Set B contains Tests B1, B2, and B3. In Test B1 (Figure 13, left picture), the measurement
module is raised at a fixed angle while the base module remains level. In Test B2 (Figure 13,
right picture), the base module is raised at a fixed angle while the measurement module remains
level. In Test B3 (not pictured), both the measurement module and the base module are raised at
a fixed angle.
Figure 13. Test B1 (left): the measurement module is raised at a fixed angle, Test B2 (right): the base module
is raised at a fixed angle.
Experiments for each case were conducted for 5°, 10°, and 15° angles. Results are
presented for the worst performing case for each test. Error in large displacement testing was not
significant. Error in small displacement testing was typically less than 5%. However, the error
could become much higher when the displacement was less than 1/4" — 26.8% for Test B1,
21.2% for Test B2, and 5.7% Test B3. The error appeared to be the result of fluctuations in the
readings as explained in section 2.1.2. However, it was unclear if the small fluctuations were
increased due to the skewed angle.
11
0.00
0.05
0.10
0.15
0.20
0.25
0.30
0.35
0
2
4
6
8
10
12
0 2 4 6 8 10 12
Err
or
(%)
Me
asu
red
De
fle
ctio
n (
in)
Actual Deflection (in)
Measured
Deflection (in)
Error (%)
0.0
5.0
10.0
15.0
20.0
25.0
30.0
0
0.2
0.4
0.6
0.8
1
1.2
1.4
1.6
0 0.2 0.4 0.6 0.8 1 1.2 1.4 1.6
Err
or
(%)
Me
asu
red
De
fle
ctio
n (
in)
Actual Deflection (in)
Measured
Deflection (in)
Error (%)
Figure 14. Test B1 results. Top: large displacement (measurement module at 5°°°°), Bottom: small displacement
(measurement module at 5°°°°).
12
0.00
0.10
0.20
0.30
0.40
0.50
0.60
0
2
4
6
8
10
12
0 2 4 6 8 10 12
Err
or
(%)
Me
asu
red
De
fle
ctio
n (
in)
Actual Deflection (in)
Measured
Deflection (in)
Error (%)
0.0
5.0
10.0
15.0
20.0
25.0
0
0.2
0.4
0.6
0.8
1
1.2
1.4
1.6
0 0.2 0.4 0.6 0.8 1 1.2 1.4 1.6
Err
or
(%)
Me
asu
red
De
fle
ctio
n (
in)
Actual Deflection (in)
Measured
Deflection (in)
Error (%)
Figure 15. Test B2 results. Top: large displacement (base module at 5°°°°), Bottom: small displacement (base
module at 5°°°°).

13
0.00
0.10
0.20
0.30
0.40
0.50
0.60
0
2
4
6
8
10
12
0 2 4 6 8 10 12
Err
or
(%)
Me
asu
red
De
fle
ctio
n (
in)
Actual Deflection (in)
Measured
Deflection (in)
Error (%)
0.0
1.0
2.0
3.0
4.0
5.0
6.0
0
0.2
0.4
0.6
0.8
1
1.2
1.4
1.6
0 0.2 0.4 0.6 0.8 1 1.2 1.4 1.6
Err
or
(%)
Me
asu
red
De
fle
ctio
n (
in)
Actual Deflection (in)
Measured
Deflection (in)
Error (%)
Figure 16. Test B3 results. Top: large displacement (10°°°° for both the base and the measurement module),
Bottom: small displacement (10°°°° for both the base and the measurement module)

14
3.4. Test C: Rotational Testing
In Test C rotations of the measurement module and the base module were simulated by using
three blocks as shown below. One block (triangular block only) causes 17.0° rotations. Two
blocks cause 29.7° rotations. Three blocks cause 44.3° rotations. When the measurement module
was being rotated and elevated, the base module remained at a fixed location. The same was true
when the base module was being rotated and elevated — the measurement module remained at a
fixed location.
Figure 17. Test C: rotational testing set-up (rotated right). The base module was rotated similarly.
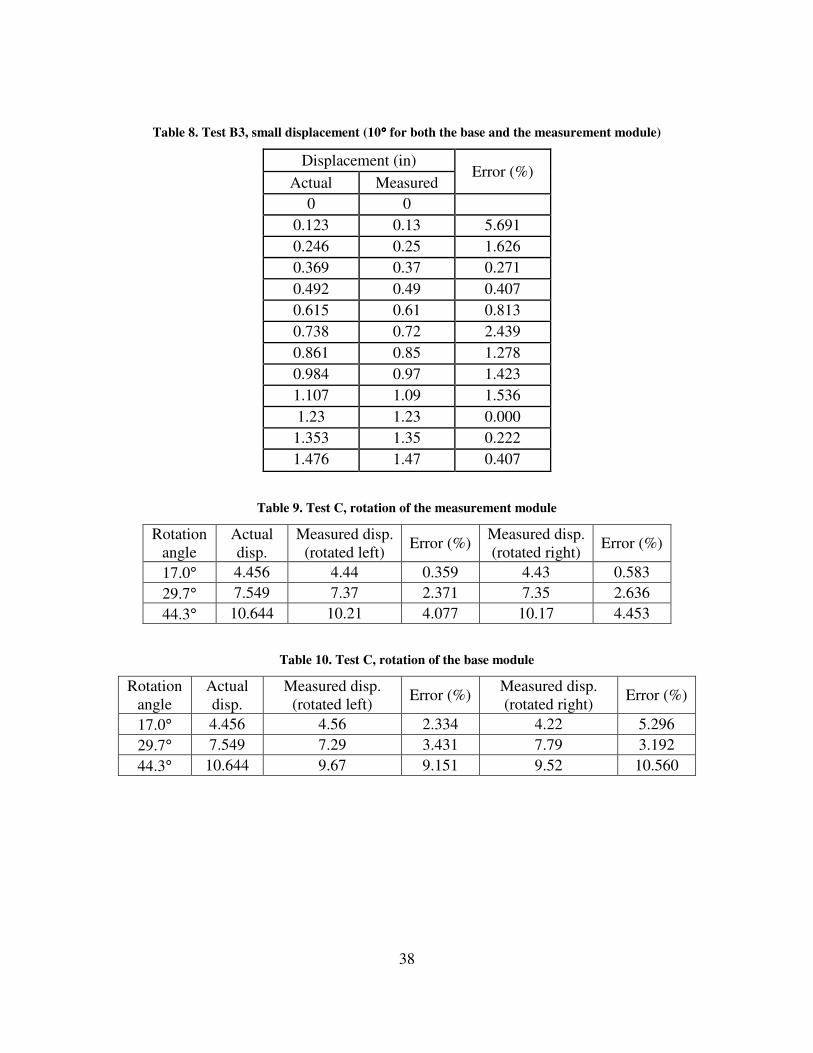
Error due to the rotation of the measurement module was 4.5% for a rotation of 44.3°.
The error was much higher when the base module was rotated. The error for the base module
was 10.6% after a rotation of 44.3°. For the rotations of 30° or less of the base module, the error
was within 5%.

15
0.0
0.5
1.0
1.5
2.0
2.5
3.0
3.5
4.0
4.5
0
2
4
6
8
10
12
0 2 4 6 8 10 12
Err
or
(%)
Me
asu
red
De
fle
ctio
n (
in)
Actual Deflection (in)
Measured
(Rotated Left)
Error (%)
0.0
0.5
1.0
1.5
2.0
2.5
3.0
3.5
4.0
4.5
5.0
0
2
4
6
8
10
12
0 2 4 6 8 10 12
Err
or
(%)
Me
asu
red
De
fle
ctio
n (
in)
Actual Deflection (in)
Measured
(Rotated Right)
Error (%)
Figure 18. Test C: rotation of the measurement module, Top: rotated left, Bottom: rotated right.

16
0.0
1.0
2.0
3.0
4.0
5.0
6.0
7.0
8.0
9.0
10.0
0
2
4
6
8
10
12
0 2 4 6 8 10 12
Err
or
(%)
Me
asu
red
De
fle
ctio
n (
in)
Actual Deflection (in)
Measured
(Rotated Left)
Error (%)
0.0
2.0
4.0
6.0
8.0
10.0
12.0
0
2
4
6
8
10
12
0 2 4 6 8 10 12
Err
or
(%)
Me
asu
red
De
fle
ctio
n (
in)
Actual Deflection (in)
Measured
(Rotated Right)
Error (%)
Figure 19. Test C: rotation of the base module, Top: rotated left, Bottom: rotated right.

17
3.5. Test D: Cantilever Testing
Large displacement of a cantilever beam was measured in another project by the principal
investigator. The cantilever beam was connected to the vertical member using aluminum
connections. The beam was lifted by an actuator as shown in Figure 20. Since the aluminum
connection was ductile, it allowed large displacement.
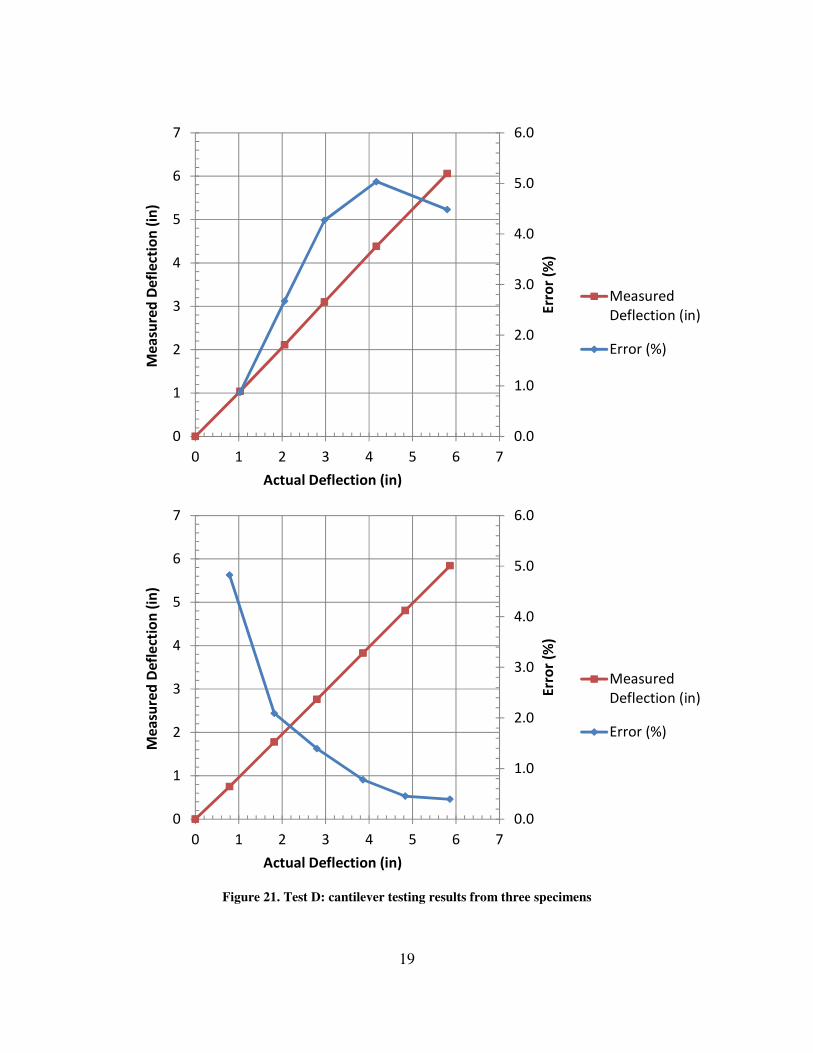
The measurement using the ZipLevel Pro was compared to the measurement by another
cable-based displacement transducer manufactured by Firstmark Controls. “Actual Deflection”
of Figure 21was obtained using this transducer. The transducer, model #: 161-2145-C7SS,
measures up to 26.75 in (679 mm) with an independent linearity error of ±0.35%. For the
displacement up to 6”, the error will be up to ±0.021”. The error is the independent linearity error,
meaning that the magnitude of the error will decrease linearly if the displacement decreases. On
the other hand, the ZipLevel Pro has an absolute error of ±0.02” when the cable goes up or down
(see section 5), which was the case of this experiment as shown in Figure 20. Therefore, the
transducer will be at least as accurate as the ZipLevel Pro at 6” displacement, but gradually more
accurate for the smaller displacements.
Overall, the measurements from the ZipLevel Pro were comparable to the displacement
transducer and showed a 5% or less error with the exception of one point that showed an 8%
error (see Figure 21). The test involved both the large deflection and the rotation. The ZipLevel
Pro had very small error for the large deflection (see Figure 12). Therefore, the error should
come primarily from the large rotation. The length of the cantilever beam was 30 inches, and the
displacement was continued up to 6 inches, so the maximum rotation of the test was 11.3°. As
shown in section 3.4 and Figure 18 (the first point in the graph), the error was 0.58% for a
rotation of 17.0° of the measurement module, which is substantially smaller than typical 5%
error observed in these tests.
Two possible explanations of the typical 5% errors of these tests are the local failure of
the cantilever beam and the error from the sensor cable. During the experiment, a local failure
was observed around the actuator. The cantilever beam was primarily composed of aluminum
plates, and the local failure created a non-uniform surface condition that affected the
measurement module. The second explanation is the error from the sensor cable. Typical error
due to the condition of the cable was ±0.02” when the cable went up or down between the base
module and the measurement module. This error corresponds to a 2% error for 1” displacement.
The error from the sensor cable explains the observation that two out of three tests showed
greater error for the smaller displacement, yet it is unclear why two tests had decreasing errors
whereas one test had increasing errors. It appears that the local failure affected the measurement
module somewhat randomly. Overall, the results should be interpreted considering these
additional errors. However, even with these additional errors, the ZipLevel Pro was comparable
to the other transducer with up to 5% error, with the exception of one point that had an 8% error.

18
Figure 20. Schematic illustration of the cantilever testing
0.0
1.0
2.0
3.0
4.0
5.0
6.0
7.0
8.0
9.0
0
1
2
3
4
5
6
7
0 1 2 3 4 5 6 7
Err
or
(%)
Me
asu
red
De
fle
ctio
n (
in)
Actual Deflection (in)
Measured
Deflection (in)
Error (%)
19
0.0
1.0
2.0
3.0
4.0
5.0
6.0
0
1
2
3
4
5
6
7
0 1 2 3 4 5 6 7
Err
or
(%)
Me
asu
red
De
fle
ctio
n (
in)
Actual Deflection (in)
Measured
Deflection (in)
Error (%)
0.0
1.0
2.0
3.0
4.0
5.0
6.0
0
1
2
3
4
5
6
7
0 1 2 3 4 5 6 7
Err
or
(%)
Me
asu
red
De
fle
ctio
n (
in)
Actual Deflection (in)
Measured
Deflection (in)
Error (%)
Figure 21. Test D: cantilever testing results from three specimens

20
3.6. Test E: Beam Slab Testing in the Laboratory
Destructive testing of a concrete slab performed at the FDOT Structures Lab was utilized in the
testing of this device. The base module was placed toward the end of a concrete bridge slab
(above one of the supports on the top surface) while the measurement module was placed close
to the middle of the concrete section directly adjacent to a displacement transducer. When the
load was applied, deflection from both instruments was recorded every ten to twenty seconds
with paper and pencil until critical failure of the beam was imminent.
The results from the testing are presented here just for reference information. It should
not be used to judge the accuracy of the device because significant errors occurred due to the
lack of synchronization. However, the error was less than 10% for all deflections greater than
0.5”. Comparison of the results from Test E and the results from Test C is informative. In Test C,
the maximum error due to the rotation of the measurement module was 4.5%, and the maximum
error due to the rotation of the base module was less than 10.6%. Test E involved the rotation of
both the measurement module and the base module, and the maximum error from Test E (14.7%)
is comparable to the maximum error predicted by Test C (4.5% + 10.6% = 15.1%).
Figure 22. Placement of the measurement module (left) and the base module (right) in the experiment

21
0.0
2.0
4.0
6.0
8.0
10.0
12.0
14.0
16.0
0
0.5
1
1.5
2
2.5
3
3.5
4
0 0.5 1 1.5 2 2.5 3 3.5 4
Err
or
(%)
Me
asu
red
De
fle
ctio
n (
in)
Actual Deflection (in)
Measured
Deflection (in)
Error (%)
Figure 23. Test E: results from the concrete slab testing
22
4. Effects of Environmental and Field Conditions
4.1. Overview of Experiments
Experiments in this section introduce variables that reflect the potential use of the instrument in
the field. These tests include temperature, wind, vibration, and induced pressure on the cable.
4.2. Test F: Temperature
The effect of temperature change was studied by calibrating the device at 95°F, and using it in a
room with a constant temperature of 75°F. The figure below compares the actual displacement,
altimeter displacement without re-calibration, and altimeter displacement after re-calibration at
75°F.
The graphs so far were presented by subtracting the measurement at zero-block (zero-plate) from
the raw data, so that the graphs begin from the origin. On the other hand, the graphs below used
the raw data to explain the error when the device was not properly calibrated against the
temperature change.
As shown in Figure 24, a 20°F reduction in the ambient temperature decreased the
uncalibrated reading by 1.3” to 1.5” (average decrease: 1.41” for large displacement and 1.31”
for small displacement). When the device was properly re-calibrated, the accuracy was consistent
with what was presented earlier.
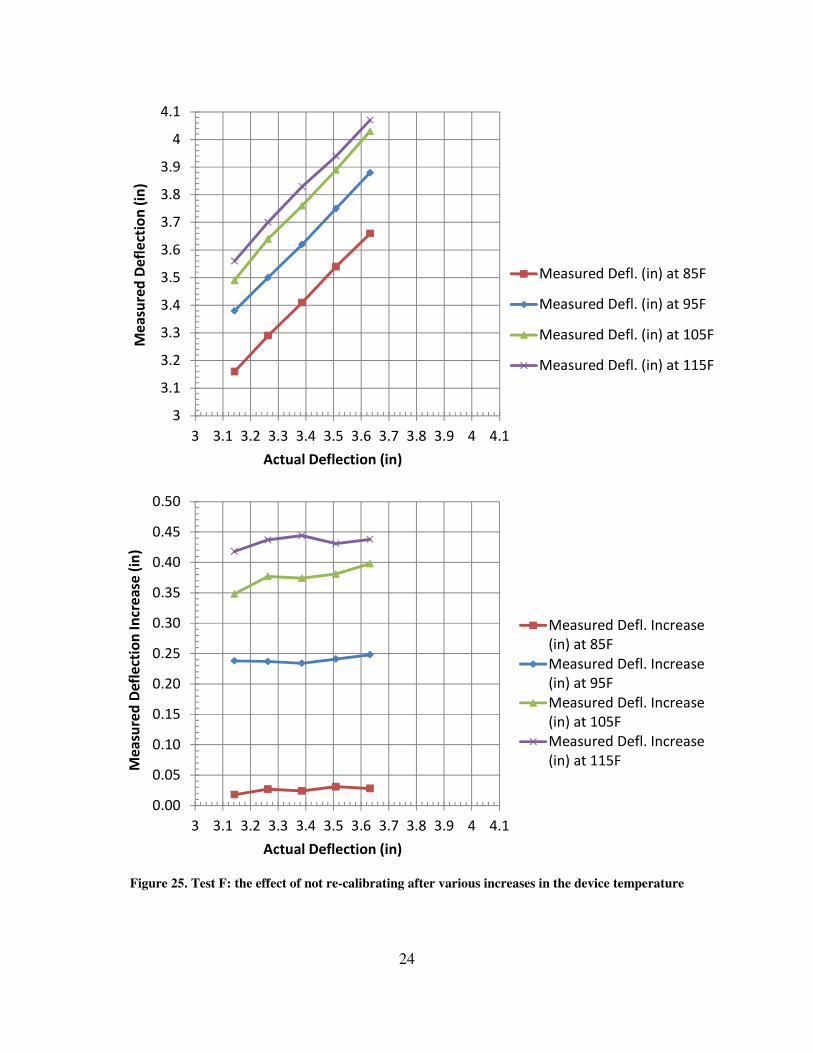
The measured temperature is the ambient temperature and not the temperature of the
device. The testing was repeated again using the device temperature. The temperature of the
device can be obtained from the measurement module. This time, the device was calibrated at
75°F, and then used without re-calibration at 85°F, 95°F, 105°F, and 115°F.
As shown in Figure 25, the displacement increased significantly due to the increase in the
temperature. For 10°F, 20°F, 30°F, and 40°F increase, the displacement on average increased
0.026”, 0.240”, 0.376”, and 0.434”. Note that even the 20°F change in the device temperature
caused close to 1/4" (6.35mm) error, which is not acceptable in high-precision applications. Up
to 10°F change in the device temperature caused 0.03” (0.762mm) error, so the relationship
between the temperature and the error is definitely nonlinear.
Although the user’s manual recommends re-calibration when there is 36°F or greater
change (see section 2.2), we recommend re-calibration whenever the temperature change is 10°F
or greater if up to 0.03” error is acceptable. If higher precision is required, the user should
measure a known height to check the need of re-calibration even for a small change in
temperature. According to the results shown in Figure 25, the standard deviation of the shift for
10°F, 20°F, 30°F, and 40°F difference are 0.005”, 0.005”, 0.018”, and 0.01”, which are
comparable to the device accuracy of ±0.01” (0.254mm). Therefore, only a single measurement
of a known height will be needed for re-calibration for most purposes. If very high precision is
necessary, then re-calibration with multiple points is recommended.

23
0
2
4
6
8
10
12
14
0 2 4 6 8 10 12 14
Me
asu
red
De
fle
ctio
n (
in)
Actual Deflection (in)
Measured Deflection
w/o Calibration (in)
Measured Deflection
with Calibration (in)
1.5
2
2.5
3
3.5
4
4.5
5
1.5 2 2.5 3 3.5 4 4.5 5
Me
asu
red
De
fle
ctio
n (
in)
Actual Deflection (in)
Measured Deflection
w/o Calibration (in)
Measured Deflection
with Calibration (in)
Figure 24. Test F: the effect of not re-calibrating after 20°°°°F reduction in the air temperature. Top: large
displacement, Bottom: small displacement
24
3
3.1
3.2
3.3
3.4
3.5
3.6
3.7
3.8
3.9
4
4.1
3 3.1 3.2 3.3 3.4 3.5 3.6 3.7 3.8 3.9 4 4.1
Me
asu
red
De
fle
ctio
n (
in)
Actual Deflection (in)
Measured Defl. (in) at 85F
Measured Defl. (in) at 95F
Measured Defl. (in) at 105F
Measured Defl. (in) at 115F
0.00
0.05
0.10
0.15
0.20
0.25
0.30
0.35
0.40
0.45
0.50
3 3.1 3.2 3.3 3.4 3.5 3.6 3.7 3.8 3.9 4 4.1
Me
asu
red
De
fle
ctio
n I
ncr
ea
se (
in)
Actual Deflection (in)
Measured Defl. Increase
(in) at 85F
Measured Defl. Increase
(in) at 95F
Measured Defl. Increase
(in) at 105F
Measured Defl. Increase
(in) at 115F
Figure 25. Test F: the effect of not re-calibrating after various increases in the device temperature

25
The effect on the temperature is one of the most significant factors in using the device in
the field condition. If the FDOT collects all data points when the temperature change is less than
10°F, the effect should not be a problem. On the other hand, if the FDOT calibrates the device
when the temperature is cool, and collects the data when it is much warmer (or the other way
around), the error can be significant as shown by the above graphs.
The testing above was done by locally heating the device and the cable simultaneously,
under the constant ambient temperature. The magnitude of the temperature explained above
should be used as a guideline, not as a definitive number. The reason is because of the difficulty
of correlating the temperature inside the cable, the device temperature reported by the
measurement module, and the air temperature. A 10°F change in the air temperature (or the
device temperature) may cause higher or lower change in the temperature inside the cable, which
affects the measurement.
4.3. Test G: Wind
To study the effect of wind on the device, a fan was placed one foot away from the measurement
module. The wind speed was approximately 20 mph. Tests were conducted at 0, 30, 60, and 90
degree orientations. Both the measurement module and the cable were subjected to the wind
produced from the fan.
Figure 26. The fan at 0 degree and 90 degree orientations

26
0.0
0.2
0.4
0.6
0.8
1.0
1.2
0
2
4
6
8
10
12
0 2 4 6 8 10 12
Err
or
(%)
Me
asu
red
De
fle
ctio
n (
in)
Actual Deflection (in)
Measured
Deflection (in)
at 0 Degree
Error (%)
0.0
0.2
0.4
0.6
0.8
1.0
1.2
1.4
0
2
4
6
8
10
12
0 2 4 6 8 10 12
Err
or
(%)
Me
asu
red
De
fle
ctio
n (
in)
Actual Deflection (in)
Measured
Deflection (in)
at 30 Degree
Error (%)

27
0.0
0.2
0.4
0.6
0.8
1.0
1.2
0
2
4
6
8
10
12
0 2 4 6 8 10 12
Err
or
(%)
Me
asu
red
De
fle
ctio
n (
in)
Actual Deflection (in)
Measured
Deflection (in)
at 60 Degree
Error (%)
0.0
0.1
0.2
0.3
0.4
0.5
0.6
0.7
0.8
0
2
4
6
8
10
12
0 2 4 6 8 10 12
Err
or
(%)
Me
asu
red
De
fle
ctio
n (
in)
Actual Deflection (in)
Measured
Deflection (in)
at 90 Degree
Error (%)
Figure 27. Test G: the effect of the 20 mph wind, large displacement. From top to bottom, 0, 30, 60, and 90
degrees.

28
0.0
2.0
4.0
6.0
8.0
10.0
12.0
14.0
16.0
18.0
20.0
0
0.2
0.4
0.6
0.8
1
1.2
1.4
1.6
0 0.2 0.4 0.6 0.8 1 1.2 1.4 1.6
Err
or
(%)
Me
asu
red
De
fle
ctio
n (
in)
Actual Deflection (in)
Measured
Deflection (in)
at 0 Degree
Error (%)
0.0
0.5
1.0
1.5
2.0
2.5
3.0
0
0.2
0.4
0.6
0.8
1
1.2
1.4
1.6
0 0.2 0.4 0.6 0.8 1 1.2 1.4 1.6
Err
or
(%)
Me
asu
red
De
fle
ctio
n (
in)
Actual Deflection (in)
Measured
Deflection (in)
at 30 Degree
Error (%)

29
0.0
2.0
4.0
6.0
8.0
10.0
12.0
14.0
16.0
18.0
0
0.2
0.4
0.6
0.8
1
1.2
1.4
1.6
0 0.2 0.4 0.6 0.8 1 1.2 1.4 1.6
Err
or
(%)
Me
asu
red
De
fle
ctio
n (
in)
Actual Deflection (in)
Measured
Deflection (in)
at 60 Degree
Error (%)
0.0
1.0
2.0
3.0
4.0
5.0
6.0
7.0
8.0
9.0
10.0
0
0.2
0.4
0.6
0.8
1
1.2
1.4
1.6
0 0.2 0.4 0.6 0.8 1 1.2 1.4 1.6
Err
or
(%)
Me
asu
red
De
fle
ctio
n (
in)
Actual Deflection (in)
Measured
Deflection (in)
at 90 Degree
Error (%)
Figure 28. Test G: the effect of the 20 mph wind, small displacement. From top to bottom, 0, 30, 60, and 90
degrees.

30
As shown in the graphs, the error for large displacement testing was less than 1% for all
cases with the exception of one case that had a 1.3% error. For the small displacement testing the
error was much higher. When the displacement was less than 0.5” the error was as high as 20%.
When the displacement was greater than 0.5” the error was as high as 15%. The largest error
occurred at the 0 degree condition, or when the measurement unit was facing the wind directly.
In other orientations, the error was less than 5%.
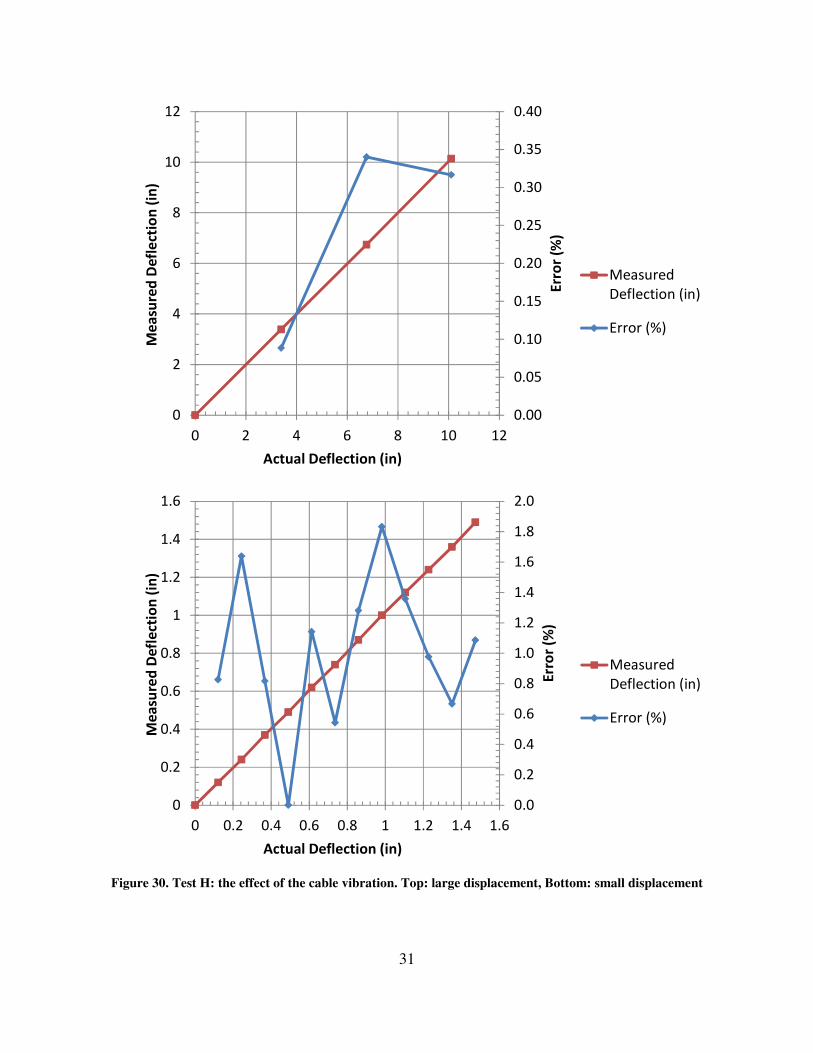
4.4. Test H: Vibration
To simulate the effect of environmental vibrations on the device, a vibration table set was used.
The cord was laid over the vibration table as shown in Figure 29 and displacement was measured.
Results showed that vibration was not a significant factor affecting the accuracy of large
displacements. Small displacement testing showed more error, but the error was 2% or less for
all measurements.
Figure 29. Vibrations applied to the cable
31
0.00
0.05
0.10
0.15
0.20
0.25
0.30
0.35
0.40
0
2
4
6
8
10
12
0 2 4 6 8 10 12
Err
or
(%)
Me
asu
red
De
fle
ctio
n (
in)
Actual Deflection (in)
Measured
Deflection (in)
Error (%)
0.0
0.2
0.4
0.6
0.8
1.0
1.2
1.4
1.6
1.8
2.0
0
0.2
0.4
0.6
0.8
1
1.2
1.4
1.6
0 0.2 0.4 0.6 0.8 1 1.2 1.4 1.6
Err
or
(%)
Me
asu
red
De
fle
ctio
n (
in)
Actual Deflection (in)
Measured
Deflection (in)
Error (%)
Figure 30. Test H: the effect of the cable vibration. Top: large displacement, Bottom: small displacement

32
4.5. Test I: Induced Pressure on the Cord
In this testing, the effect of stepping on the sensor cable while in operation was simulated. Due to
the difficulty of applying a consistent pressure, a 1 foot steel I-beam (W18x40) was used to
apply the pressure. The sensor cable was placed under the center of the beam, perpendicular to
the web, so the contact distance was the width of the flange or 6”, as illustrated in Figure 31.
Therefore, the approximate distributed loading was 80 lb/ft.
Figure 31. Placement of the sensor cable in Test I
Similar to the temperature testing, the near-constant pressure had the effect of shifting the
entire graph. Therefore, the raw data is presented here like the temperature testing (the
measurement at the zero-block/plate was not subtracted), in order to show the effect of the
shifting more precisely.
Large displacement testing was affected more by the near-constant pressure. The
difference in the displacement was between 0.15” and 0.32”. The small displacement testing was
affected less. The difference in the displacement was between 0.12” and 0.14”.
6”
12”

33
0.0
2.0
4.0
6.0
8.0
10.0
12.0
2
4
6
8
10
12
14
2 4 6 8 10 12 14
Err
or
(%)
Me
asu
red
De
fle
ctio
n (
in)
Actual Deflection (in)
Measured
Deflection (in)
Error (%)
0.0
0.5
1.0
1.5
2.0
2.5
3.0
3.5
4.0
4.5
3
3.25
3.5
3.75
4
4.25
4.5
4.75
5
3 3.25 3.5 3.75 4 4.25 4.5 4.75 5
Err
or
(%)
Me
asu
red
De
fle
ctio
n (
in)
Actual Deflection (in)
Measured
Deflection (in)
Error (%)
Figure 32. Test I: the effect of near-constant pressure applied on the cable

34
5. Conclusions
Overall, the ZipLevel Pro high-precision model showed excellent performance achieving ±0.01”
(0.254mm) accuracy, or conservatively ±0.02” (0.508mm) accuracy provided that the device was
used under ideal conditions. However, the following conditions could introduce much larger
error. We recommend that the user of the device is aware of the following conditions, even
though the device is relatively rugged and robust.
Cable condition
• The device is sensitive to the cable arrangement. Even when the cable is relatively straight
and lies on a flat surface, ±0.01” (0.254mm) fluctuations in the reading can be introduced.
The fluctuations were slightly higher than the manufacture’s specification of ±0.005”
(0.127mm) precision.
• If there are several bends in the cable run and/or the cable goes up and down due to the
surface condition, the error could be as high as ±0.05” (1.27mm) although it would be rare to
observe such high error. The error due to the cable condition was typically within ±0.02”
(0.508 mm) range.
• Distributed loading of 80 lb/ft applied on the sensor cable reduced the reported displacement
up to 0.33” (8.38mm). For accurate measurement, avoid applying any pressure on the cable.
Rotation of the measurement module and the base module
• Error due to the rotation of the measurement module was 4.5% for a rotation of 44.3°.
• The error was much higher when the base module was rotated. The error for the base module
was 10.6% after a rotation of 44.3°.
• The measurement module reports the displacement around its center, so place the center of
the device where the displacement is to be measured.
Temperature
• If the device is calibrated at a high temperature and used at a lower temperature without re-
calibration, the device will report the displacement smaller than what it should be. If the
device is calibrated at a low temperature and used at a higher temperature without re-
calibration, the device will report the displacement larger than what it should be.
• The error is 0.03” (0.762mm) or less if the temperature difference is 10°F or less.
• The error exponentially increases if the temperature difference is greater than 10°F. For
example, 20°F difference will cause close to 1/4" (6.35mm) error.
Wind
• When the device is subjected to a 20 mph wind, the measurements may have up to 20% error
for a displacement up to 0.5” (up to 15% error for the displacement between 0.5” and 2”), so
avoid using the device under windy conditions. However, when the deflection was greater
than 4” the error was less than 1.5%.

35
Appendix: Raw Data from the Tests
The tables below list the raw data from the tests. A corresponding figure in the main text can be
found by following the test index and the description.
Table 1. Test A: flat surface, large displacement
Displacement (in) Error (%)
Actual Measured
0 0
3.393 3.38 0.383
6.763 6.75 0.192
10.108 10.1 0.079
Table 2. Test A: flat surface, small displacement
Displacement (in) Error (%)
Actual Measured
0 0
0.121 0.13 7.438
0.244 0.25 2.459
0.367 0.37 0.817
0.49 0.5 2.041
0.613 0.62 1.142
0.736 0.74 0.543
0.859 0.87 1.281
0.982 0.99 0.815
1.105 1.11 0.452
1.228 1.24 0.977
1.351 1.36 0.666
1.474 1.49 1.085
Table 3. Test B1, large displacement (measurement module at 5°°°°)
Displacement (in) Error (%)
Actual Measured
0 0
3.371 3.36 0.326
6.763 6.76 0.044
10.158 10.15 0.079

36
Table 4. Test B1, small displacement (measurement module at 5°°°°)
Displacement (in) Error (%)
Actual Measured
0 0
0.123 0.12 2.439
0.246 0.18 26.829
0.369 0.37 0.271
0.492 0.48 2.439
0.615 0.61 0.813
0.738 0.74 0.271
0.861 0.86 0.116
0.984 0.98 0.407
1.107 1.11 0.271
1.23 1.23 0.000
1.353 1.35 0.222
1.476 1.48 0.271
Table 5. Test B2, large displacement (base module at 5°°°°)
Displacement (in) Error (%)
Actual Measured
0 0
3.371 3.39 0.564
6.741 6.75 0.134
10.086 10.14 0.535
37
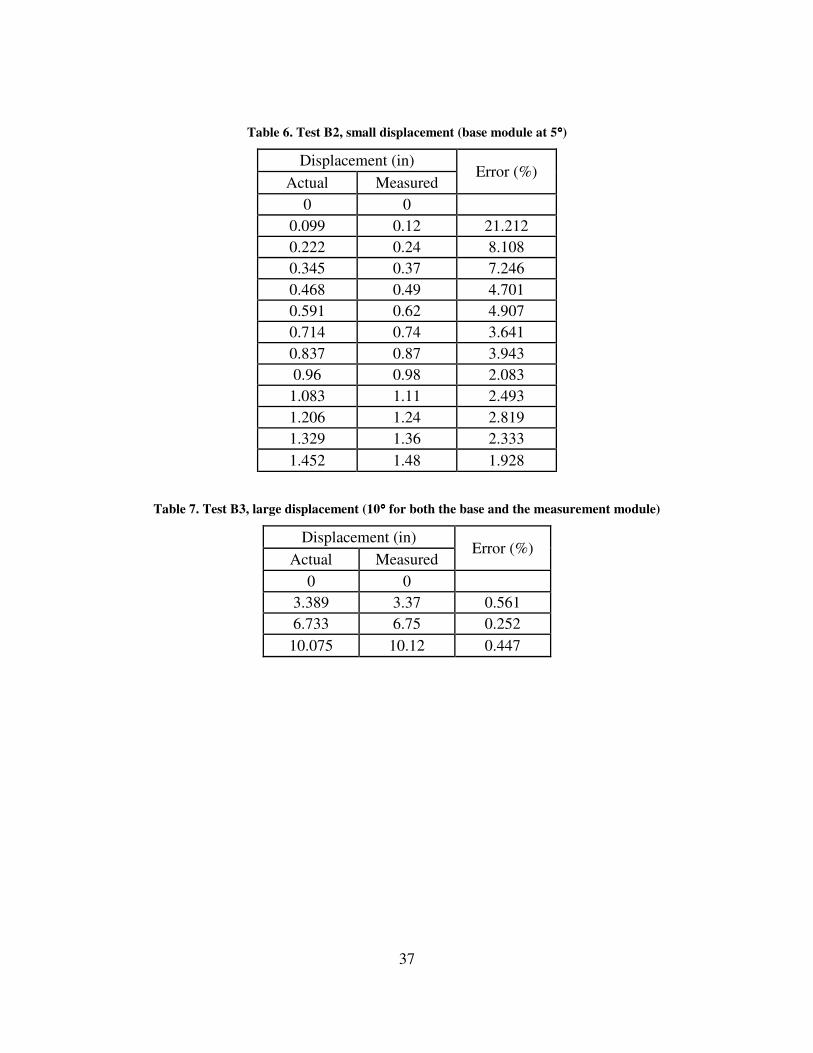
Table 6. Test B2, small displacement (base module at 5°°°°)
Displacement (in) Error (%)
Actual Measured
0 0
0.099 0.12 21.212
0.222 0.24 8.108
0.345 0.37 7.246
0.468 0.49 4.701
0.591 0.62 4.907
0.714 0.74 3.641
0.837 0.87 3.943
0.96 0.98 2.083
1.083 1.11 2.493
1.206 1.24 2.819
1.329 1.36 2.333
1.452 1.48 1.928
Table 7. Test B3, large displacement (10°°°° for both the base and the measurement module)
Displacement (in) Error (%)
Actual Measured
0 0
3.389 3.37 0.561
6.733 6.75 0.252
10.075 10.12 0.447
38
Table 8. Test B3, small displacement (10°°°° for both the base and the measurement module)
Displacement (in) Error (%)
Actual Measured
0 0
0.123 0.13 5.691
0.246 0.25 1.626
0.369 0.37 0.271
0.492 0.49 0.407
0.615 0.61 0.813
0.738 0.72 2.439
0.861 0.85 1.278
0.984 0.97 1.423
1.107 1.09 1.536
1.23 1.23 0.000
1.353 1.35 0.222
1.476 1.47 0.407
Table 9. Test C, rotation of the measurement module
Rotation
angle
Actual
disp.
Measured disp.
(rotated left) Error (%)
Measured disp.
(rotated right) Error (%)
17.0° 4.456 4.44 0.359 4.43 0.583
29.7° 7.549 7.37 2.371 7.35 2.636
44.3° 10.644 10.21 4.077 10.17 4.453
Table 10. Test C, rotation of the base module
Rotation
angle
Actual
disp.
Measured disp.
(rotated left) Error (%)
Measured disp.
(rotated right) Error (%)
17.0° 4.456 4.56 2.334 4.22 5.296
29.7° 7.549 7.29 3.431 7.79 3.192
44.3° 10.644 9.67 9.151 9.52 10.560

39
Table 11. Test D: cantilever testing of three specimens
Displacement (in) Error (%)
Actual Measured
0 0 0.000
0.835 0.77 7.784
1.892 1.8 4.863
2.876 2.78 3.338
3.966 3.86 2.673
4.969 4.91 1.187
5.963 5.92 0.721
Displacement (in) Error (%)
Actual Measured
0 0 0.000
1.031 1.04 0.873
2.055 2.11 2.676
2.973 3.1 4.272
4.17 4.38 5.036
5.8 6.06 4.483
Displacement (in) Error (%)
Actual Measured
0 0 0.000
0.788 0.75 4.822
1.818 1.78 2.090
2.799 2.76 1.393
3.86 3.83 0.777
4.832 4.81 0.455
5.863 5.84 0.392

40
Table 12. Test E: beam slab testing
Displacement (in) Error (%)
Actual Measured
0 0 0.00
0.211 0.18 14.69
0.274 0.25 8.76
0.341 0.3 12.02
0.371 0.41 10.51
0.611 0.55 9.98
0.791 0.74 6.45
0.911 0.85 6.70
1.141 1.05 7.98
1.701 1.57 7.70
2.351 2.14 8.97
2.791 2.54 8.99
3.131 2.84 9.29
3.341 3.04 9.01
3.711 3.44 7.30
Table 13. Test F: temperature effect (20°°°°F reduction in the air temperature), large displacement
Displacement (in)
Actual
Measured
w/o
calibration
Measured
3.142 1.84 3.1
6.535 5.15 6.41
9.905 8.45 9.71
13.25 11.77 13.03

41
Table 14. Test F: temperature effect (20°°°°F reduction in the air temperature), small displacement
Displacement (in)
Actual
Measured
w/o
calibration
Measured
3.142 1.83 3.09
3.263 1.96 3.22
3.386 2.09 3.34
3.509 2.21 3.46
3.632 2.32 3.58
3.755 2.45 3.7
3.878 2.56 3.83
4.001 2.69 3.94
4.124 2.81 4.06
4.247 2.93 4.19
4.37 3.05 4.31
4.493 3.17 4.43
4.616 3.29 4.55
Table 15. Test F: temperature effect (various increases of the device temperature), small displacement
Actual disp.
(in)
Measured disp. (in) under various testing
temperatures. Device was calibrated at 75°F.
85°F 95°F 105°F 115°F
3.142 3.16 3.38 3.49 3.56
3.263 3.29 3.5 3.64 3.7
3.386 3.41 3.62 3.76 3.83
3.509 3.54 3.75 3.89 3.94
3.632 3.66 3.88 4.03 4.07
Table 16. Test G: wind effect, large displacement
Actual
disp.
(in)
0 degree 30 degree 60 degree 90 degree
Measured
(in)
Error
(%)
Measured
(in)
Error
(%)
Measured
(in)
Error
(%)
Measured
(in)
Error
(%)
0 0
0
0
0
3.393 3.36 0.973 3.35 1.267 3.36 0.973 3.37 0.678
6.763 6.74 0.340 6.73 0.488 6.72 0.636 6.72 0.636
10.108 10.11 0.0198 10.1 0.0791 10.1 0.0791 10.11 0.0198

42
Table 17. Test G: wind effect, small displacement
Actual
disp.
(in)
0 degree 30 degree 60 degree 90 degree
Measured
(in)
Error
(%)
Measured
(in)
Error
(%)
Measured
(in)
Error
(%)
Measured
(in)
Error
(%)
0 0 0 0 0
0.121 0.13 7.438 0.12 0.826 0.14 15.702 0.12 0.826
0.244 0.25 2.459 0.25 2.459 0.25 2.459 0.26 6.557
0.367 0.43 17.166 0.37 0.817 0.38 3.542 0.38 3.542
0.49 0.57 16.327 0.5 2.041 0.51 4.082 0.5 2.041
0.613 0.7 14.192 0.63 2.773 0.62 1.142 0.63 2.773
0.736 0.83 12.772 0.75 1.902 0.75 1.902 0.75 1.902
0.859 0.97 12.922 0.88 2.445 0.87 1.281 0.87 1.281
0.982 1.09 10.998 1 1.833 1 1.833 0.99 0.815
1.105 1.23 11.312 1.12 1.357 1.12 1.357 1.21 9.502
1.228 1.36 10.749 1.26 2.606 1.25 1.792 1.24 0.977
1.351 1.47 8.808 1.38 2.147 1.37 1.406 1.36 0.666
1.474 1.6 8.548 1.5 1.764 1.49 1.085 1.49 1.085
Table 18. Test H: cable vibration effect, large displacement
Displacement (in) Error (%)
Actual Measured
0 0
3.393 3.39 0.088
6.763 6.74 0.340
10.108 10.14 0.317
43
Table 19. Test H: cable vibration effect, small displacement
Displacement (in) Error (%)
Actual Measured
0 0
0.121 0.12 0.826
0.244 0.24 1.639
0.367 0.37 0.817
0.49 0.49 0.000
0.613 0.62 1.142
0.736 0.74 0.543
0.859 0.87 1.281
0.982 1 1.833
1.105 1.12 1.357
1.228 1.24 0.977
1.351 1.36 0.666
1.474 1.49 1.085
Table 20. Test I: pressure effect, large displacement
Displacement (in)
Actual Measured Error (%)
3.142 2.82 10.248
6.535 6.39 2.219
9.905 9.67 2.373
13.25 13 1.887

44
Table 21. Test I: pressure effect, small displacement
Displacement (in)
Actual Measured Error (%)
3.142 3.01 4.201
3.263 3.14 3.770
3.386 3.26 3.721
3.509 3.38 3.676
3.632 3.51 3.359
3.755 3.63 3.329
3.878 3.75 3.301
4.001 3.87 3.274
4.124 4 3.007
4.247 4.12 2.990
4.37 4.24 2.975
4.493 4.36 2.960
4.616 4.48 2.946