Embed Size (px)
Citation preview
Evaluation of the ALIZE / LIA_RAL Speaker
Veri�cation Toolkit on an Embedded System
Aitor Hernández López
Technische Universität WienInstitut für Computertechnik (ICT)
February of 2015
Under supervision of
Univ. Prof. Dr. Hermann Kaindland
Dr. Dominik Ertl

Abstract
Text-independent speaker veri�cation is the computing task of verifying a user'sclaimed identity using only characteristics extracted from their voices, regardlessof the spoken text. Nowadays, a lot of speaker veri�cation applications are beingimplemented in software, and using these systems on embedded systems (PDAs, cellphones, integrated computers) multiplies their potential in security, automotive, orentertainment applications, among others. Comprehension of speaker veri�cationrequires a knowledge of voice processing and a high mathematical level. Embed-ded system performance is not the same as o�ered by a workstation. So, in-depthknowledge of the target platform where the system will be implemented and aboutcross-compilation tools necessary to adapt the software to the new platform is re-quired, too. Also execution time and memory requirements have to be taken intoaccount to get a good quality of speaker veri�cation.
In this thesis we evaluate the performance and viability of a speaker veri�cationsoftware on an embedded system. We present a comprehensive study of the toolkitand the target embedded system. The veri�cation system used in this thesis is theALIZE / LIA_RAL Toolkit. This software is able to recognize the identity of aclient previously trained in a database, and works independently of the text spoken.We have tested the toolkit on a 32-bit RISC ARM architecture set computer. Weexpect the toolkit can be ported to comparable embedded system with a reasonablee�ort.
The �ndings con�rm that the speaker veri�cation results on work station are com-parable than in an embedded system. However, time and memory requirements arenot the same in both platforms. Taking into account these results, we propose anoptimization in the speaker veri�cation test to reduce resource requirements.
Resumen
La veri�cación de locutor independiente del texto es la acción de validar la identidadde un usuario usando únicamente características extraidas de su voz, sin tener encuenta el texto pronunciado. Hoy en día, multitud de software de veri�cación delocutor ha sido implementado para funcionar en ordenadores personales, pero usarestas aplicaciones en sistemas embedidos (Smartphones, teléfonos, ordenadores inte-grados) multiplica su potencial en campos como la seguridad, el sector del automóvilu otras aplicaciones de entretenimiento. La comprensión teórica de los sistemas deveri�cación de locutor requiere conocimientos de procesado de voz y un nivel alto dematemática algorítmica. El rendimiento de estos sistemas embedidos no es el mismoque los que ofrecen los ordenadores personales, así que hace falta un conocimientoexhaustivo de la plataforma en la cual se va a integrar la aplicación, así como unconocimiento de las herramientas de compilación cruzadas necesarias para adaptarel software a la nueva plataforma. Los requerimientos de tiempo y memoria tambiéndeben ser tenidos en cuenta para garantizar una buena calidad de veri�cación.
En este proyecto, se evaluará el rendimiento y la viabilidad de un sistema de veri�-cación de locutor integrado en un sistema embedido. Se presenta un estudio exhaus-tivo de las herramientas del software, así como de la plataforma de destino utilizada.El sistema de veri�cación usado en este proyecto ha sido la herramienta ALIZE /LIA_RAL. Este software es capaz de reconocer la identidad de un cliente entrenadocon anterioridad y almacenado en una base de datos, y trabaja independientemen-te del texto pronunciado. El software ha sido testado en una máquina de pruebascon un procesador de 32-bit RISC ARM, pero el sistema podría ser portado a otrossistemas sin problemas añadidos.
Los hallazgos durante el proyecto con�rman que los resultados de la veri�caciónen un sistema embedido son similares a los obtenidos en el PC. Sin embargo, losrequerimientos de tiempo y memoria no son los mismos en las dos plataformas.Teniendo en cuenta estos resultados, se propone una optimización de los parámetrosde con�guración utilizados en el proceso de test para reducir considerablemente losrecursos utilizados.
Contents
Contents i
List of Figures iii
List of Tables iv
1 Introduction 11.1 Objectives of this Master Thesis . . . . . . . . . . . . . . . . . . . . . . . . 21.2 Motivation and Opportunities . . . . . . . . . . . . . . . . . . . . . . . . . 31.3 Working Plan . . . . . . . . . . . . . . . . . . . . . . . . . . . . . . . . . . 31.4 Overview . . . . . . . . . . . . . . . . . . . . . . . . . . . . . . . . . . . . . 4
2 Background and State-of-the-Art 52.1 Biometrics and Speaker Recognition . . . . . . . . . . . . . . . . . . . . . . 52.2 The Automatic Speaker Recognition . . . . . . . . . . . . . . . . . . . . . 62.3 Embedded Systems . . . . . . . . . . . . . . . . . . . . . . . . . . . . . . . 112.4 Speaker Veri�cation on Embedded Systems . . . . . . . . . . . . . . . . . . 13
3 The Process of Speaker Veri�cation 153.1 Overview . . . . . . . . . . . . . . . . . . . . . . . . . . . . . . . . . . . . . 153.2 Signal Processing and Feature Extraction . . . . . . . . . . . . . . . . . . . 163.3 Training Phase . . . . . . . . . . . . . . . . . . . . . . . . . . . . . . . . . 173.4 Testing Phase . . . . . . . . . . . . . . . . . . . . . . . . . . . . . . . . . . 193.5 Making the Decision . . . . . . . . . . . . . . . . . . . . . . . . . . . . . . 20
4 ALIZE Library and LIA-RAL Toolkit 224.1 Overview . . . . . . . . . . . . . . . . . . . . . . . . . . . . . . . . . . . . . 224.2 ALIZE Library . . . . . . . . . . . . . . . . . . . . . . . . . . . . . . . . . 234.3 LIA_RAL Toolkit . . . . . . . . . . . . . . . . . . . . . . . . . . . . . . . 254.4 SPro4 Toolkit Features Extraction . . . . . . . . . . . . . . . . . . . . . . 27
5 Open Embedded as Operating System 295.1 Embedded System Environment . . . . . . . . . . . . . . . . . . . . . . . 295.2 Angstrom as Operating System . . . . . . . . . . . . . . . . . . . . . . . . 305.3 Cross-compilation of the Speaker Veri�cation System . . . . . . . . . . . . 31
6 Con�guration of ALIZE / LIA_RAL 35
i

6.1 Shell-script Compilation . . . . . . . . . . . . . . . . . . . . . . . . . . . . 356.2 Con�guration Parameters . . . . . . . . . . . . . . . . . . . . . . . . . . . 376.3 Performance Optimization . . . . . . . . . . . . . . . . . . . . . . . . . . . 39
7 Tests and Results 417.1 The ELSDSR Database . . . . . . . . . . . . . . . . . . . . . . . . . . . . 417.2 Setting up the Test Environment . . . . . . . . . . . . . . . . . . . . . . . 427.3 Performing the Test . . . . . . . . . . . . . . . . . . . . . . . . . . . . . . . 427.4 Results . . . . . . . . . . . . . . . . . . . . . . . . . . . . . . . . . . . . . . 43
8 Discussion 49
9 Conclusion and Outlook 509.1 Conclusion . . . . . . . . . . . . . . . . . . . . . . . . . . . . . . . . . . . . 509.2 Outlook . . . . . . . . . . . . . . . . . . . . . . . . . . . . . . . . . . . . . 50
Bibliography 52
A SD Formatting code 54
B Optimal ALIZE / LIA_RAL parameters 56
ii

List of Figures
1.1 Three main types of information transmitted in a speech signal. . . . . . . . . 2
2.1 Di�erent types of biometrics. . . . . . . . . . . . . . . . . . . . . . . . . . . . 52.2 R and R2
graph Gauss distributions. http://www.it.lut.�/project/gmmbayes/ . 82.3 A Gaussian Mixture Model in R with three components. . . . . . . . . . . . . 92.4 Examples of commercially available embedded devices. . . . . . . . . . . . . . 12
3.1 Block diagram of MFCC acquisition. . . . . . . . . . . . . . . . . . . . . . . . 173.2 UBM model and client data alignment. . . . . . . . . . . . . . . . . . . . . . . 183.3 DET example of Speaker Recognition system. . . . . . . . . . . . . . . . . . . 21
4.1 ALIZE and LIA_RAL distribution. The LIA_RAL package is based on AL-IZE low-level library, and contains all the methods used in this master thesis. 23
5.1 An exemplary BeagleBoard B5, used in this master thesis. . . . . . . . . . . . 305.2 Using the BeagleBoard. . . . . . . . . . . . . . . . . . . . . . . . . . . . . . . 315.3 Main distribution of GNU Autotools. . . . . . . . . . . . . . . . . . . . . . . 33
7.1 False Rejections (left) and False Acceptances (right) curves for 1024 Gaussians. 437.2 Equal Error Rate point in the 1042 GMM test. . . . . . . . . . . . . . . . . . 447.3 Recognition performance for each GMM count on ELSDSR data set using 15
world iterations. . . . . . . . . . . . . . . . . . . . . . . . . . . . . . . . . . . 45
iii
List of Tables
2.1 Most common biometric technologies. . . . . . . . . . . . . . . . . . . . . . . . 6
6.2 Common con�guration parameters. . . . . . . . . . . . . . . . . . . . . . . . . 386.3 Normalization con�guration parameters. . . . . . . . . . . . . . . . . . . . . . 396.4 Training con�guration parameters. . . . . . . . . . . . . . . . . . . . . . . . . 396.5 Testing con�guration parameters. . . . . . . . . . . . . . . . . . . . . . . . . . 40
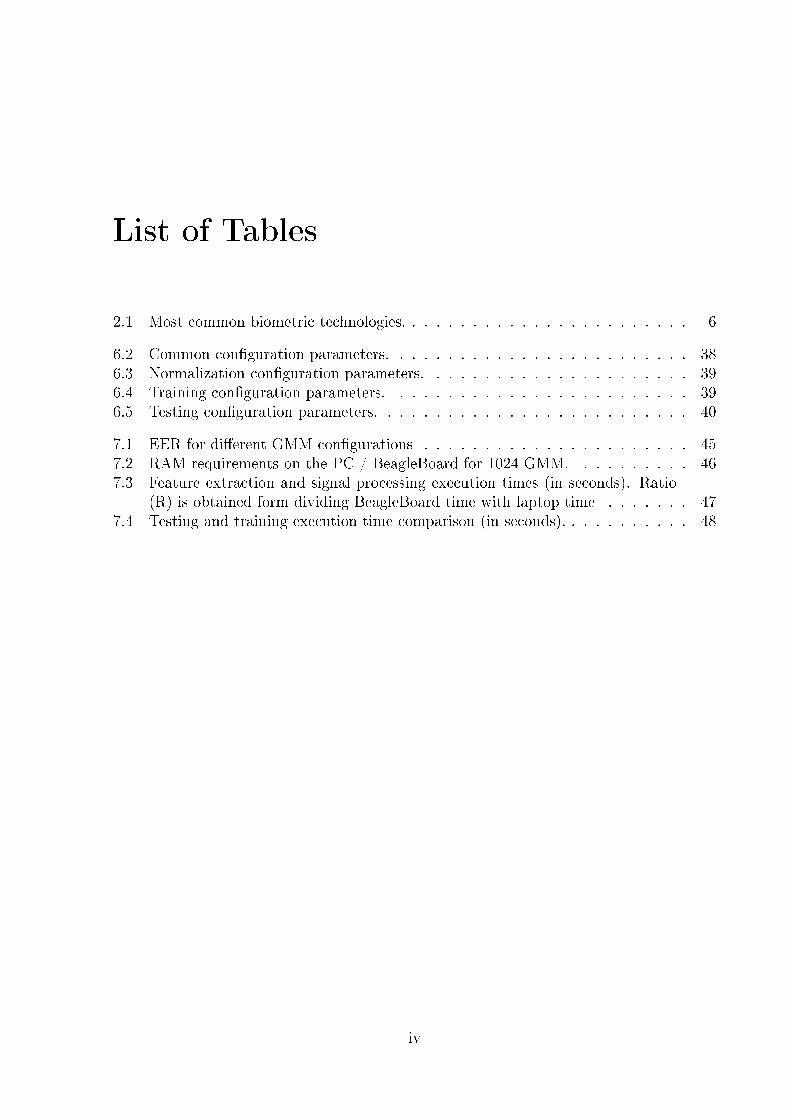
7.1 EER for di�erent GMM con�gurations . . . . . . . . . . . . . . . . . . . . . . 457.2 RAM requirements on the PC / BeagleBoard for 1024 GMM. . . . . . . . . . 467.3 Feature extraction and signal processing execution times (in seconds). Ratio
(R) is obtained form dividing BeagleBoard time with laptop time . . . . . . . 477.4 Testing and training execution time comparison (in seconds). . . . . . . . . . . 48
iv


Este trabajo va dedicado con mucho cariño a mis padres y a mi hermana,por su tenacidad y su apoyo encomiable durante la realización de este largoy duro proyecto. También a Dominik, por su paciencia durante mi estancia
en Viena, a mis amigos, y a toda la gente que de alguna manera u otraforma parte de mi vida.
Chapter 1
Introduction
In our everyday lives there are many types of interfaces for human-computer interaction,for instance: graphical user interfaces, speech interfaces, etc. However, amongst thesetypes, speech input is regarded as a very powerful form because of its rich character.Among the context of spoken input (words), rich character also refers to gender, attitude,emotion, health situation and identity of a speaker. Such information is very important foran e�cient communicative interaction between humans and gains importance for human-computer interaction (HCI).
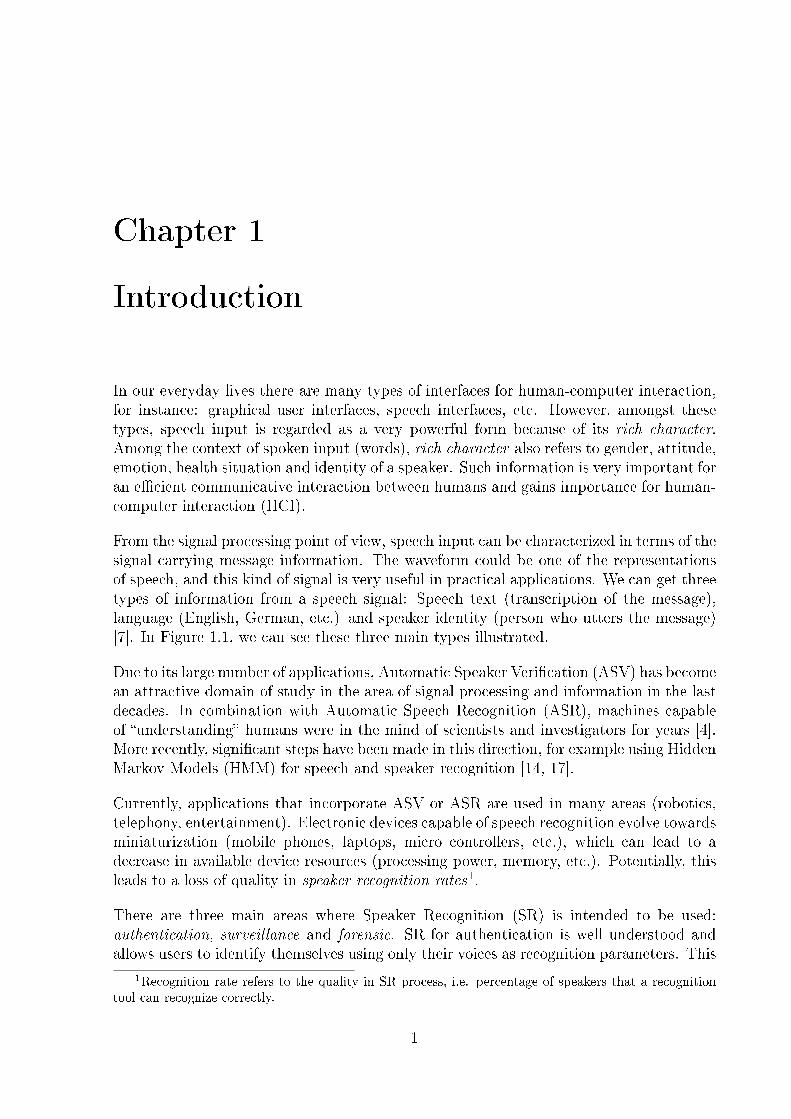
From the signal processing point of view, speech input can be characterized in terms of thesignal carrying message information. The waveform could be one of the representationsof speech, and this kind of signal is very useful in practical applications. We can get threetypes of information from a speech signal: Speech text (transcription of the message),language (English, German, etc.) and speaker identity (person who utters the message)[7]. In Figure 1.1, we can see these three main types illustrated.
Due to its large number of applications, Automatic Speaker Veri�cation (ASV) has becomean attractive domain of study in the area of signal processing and information in the lastdecades. In combination with Automatic Speech Recognition (ASR), machines capableof �understanding� humans were in the mind of scientists and investigators for years [4].More recently, signi�cant steps have been made in this direction, for example using HiddenMarkov Models (HMM) for speech and speaker recognition [14, 17].
Currently, applications that incorporate ASV or ASR are used in many areas (robotics,telephony, entertainment). Electronic devices capable of speech recognition evolve towardsminiaturization (mobile phones, laptops, micro controllers, etc.), which can lead to adecrease in available device resources (processing power, memory, etc.). Potentially, thisleads to a loss of quality in speaker recognition rates1.
There are three main areas where Speaker Recognition (SR) is intended to be used:authentication, surveillance and forensic. SR for authentication is well understood andallows users to identify themselves using only their voices as recognition parameters. This
1Recognition rate refers to the quality in SR process, i.e. percentage of speakers that a recognitiontool can recognize correctly.
1

Figure 1.1: Three main types of information transmitted in a speech signal.
Speech text, language and identity of speaker are the three main recognition�elds of any speech input.
can be more e�cient than carrying keys or memorizing PIN codes. SR for surveillance mayhelp one to �lter a high amount of data, for example telephone or radio conversations. SRin forensic can help one to prove the identity of a recorded voice and can help to convicta criminal or discharge an innocent person in court.
When using such applications, one might not want to carry a laptop or a desktop system,which makes an embedded device suited as an underlying platform. Accordingly, oneimportant challenge is to get su�cient performance of a given system having a set ofresource constraints.
In this master thesis, we analyze, improve and test the voice processing and speakerrecognition software ALIZE / LIA_RAL. The ALIZE library is a set of algorithms forautomatic speaker recognition. LIA_RAL is the application that uses the ALIZE library.
The main goal of this work is to evaluate this software to analyze, improve and testits performance in an embedded system, and to compare the system results with thoseobtained on a laptop. Finally, we present an optimization of the source code, to get thesame results with less time and processing requirements on both platforms.
1.1 Objectives of this Master Thesis
This thesis studies a speaker veri�cation software that is ported on an embedded device.The main objectives are:
2

� To study the historical perspectives and current research in the �eld of speakerveri�cation software on embedded devices.
� To analyze the structure of a speaker veri�cation system, speci�cally the ALIZE /LIA_RAL software.
� To choose a proper operative system and cross-compiling tools to port this softwareto an embedded device.
� To analyze performance results on an embedded device, and to compare it with theresults obtained with a laptop.
� To present and improve source code of the ALIZE/ LIA_RAL software to get asolution with a better performance.
� To analyze the results after improving the software, and to compare them withprevious iterations, as well as with the results from a laptop.
1.2 Motivation and Opportunities
Theory and practice of speaker recognition have improved recently. Systems capable ofgetting recognition results with error rates close to 0%, almost in real time, can be achievedtoday with low e�ort. The idea of porting such recognition systems on embedded devicesincreases signi�cantly the range of applications and opportunities of speech technologies.
There are several embedded veri�cation systems, in addition to many other non-integratedsystems [20]. ALIZE / LIA_RAL software has never been ported and tested in such anintegrated system. Taking into account the good results of the PC version, we study itsperformance on an embedded system.
1.3 Working Plan
The working plan followed during this master thesis is in chronological order:
� Studying speech processing and speaker recognition documentation.
� Gaining in-depth-knowledge of the embedded systems and cross-compilation tools.
� Understanding, compiling and testing of ALIZE / LIA_RAL software on a laptop.
� Cross-compiling and porting of the software to an embedded system.
� Testing of the results on an embedded system and compraising with the results fromthe laptop.
� Improving the source code, analyzing the new results, and comparing them againwith the laptop results.
3

1.4 Overview
The material of this thesis is arranged into nine chapters as follows:
� Chapter 1 introduces the work and gives a brief description of speaker veri�cation.
� Chapter 2 Presents background state-of-the-art of the speaker veri�cation systems,as well as speech processing on embedded systems.
� Chapter 3 describes the four principle steps of the speaker veri�cation process:Feature extraction, training stage, testing stage and decision making.
� Chapter 4 presents the tools ALIZE and LIA_RAL and describes them in detail.
� Chapter 5 explains the embedded device used in this master thesis, its principlefeatures and the cross-compilation process.
� Chapter 6 explains di�erent improvements used to optimize performance.
� Chapter 7 describes the setup of data used on testing and summarizes the resultsobtained before and after the improvements.
� Chapter 8 discusses the speaker veri�cation results that we gained from the embed-ded and laptop systems.
� Chapter 9 concludes this master thesis and provides an outlook.
4
Chapter 2
Background and State-of-the-Art
In this section, we present background information and the state-of-the-art of speakerveri�cation. First, we introduce biometrics concept. Then, we explain speech processingand speaker recognition, as well as embedded systems state-of-the-art. Finally, we explainspeci�c works on speaker veri�cation. Due to the huge research e�ort in this �eld, weonly consider SV work on embedded systems related to this master thesis.
2.1 Biometrics and Speaker Recognition
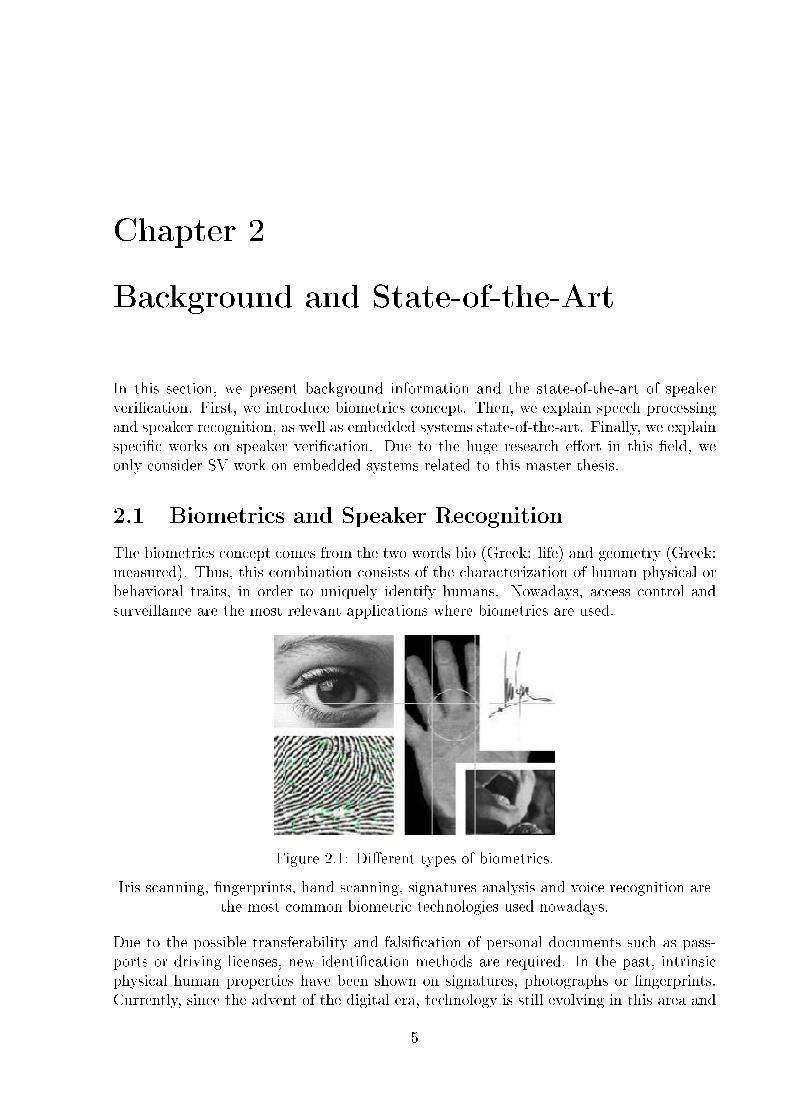
The biometrics concept comes from the two words bio (Greek: life) and geometry (Greek:measured). Thus, this combination consists of the characterization of human physical orbehavioral traits, in order to uniquely identify humans. Nowadays, access control andsurveillance are the most relevant applications where biometrics are used.
Figure 2.1: Di�erent types of biometrics.
Iris scanning, �ngerprints, hand scanning, signatures analysis and voice recognition arethe most common biometric technologies used nowadays.
Due to the possible transferability and falsi�cation of personal documents such as pass-ports or driving licenses, new identi�cation methods are required. In the past, intrinsicphysical human properties have been shown on signatures, photographs or �ngerprints.Currently, since the advent of the digital era, technology is still evolving in this area and
5

these characteristics are now based on mathematical mechanisms of recognition, capableof automatically making comparisons between two photographs, voices, or �ngerprints(Figure 2.1) from several features or line drawings on the human features. Table 2.1compares important parameters of wide-spreaded biometric techniques.1. Although thesetechnologies work properly, human characteristics can be altered, damaged or even elim-inated.
Technology CostE�ective
Ease ofUse
SpecialHardware
Requirement
LowMaintenance
Costs
Fingerprints Yes Yes Yes No
Hand Geometry No Yes Yes No
Voice Veri�cation Yes Yes No Yes
Iris Scanning No No Yes No
Facial Recognition Yes Yes Yes No
Table 2.1: Most common biometric technologies.
Table extracted from http://nextdoornerd.blogspot.com.es/2010/03/cheap-safe-biometric-technology-voice.html.
2.2 The Automatic Speaker Recognition
Voice messages typically provide more information than the message itself. Voice messagescan provide us more information than a written one. For example, the speaker's sex,age, mood, or environmental conditions are factors that can be extracted from a voicemessage. This extra data, which is independent of the message, can bring us credibilityof the message, the authenticity of the speaker, or many other message properties.
Thanks to the advancements of our electronic and software technology, two �elds of re-search have received more attention in recent years due to the advances in computationalspeed: Speech recognition and speaker recognition. The �rst is the art of obtaining thetranscript of the message, i.e., what the speaker is saying. In this process, the systemshould ignore age, voice, or the speaker's sex and has to focus on the message content.The second, speaker recognition, determines who is speaking, ignoring the message con-tent. Now, age, dialect or voice tone have to be taken into account, because they can helpto identify the speaker and they can help us with the recognition. In both cases, environ-mental factors, such as noise or the quality of the recordings, can adversely in�uence theoutcome of the process and have to be taken into account.
There are two types of speaker recognition, depending on the delivered message, namelytext-dependent and text-independent recognition. Speaker identi�cation combines speechrecognition with speaker recognition. A speaker identi�cation system requires a speaker
1�http://nextdoornerd.blogspot.com/�
6
to pronounce a given text, with which it will have carried out the training process. Forsecurity applications, a user can log in using a voice password. Text-independent sys-tems are able to identify a trained speaker from a di�erent message compared to thetesting message. Nowadays, most of the research focuses on speaker recognition for text-independent systems, which allows one a much broader scope. Being text-independentallows one to perform SR on surveillance or access control applications that do not requirea concrete statement of text.
Theory of Speaker Veri�cation
Speaker recognition has two main �elds: Speaker identi�cation and speaker veri�cation.Speaker identi�cation allows one to identify a concrete voice from a list of potentialcustomers belonging to a database. It answers the question: �Who is speaking?�. Speakerveri�cation compares a voice message with a particular customer and accepts or rejectsit based on the score. Now, the system can answer the question: �Did the speaker utterthis segment?�. In the following, we describe speaker veri�cation in more detail.
Nowadays, the widely used technological bases for speaker veri�cation are:
� Hidden Markov Models (HMM): Take each client as a Markov model.
� Gaussian Mixture Models (GMM): Use a Gaussian sum distribution to model eachhuman.
A HMM is a statistical method which assumes that the system model is a Markov processof unknown parameters. The main goal is to determine the unknown parameters (orhidden, hence the name) of the chain from the observable parameters. The extractedparameters can be used to carry out subsequent analysis. It is very common to use HMMin pattern recognition applications [17, 15].
HMMs are commonly used at the level of phonemes2, each using them to create an HMM.Essentially, a state machine is created and it uses audio frames to determine the probabil-ity of the next state. In text-dependent systems, a concrete phoneme is expected. Here,a comparison process between a speech segment and a model is more precise. However,Rabiner et al. [16] probed that GMM are more e�cient than HMM in text-independentsystems. GMM are a parametric probability density function represented as a weightedsum of Gaussian component densities [15]. GMM will be explained in detail below.
In addition to the above techniques, there are others such as neural networks or "supportvector machines", that are still under investigation in the �eld of speaker recognition asshown in [19].
2Any of the distinct units of sound that distinguish one word from another.(http://www.wordreference.com/de�nition/phoneme)
7
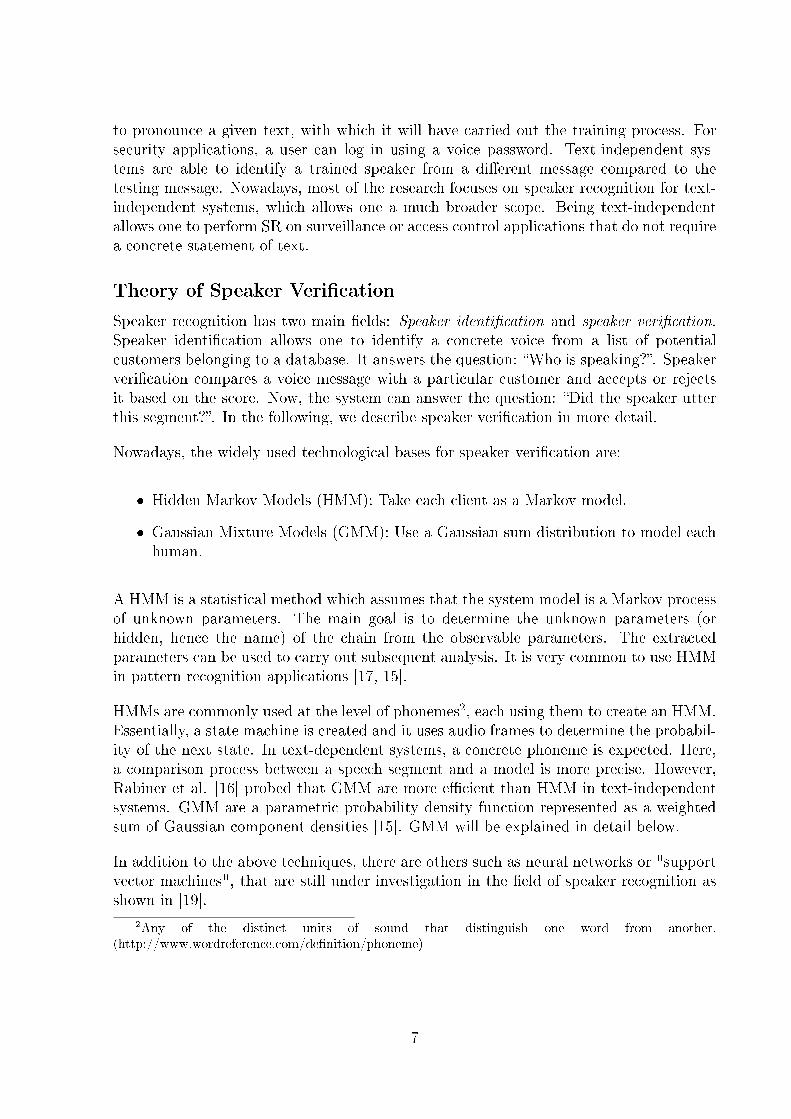
Figure 2.2: R and R2graph Gauss distributions. http://www.it.lut.�/project/gmmbayes/
Gaussian distribution is one of the most common probability density function andmodels many natural, social or psychological events.
Gaussian Mixture Models
In the last decade, GMMs have dominated text-independent speaker recognition systems.This kind of approximation is appropriate for such tasks, because it does not considerthe text said, but exploits the spectral voice features to discriminate between speakers.The use of GMMs in text-independent speaker recognition has been described �rst in thework of Reynolds and Rose [9]. Since then, systems based on GMMs appeared in manypublications and numerous conference and are also used in the annual competitions of theNational Institute of Standards and Technology (NIST).
In the �eld of statistics and probability, a Gauss distribution is the most common continueprobability distribution3 that can appear in real world. The graph of the associatedprobability density function is "bell"-shaped, and is known as Gauss bell, as shown inFigure 2.2.
Given a speech segment X and speaker S, the goal of speaker veri�cation is to determine ifspeaker S generated X. This can be formalized as a hypothesis test between the followingbasic assumptions: H0: X was pronounced by the speaker S. H1: X was not pronouncedby the speaker S.
P (X|Ho)P (X|H1)
{≥ ϑ accept Ho
< ϑ reject Ho
where P (X|Hi), i = 0, 1 is the probability of hypothesis Hi evaluated for a particularvoice segment. ϑ is the decision threshold for accepting or rejecting H0. Theoreticallyit should be 0, but in practical applications it is interesting to adjust the threshold to
3The probability distribution of a random variable is a function that assigns to each event randomvariable de�ned on the probability that the event occurs.
8
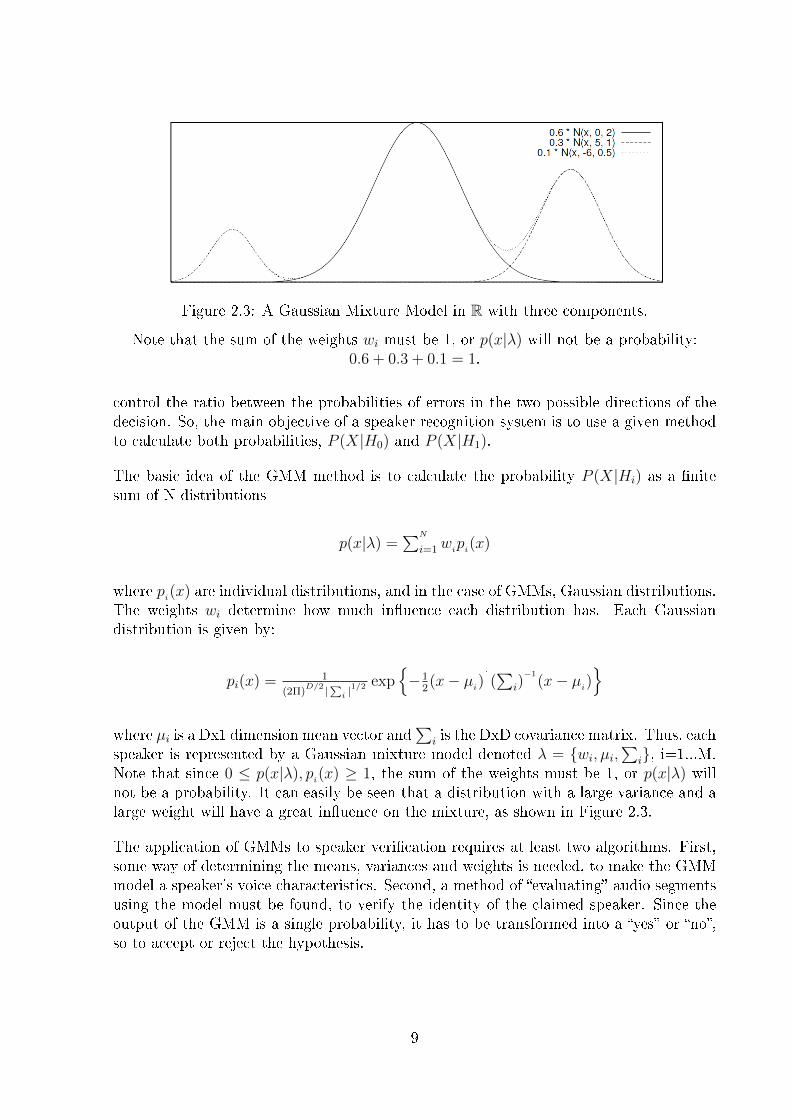
Figure 2.3: A Gaussian Mixture Model in R with three components.
Note that the sum of the weights wi must be 1, or p(x|λ) will not be a probability:0.6 + 0.3 + 0.1 = 1.
control the ratio between the probabilities of errors in the two possible directions of thedecision. So, the main objective of a speaker recognition system is to use a given methodto calculate both probabilities, P (X|H0) and P (X|H1).
The basic idea of the GMM method is to calculate the probability P (X|Hi) as a �nitesum of N distributions
p(x|λ) =∑N
i=1wipi(x)
where pi(x) are individual distributions, and in the case of GMMs, Gaussian distributions.
The weights wi determine how much in�uence each distribution has. Each Gaussiandistribution is given by:
pi(x) = 1
(2Π)D/2 |
∑i |
1/2 exp{−1
2(x− µ
i)´
(∑
i)−1
(x− µi)}
where µi is a Dx1 dimension mean vector and∑
i is the DxD covariance matrix. Thus, eachspeaker is represented by a Gaussian mixture model denoted λ = {wi, µi,
∑i}, i=1...M.
Note that since 0 ≤ p(x|λ), pi(x) ≥ 1, the sum of the weights must be 1, or p(x|λ) will
not be a probability. It can easily be seen that a distribution with a large variance and alarge weight will have a great in�uence on the mixture, as shown in Figure 2.3.
The application of GMMs to speaker veri�cation requires at least two algorithms. First,some way of determining the means, variances and weights is needed, to make the GMMmodel a speaker's voice characteristics. Second, a method of �evaluating� audio segmentsusing the model must be found, to verify the identity of the claimed speaker. Since theoutput of the GMM is a single probability, it has to be transformed into a �yes� or �no�,so to accept or reject the hypothesis.
9
Expectation Maximization Method
The most common technique for training the models in speaker recognition is by using anExpectation Maximization (EM) algorithm [2]. The purpose of the EM algorithm is torede�ne the mixture parameters to increase the likelihood of the generated feature vector 4
X, given model λ:
p(X|λk+1) ≥ p(X|λk
)
In the area of speaker recognition, the EM-algorithm needs a given likelihood or an aposteriori probability to be a complete algorithm. Thus, in statistical terms, the EM-algorithm is one way of �nding the maximum likelihood (ML) or maximum-a-posterioriprobability (MAP) to estimate the data of a hypothesis. For the purpose of this masterthesis are both MAP and ML variants of the EM-algorithm for GMMs needed. However,the derivation of the equations is very intricate, and the reader is referred to Bilmes [5]for the ML-version of the algorithm, and to the work provided by Reynolds et al. [8] forderivations of the MAP-version.
Speaker Veri�cation Toolkits
In this subsection, we will presenta popular non-commercial software products used forSpeaker Veri�cation (SV). Note that there is a huge number of payment software toolkitsfor this purpose, but we will compare ALIZE / LIA_RAL only with open source softwaretoolkits.
ALIZE/LIA_RAL is an open-source platform for biometric authentication with theGPL license, used speci�cally for speaker or speech recognition. This software wascreated in the Mistral project5 at the University of Avignon, France. This projectis divided into the ALIZE library and the high-level LIA_RAL toolkit [12].
ALIZE contains all needed functions to use Gaussian mixtures and speech process-ing.
The ALIZE project was created under supervision of the ELISA consortium6. Itpretended to share and update all SR research projects in France in order to createa strong and free common speaker recognition software. According to the documen-tation [12], the main objectives of ALIZE are:
� To propose a toolkit making for faster development of new ideas, with a(proved) state-of-the-art level of performance.
4N-dimensional vector of numerical features that de�nes an object. In speech processing, �object� isreferred to part of a recording, or speech segment.
5http://mistral.univ-avignon.fr/index_en.html6http://elisa.ddl.ish-lyon.cnrs.fr/
10

� To encourage laboratories and research groups to evaluate new proposals usingthe toolkit and both standard databases and protocols like NIST SRE7 ones.
� To help the understanding of speaker recognition algorithms (like EM training,MAP adaptation or Viterbi algorithm 8), parameters and limits.
� To test new commercial speaker or speech recognition applications.
� To facilitate the knowledge transfer between the academic labs and betweenacademic labs and companies.
LIA_RAL (Laboratoire Informatique d'Avignon Recognizer Architecture Library)is a speaker veri�cation toolkit that uses all low-level functions of the ALIZElibrary. The LIA_RAL is commonly used for speaker recognition purposes,but it can be also used in the �eld of speech recognition.
LIA_RAL toolkit is divided into the packages Spk_Tools, Spk_Utils, and Spk_Det.In this thesis, however, only Spk_Det is used. It contains those components thatare required by a biometric authentication system. The purpose of LIA_RAL is towrap all algorithms in programs that can be run from a shell script.
Both, ALIZE and LIA_RAL, are implemented in C++and will be further explainedin Chapter 4.
HTK (Hidden Markov Model Toolkit) is a well-known open-source toolkit used for speechand speaker recognition9. It was developed by the Speech Vision and RoboticsGroup of the Cambridge University Engineering Department (CUED) where it hasbeen used to build CUED's large vocabulary speech recognition systems. HTK isa portable software for the manipulation of Hidden Markov Models used primaryfor speech recognition, although it has been used in many kinds of signal process-ing modules that include Markov models manipulation (speech synthesis, speakerrecognition, image processing,...) as well.
MARF (Modular Audio Recognition Framework)10 is a collection of speech, sound, textand language processing algorithms written in Java. A lot of applications havebeen created using MARF as main library, for example: Math Testing Application,Language Identi�cation Application, Arti�cial Neural Network Testing Applicationor Text-Independent Speaker Identi�cation Application, among others11.
2.3 Embedded Systems
An embedded system is a device designed to perform one or more dedicated functions,often in a real-time computer system. Broadly speaking, we can de�ne an embedded
7http://www.itl.nist.gov/iad/mig/tests/sre/8The Viterbi algorithm is a dynamic programming algorithm for �nding the most likely sequence of
hidden states � called the Viterbi path � that results in a sequence of observed events, especially in thecontext of Markov information sources and hidden Markov models.
9http://htk.eng.cam.ac.uk/10http://marf.sourceforge.net/11http://marf.sourceforge.net/#releases-dev
11
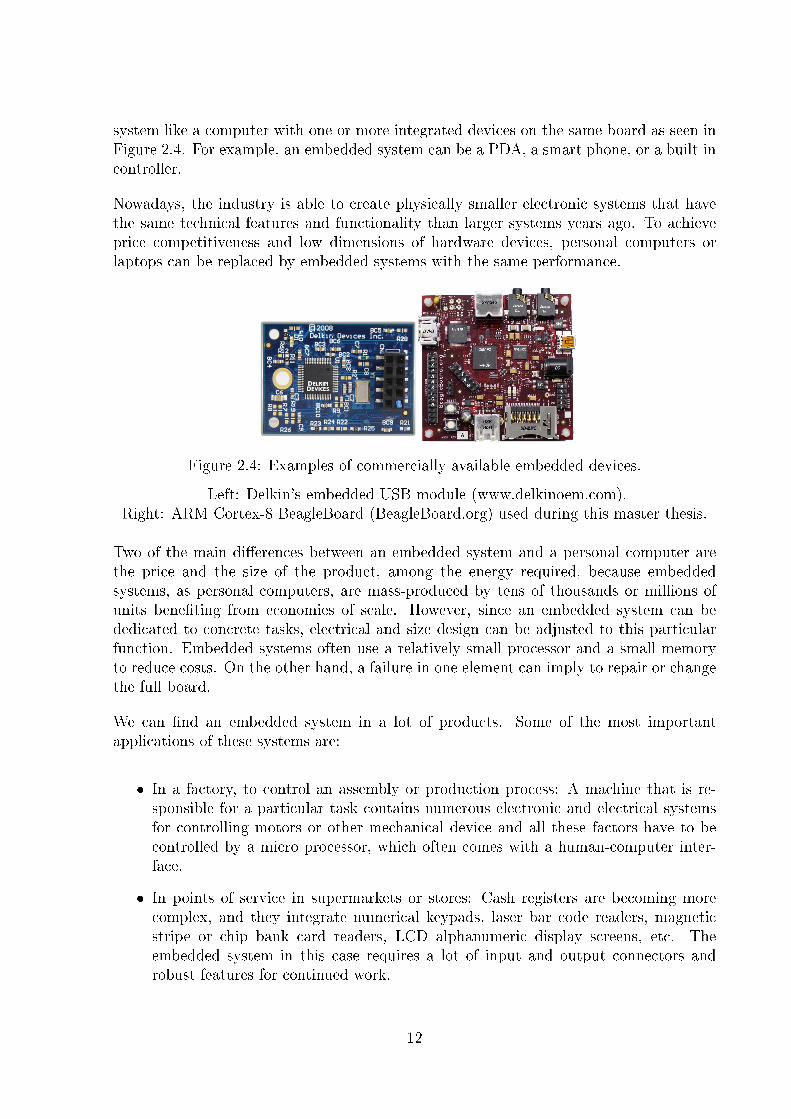
system like a computer with one or more integrated devices on the same board as seen inFigure 2.4. For example, an embedded system can be a PDA, a smart phone, or a built-incontroller.
Nowadays, the industry is able to create physically smaller electronic systems that havethe same technical features and functionality than larger systems years ago. To achieveprice competitiveness and low dimensions of hardware devices, personal computers orlaptops can be replaced by embedded systems with the same performance.
Figure 2.4: Examples of commercially available embedded devices.
Left: Delkin's embedded USB module (www.delkinoem.com).Right: ARM Cortex-8 BeagleBoard (BeagleBoard.org) used during this master thesis.
Two of the main di�erences between an embedded system and a personal computer arethe price and the size of the product, among the energy required, because embeddedsystems, as personal computers, are mass-produced by tens of thousands or millions ofunits bene�ting from economies of scale. However, since an embedded system can bededicated to concrete tasks, electrical and size design can be adjusted to this particularfunction. Embedded systems often use a relatively small processor and a small memoryto reduce costs. On the other hand, a failure in one element can imply to repair or changethe full board.
We can �nd an embedded system in a lot of products. Some of the most importantapplications of these systems are:
� In a factory, to control an assembly or production process: A machine that is re-sponsible for a particular task contains numerous electronic and electrical systemsfor controlling motors or other mechanical device and all these factors have to becontrolled by a micro processor, which often comes with a human-computer inter-face.
� In points of service in supermarkets or stores: Cash registers are becoming morecomplex, and they integrate numerical keypads, laser bar code readers, magneticstripe or chip bank card readers, LCD alphanumeric display screens, etc. Theembedded system in this case requires a lot of input and output connectors androbust features for continued work.
12
� In aircraft radars: Processing a signal from an aircraft radar requires high computingpower, small dimensions and small weight. Also, it has to be robust enough for workon extreme conditions, like high or low temperature, low atmospheric pressure,vibrations, etc.
� In automotive technology: A car can include hundreds of microprocessors and mi-cro controllers that control ignition, transmission, power steering, anti-lock brakessystem (ABS), traction, etc. All this functionality is integrated in embedded devices.
In this master thesis, we will use the ARM Cortex BeagleBoard embedded system. TheBeagleBoard is an open-source low-cost low-power device, based on the ARM Cortex-A8chip. We depict such a BeagleBoard in Figure 2.4 (right). The board is designed anddeveloped by Texas Instruments in association with Digi-Key.
The main purpose of the BeagleBoard project is to achieve a small, low-cost, expandableand powerful computer. BeagleBoard software is not a �nished project. It is an �indevelopment� project under the Creative Commons license, without o�cial support exceptcommunity forums or wiki pages12.
A BeagleBoard has a lot of interfaces: USB, HDMI, Ethernet, MicroSD, JTAG or cameraperipheral connections.The Linux system is the prefered operative system, so it can beused for many applications. In Chapter 5, we will discuss the BeagleBoard features indetail, and how we use the board in this master thesis.
2.4 Speaker Veri�cation on Embedded Systems
As explained above, embedded systems o�er a lot of opportunities. In the �eld of signalprocessing, embedded system also allow one to design compact and cheap systems formany purposes. In this master thesis, we will port the software of a speaker veri�cationsystem to an embedded system software. It means, the embedded system can do the samework as performed with a laptop, like to process audio signal, to train clients and to testclients.
Speaker Veri�cation technology in embedded systems will face the following issues andchallenges:
1. An embedded system is commonly limited to a single microphone of the device, sothe system has to be adapted to the environment. Some experiments used two orthree microphones in the same embedded system, but it a�ects CPU consumption.In contrast, with laptops or personal computers, we can work with two or moremicrophones, as well as microphone arrays.
2. Models of speakers are typically stored on an extra device, like a smart card. De-pending on the application of the system, the virtual size of this extra storage devicecan be an issue. In our case it will not be an issue, because the BeagleBoard has anSD card slot.
12http://elinux.org/BeagleBoard
13

3. Computational power and memory are typically lower. Embedded systems are oftendesigned to be low-cost boards, so the micro processor power is not comparable withthe power of a laptop. For example, with overclocking an ARM Cortex v8 ( the CPUin BeagleBoard) we can get 1GHz clock frequenc. Meanwhile, a common midrangeCPU in laptop or PC can work above 3 GHz easily. Moreover, BeagleBoard isa closed hardware package with 128 MB LPDDR RAM; in laptops or personalcomputers, we are working with 4 or 8 GB.
A lot of signal processing research projects try to port speci�c software to embeddedsystems because such systems o�er a lot of opportunities. In recent years, several projectsare focused on audio processing on embedded systems. Speci�cally, two projects areclosely related to our thesis: the TIESr Speech Recognition13 project and the WatsonResearch Project on Speaker Veri�cation in Embedded Environments [3].
The TI Embedded Speech Recognizer (TIesr) is a �xed-point recognizer written in C++and C. It is designed to balance resource usage, robustness to environment, and per-formance. It has a simple and easy-to-use user interface. This makes it an excellentrecognizer for developing a wide variety of voice-enabled embedded applications. TIesris a medium-sized phonetic-based recognizer that can accommodate a vocabulary of upto several hundred words. The words and phrases to be recognized can be dynamicallychanged by an application. The latest TIesr project release comes with general Englishlanguage support, and tools to develop the support for other languages. TIesr has beentested on some Linux OS platforms, including the BeagleBoard and several OMAP EVMboards (35x, L138, Zoom), as well as platforms running Windows and Windows Mobile.
This project helps us to understand how a speech processing software has to be adaptedto be able to run on a BeagleBoard. We also contacted Lorin Netsch, the TIesr projectmanager from Texas Instruments for questions about cross-compilations tools of the Bea-gleBoard.
In the Watson Research SV on the ES project, a low-resource, text-independent speakerveri�cation (SV) system with an e�cient voice model compression technique is described,including its implementation exclusively with integer arithmetic. The authors describeand discuss the individual algorithmic steps, the integer implementation issues and itserror analysis. The performance of the system is evaluated with data collected via iPaqdevices and the work discusses the impact of the model compression as well as integerapproximation on the accuracy.
13https://gforge.ti.com/gf/project/tiesr/
14

Chapter 3
The Process of Speaker Veri�cation
Before we explain the ALIZE / LIA_RAL software in more detail,we present the under-lying theory of the speaker veri�cation process. The steps presented in the following arecommonly used in audio processing.
3.1 Overview
In this chapter, a revision of the text-independent speaker veri�cation process is presented.All veri�cation or identi�cation processes follow the next steps:
1. Feature extraction is the �rst step in the Speaker Veri�cation (SV) process. Itconsists of transforming a segment of speech data (wav, raw, etc.) into a parametervector that is used in the next step. Feature extraction includes audio sampling,labeling, and feature normalization [6].
2. The second step is creating a Universal Background Model (UBM). According to theReynolds de�nition in [10], �A Universal Background Model (UBM) is a model usedin a biometric veri�cation system to represent general, person-independent featurecharacteristics to be compared against a model of person-speci�c feature character-istics when making an accept or reject decision�. A lot of input data is needed forthis purpose.
3. In the training phase we create the gaussian mixture model (GMM) of the client.Training is performed using the Universal Background Model calculated in secondstep, and taking some input data from the speaker. The Universal Backgroundmodel and the input data are combined using the Maximum A Porteriori adaptation(MAP).
4. In the testing phase we will gain a testing score of each client for each model. Wewill perform the feature extraction of the input speech segment and we will compareit with the speakers database.
5. The last step in the process decides if the system should accept the speaker asdatabase member, or reject it. So, an acceptance threshold is de�ned depending
15
on system purpose (low false acceptance ratio, or low false rejection ratio), and thesystem takes a decision comparing the score obtained in testing phase with thisthreshold.
3.2 Signal Processing and Feature Extraction
The �rst step a biometric system performs is the extraction of discrete features fromcontinuous data, and process them in a way that we can get relevant info from the person.According to [6], among others, in speech processing those steps are audio sampling,labeling process, feature extraction, and feature normalization.
Audio sampling Speech acquisition is realized with a microphone or headset telephoneby converting a sound wave into an analog signal. The term sampling is referred to thereduction of a continuous signal to a discrete signal. In signal processing, sampling is theconversion of a sound wave (a continuous signal) to a sequence of samples (a discrete-timesignal)1.
Labeling Labeling is used in text-dependent SV systems that are based on HiddenMarkov Models. Basically, labeling means to assign a label or a name to every audio seg-ment. In text-independent systems, it is interesting to process only the speech segments,because there is no available information in the silence segments. So it is usual to label�speech� segments and �silence� segments. Once the labeling is done, the next step canbe done only in speech segments, saving memory and CPU processing power.
Feature extraction Normally, linear audio samples gained from the sampling step arenot enough for the characterization of a speaker. Noise, or the change of voice leads to adi�erent audio spectrum, so a more robust representation of such coe�cients is needed.So, this step consists on extracting a real speaker feature vector from previous samplingvalues. These features are called Cepstral Coe�cients (MFCC) and are coe�cients forthe representation of speech based on human hearing perception [18]. Moreover, theextraction is improved by using the Mel scale2 to model the coe�cients according toreal human hearing perception. In Figure 3.1, we depict the block diagram of MFCCacquisition.
First, the audio signal is sampled at 8 kHz as explained in the sampling step, labeledand then windowed3. Normally, the signal is divided in segments of 25-30 ms, where thesegments overlap each other 15 ms. The next step is to switch to the frequency domainwith the help of the Fast Fourier Transform (FFT). Then the signal is �ltered by usinga �lter bank of di�erent frequencies to have a better resolution at low frequencies, whichis comparable to the human hearing system. After the Mel �ltering, we will obtain onecoe�cient for each �lter, so, for example, using a �lter bank of 40, we will obtain a vectorof 40 coe�cients for each frame. The logarithmic-spaced frequency band allows a better
1http://en.wikipedia.org/wiki/Sampling_(signal_processing)#Speech_sampling2http://en.wikipedia.org/wiki/Mel_scale3http://en.wikipedia.org/wiki/Window_function#Spectral_analysis
16

Figure 3.1: Block diagram of MFCC acquisition.
modeling of the human auditive response than a linear scale, so a log function and theDiscrete Cosine Transform (DCT) are applied. This process implies more e�cient dataprocessing, for example, in audio compression.
Feature Normalization Real SV systems are sensitive to environmental noise. So,e�ects of the recording place or channel can be prejudicial for our veri�cation process. Toavoid this problem, or to reduce the e�ects of this noise, a feature normalization is doneand basically consists on applying a feature update using the mean and the variance of
each feature vector. For a feature x, the updated feature x′is de�ned as follows:
x′=x− µσ
where µ and σ are the mean and the variance of the whole feature vector, respectively.It is possible to normalize only for the mean, but it is more usual and more robust toperform it on mean and variance.
3.3 Training Phase
The user models are created in the training phase. Therefore, it is necessary to create abackground model �rst, and then adapt this model using extracted features of the clientspeech input [10].
Creating the Background Model The basic idea of training in SV based on GMMis not to create a unique client model using client feature vectors, because normally we
17

have not enough data of each client, and the model can become heavily under-trained4.Instead, a common solution is to train a general speaker model with utterances of a set ofpeople, and then adapt this model to each user. The adaptation is done using user data.The name of this �general model�5 is Universal Background Model (UBM). The model isthe used as a common starting point for training models in general.
The UBM is trained by using the EM algorithm for 5 � 10 iterations [8]. The training datais collected from a special set of speakers with the only purpose of representing speech ingeneral. If we want to create, for example, a gender-independent UBM, we have to usean equal distribution of male and female utterances.
Training speaker A user training is based on Maximum a Posteriori Adaptation (MAP).Like the EM algorithm, the MAP adaptation is a process of estimation in two steps. Inthe �rst step, the statistics of the training data to each UBM mixture are estimated.In the second step, these new statistics are combined with the statistical features of theUBM. Given the UBM and a feature vector X = {x1, x2, ..., xT} from a speaker, it is nec-essary to get a probabilistic alignment between the training vector and UBM mixtures.In Figure 3.2, a sketch of the alignment is shown.
Figure 3.2: UBM model and client data alignment.
We use client data for adapting the UBM model. The speaker model is created aligningUBM with the input speech features.
It is important to know how this alignment is done to better understand the con�gurationof parameters of the MAP detector. This means for an i UBM mixture:
P (i|xj) =wipi(xt)∑M
k wkpk(xt)
In the �rst step, using this value of P (i|xj) and xt we can calculate the weight, the meanand the variance, which we will update in the second step. Weight, mean and varianceare de�ned as follows:
4Not enough data collected for getting a robust client model5It is named general model because the purpose of the model is to de�ne speech in general.
18

Ni =∑T
j P (i|xj, ), Ei(x) = 1Ni
∑Tj P (i|xj)xj, Ei(x
2) = 1
Ni
∑Tj P (i|xj)x
2
j
Finally, the MAP algorithm consists of updates of these parameters. The parameter λi isde�ned as:
λi =α
w
iNi
n+ (1− αw
i )wi
So. an updated weight, mean and variance are de�ned as follows:
w′i = λi
N∑i
λi
, µ′i = αµi Ei(x)+(1−αµi )µi, σ2′
i = ασi Ei(x2)+(1−ασi )(σ
2
i +µ2
i )σi−µ′2i
where N is the number of mixtures of distributions in the mixture. {αw, αµ, ασ}are param-eters that control balance between old and new weight, mean, and variance estimations.These coe�cients are calculated using a relevance factor r
pthat determines the relation-
ship between previous and updated values.
αw
i = Ni
Ni + rp
For example, using r = 0→ α = 1. It means µ′i = Ei(x) and no updates are performed.
3.4 Testing Phase
After the training phase, the speaker veri�cation system is ready to be tested. We areable to extract features of a speech segment and create a speaker model using extractedfeatures. Thus, the system should be able to verify speakers by using models and featurevectors. The �rst step in SV testing is to de�ne what the output of the testing shall be.
The most common output used for testing is the likelihood ratio [13]:
ΛM =p(HM |x, θ)p(¬HM |x, θ)
log ΛM = log p(HM |x, θ)− log p(¬HM |x, θ)
where p(¬HM |x, θ) is de�ned as the probability of HM not being the right hypothesisgiven x, i.e. M is not the speaker of x. The log ratio is commonly used as log likelihoodratio (LLR): log ΛM . For getting p(¬HM |x, θ) it is necessary to get information about allpossible speakers in the world, except M. It is impossible to obtain all this information,but we can approximate this probability, too:
19

p(¬HM |x, θ) = p(HW |x, θ)
where W is referred to the Universal Background Model.
3.5 Making the Decision
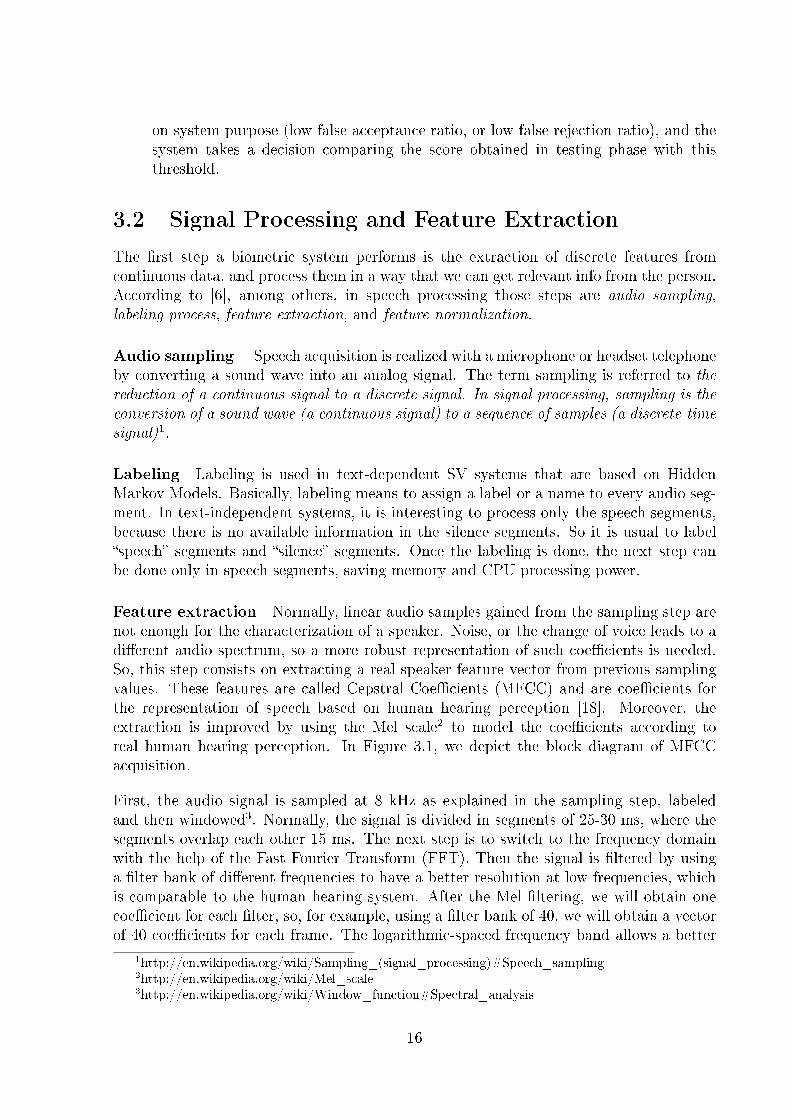
The last step of the veri�cation process is to decide from which speaker the utterancecomes from. In the SV context, the LLR threshold de�ned above is not enough to describethe performance of the system. Instead of �nding a threshold, the Detection Error Tradeo�(DET) plot and the Equal Error Rate (EER) are used, as de�ned in Section 3.5.2.
Types of Output
We can group the SV output in four types: True acceptance (TA), false acceptance (FA),true rejection (TR), and false rejection (FR). TA occurs when a client or �true� speakeris accepted. FA occurs when an impostor is accepted. This is also called false positive.TR occurs when an impostor is rejected. FR occurs when a �true� speaker is rejected andis called false negative.
These rates are measured as a percentage. For measuring the quality of the system,typically only false rejections and false acceptances are used and visualized in a graph.
Detection Error Tradeo� and Equal Error Rate
The Detection Error Tradeo� plot was de�ned by Martin et al. [1]. In this graph, thetwo possible types of error are plotted: false acceptances and false rejections. The scoredistribution in the DET plot usually approximates two Gaussian distributions. In Figure3.36 we show an example.
The Equal Error Rate (EER) is the standard numerical value to de�ne the performanceof a biometric veri�cation system. It is de�ned as the point on the DET curve where theFalse Acceptance Rate and the False Rejection Rate have the same value.
It is important to note that a system with an EER of 8% does not mean necessarily thatthe system allows 8% of impostors7. One can choose his / her own threshold, taking intoaccount the project needs.
Final Threshold
The �nal threshold is chosen after training, and can be set to the EER point as a startingpoint. Often, the threshold �xing is ignored, and instead the EER and DET-plot are usedto show the overall system performance. In this master thesis, the threshold has beenused just to obtain EER value and quality rates.
6http://rs2007.limsi.fr/index.php/Constrained_MLLR_for_Speaker_Recognition7False user who claims to log in the SV system.
20
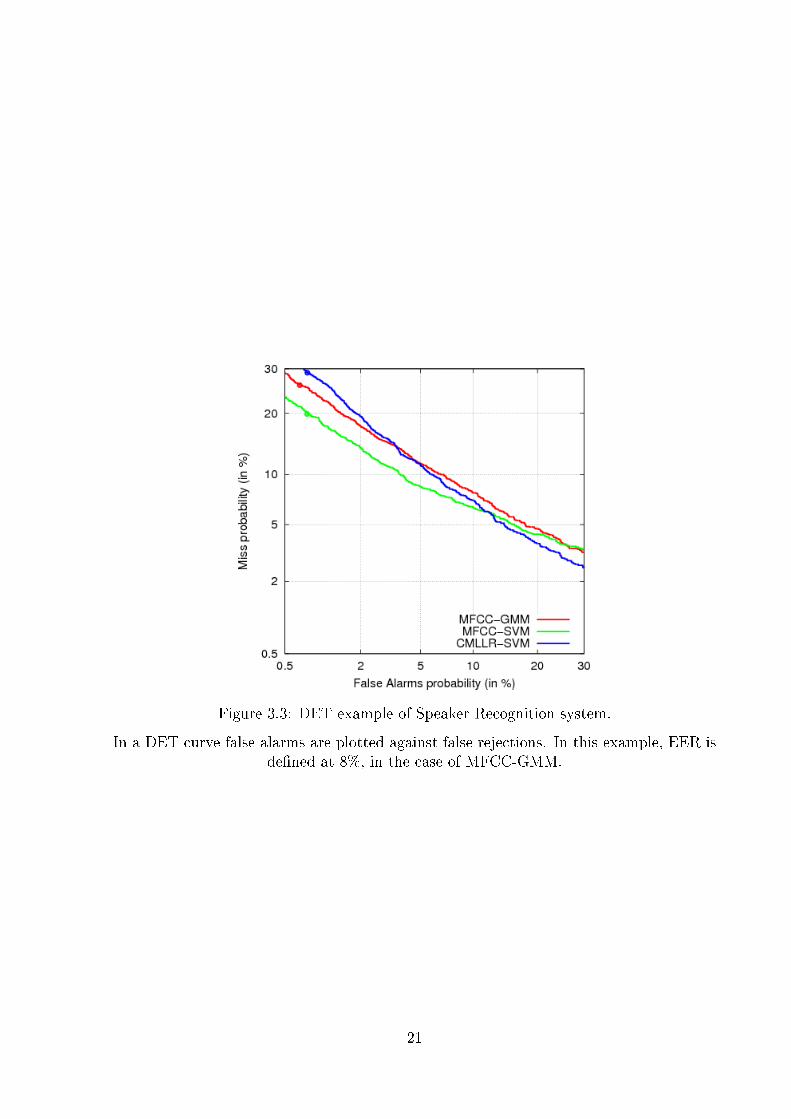
Figure 3.3: DET example of Speaker Recognition system.
In a DET curve false alarms are plotted against false rejections. In this example, EER isde�ned at 8%, in the case of MFCC-GMM.
21
Chapter 4
ALIZE Library and LIA-RAL Toolkit
As explained in previous chapters, in this master thesis we want to analyze the per-formance of ALIZE / LIA_RAL speaker veri�cation library in an embedded system.In this chapter, and according to the documentation extracted from the o�cial website(http://mistral.univ-avignon.fr/), we will describe the ALIZE and LIA_RAL speaker ver-i�cation software [12] and we will explain its functionality relevant for this thesis in moredetail. This toolkit has been designed to work with speech features, so the SPro4 hasbeen used in this master thesis for this purpose. Its functionality and its most relevantfeatures are explained in this chapter as well.
4.1 Overview
If we refer to the author, ALIZE is de�ned as �an open-source platform (distributed underLGPL license) for biometric authentication� 1. This toolchain, de�ned as �low-level�library, contains all needed functions to the use of Gaussian mixtures. LIA_RAL isde�ned as a �high-level� toolkit, and is a �set of tools to do all tasks required by a biometricauthentication system�. In Figure 4.1 we can see a diagram of the main components ofALIZE and LIA_RAL distribution. The LIA_RAL package is based on ALIZE's low-levellibrary and contains two task-speci�c sub-deliveries: LIA_SpkSeg, related to acousticdiarization and processing methods, and LIA_SpkDet, related to Speaker Veri�cationtools. LIA_Utils contains a list of non-categorized tools that are included in LIA_RAL.
Both ALIZE and LIA_RAL SV software are implemented in C/C++, to allow multiplat-form via the use of GNU Autotools2. In this chapter, we will explain each ALIZE andLIA_RAL function in relation to each stage described in Chapter 3. Neither ALIZE norLIA_RAL do support feature extraction, so we will use SPro4 tool for this purpose. Itwill be explained in Section 4.4.
1http://mistral.univ-avignon.fr/index.html2The Autotools consists of Autoconf, Automake, and Libtool toolkit to allow cross-compilation
22
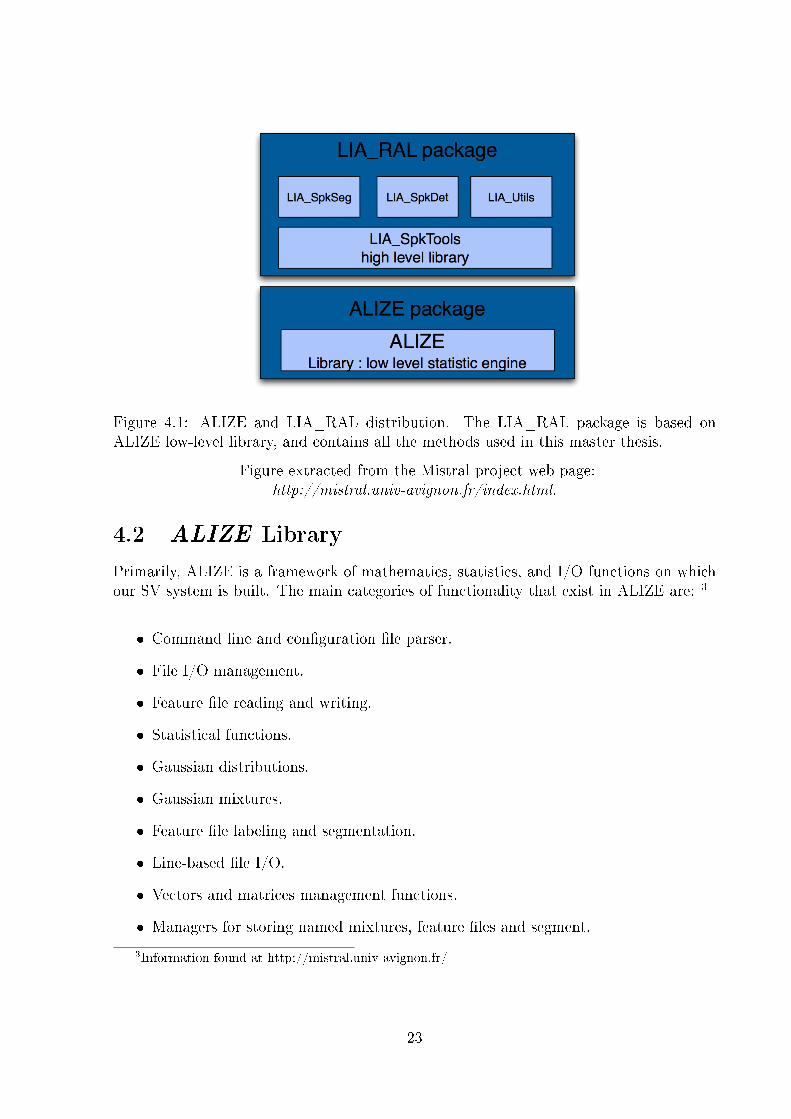
Figure 4.1: ALIZE and LIA_RAL distribution. The LIA_RAL package is based onALIZE low-level library, and contains all the methods used in this master thesis.
Figure extracted from the Mistral project web page:http://mistral.univ-avignon.fr/index.html.
4.2 ALIZE Library
Primarily, ALIZE is a framework of mathematics, statistics, and I/O functions on whichour SV system is built. The main categories of functionality that exist in ALIZE are: 3
� Command line and con�guration �le parser.
� File I/O management.
� Feature �le reading and writing.
� Statistical functions.
� Gaussian distributions.
� Gaussian mixtures.
� Feature �le labeling and segmentation.
� Line-based �le I/O.
� Vectors and matrices management functions.
� Managers for storing named mixtures, feature �les and segment.
3Information found at http://mistral.univ-avignon.fr/
23
Command line and con�guration �le parser. The ALIZE library uses con�guration�les and command line con�guration. A user can de�ne a con�guration �le to set somedynamic parameters, or de�ne them on the command line. For example, de�ning aparameter maxProb 1 in a con�guration �le is equivalent to type �maxProb 1 in commandline.
File I/O management. The library contains two classes for handling �les. They arelike a Java Filestream4.
Feature �le reading and writing. ALIZE supports some feature �le formats forhandling feature vectors. The ones mostly used are HTK, and SPro3/4. It is possible touse also list �les, in order to concatenate feature �les into a single stream.
Statistical functions. Basically, the library allows one to calculate mean and variance,as well to generate histograms. It also contains functions for the Expectation Maximiza-tion algorithm in general.
Gaussian distributions. ALIZE allows one to handle Gaussian full covariance matricesand diagonal variance matrix.
Gaussian mixtures. Almost all Gaussian distribution management code in ALIZE istargeted to Gaussian distributions. The ALIZE library is also designed to support otherkinds of distributions. In this master thesis, this feature will be used to read input data.
Feature �le labeling and segmentation. ALIZE has �le labeling, with a moduleworking in parallel with I/O. Segmentation will be used for optimization.
Line-based �le I/O. All text �les in ALIZE are distributed into lines and �elds. Onemodule of the library is targeted to reading and writing these �elds.
Vectors and matrices management. This library contains basic algorithms to handlevectors and matrices.
Managers for storing named mixtures, feature �les and segment. ALIZE con-tains a group of classes called Servers to handle the storage of named entities. I.e, allspeaker models are stored in mixtures server, features are cached in features server, andlabels are stored in labels server. It allows an automatic organization of �les in memory.This automatic storage is essential for the data management, and lets ALIZE-dependentapplications, such LIA_RAL toolkit, to work in an optimized and organized way.
4http://www.cs.williams.edu/javastructures/doc/structure/structure/FileStream.html
24
4.3 LIA_RAL Toolkit
The LIA_RAL toolkit is the software that wraps all the ALIZE algorithms in programsthat can be run from a shell script. In the following, we describe the main LIA_RALtools used in this master thesis.
Normalize Features
The NormFeat program reads a feature �le and normalizes it. It is possible to normalizethe extracted features using mean / variance normalization or Gaussianization. The �rstmode simply accumulates mean or variance, and then normalizes audio features usingthem. The second one performs feature warping [11] to get the Gaussian distributionfrom a histogram of feature vectors. In this master thesis, only the mean normalizationwill be used.
Energy Detector
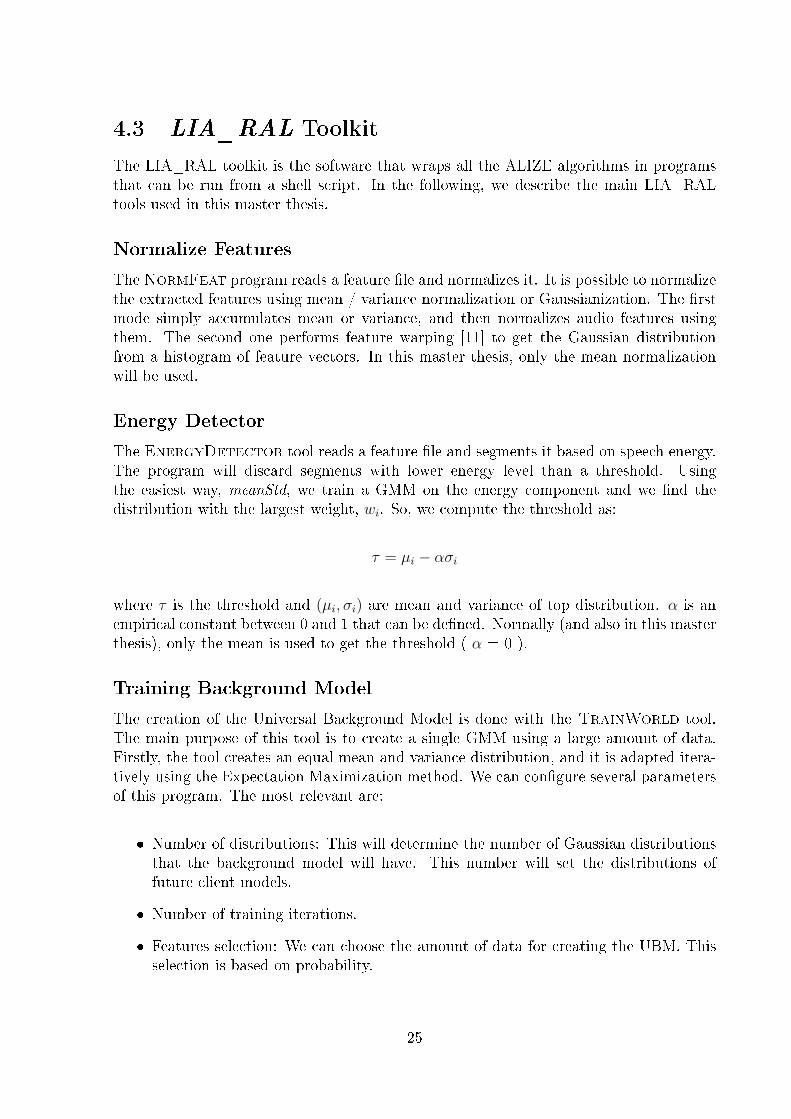
The EnergyDetector tool reads a feature �le and segments it based on speech energy.The program will discard segments with lower energy level than a threshold. Usingthe easiest way, meanStd, we train a GMM on the energy component and we �nd thedistribution with the largest weight, wi. So, we compute the threshold as:
τ = µi − ασi
where τ is the threshold and (µi, σi) are mean and variance of top distribution. α is anempirical constant between 0 and 1 that can be de�ned. Normally (and also in this masterthesis), only the mean is used to get the threshold ( α = 0 ).
Training Background Model
The creation of the Universal Background Model is done with the TrainWorld tool.The main purpose of this tool is to create a single GMM using a large amount of data.Firstly, the tool creates an equal mean and variance distribution, and it is adapted itera-tively using the Expectation Maximization method. We can con�gure several parametersof this program. The most relevant are:
� Number of distributions: This will determine the number of Gaussian distributionsthat the background model will have. This number will set the distributions offuture client models.
� Number of training iterations.
� Features selection: We can choose the amount of data for creating the UBM. Thisselection is based on probability.
25
Training Target
The purpose of the TrainTarget tool is to adapt the background model to a speakermodel, using feature vectors and the MAP criterion. Like in the UBM training, not allfeature vectors are necessary for doing the adaptation, so we can also �x the percentageof feature segments to use.
An input �le for TrainTarget is a list with lines like:
SPEAKER1 speaker s /spk1_001 speaker s /spk1_002SPEAKER2 speaker s /spk2_001 speaker s /spk2_002SPEAKER3 speaker s /spk3_001 speaker s /spk3_002SPEAKER4 speaker s /spk4_001 speaker s /spk4_002
In the �rst column the name of each speaker is declared. In the next columns, we de�nethe utterances that we want to use to create the model. Normally, we will use two orthree utterances. The more utterances we use, the better the model will be, because wewill have more information from the speaker.
As explained in the Section 3.3, we will use a relevance factor rpfor calculating the family
of variables αi. The TrainTarget application allows us to de�ne this relevance factor, or�x αi, using the �MapOccDep� or the �MapConst2� mode respectively. In this masterthesis, the �MapOccDep� mode will be used. It computes αi as a linear combination ofits value in the world model and its value obtained by an EM algorithm on the data.
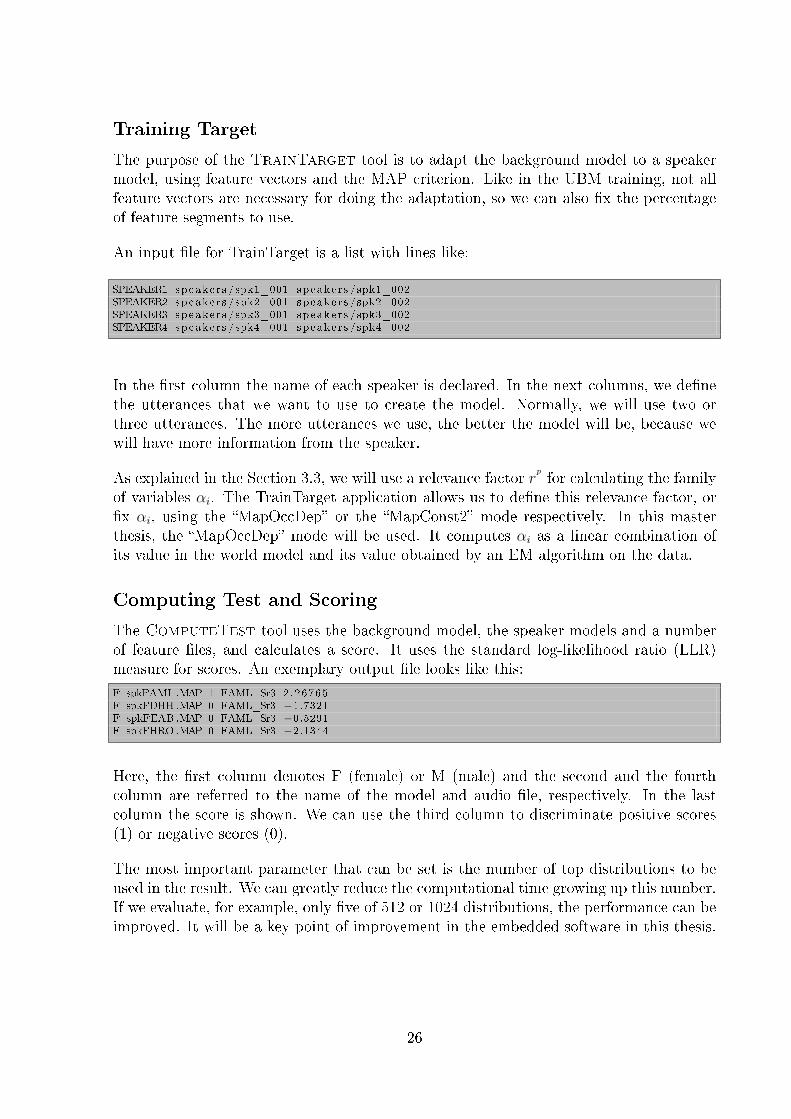
Computing Test and Scoring
The ComputeTest tool uses the background model, the speaker models and a numberof feature �les, and calculates a score. It uses the standard log-likelihood ratio (LLR)measure for scores. An exemplary output �le looks like this:
F spkFAML.MAP 1 FAML_Sr3 2.26765F spkFDHH.MAP 0 FAML_Sr3 −1.7321F spkFEAB .MAP 0 FAML_Sr3 −0.5291F spkFHRO.MAP 0 FAML_Sr3 −2.1344
Here, the �rst column denotes F (female) or M (male) and the second and the fourthcolumn are referred to the name of the model and audio �le, respectively. In the lastcolumn the score is shown. We can use the third column to discriminate positive scores(1) or negative scores (0).
The most important parameter that can be set is the number of top distributions to beused in the result. We can greatly reduce the computational time growing up this number.If we evaluate, for example, only �ve of 512 or 1024 distributions, the performance can beimproved. It will be a key point of improvement in the embedded software in this thesis.
26
Taking a Decision
The last step is the decision making. This process consists of comparing the likelihoodresulting from the comparison between the claimed speaker model and the incoming speechsignal with a decision threshold. If the likelihood is higher than the threshold, the claimedspeaker will be accepted, else rejected.
As commented in Subsection 3.5.3, a threshold should be de�ned according to our needs.This master thesis evaluates the ALIZE / LIA_RAL software, so the threshold was notde�ned. We will use a collection of possibe threshold values for getting FR and FA curves,as well as equal error rate (see Section 3.5).
4.4 SPro4 Toolkit Features Extraction
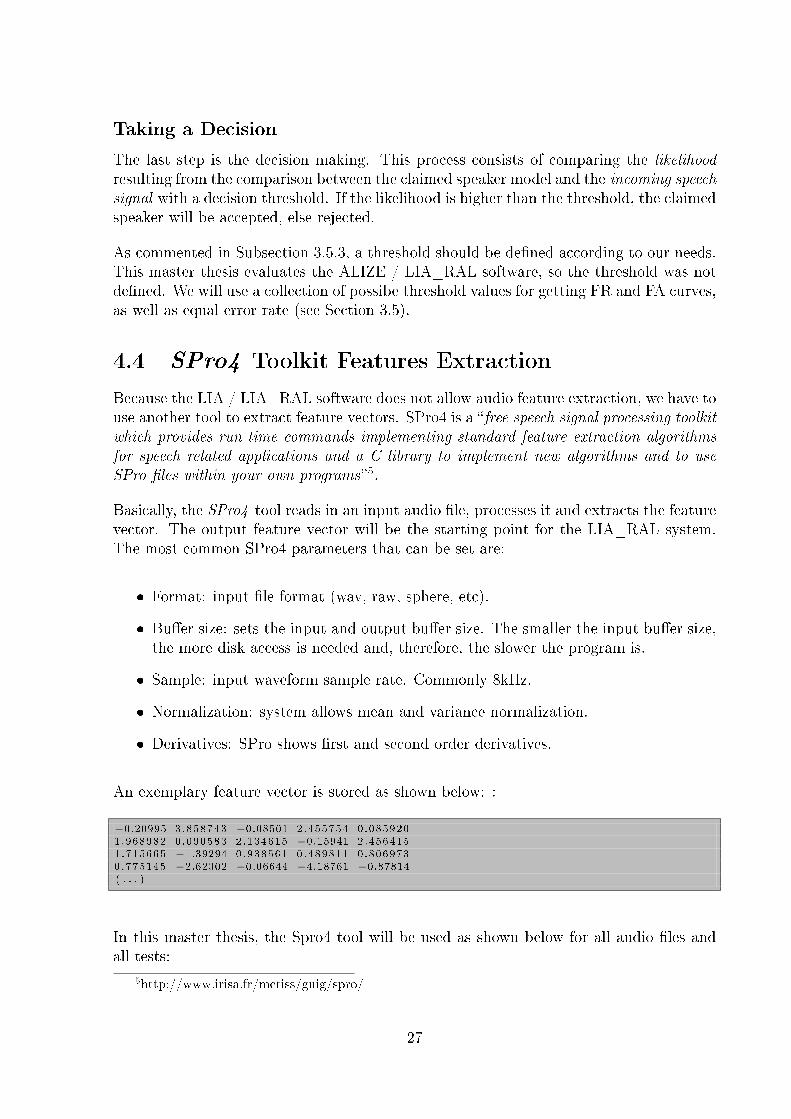
Because the LIA / LIA_RAL software does not allow audio feature extraction, we have touse another tool to extract feature vectors. SPro4 is a �free speech signal processing toolkitwhich provides run-time commands implementing standard feature extraction algorithmsfor speech related applications and a C library to implement new algorithms and to useSPro �les within your own programs�5.
Basically, the SPro4 tool reads in an input audio �le, processes it and extracts the featurevector. The output feature vector will be the starting point for the LIA_RAL system.The most common SPro4 parameters that can be set are:
� Format: input �le format (wav, raw, sphere, etc).
� Bu�er size: sets the input and output bu�er size. The smaller the input bu�er size,the more disk access is needed and, therefore, the slower the program is.
� Sample: input waveform sample rate. Commonly 8kHz.
� Normalization: system allows mean and variance normalization.
� Derivatives: SPro shows �rst and second order derivatives.
An exemplary feature vector is stored as shown below: :
−0.20995 3.858743 −0.08501 2.455754 0.0859201.968982 0.090583 2.134615 −0.15941 2.4564151.715665 −1.39294 0.938561 0.489811 0.8069730.775145 −2.62302 −0.06644 −4.18761 −0.87814( . . . )
In this master thesis, the Spro4 tool will be used as shown below for all audio �les andall tests:
5http://www.irisa.fr/metiss/guig/spro/
27
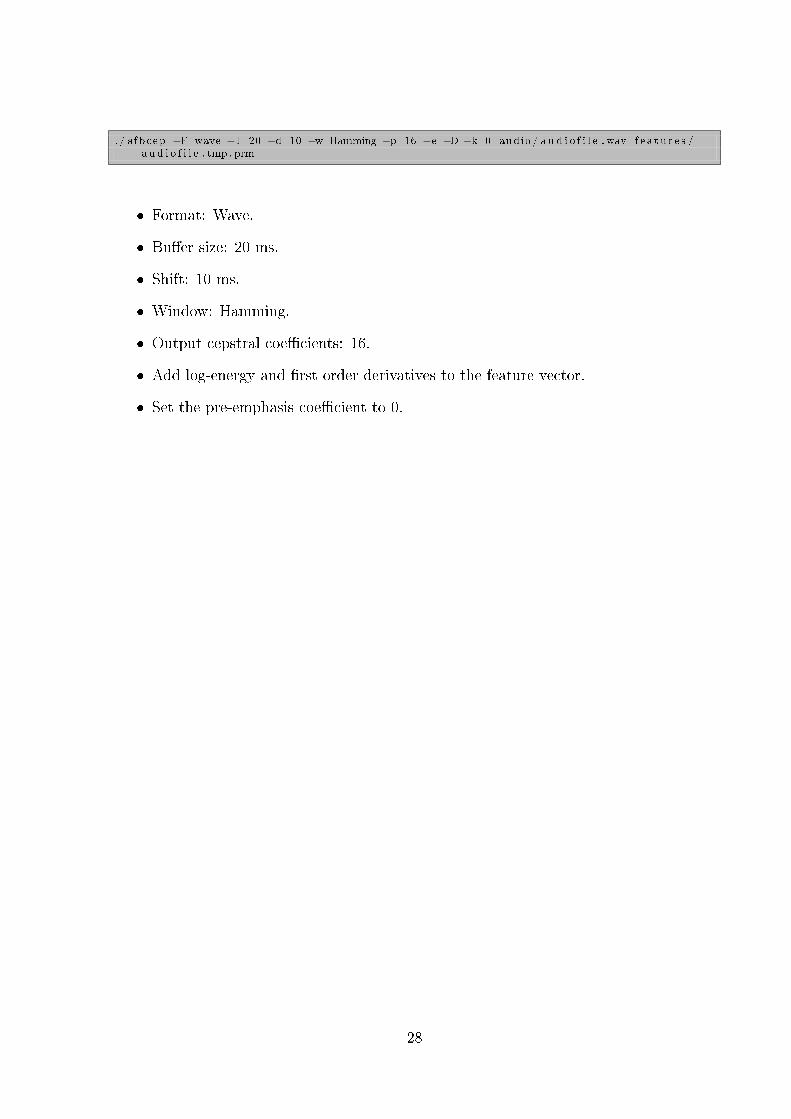
. / s fbcep −F wave − l 20 −d 10 −w Hamming −p 16 −e −D −k 0 audio / a u d i o f i l e . wav f e a t u r e s /a u d i o f i l e . tmp . prm
� Format: Wave.
� Bu�er size: 20 ms.
� Shift: 10 ms.
� Window: Hamming.
� Output cepstral coe�cients: 16.
� Add log-energy and �rst order derivatives to the feature vector.
� Set the pre-emphasis coe�cient to 0.
28

Chapter 5
Open Embedded as Operating System
The main goal of this master thesis is to adapt and con�gure a SV software, and run iton an embedded system. In this chapter, we describe the embedded system environmentset-up and the necessary cross-compiling tools.
5.1 Embedded System Environment
The BeagleBoard is a computer development open source project. It is presented ina single device and it is based on the Texas Instruments OMAP3530 chip, as shown inFigure 5.1. The processor is an ARM Cortex-A8 core with a digital signal processing DSPcore. The motivation of the project is to design a computer with low-power consumption,low-cost, compact size and expandable device. The project is in continuous developmentunder the Creative Commons license, as speci�ed on the �rst pages of the BeagleBoarduser manual1. Moreover, the whole project is supported and commercialized by TexasInstruments and Digi-Key.
In this master thesis, revision B5 of the board will be used. We present the most signi�cantfeatures of it below. For more details of the board, please consult the manual.
In addition to the device, in this project we used a LCD monitor, a mouse, a keyboardand a USB Hub. The board needs an auxiliary energy supply. In Figure 5.2 we can seethe laboratory setup.
The procedure in the device is similar to the procedure in a desktop PC under Linuxenvironment. One needs at least one SD card to store Linux and its boot loaders2. In thenext section, this procedure will be explained.
1http://BeagleBoard.org/static/BBSRM_latest.pdf2Booting is a process that starts operating systems when the user turns on a computer system.
29
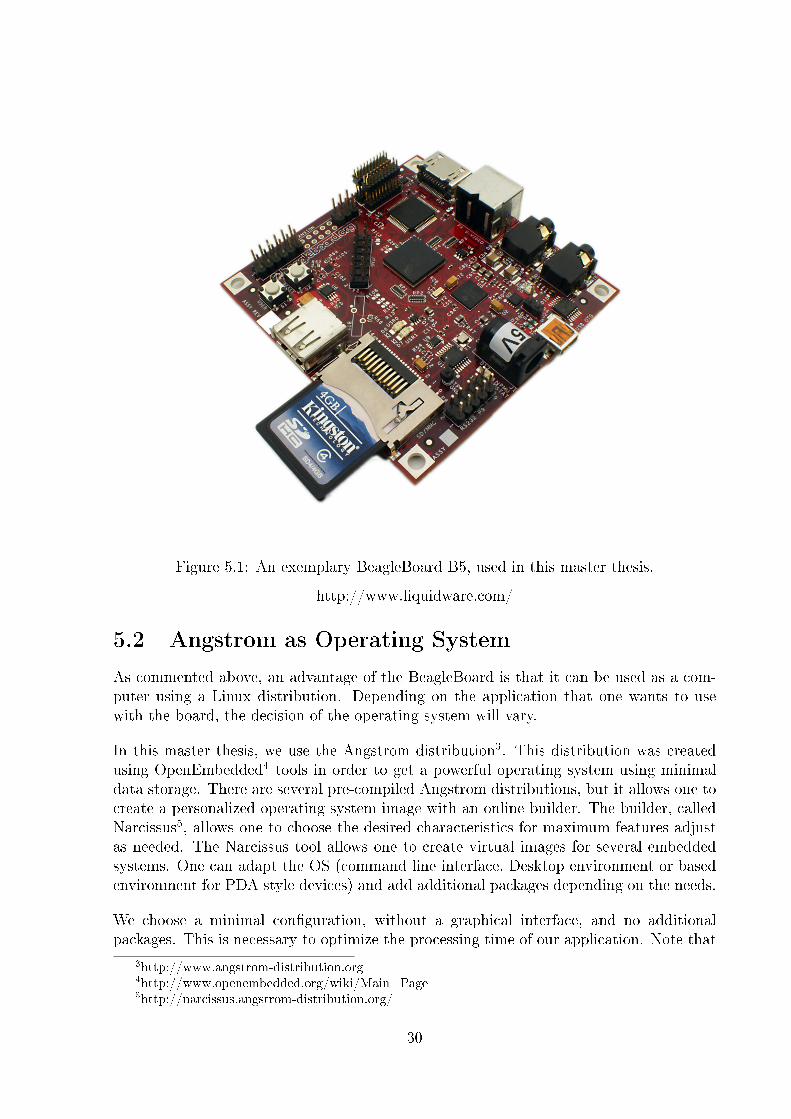
Figure 5.1: An exemplary BeagleBoard B5, used in this master thesis.
http://www.liquidware.com/
5.2 Angstrom as Operating System
As commented above, an advantage of the BeagleBoard is that it can be used as a com-puter using a Linux distribution. Depending on the application that one wants to usewith the board, the decision of the operating system will vary.
In this master thesis, we use the Angstrom distribution3. This distribution was createdusing OpenEmbedded4 tools in order to get a powerful operating system using minimaldata storage. There are several pre-compiled Angstrom distributions, but it allows one tocreate a personalized operating system image with an online builder. The builder, calledNarcissus5, allows one to choose the desired characteristics for maximum features adjustas needed. The Narcissus tool allows one to create virtual images for several embeddedsystems. One can adapt the OS (command line interface, Desktop environment or basedenvironment for PDA style devices) and add additional packages depending on the needs.
We choose a minimal con�guration, without a graphical interface, and no additionalpackages. This is necessary to optimize the processing time of our application. Note that
3http://www.angstrom-distribution.org4http://www.openembedded.org/wiki/Main_Page5http://narcissus.angstrom-distribution.org/
30

Figure 5.2: Using the BeagleBoard.
In the �gure we can see the BeagleBoard with all peripherals used in this master thesis:keyboard, screen and SD card.
our �nal speaker veri�cation version is an o�ine version. If we want to verify online, aninput microphone and audio drivers would be required. However, such drivers can becross-compiled6 for ARM, too.
In this master thesis, we use a 2 GB SD card. It is possible that other versions of theoperating system require larger cards for its correct functionality. We are using a minimalversion, so 2 GB are enough for our work.
At �rst, the SD card formatting and partitioning is necessary. The SD card is dividedinto two parts: The OS and the system �les needed for the boot process. Formatting andpartition has been done using a script. This script is presented in Annex A.
5.3 Cross-compilation of the Speaker Veri�cation
System
As described in previous chapters, the speaker veri�cation system proposed in this thesisinvolves the usage of three main applications: The SPro4 tool, for extraction of acousticfeatures of audio �les, the ALIZE library, which includes all the signal processing func-tions, and the LIA_RAL toolkit, to train and test speakers using the functions of the
6See section 5.3
31

ALIZE library. The compilation and execution of these applications, however, is primar-ily intended for desktop computers or laptops. The porting process of the software to anembedded system requires a speci�c compilation according to the target system architec-ture. In this master thesis, we have to compile each program, as well as library, to run onan ARM architecture machine. However, we use a pre-con�gured OS, and the Angstromversion presented in Section 5.2 contains compiled libraries for the ARM architecture.
Another option is to compile directly on the BeagleBoard. This means that one copiesthe source code on the SD card, and compiles it using the GCC compiler of the OS of theBeagleBoard. This compiler, however, is not contained in the minimalist version used,and thus it is preferably to carry out cross-compiling on the host machine.
For the cross-compilation we will use the Sourgery G++ GNU -based toolchain. The crosscompiler can be installed in any Linux distribution. For more information, we refer to theuser manual7.
In the following subsections, we will explain the process of cross-compiling used for eachof the three main applications of our master thesis, using the GNU Build System.
The GNU Build System
It can be di�cult to port a software program: the C compiler di�ers from system tosystem; certain library functions are missing on some systems; header �les may havedi�erent names. One way to handle this is to write conditional code, with code blocksselected by means of preprocessor directives (#ifdef); but because of the wide variety ofbuild environments this approach can become unmanageable. The GNU build system isdesigned to address this problem.
The GNU Build System, also known as the Autotools, is a toolkit developed by the GNUproject. These tools are designed to help creating portable source code packages forvarious Unix systems. The GNU build system is part of the GNU toolchain and is widelyused to develop open source software. Although the tools contained in the GNU buildsystem are under the General Public License (GPL)8, there are not restrictions to createprivate software using this toolchain.
The GNU build system includes GNU Autoconf, Automake and Libtool utilities. Othertools used are often the program GNU make, GNU get text, pkg-con�g and the GNUCompiler Collection (GCC).
GNU Autoconf is used to adapt the di�erences between di�erent distributions of Unix.For example, some Unix systems may have features that do not exist or do not work onother systems. Autoconf can detect the problem and �nd the way to �x it. The outputof Autoconf is a script called con�gure. Autoheader is also included in Autoconf, and isthe tool used to manage the C header �les.
7https://sourcery.mentor.com/GNUToolchain/doc7793/getting-started.pdf8http://en.wikipedia.org/wiki/GNU_General_Public_License
32
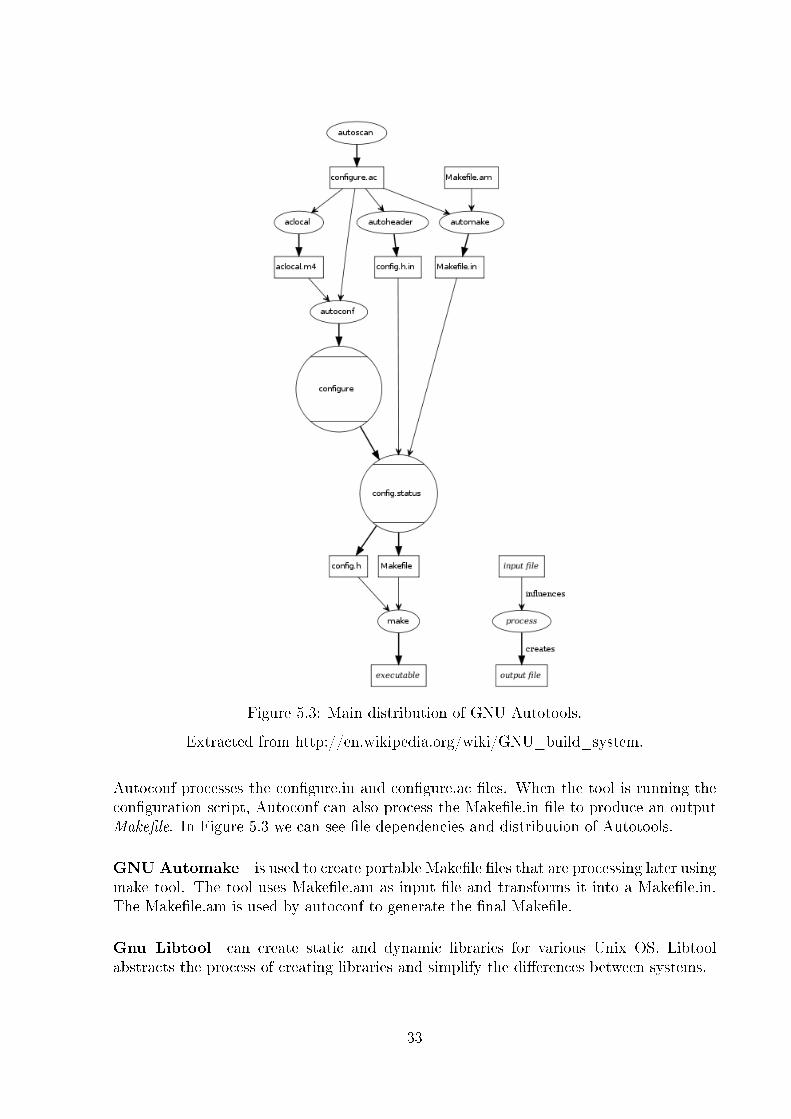
Figure 5.3: Main distribution of GNU Autotools.
Extracted from http://en.wikipedia.org/wiki/GNU_build_system.
Autoconf processes the con�gure.in and con�gure.ac �les. When the tool is running thecon�guration script, Autoconf can also process the Make�le.in �le to produce an outputMake�le. In Figure 5.3 we can see �le dependencies and distribution of Autotools.
GNU Automake is used to create portable Make�le �les that are processing later usingmake tool. The tool uses Make�le.am as input �le and transforms it into a Make�le.in.The Make�le.am is used by autoconf to generate the �nal Make�le.
Gnu Libtool can create static and dynamic libraries for various Unix OS. Libtoolabstracts the process of creating libraries and simplify the di�erences between systems.
33
GNU Con�guration for BeagleBoard
To make the cross-compilation one has to choose the appropriate settings in the autoconfof each program: ALIZE library, LIA_RAL toolkit and SPro 4.0 features extractor. Weused the Open Source GNU cross-compilation tools supplied by Codesourcery9 neededin cross-compilation tools of GNU autoconf. This cross-compiler is basically used asstandard g++ compiler for an ARM target.
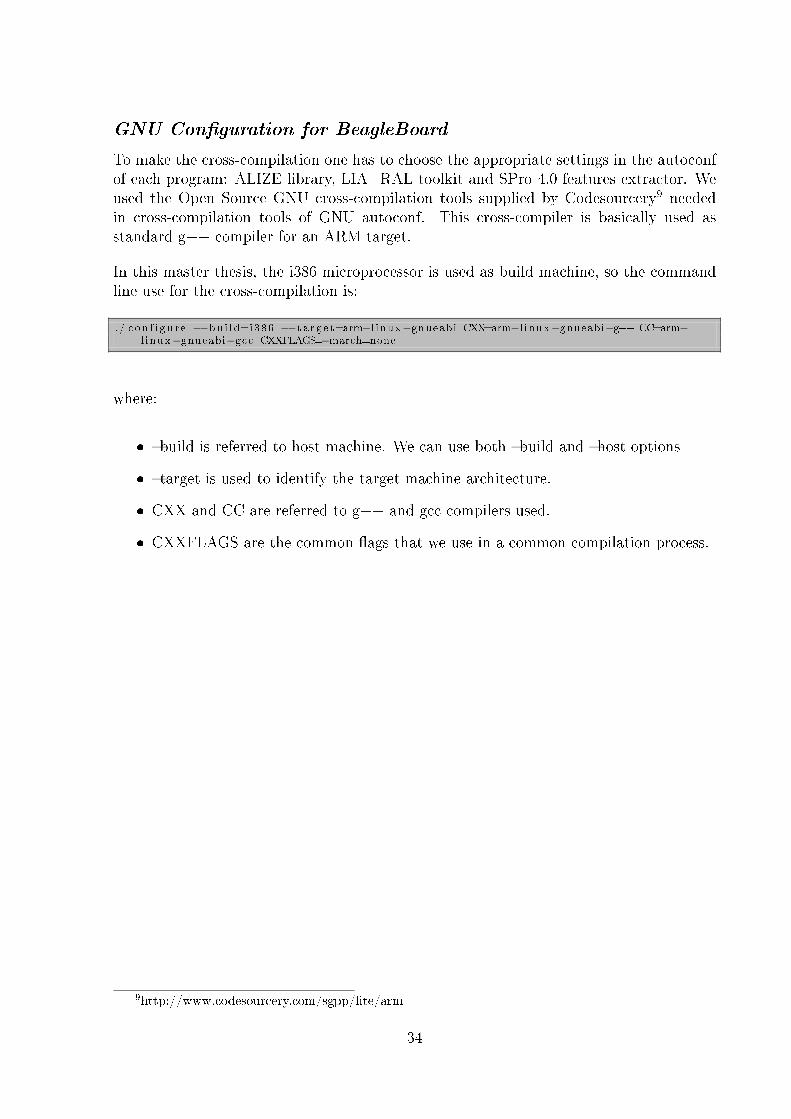
In this master thesis, the i386 microprocessor is used as build machine, so the commandline use for the cross-compilation is:
. / c on f i gu r e −−bu i ld=i386 −−t a r g e t=arm−l inux−gnueabi CXX=arm−l inux−gnueabi−g++ CC=arm−l inux−gnueabi−gcc CXXFLAGS=−march=none
where:
� �build is referred to host machine. We can use both �build and �host options
� �target is used to identify the target machine architecture.
� CXX and CC are referred to g++ and gcc compilers used.
� CXXFLAGS are the common �ags that we use in a common compilation process.
9http://www.codesourcery.com/sgpp/lite/arm
34

Chapter 6
Con�guration of ALIZE / LIA_RAL
The ALIZE / LIA_RAL package is used in many applications. In this chapter, we presenta �how-to-use� in a shell environment, the compilation process and the con�gurationparameters used in this master thesis.
6.1 Shell-script Compilation
Using the LIA_RAL toolkit requires one to study the application (see Section 4.3), andits con�guration parameters. Below, we will describe each application and we will discussthe best way to de�ne and use each application parameter. The Spro4 feature extractoris necessary to process all �les. So, a concatenation script is used. For more information,read Section 4.4 or visit the website1.
Normalization and Energy Detection
The NormFeat tool is used to normalize the feature �le. It is used as follows:
. /LIA_RAL/LIA_SpkDet/NormFeat/NormFeat −−c on f i g c f g /NormFeat . c f g −−inputFeatureFi lename. / l s t / a l l . l s t
The EnergyDetector tool is used for silence removing and labeling speaker features beforeprocessing them.
. /LIA_RAL/LIA_SpkDet/EnergyDetector /EnergyDetector −−c on f i g c f g /EnergyDetector . c f g −−inputFeatureFi lename . / l s t / a l l . l s t
Next, one has to re-normalize the label �les. This is done with the NormFeat tool again,with another con�guration �le:
. /LIA_RAL/LIA_SpkDet/NormFeat/NormFeat −−c on f i g c f g /NormFeat_energy . c f g −−inputFeatureFi lename . / l s t / a l l . l s t
The script processFeatures.sh includes the three steps presented above.1http://www.irisa.fr/metiss/guig/spro/spro-4.0.1/spro_4.html
35
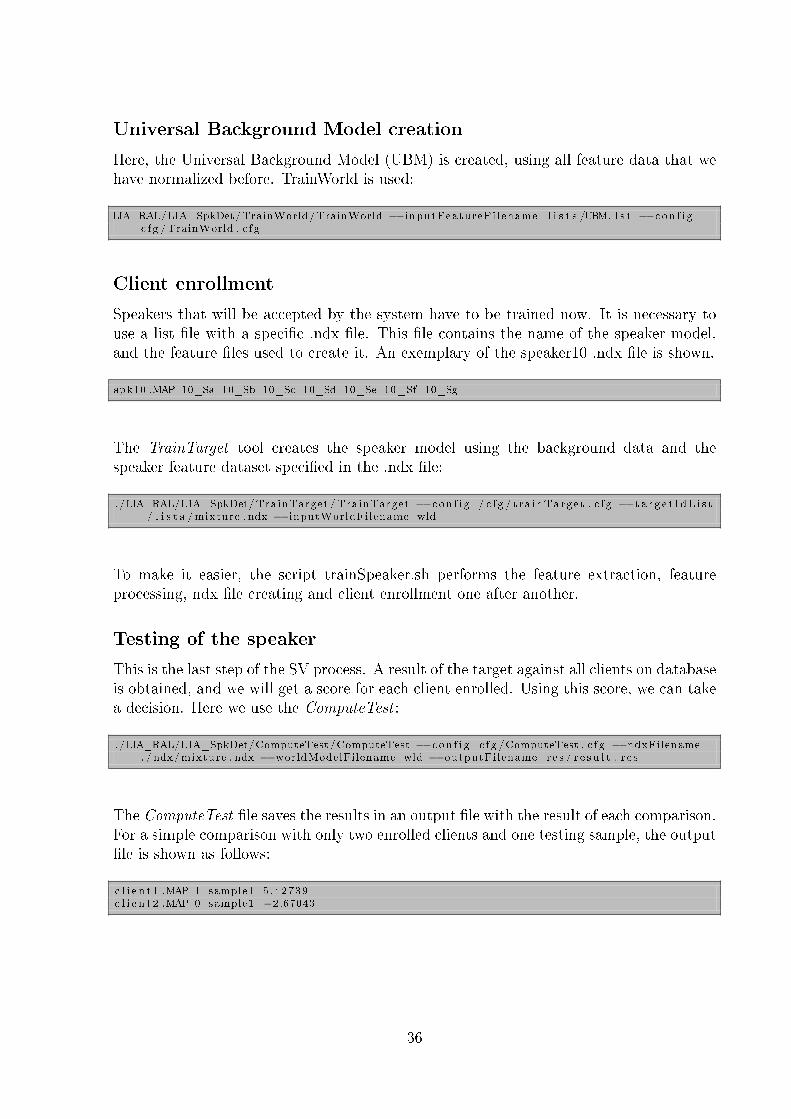
Universal Background Model creation
Here, the Universal Background Model (UBM) is created, using all feature data that wehave normalized before. TrainWorld is used:
LIA_RAL/LIA_SpkDet/TrainWorld/TrainWorld −−inputFeatureFi lename l i s t s /UBM. l s t −−c on f i gc f g /TrainWorld . c f g
Client enrollment
Speakers that will be accepted by the system have to be trained now. It is necessary touse a list �le with a speci�c .ndx �le. This �le contains the name of the speaker model,and the feature �les used to create it. An exemplary of the speaker10 .ndx �le is shown.
spk10 .MAP 10_Sa 10_Sb 10_Sc 10_Sd 10_Se 10_Sf 10_Sg
The TrainTarget tool creates the speaker model using the background data and thespeaker feature dataset speci�ed in the .ndx �le:
. /LIA_RAL/LIA_SpkDet/TrainTarget /TrainTarget −−c on f i g / c f g / t ra inTarge t . c f g −−t a r g e t I dL i s t/ l i s t s /mixture . ndx −−inputWorldFilename wld
To make it easier, the script trainSpeaker.sh performs the feature extraction, featureprocessing, ndx �le creating and client enrollment one after another.
Testing of the speaker
This is the last step of the SV process. A result of the target against all clients on databaseis obtained, and we will get a score for each client enrolled. Using this score, we can takea decision. Here we use the ComputeTest :
. /LIA_RAL/LIA_SpkDet/ComputeTest/ComputeTest −−c on f i g c f g /ComputeTest . c f g −−ndxFilename. / ndx/mixture . ndx −−worldModelFilename wld −−outputFilename r e s / r e s u l t . r e s
The ComputeTest �le saves the results in an output �le with the result of each comparison.For a simple comparison with only two enrolled clients and one testing sample, the output�le is shown as follows:
c l i e n t 1 .MAP 1 sample1 5 .42739c l i e n t 2 .MAP 0 sample1 −2.67043
36
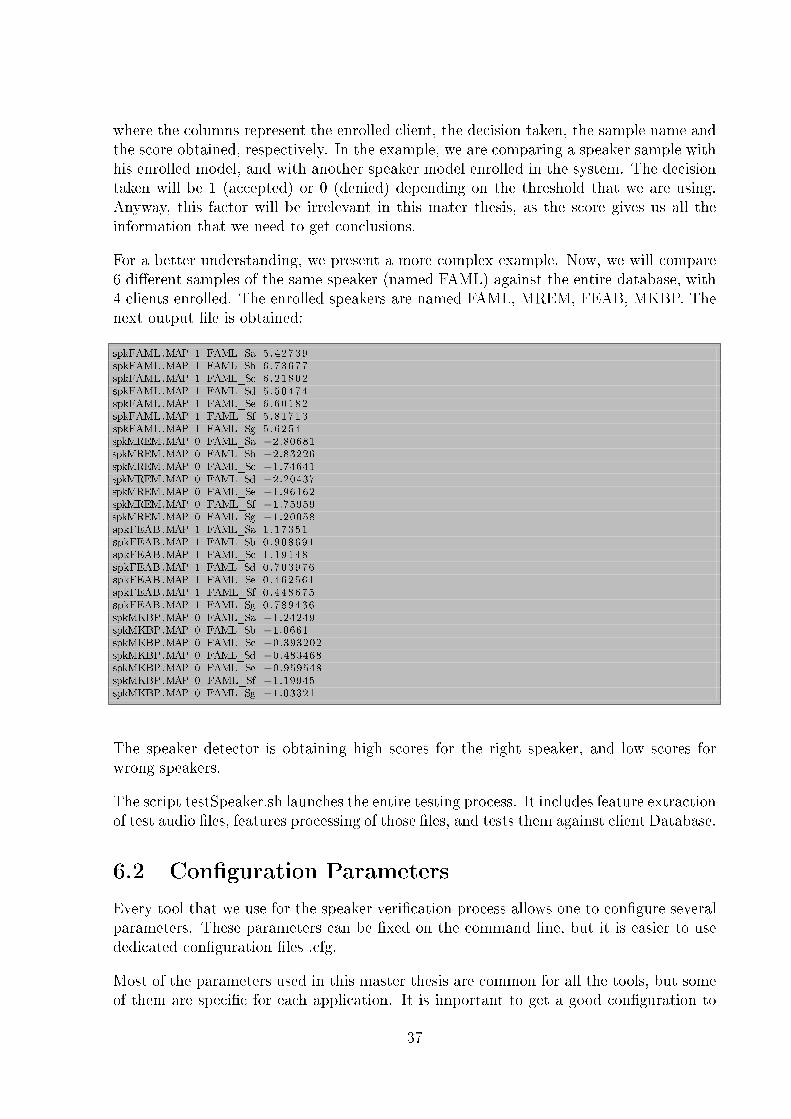
where the columns represent the enrolled client, the decision taken, the sample name andthe score obtained, respectively. In the example, we are comparing a speaker sample withhis enrolled model, and with another speaker model enrolled in the system. The decisiontaken will be 1 (accepted) or 0 (denied) depending on the threshold that we are using.Anyway, this factor will be irrelevant in this mater thesis, as the score gives us all theinformation that we need to get conclusions.
For a better understanding, we present a more complex example. Now, we will compare6 di�erent samples of the same speaker (named FAML) against the entire database, with4 clients enrolled. The enrolled speakers are named FAML, MREM, FEAB, MKBP. Thenext output �le is obtained:
spkFAML.MAP 1 FAML_Sa 5.42739spkFAML.MAP 1 FAML_Sb 6.73677spkFAML.MAP 1 FAML_Sc 6.21802spkFAML.MAP 1 FAML_Sd 5.50474spkFAML.MAP 1 FAML_Se 6.60182spkFAML.MAP 1 FAML_Sf 5 .81713spkFAML.MAP 1 FAML_Sg 5.6254spkMREM.MAP 0 FAML_Sa −2.80681spkMREM.MAP 0 FAML_Sb −2.83226spkMREM.MAP 0 FAML_Sc −1.74641spkMREM.MAP 0 FAML_Sd −2.20437spkMREM.MAP 0 FAML_Se −1.96162spkMREM.MAP 0 FAML_Sf −1.75959spkMREM.MAP 0 FAML_Sg −1.20058spkFEAB .MAP 1 FAML_Sa 1.17351spkFEAB .MAP 1 FAML_Sb 0.908691spkFEAB .MAP 1 FAML_Sc 1.19148spkFEAB .MAP 1 FAML_Sd 0.703976spkFEAB .MAP 1 FAML_Se 0.462561spkFEAB .MAP 1 FAML_Sf 0.448675spkFEAB .MAP 1 FAML_Sg 0.789436spkMKBP.MAP 0 FAML_Sa −1.24249spkMKBP.MAP 0 FAML_Sb −1.0661spkMKBP.MAP 0 FAML_Sc −0.393202spkMKBP.MAP 0 FAML_Sd −0.483468spkMKBP.MAP 0 FAML_Se −0.959548spkMKBP.MAP 0 FAML_Sf −1.19945spkMKBP.MAP 0 FAML_Sg −1.03321
The speaker detector is obtaining high scores for the right speaker, and low scores forwrong speakers.
The script testSpeaker.sh launches the entire testing process. It includes feature extractionof test audio �les, features processing of those �les, and tests them against client Database.
6.2 Con�guration Parameters
Every tool that we use for the speaker veri�cation process allows one to con�gure severalparameters. These parameters can be �xed on the command line, but it is easier to usededicated con�guration �les .cfg.
Most of the parameters used in this master thesis are common for all the tools, but someof them are speci�c for each application. It is important to get a good con�guration to
37
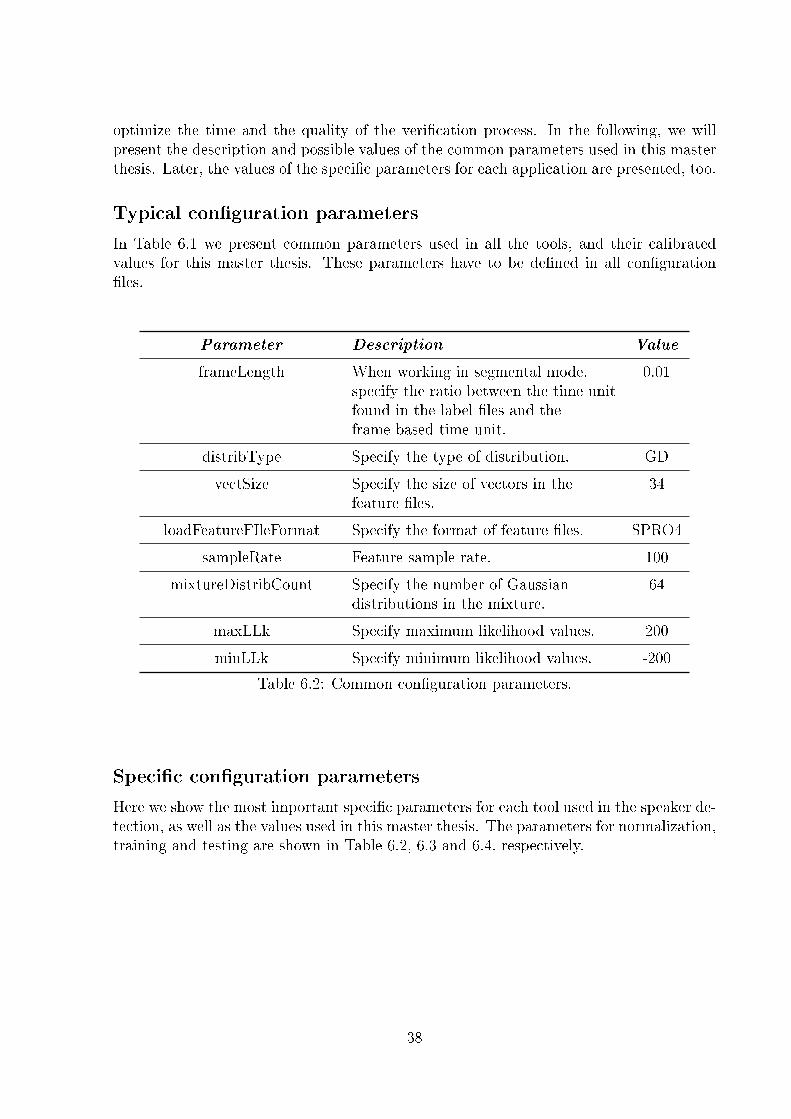
optimize the time and the quality of the veri�cation process. In the following, we willpresent the description and possible values of the common parameters used in this masterthesis. Later, the values of the speci�c parameters for each application are presented, too.
Typical con�guration parameters
In Table 6.1 we present common parameters used in all the tools, and their calibratedvalues for this master thesis. These parameters have to be de�ned in all con�guration�les.
Parameter Description Value
frameLength When working in segmental mode,specify the ratio between the time unitfound in the label �les and theframe-based time unit.
0.01
distribType Specify the type of distribution. GD
vectSize Specify the size of vectors in thefeature �les.
34
loadFeatureFIleFormat Specify the format of feature �les. SPRO4
sampleRate Feature sample rate. 100
mixtureDistribCount Specify the number of Gaussiandistributions in the mixture.
64
maxLLk Specify maximum likelihood values. 200
minLLk Specify minimum likelihood values. -200
Table 6.2: Common con�guration parameters.
Speci�c con�guration parameters
Here we show the most important speci�c parameters for each tool used in the speaker de-tection, as well as the values used in this master thesis. The parameters for normalization,training and testing are shown in Table 6.2, 6.3 and 6.4, respectively.
38
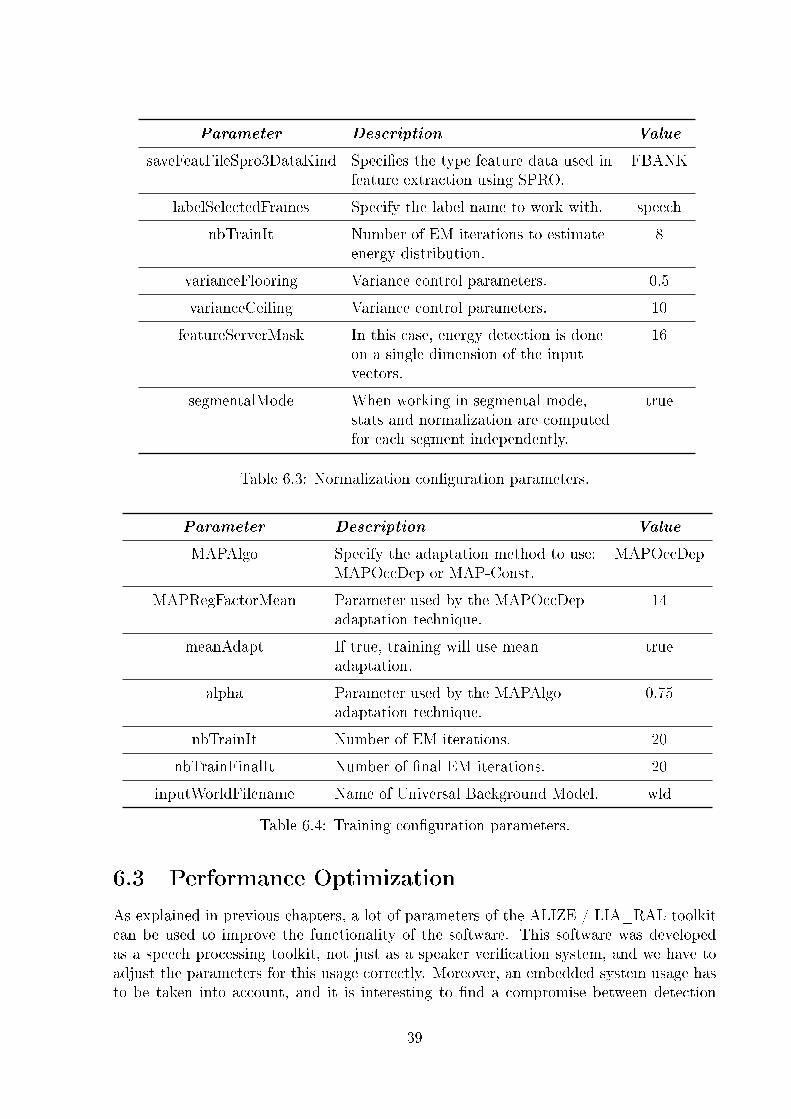
Parameter Description Value
saveFeatFileSpro3DataKind Speci�es the type feature data used infeature extraction using SPRO.
FBANK
labelSelectedFrames Specify the label name to work with. speech
nbTrainIt Number of EM iterations to estimateenergy distribution.
8
varianceFlooring Variance control parameters. 0.5
varianceCeiling Variance control parameters. 10
featureServerMask In this case, energy detection is doneon a single dimension of the inputvectors.
16
segmentalMode When working in segmental mode,stats and normalization are computedfor each segment independently.
true
Table 6.3: Normalization con�guration parameters.
Parameter Description Value
MAPAlgo Specify the adaptation method to use:MAPOccDep or MAP-Const.
MAPOccDep
MAPRegFactorMean Parameter used by the MAPOccDepadaptation technique.
14
meanAdapt If true, training will use meanadaptation.
true
alpha Parameter used by the MAPAlgoadaptation technique.
0.75
nbTrainIt Number of EM iterations. 20
nbTrainFinalIt Number of �nal EM iterations. 20
inputWorldFilename Name of Universal Background Model. wld
Table 6.4: Training con�guration parameters.
6.3 Performance Optimization
As explained in previous chapters, a lot of parameters of the ALIZE / LIA_RAL toolkitcan be used to improve the functionality of the software. This software was developedas a speech processing toolkit, not just as a speaker veri�cation system, and we have toadjust the parameters for this usage correctly. Moreover, an embedded system usage hasto be taken into account, and it is interesting to �nd a compromise between detection
39

Parameter Description Value
inputWorldFilename Name of saved world model. wld
ndxFilename Name of .ndx �le. not �xed
topDistribsCount Number of Gaussians used to computethe score.
10
computeLLKTopDistribs Complete or partial computationwhen computing LLK with "top"distributions.
COMPLETE
Table 6.5: Testing con�guration parameters.
rate and performance in the BeagleBoard. Thus, depending on the results obtained inthe next chapter, the maximum optimized con�guration �les will be shown in Annex B.
40
Chapter 7
Tests and Results
In this chapter, we present the results of the tests with the ALIZE / LIA_RAL on theBeagleBoard. Apart from describing the setup test and presenting the SV quality per-formance of the software, the text below is a comparison of a laptop and an embeddedplatform, so the performance measures and memory requirements di�erences will be pre-sented, too.
7.1 The ELSDSR Database
ELSDSR corpus design is a joint e�ort of the faculty, PhD students and Master studentsfrom the department of Informatics and mathematical modeling, Technical University ofDenmark (DTU). The speech language is English, and it is spoken by 20 Danes, oneIcelander and one Canadian. It was distributed among DTU Informatics as a �rst pre-liminary version in 2004.
The sampling frequency is chosen with 16 kHz having a bit rate of 16, and the audioformat is WAV. Part of the text, which is suggested as training subdivision, was madewith the attempt to capture all the possible pronunciation of English language includingthe vowels, consonants and diphthongs. The training text is the same for every speakerin the database. Regarding the suggested test subdivision, we will work with a forty-foursentences set (two sentences for each speaker).
For the training set, 161 (7*23) utterances were recorded; and for the test set, 46 (2*23)utterances were provided. On average, the duration for reading the training data is: 78.6sfor male; 88.3s for female; and 83s for all. The duration for reading test data, on average,is: 16.1s (male); 19.6s (female); and 17.6s (for all)1.
The ELSDSR database has enough samples to get robust conclusions. Using huge databases,with more information requires much more processing time for train models and collectdata and does not supply any extra information to this thesis.
1http://www2.imm.dtu.dk/~lfen/elsdsr/
41
7.2 Setting up the Test Environment
As mentioned before, ELSDSR Database consists of 23 speakers: 13 males and 10 females.Every speaker entry consists of 7 utterances for training and 2 utterances for testing. Themore clients are in the database, the more realistic the test will be, so the entire databasewill be used for enrollment in our thesis.
Theoretically, clients2 and impostors3 must be di�erent. Due to the limited amount ofdata (we have just 23 people samples), all speakers are used as clients as well as impostors,so:
� Number of clients: 23
� Number of impostors: 23
Creating the universal background speech model requires a large amount of data, since itmust include all possible speech data. The more data the UBM contains, the more robustthe model will be. Typically, SV tests use very large databases to create these models. Inthis test, however, we will use all available training data to create the UBM, having 161utterances.
This database is quite small, and it is not enough to get successful and realistic speakerveri�cation results. Nevertheless, the main purpose of this master thesis is to compare theperformance of the speaker veri�cation system in both platforms, not to obtain accurateresults of SV.
7.3 Performing the Test
After the preparation of the test environment, one can proceed with the testing. This partapplies the numerous steps described in Chapter 6 using a database as ELSDSR. We justwant to compare the veri�cation results, so the training stage will be performed always inthe laptop. Thus, the fetaures extraction, the Universal Background Model creation andthe client enrollement will not be done on the BeagleBoard.
Once the UBM and the client models are created, they must be copied on the Beagle-Board SD card. After using the cross-compilation tools described in Subsection 5.3 weare able to launch the ComputeTest LIA/RAL tool on both laptop and BeagleBoardsystems. In order to get results, the ComputeTest tool is launched using trained UBMand client models in both laptop and BeagleBoard platforms. It is important to use thesame parameters in both platforms, in order to compare the requirements with the samecon�guration in both sides.
The relevance factor is usually considered to conclude the results of a speaker veri�cationsystem. However, in this master thesis we do not want to evaluate the quality of the SV,
2Enrolled user in the database3Unregistered user in the database, who tries to log in.
42
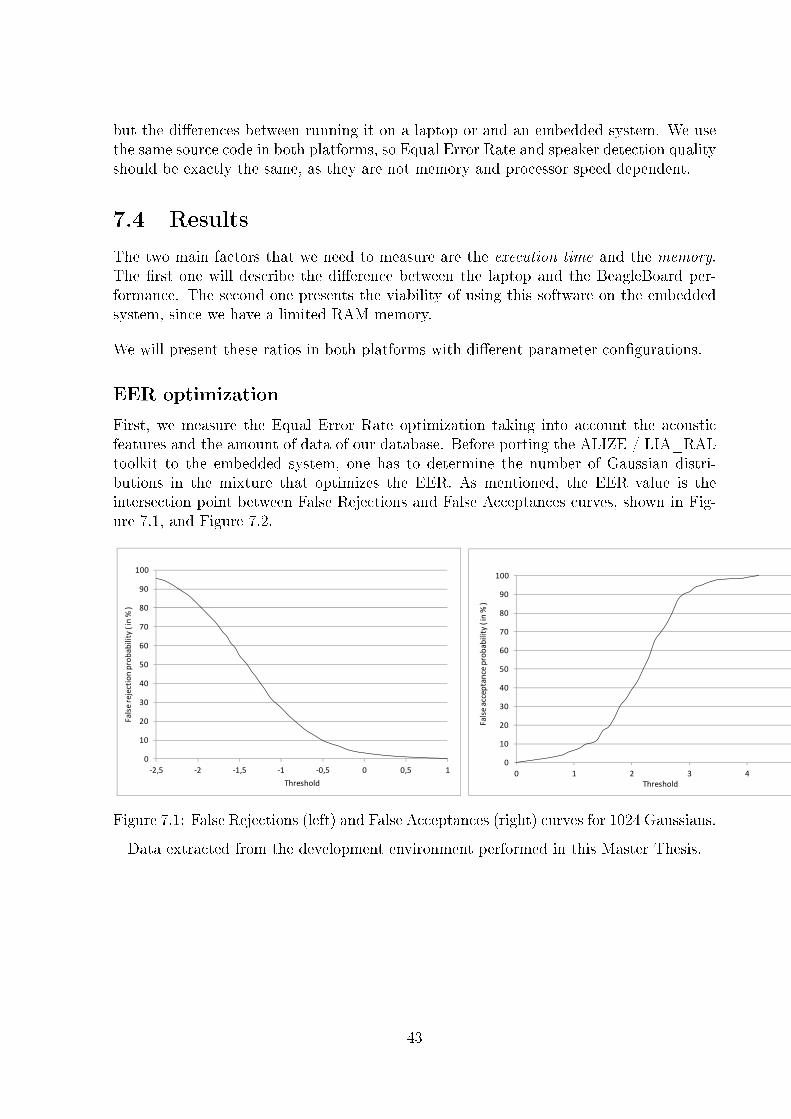
but the di�erences between running it on a laptop or and an embedded system. We usethe same source code in both platforms, so Equal Error Rate and speaker detection qualityshould be exactly the same, as they are not memory and processor speed dependent.
7.4 Results
The two main factors that we need to measure are the execution time and the memory.The �rst one will describe the di�erence between the laptop and the BeagleBoard per-formance. The second one presents the viability of using this software on the embeddedsystem, since we have a limited RAM memory.
We will present these ratios in both platforms with di�erent parameter con�gurations.
EER optimization
First, we measure the Equal Error Rate optimization taking into account the acousticfeatures and the amount of data of our database. Before porting the ALIZE / LIA_RALtoolkit to the embedded system, one has to determine the number of Gaussian distri-butions in the mixture that optimizes the EER. As mentioned, the EER value is theintersection point between False Rejections and False Acceptances curves, shown in Fig-ure 7.1, and Figure 7.2.
�
��
��
��
��
��
��
��
�
�
���
���� �� ���� �� ���� � ��� �
������������ ��������������� �����
��������
�
��
��
��
��
��
��
��
�
�
���
� � � � � �
������������������ � ������������
�� ������
Figure 7.1: False Rejections (left) and False Acceptances (right) curves for 1024 Gaussians.
Data extracted from the development environment performed in this Master Thesis.
43

Figure 7.2: Equal Error Rate point in the 1042 GMM test.
ERR is the intersection point of false acceptances (red) and false rejections (black).
This intersection point can vary depending on a number of factors, so Table 7.1 presentsthe results in terms of accuracy varying Gaussian mixtures and iterations number. Theresults come from evaluating the database using the setting up described in section 7.2 andtesting di�erent combinations of mixtures distributions and world iterations (worldits).This last parameter describes the number of times the client model is calculated againstthe UBM model. Finally, the average model is obtained.
44
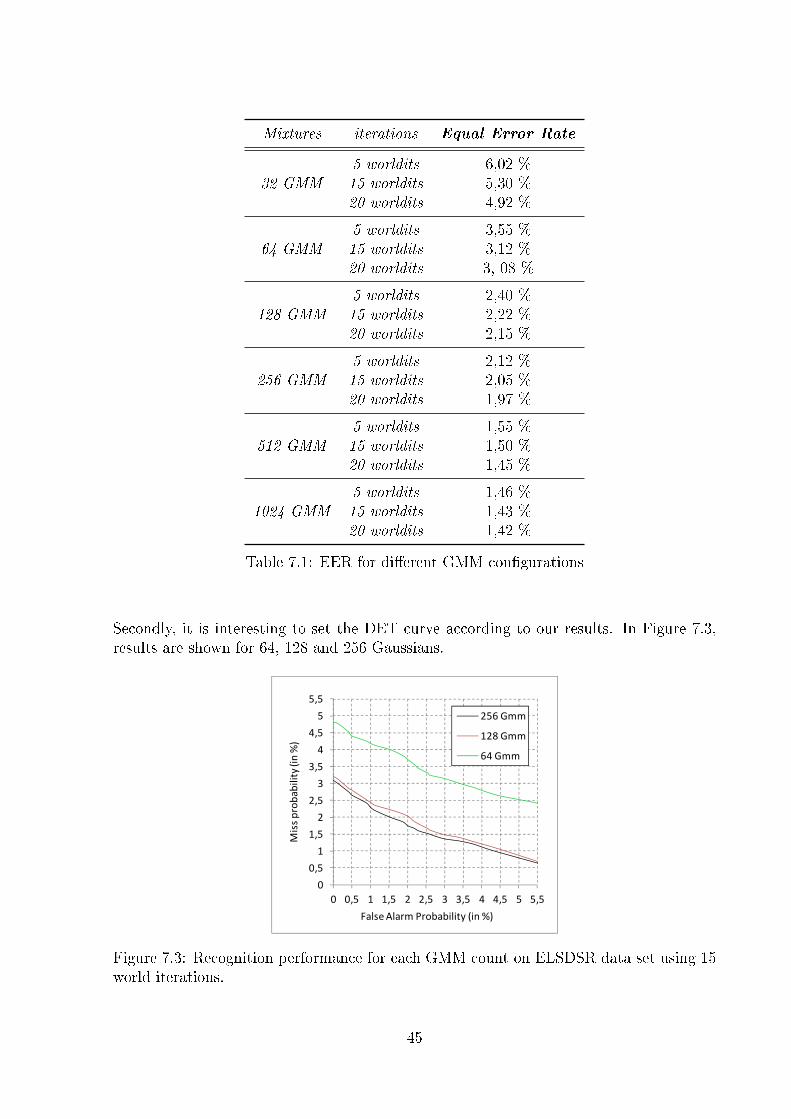
Mixtures iterations Equal Error Rate
5 worldits 6,02 %32 GMM 15 worldits 5,30 %
20 worldits 4,92 %
5 worldits 3,55 %64 GMM 15 worldits 3,12 %
20 worldits 3, 08 %
5 worldits 2,40 %128 GMM 15 worldits 2,22 %
20 worldits 2,15 %
5 worldits 2,12 %256 GMM 15 worldits 2,05 %
20 worldits 1,97 %
5 worldits 1,55 %512 GMM 15 worldits 1,50 %
20 worldits 1,45 %
5 worldits 1,46 %1024 GMM 15 worldits 1,43 %
20 worldits 1,42 %
Table 7.1: EER for di�erent GMM con�gurations
Secondly, it is interesting to set the DET curve according to our results. In Figure 7.3,results are shown for 64, 128 and 256 Gaussians.
� ��� � ��� � ��� � ��� � ��� � ���
�
���
�
���
�
���
�
���
�
���
�
���
��� ��� ��������� ��� ��
���� ��������� ��� ��
��� ���
��� ���
�� ���
Figure 7.3: Recognition performance for each GMM count on ELSDSR data set using 15world iterations.
45

Memory requirements
The BeagleBoard OMAP3530 processor includes 256MB NAND memory in all versions.In this tests the revision BeagleBoard.5 is used, which also includes an additional 128MBDDR. The laptop has 1GB RAM. Note that the feature extraction memory requirementis not contemplated in the table below:
Memory type5 s (175Kb) audio �le 8 s (256Kb) audio �le
Laptop BeagleBoard Laptop BeagleBoard
Virtual Memory 2,10 (0,21%) 2,38 (1,85%) 3,24 (0,32%) 3,45 (2,69%)
Resident Set Size 1,31 (0,13%) 1,66 (1,29%) 2,32 (0,23%) 2,71 (2,10%)
Table 7.2: RAM requirements on the PC / BeagleBoard for 1024 GMM.
The measures have been taken on a 1024 testing system, using the entire ELSDSRdatabase
The measurements have been performed for a system of 1024 and 512 Gaussian, and theresults are quite similar. This is why we can assume the no-dependency between theRAM consumption and the number of Gaussian Mixtures used in the test. As we can see,the memory requirements are not going to be a major handicap, so in the following suchsections we will omit the memory measurements.
Time results
The time requirement of this speaker veri�cation system is the most important part ofthe master thesis. The identi�cation time depends on the number of feature vectors, thecomplexity of the speaker models and the number of speakers. We want to analyze if itis possible to perform it in a real test, taking into account the computational cost that itrepresents. The time of the test has been divided into two parts: The �rst one is to get thetime of the processing phases that do not depend on the mixture distribution count used.It means, features extraction, signal processing and normalization stages. The second oneconsists on evaluating the training and testing stages using di�erent number of mixturescounts and world iterations.
It is important to understand that the total amount of time expended by our applicationwill be the sum of the time of both stages. Using tFE as features extraction time and tSPas signal processing time, we can de�ne the total training time as:
Ttrain = (tFE + tSP ) ∗ nfiles + ttrain
On the other hand, the total testing time is de�ned as:
Ttest = tFE + tSP + ttest
46
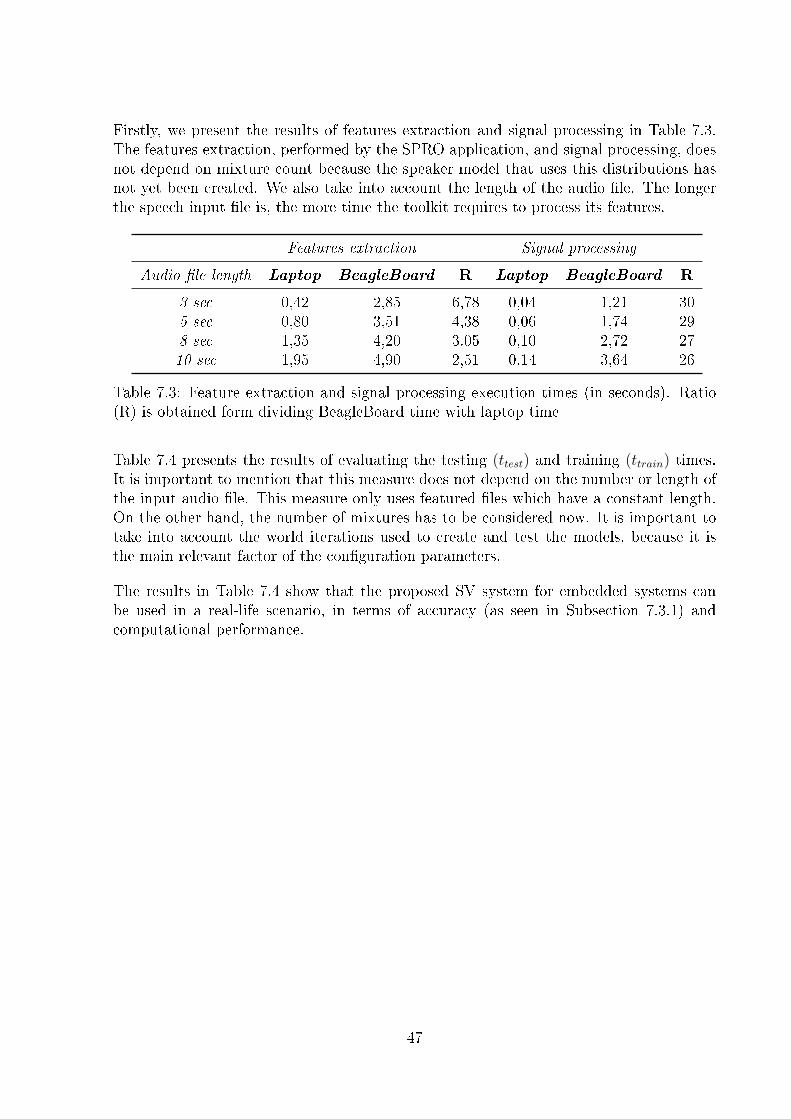
Firstly, we present the results of features extraction and signal processing in Table 7.3.The features extraction, performed by the SPRO application, and signal processing, doesnot depend on mixture count because the speaker model that uses this distributions hasnot yet been created. We also take into account the length of the audio �le. The longerthe speech input �le is, the more time the toolkit requires to process its features.
Features extraction Signal processing
Audio �le length Laptop BeagleBoard R Laptop BeagleBoard R
3 sec 0,42 2,85 6,78 0,04 1,21 305 sec 0,80 3,51 4,38 0,06 1,74 298 sec 1,35 4,20 3.05 0,10 2,72 2710 sec 1,95 4,90 2,51 0,14 3,64 26
Table 7.3: Feature extraction and signal processing execution times (in seconds). Ratio(R) is obtained form dividing BeagleBoard time with laptop time
Table 7.4 presents the results of evaluating the testing (ttest) and training (ttrain) times.It is important to mention that this measure does not depend on the number or length ofthe input audio �le. This measure only uses featured �les which have a constant length.On the other hand, the number of mixtures has to be considered now. It is important totake into account the world iterations used to create and test the models, because it isthe main relevant factor of the con�guration parameters.
The results in Table 7.4 show that the proposed SV system for embedded systems canbe used in a real-life scenario, in terms of accuracy (as seen in Subsection 7.3.1) andcomputational performance.
47

Testing Training
Mixtures Iterations Laptop BeagleBoard R Laptop BeagleBoard R
5 worldits 10,74 24,35 2,26 18 272 15,1132 GMM 15 worldits 11,33 29,12 2.57 19 300 15,78
20 worldits 12,31 33,10 2,68 21 321 15,28
5 worldits 10,89 29,67 2,72 25 382 15,2864 GMM 15 worldits 12,70 31,88 2,51 27 405 15
20 worldits 14,51 36.10 2,48 31 469 15,12
5 worldits 13,15 32,44 2,46 35 533 15,22128 GMM 15 worldits 16,20 35,67 2,20 37 579 15,64
20 worldits 18,45 40,08 2,17 42 657 15,63
5 worldits 16,81 39.16 2,33 48 746 15,56256 GMM 15 worldits 20,75 45,12 2,17 51 776 15,21
20 worldits 25,25 52,13 2,06 54 813 15,05
5 worldits 24,50 68,84 2,81 63 973 15,44512 GMM 15 worldits 30,41 78,21 2,57 67 1075 16,06
20 worldits 32,20 85,90 2,66 71 1113 15,67
5 worldits 30,15 82,91 2.75 80 1271 15,891024 GMM 15 worldits 37,12 90.59 2,44 84 1319 15,70
20 worldits 44,15 101,66 2.30 89 1420 15,95
Table 7.4: Testing and training execution time comparison (in seconds).
48
Chapter 8
Discussion
In this chapter, a general discussion of the results obtained in the previous chapters willbe presented.
During the research, cross-compilation was the stage that was more di�cult to obtain.Some operating systems were tested on the BeagleBoard and the minimal Angstromsystem was the one that presents the best performance in terms of processing time.
Another point worth interesting is the acquisition of the optimal parameters in the ALIZE/ LIA_RAL con�guration. When reading the literature about this Speaker Veri�cationsystem, certain speci�c con�gurations can be disregarded on embedded systems, dueto excessive processing time. Nevertheless, hard work of testing and analyzing speci�cparameter combinations was done. Using the measurements obtained in Table 7.4, theresults presented in the Annex show the best optimization of embedded system, ensuringthe same veri�cation results as in the laptop.
We can determine that due to processing requirements, it is more reliable to do just thetraining stage in the embedded system, as has been done in this Master Thesis. If wetake a look on Table 7.4, we can conclude that the time di�erence ratios between thelaptop and the BeagleBoard grows up for the training process. For example, taking 64GMM, the laptop spended 20 seconds for training stage. On the other hand, the ARMprocessor of the BeagleBoard took 400 seconds, i.e the training stage is 15 times slower inthe embedded system. If we work with databases that take 3-4 minutes for the training inthe laptop, the process would take more than 45 minutes in the BeagleBoard, that is notuseful in practice when using embedded systems. However, the testing process could beexecuted with large amount of data, considering a physical implementation of the system,the run time is consistent compared to the execution time on laptop.
49

Chapter 9
Conclusion and Outlook
In this chapter, we conclude our thesis and present an outlook to future work to advancein this �eld of research.
9.1 Conclusion
In this thesis the performance viability of a speaker verication software on an embeddedsystem has been evaluated. We present a comprehensive study of the ALIZE / LIA_RALtoolkit as embedded system, and the Beagleboard as a target system. We have also haveperformed tests that show the possibilities of this speaker veri�cation toolkit on embeddedsystems. The evaluation has been carried out using the ELSDSR public database.
Our tests indicate that the ALIZE / LIA_RAL speaker veri�cation system can be portedto the Beagleboard and most probably to other ARM embedded systems. As a �nding,the tests conclude that we can get exactly the same Equal Error Ratio in the Beagleboardand in the laptop. However, the processing time is highly increased in the embeddedsystem, compared to the laptop one. Furthermore, we presented an optimal con�gurationof the ALIZE / LIA_RAL parameters, in order to get the best results in the ARM system,in terms of EER.
As a conclusion, the processing time is the most relevant factor that di�erentiate thelaptop and the embedded system functionality. Our tests indicate that time ratio isincreased by a factor of ~15, and we can conclude that this system can be used only fortesting purposes, as time for training is too long.
9.2 Outlook
This master thesis validates the correct functionality of the ALIZE / LIA_RAL toolkiton embedded systems, almost for testing purposes. In order to obtain our own speakerveri�cation software, speci�c for embedded systems applications, the main goal will be:
� Test the ALIZE / LIA_RAL Speaker Veri�cation toolkit with a larger database.
50

� Port this software to other ARM architecture, and compare the results with theobtained using the Beagleboard.
� Improve the ALIZE / LIA_RAL Speaker Veri�cation source code omptimizing thecode for these embedded systems.
51
Bibliography
[1] T. Kamm-M. Ordowski M. Przybocki A. Martin, G. Doddington. The det curve inassessment of detection task performance. Proceedings of Eurospeech, 4, 1997.
[2] D.B Rubin A.P. Dempster, N.M. Laird. Maximum-likelihood from incomplete datavia the em algorithm. Journal of the Royal Statistical Society, Ser. B, 39, 1977.
[3] J. Pelecanos-G.N. Ramaswamy B. Tydlitat, J. Navratil. Text-independent speakerveri�cation in embedded environments. In proceedings of IEEE International Con-ference on Acoustics, Speech, and Signal Processing, Honolulu, 2007.
[4] L.R. Rabiner B.H. Juang. Automatic speech recognition: A brief history of thetechnology development. Georgia Institute of Technology, Atlanta, 2005.
[5] J. Bilmes. A gentle tutorial of the em algorithm and its application to parameterestimation for gaussian mixture and hidden markov models. International ComputerScience Institute, 1998.
[6] T. Yingthawornsuk C. Ittichaichareon, S. Suksri. Speech recognition using mfcc.International Conference on Computer Graphics, Simulation and Modeling, 2012.
[7] L.P. Heck D.A. Reynolds. Automatic speaker recognition. AAAS Meeting, Humans,Computers and Speech Symposium, 2000.
[8] R.B. Dunn D.A. Reynolds, T.F. Quatieri. Speaker veri�cation using adapted gaussianmixture models. Digital Signal Processing, M.I.T, Lincoln Laboratory,Lexington,Massachusetts, 2000.
[9] R.C. Rose D.A. Reynolds. Robust text-independent speaker identi�cation using gaus-sian mixture speaker models. Lincoln Laboratory, MIT, Lexington, MA, 1995.
[10] D.Reynolds. Universal background models. MIT Lincoln Laboratory, USA, 2001.
[11] S. Sridharan J. Pelecanos. Feature warping for robust speaker veri�cation. ISCAWorkshop on Speaker Recognition, 2001.
[12] S. Meignier J.F. Bonastre, F. Wils. Alize, a free toolkit for speaker recognition. LIA/ CNRS, Universite Avignon, 2005.
[13] H. Jiang. Con�dence measures for speech recognition: A survey. Speech Communi-cation, 45, No.4, 2005.
52
[14] B.H. Juang L.R. Rabiner. Fundamentals of speech recognition. Prentice Hall, En-glewood Clis, New Jersey, 1993.
[15] B.H. Juang L.R. Rabiner. An introduction to hidden markov models. IEEE ASSPMagazine, 3, 1996.
[16] H. Lloyd-Thomas R. Auckenthaler, M. Carey. Score normalization for text-independent speaker veri�cation systems. Digital Signal Processing, 10, 2000.
[17] L.R. Rabiner. A tutorial on hidden markov models and selected applications inspeech recognition. ATT Bell Lab, Murray Hill, New Jersey, 1989.
[18] V. Tiwari. Mfcc and its applications in speaker recognition. International Journalon Emerging Technologies, 2012.
[19] D.A. Reynolds W.M. Campbell, D.E. Sturim. Support vector machines using gmmsupervectors for speaker veri�cation. MIT Lincoln Laboratory, 2006.
[20] K.H. Pun Y.S. Moon, C.C. Leung. Fixed-point gmm-based speaker veri�cation overmobile embedded system. Department of Computer Science and Engineering, TheChinese University of Hong Kong, Shatin, 2003.
53
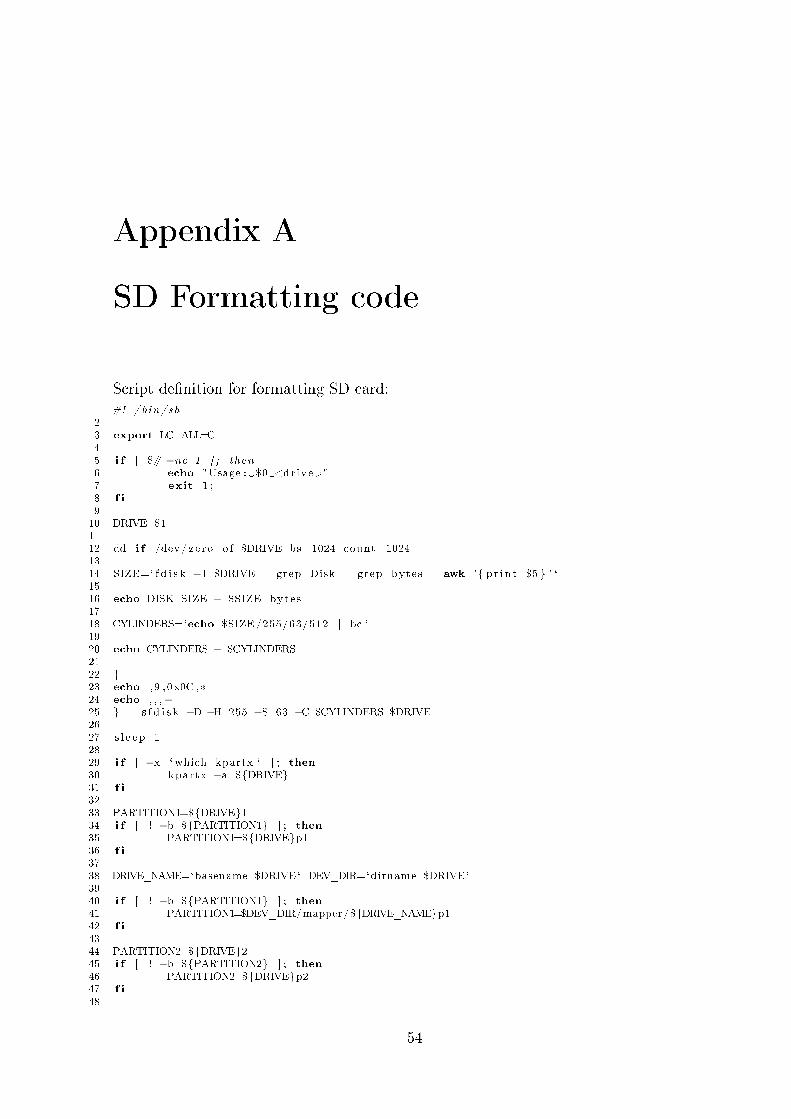
Appendix A
SD Formatting code
Script de�nition for formatting SD card:1 #! / bin /sh23 export LC_ALL=C45 i f [ $# −ne 1 ] ; then6 echo "Usage : $0 <drive>"7 exit 1 ;8 f i
910 DRIVE=$11112 dd i f=/dev/ zero o f=$DRIVE bs=1024 count=10241314 SIZE=` f d i s k − l $DRIVE | grep Disk | grep bytes | awk '{ p r i n t $5 } ' `1516 echo DISK SIZE − $SIZE bytes1718 CYLINDERS=`echo $SIZE/255/63/512 | bc `1920 echo CYLINDERS − $CYLINDERS2122 {23 echo , 9 ,0x0C ,*24 echo , , ,−25 } | s f d i s k −D −H 255 −S 63 −C $CYLINDERS $DRIVE2627 s l e e p 12829 i f [ −x ` which kpartx ` ] ; then
30 kpartx −a ${DRIVE}31 f i
3233 PARTITION1=${DRIVE}134 i f [ ! −b ${PARTITION1} ] ; then
35 PARTITION1=${DRIVE}p136 f i
3738 DRIVE_NAME=`basename $DRIVE` DEV_DIR=`dirname $DRIVE`3940 i f [ ! −b ${PARTITION1} ] ; then
41 PARTITION1=$DEV_DIR/mapper/${DRIVE_NAME}p142 f i
4344 PARTITION2=${DRIVE}245 i f [ ! −b ${PARTITION2} ] ; then
46 PARTITION2=${DRIVE}p247 f i
48
54

49 i f [ ! −b ${PARTITION2} ] ; then
50 PARTITION2=$DEV_DIR/mapper/${DRIVE_NAME}p251 f i
5253 #make p a r t i t i o n s .5455 i f [ −b ${PARTITION1} ] ; then
56 umount ${PARTITION1}57 mkfs . v f a t −F 32 −n "boot" ${PARTITION1}58 else
59 echo "Cant f i nd boot p a r t i t i o n in /dev"60 f i
61 i f [ −b ${PARITION2} ] ; then
62 umount ${PARTITION2}63 mke2fs −j −L "Angstrom" ${PARTITION2}64 else
65 echo "Cant f i nd r o o t f s p a r t i t i o n in /dev"66 f i
55
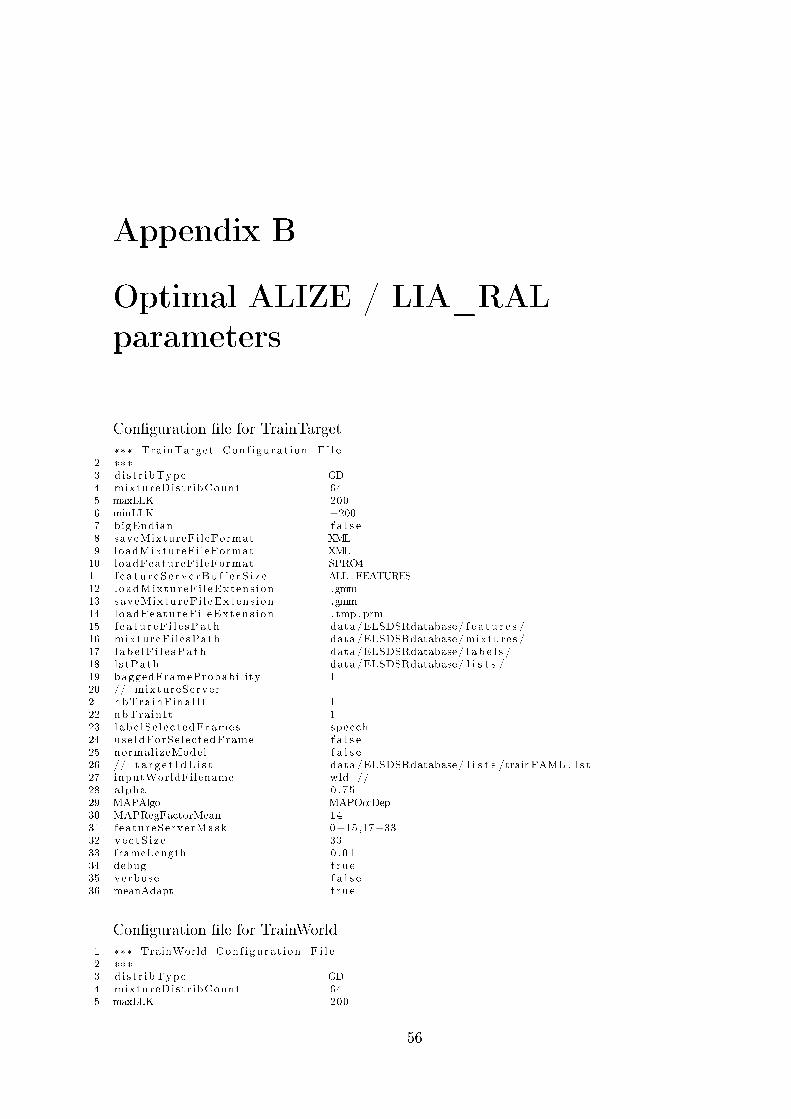
Appendix B
Optimal ALIZE / LIA_RALparameters
Con�guration �le for TrainTarget1 *** TrainTarget Conf igurat ion F i l e2 ***
3 d i s t r ibType GD4 mixtureDistr ibCount 645 maxLLK 2006 minLLK −2007 bigEndian f a l s e8 saveMixtureFi leFormat XML9 loadMixtureFi leFormat XML10 loadFeatureFi leFormat SPRO411 f e a t u r eS e r v e rBu f f e r S i z e ALL_FEATURES12 loadMixtureFi l eExtens ion .gmm13 saveMixtureFi l eExtens ion .gmm14 loadFeatureF i l eExtens ion . tmp . prm15 f e a tu r eF i l e sPa th data/ELSDSRdatabase/ f e a t u r e s /16 mixtureFi le sPath data/ELSDSRdatabase/mixtures /17 l ab e lF i l e sPa th data/ELSDSRdatabase/ l a b e l s /18 l s tPath data/ELSDSRdatabase/ l i s t s /19 baggedFrameProbabi l ity 120 // mixtureServer21 nbTra inFina l I t 122 nbTrainIt 123 labe lSe l e c t edFrames speech24 useIdForSelectedFrame f a l s e25 normalizeModel f a l s e26 // t a r g e t I dL i s t data/ELSDSRdatabase/ l i s t s /trainFAML . l s t27 inputWorldFilename wld //28 alpha 0 .7529 MAPAlgo MAPOccDep30 MAPRegFactorMean 1431 featureServerMask 0−15,17−3332 ve c tS i z e 3333 frameLength 0 .0134 debug true35 verbose f a l s e36 meanAdapt t rue
Con�guration �le for TrainWorld1 *** TrainWorld Conf igurat ion F i l e2 ***
3 d i s t r ibType GD4 mixtureDistr ibCount 645 maxLLK 200
56
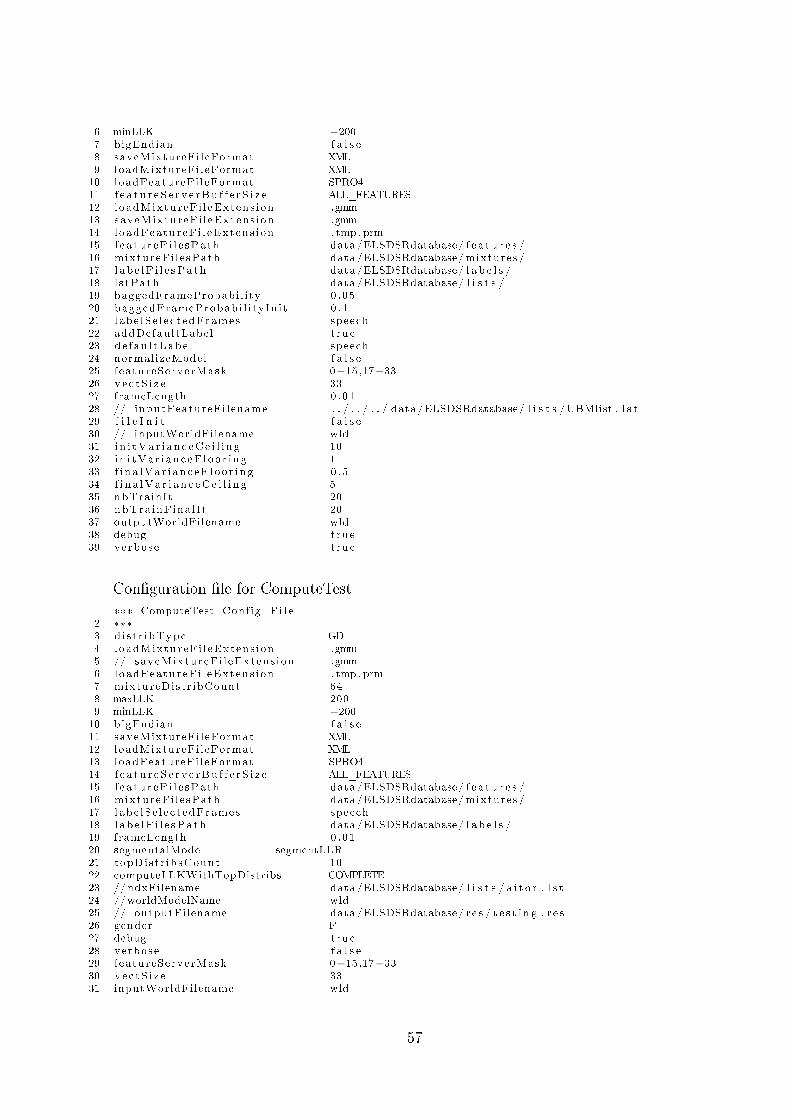
6 minLLK −2007 bigEndian f a l s e8 saveMixtureFi leFormat XML9 loadMixtureFi leFormat XML10 loadFeatureFi leFormat SPRO411 f e a t u r eS e r v e rBu f f e r S i z e ALL_FEATURES12 loadMixtureFi l eExtens ion .gmm13 saveMixtureFi l eExtens ion .gmm14 loadFeatureF i l eExtens ion . tmp . prm15 f e a tu r eF i l e sPa th data/ELSDSRdatabase/ f e a t u r e s /16 mixtureFi le sPath data/ELSDSRdatabase/mixtures /17 l ab e lF i l e sPa th data/ELSDSRdatabase/ l a b e l s /18 l s tPath data/ELSDSRdatabase/ l i s t s /19 baggedFrameProbabi l ity 0 .0520 baggedFrameProbabi l i tyIn i t 0 . 121 labe lSe l e c t edFrames speech22 addDefaultLabel t rue23 de f au l tLabe l speech24 normalizeModel f a l s e25 featureServerMask 0−15,17−3326 ve c tS i z e 3327 frameLength 0 .0128 // inputFeatureFi lename . . / . . / . . / data/ELSDSRdatabase/ l i s t s /UBMlist . l s t29 f i l e I n i t f a l s e30 // inputWorldFilename wld31 i n i tVa r i a n c eCe i l i n g 1032 i n i tVa r i an c eF l oo r i ng 133 f i n a lVa r i an c eF l o o r i n g 0 .534 f i n a lVa r i a n c eCe i l i n g 535 nbTrainIt 2036 nbTra inFina l I t 2037 outputWorldFilename wld38 debug true39 verbose t rue
Con�guration �le for ComputeTest
1 *** ComputeTest Config F i l e2 ***
3 d i s t r ibType GD4 loadMixtureFi l eExtens ion .gmm5 // saveMixtureFi l eExtens ion .gmm6 loadFeatureF i l eExtens ion . tmp . prm7 mixtureDistr ibCount 648 maxLLK 2009 minLLK −20010 bigEndian f a l s e11 saveMixtureFi leFormat XML12 loadMixtureFi leFormat XML13 loadFeatureFi leFormat SPRO414 f e a t u r eS e r v e rBu f f e r S i z e ALL_FEATURES15 f e a tu r eF i l e sPa th data/ELSDSRdatabase/ f e a t u r e s /16 mixtureFi le sPath data/ELSDSRdatabase/mixtures /17 labe lSe l e c t edFrames speech18 l ab e lF i l e sPa th data/ELSDSRdatabase/ l a b e l s /19 frameLength 0 .0120 segmentalMode segmentLLR21 topDistr ibsCount 1022 computeLLKWithTopDistribs COMPLETE23 //ndxFilename data/ELSDSRdatabase/ l i s t s / a i t o r . l s t24 //worldModelName wld25 // outputFilename data/ELSDSRdatabase/ r e s / t e s t i n g . r e s26 gender F27 debug true28 verbose f a l s e29 featureServerMask 0−15,17−3330 ve c tS i z e 3331 inputWorldFilename wld
57
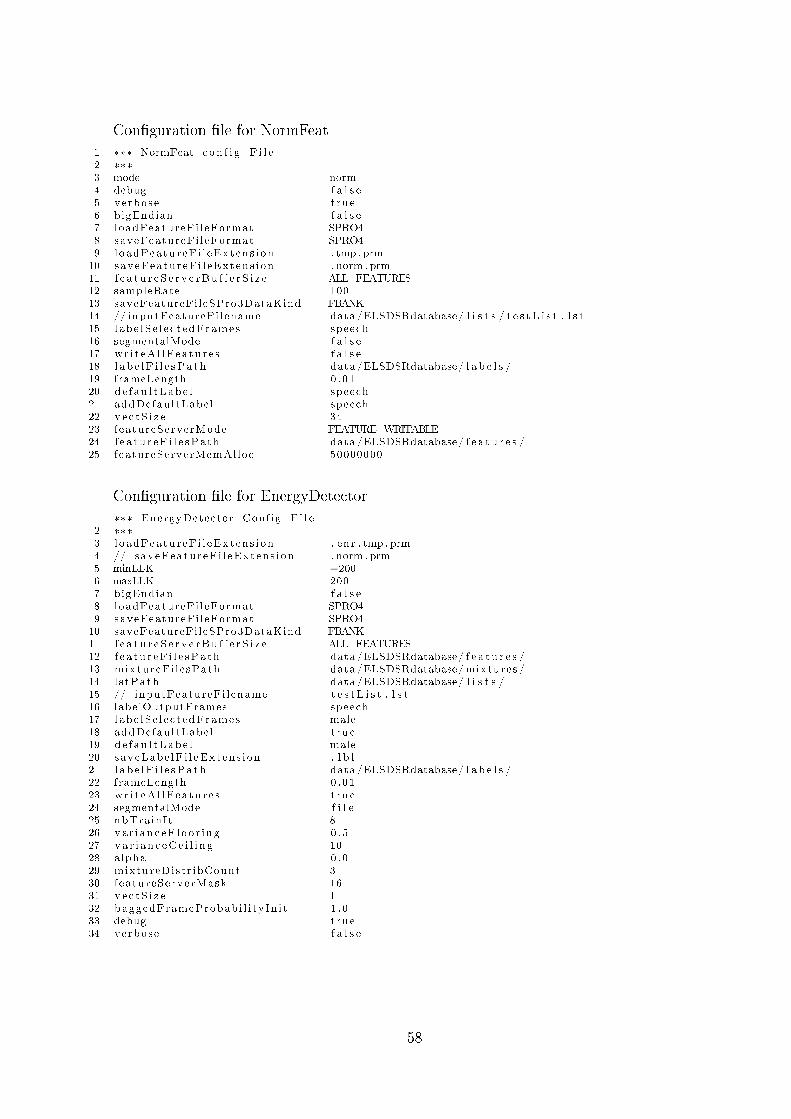
Con�guration �le for NormFeat
1 *** NormFeat c on f i g F i l e2 ***
3 mode norm4 debug f a l s e5 verbose t rue6 bigEndian f a l s e7 loadFeatureFi leFormat SPRO48 saveFeatureFi leFormat SPRO49 loadFeatureF i l eExtens ion . tmp . prm10 saveFeatureF i l eExtens ion . norm . prm11 f e a t u r eS e r v e rBu f f e r S i z e ALL_FEATURES12 sampleRate 10013 saveFeatureFileSPro3DataKind FBANK14 // inputFeatureFi lename data/ELSDSRdatabase/ l i s t s / t e s t L i s t . l s t15 labe lSe l e c t edFrames speech16 segmentalMode f a l s e17 wr i t eA l lFea tu r e s f a l s e18 l ab e lF i l e sPa th data/ELSDSRdatabase/ l a b e l s /19 frameLength 0 .0120 de f au l tLabe l speech21 addDefaultLabel speech22 ve c tS i z e 3423 featureServerMode FEATURE_WRITABLE24 f e a tu r eF i l e sPa th data/ELSDSRdatabase/ f e a t u r e s /25 featureServerMemAlloc 50000000
Con�guration �le for EnergyDetector
1 *** EnergyDetector Conf ig F i l e2 ***
3 loadFeatureF i l eExtens ion . enr . tmp . prm4 // saveFeatureF i l eExtens ion . norm . prm5 minLLK −2006 maxLLK 2007 bigEndian f a l s e8 loadFeatureFi leFormat SPRO49 saveFeatureFi leFormat SPRO410 saveFeatureFileSPro3DataKind FBANK11 f e a t u r eS e r v e rBu f f e r S i z e ALL_FEATURES12 f e a tu r eF i l e sPa th data/ELSDSRdatabase/ f e a t u r e s /13 mixtureFi le sPath data/ELSDSRdatabase/mixtures /14 l s tPath data/ELSDSRdatabase/ l i s t s /15 // inputFeatureFi lename t e s t L i s t . l s t16 labelOutputFrames speech17 labe lSe l e c t edFrames male18 addDefaultLabel t rue19 de f au l tLabe l male20 saveLabe lF i l eExtens ion . l b l21 l ab e lF i l e sPa th data/ELSDSRdatabase/ l a b e l s /22 frameLength 0 .0123 wr i t eA l lFea tu r e s t rue24 segmentalMode f i l e25 nbTrainIt 826 va r i anceF loo r ing 0 .527 va r i an c eCe i l i n g 1028 alpha 0 .029 mixtureDistr ibCount 330 featureServerMask 1631 ve c tS i z e 132 baggedFrameProbabi l i tyIn i t 1 . 033 debug true34 verbose f a l s e
58