Embed Size (px)
Citation preview
Evaluation of Subbase Compaction Characteristics
Craig KumpelAndrew MeliciStephen RossiColin YurickDr. Beena Sukumaran
FAA Working Group Meetings, April 25, 2012

• Background and Objectives
• P-154 Test Results
• P-209 Test Results
• DGA Test Results
• Correlation of lab results with field data
• Conclusions
Outline
FAA Working Group Meetings, April 25, 2012
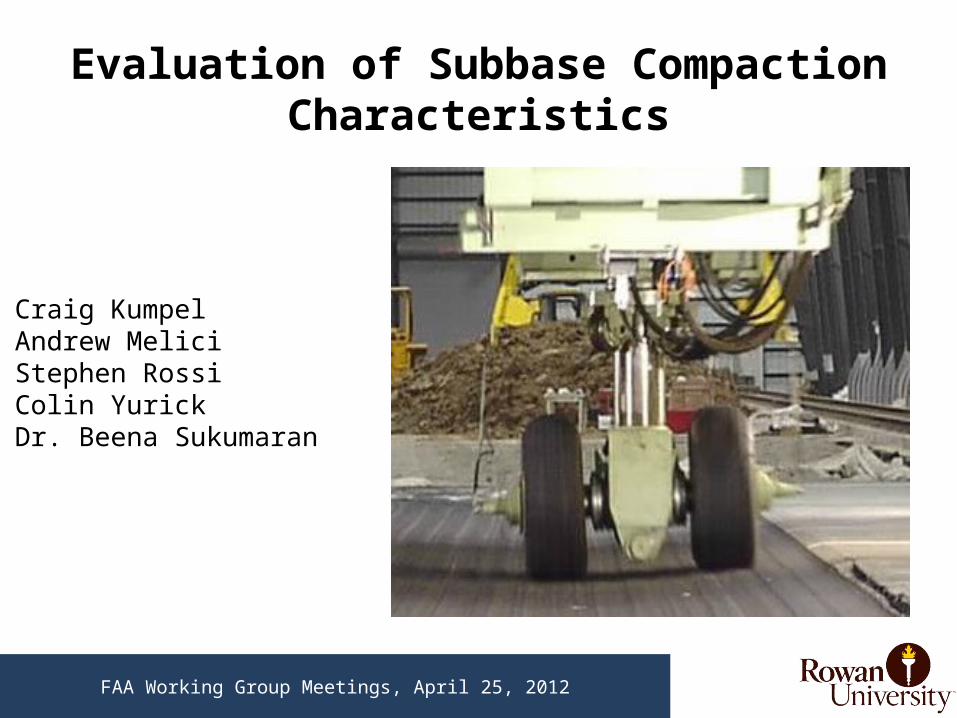
Background
• Continuous loading from airplane landing gear creates ruts in pavement
• Bigger and heavier planes with complex gear configurations make rut prevention more difficult
• FAA believes rutting at the National Airport Pavement Test Facility (NAPTF) for the chosen pavement configurations subjected to heavy aircraft loads is caused by densification of subbase
FAA Working Group Meetings, April 25, 2012
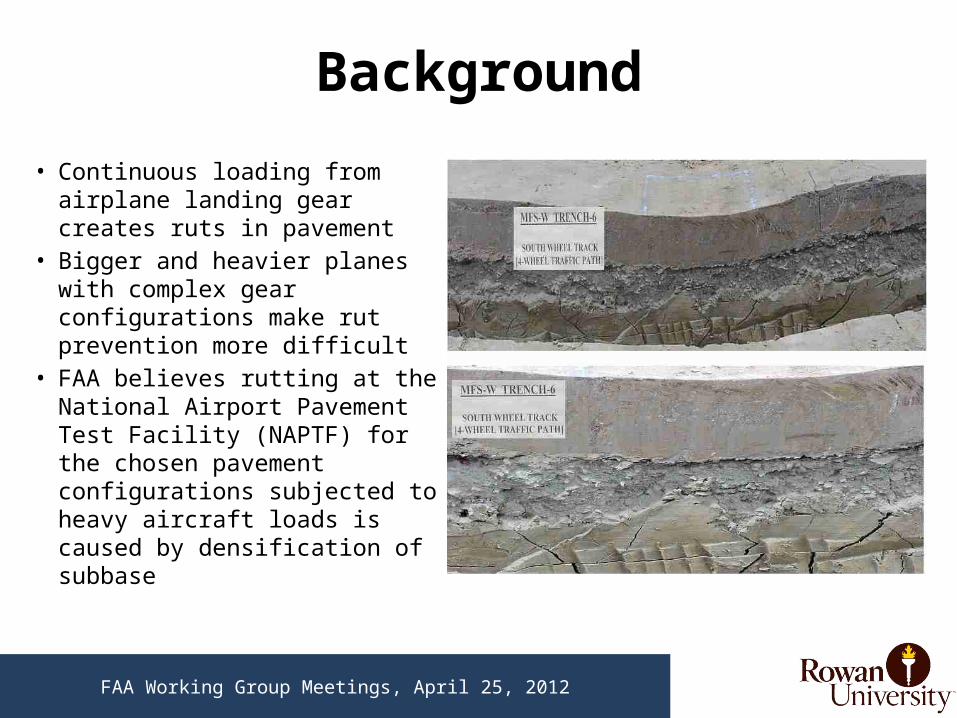
NAPTF – Rutting Behavior
North wheel track of CC3 flexible pavements at 19,500 passes
Garg and Hayhoe (2006)
FAA Working Group Meetings, April 25, 2012
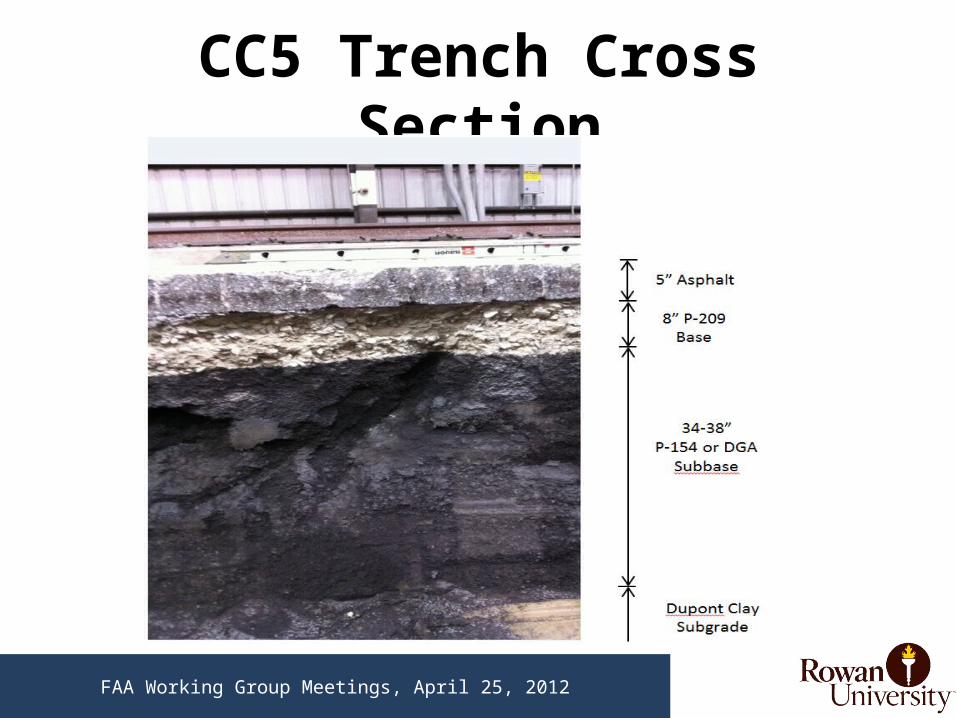
CC5 Trench Cross Section
FAA Working Group Meetings, April 25, 2012
Objectives
• Determine the correlation between trafficking passes of various aircrafts/construction equipment and number of gyrations in the SGC
• Determine the change in the performance metrics (includes shape and angularity of particles, as well as gradation) of the unbound aggregate when it is subjected to trafficking/gyrations in the SGC
• Determine the mechanism that is causing compaction of the unbound aggregate during trafficking
FAA Working Group Meetings, April 25, 2012
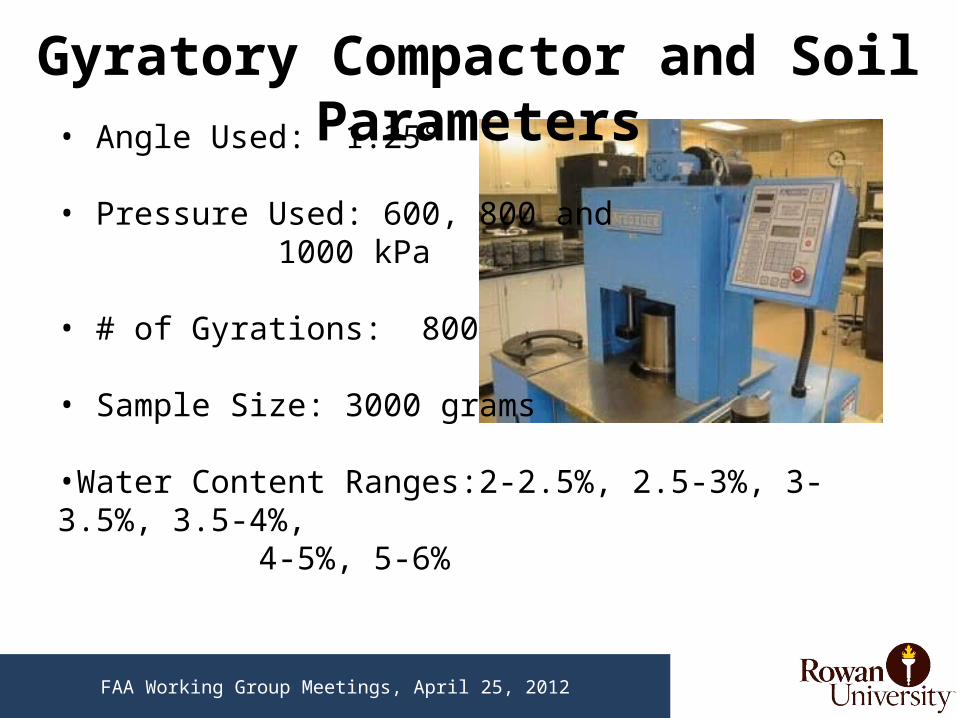
Gyratory Compactor and Soil Parameters
FAA Working Group Meetings, April 25, 2012
• Angle Used: 1.25°
• Pressure Used: 600, 800 and 1000 kPa
• # of Gyrations: 800
• Sample Size: 3000 grams
•Water Content Ranges:2-2.5%, 2.5-3%, 3-3.5%, 3.5-4%, 4-5%, 5-6%
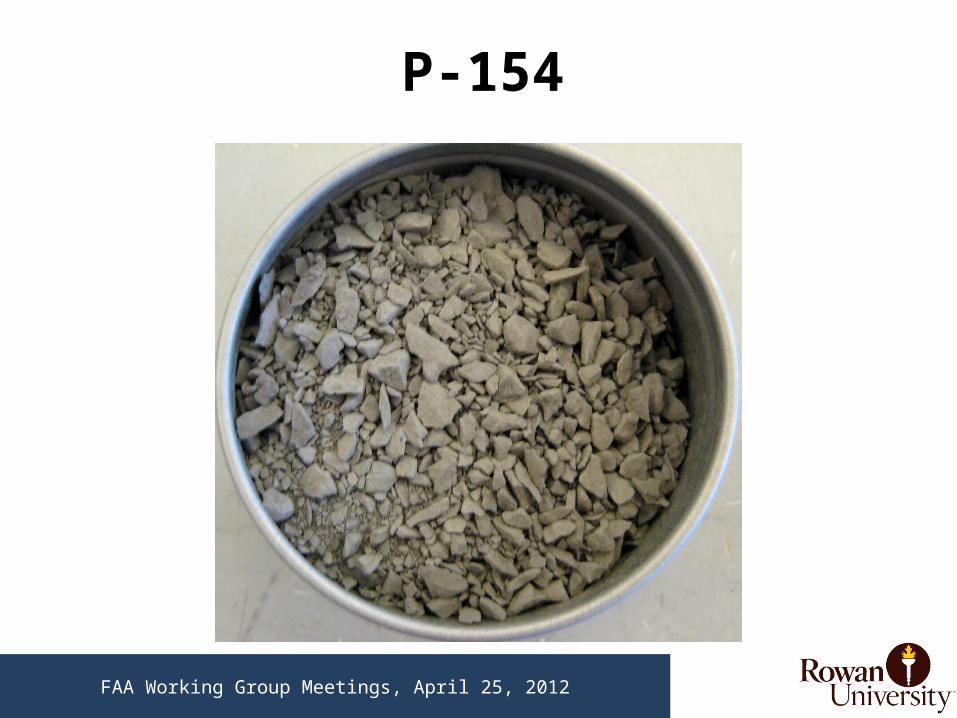
P-154
FAA Working Group Meetings, April 25, 2012

P-209
FAA Working Group Meetings, April 25, 2012
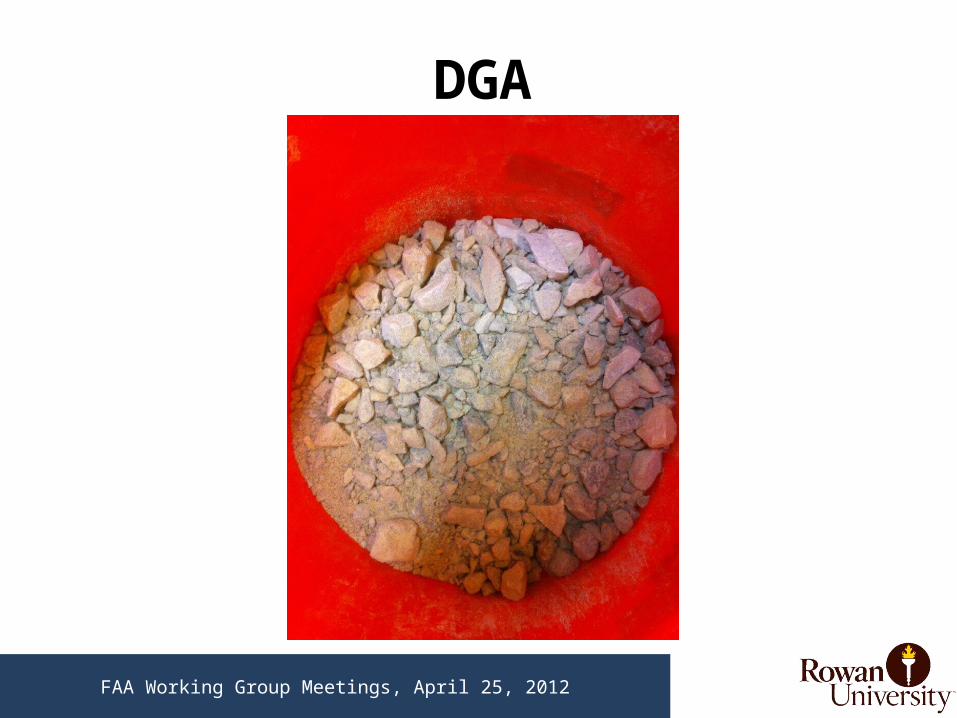
DGA
FAA Working Group Meetings, April 25, 2012
1.5 2 2.5 3 3.5 4 4.5 5 5.5 6 6.52000
2050
2100
2150
2200
2250
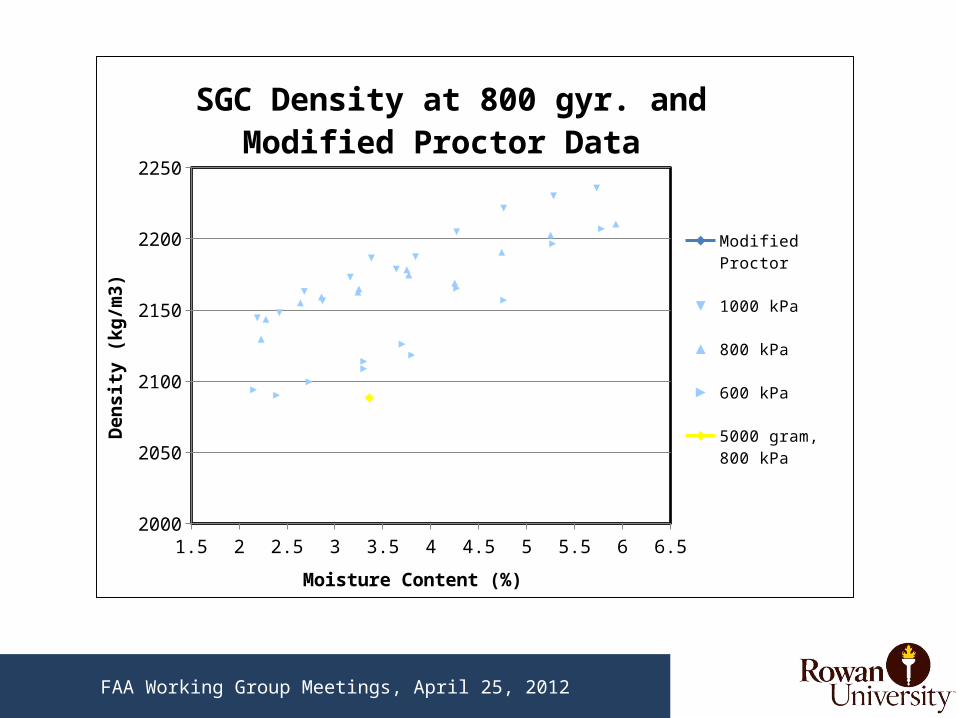
Modified Proctor
1000 kPa
800 kPa
600 kPa
5000 gram, 800 kPa
Moisture Content (%)
Den
sity
(kg/
m3)
SGC Density at 800 gyr. and Modified Proctor Data
FAA Working Group Meetings, April 25, 2012
FAA Working Group Meetings, April 25, 2012
1 2 3 4 5 6 7145
147
149
151
153
155
157
159
161
163
165
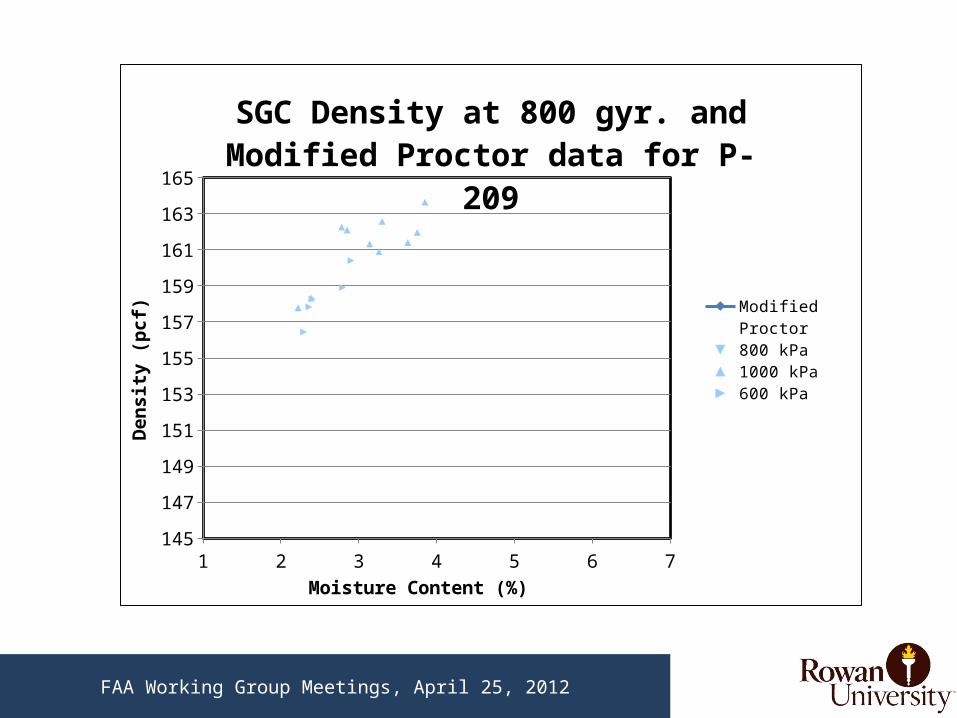
SGC Density at 800 gyr. and Modified Proctor data for P-209
Modified Proctor
800 kPa
1000 kPa
600 kPa
Moisture Content (%)
Den
sity
(pcf
)
FAA Working Group Meetings, April 25, 2012
1 2 3 4150
152
154
156
158
160
162
164
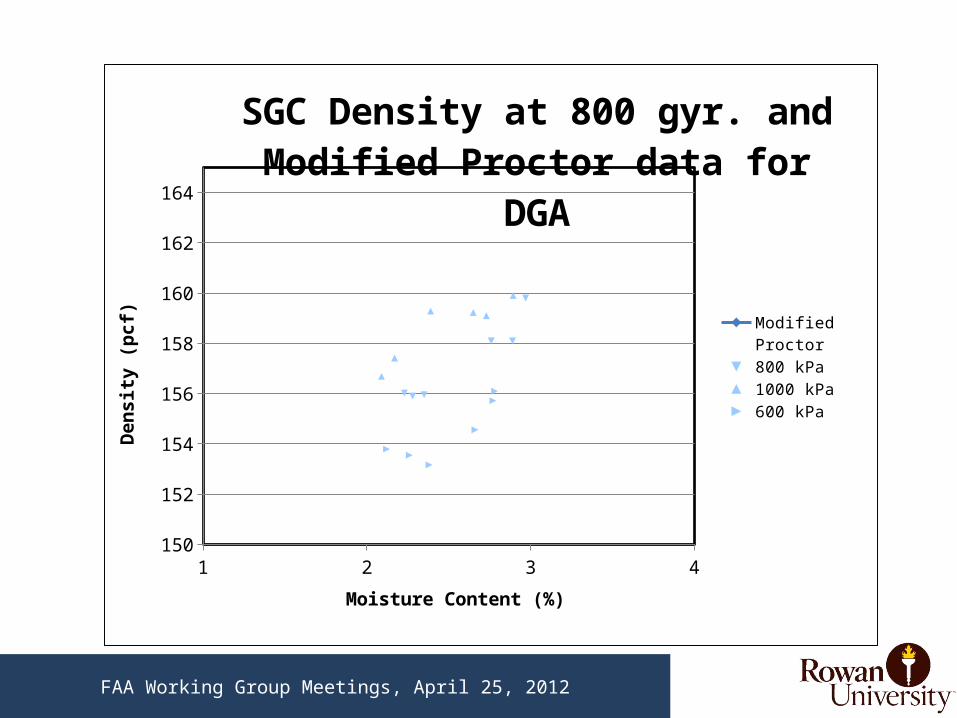
SGC Density at 800 gyr. and Modified Proctor data for DGA
Modified Proctor
800 kPa
1000 kPa
600 kPa
Moisture Content (%)
Den
sity
(pcf
)
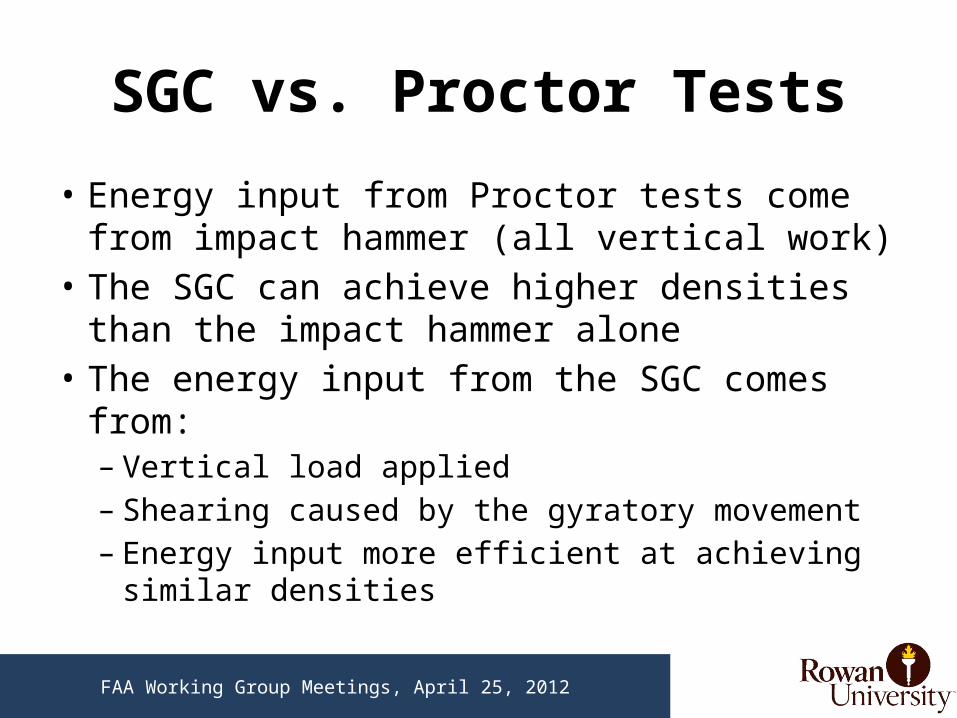
SGC vs. Proctor Tests
• Energy input from Proctor tests come from impact hammer (all vertical work)
• The SGC can achieve higher densities than the impact hammer alone
• The energy input from the SGC comes from:– Vertical load applied– Shearing caused by the gyratory movement– Energy input more efficient at achieving similar
densitiesFAA Working Group Meetings, April 25, 2012
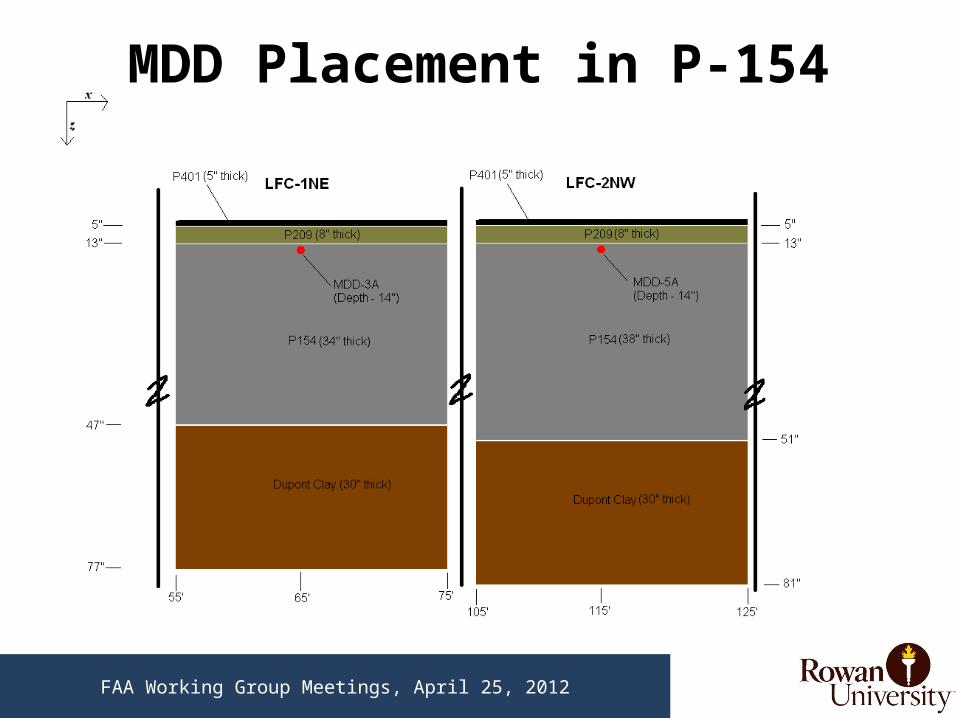
MDD Placement in P-154
FAA Working Group Meetings, April 25, 2012
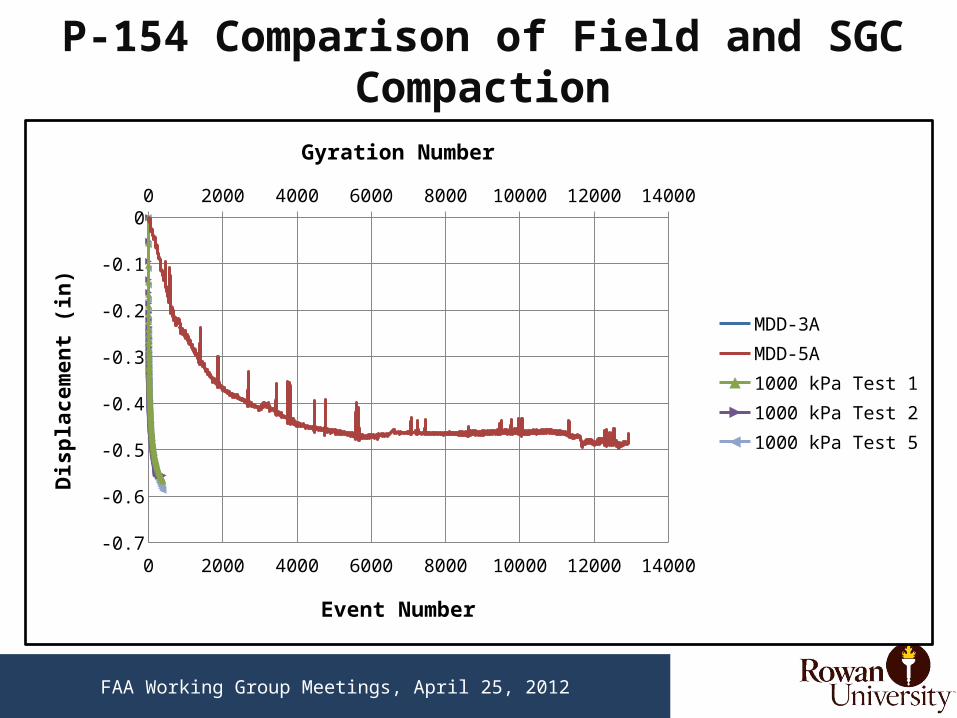
P-154 Comparison of Field and SGC Compaction
0 2000 4000 6000 8000 10000 12000 14000
0 2000 4000 6000 8000 10000 12000 14000
-0.7
-0.6
-0.5
-0.4
-0.3
-0.2
-0.1
0
MDD-3AMDD-5A1000 kPa Test 11000 kPa Test 21000 kPa Test 5
Event Number
Disp
lace
men
t (in
)
Gyration Number
FAA Working Group Meetings, April 25, 2012
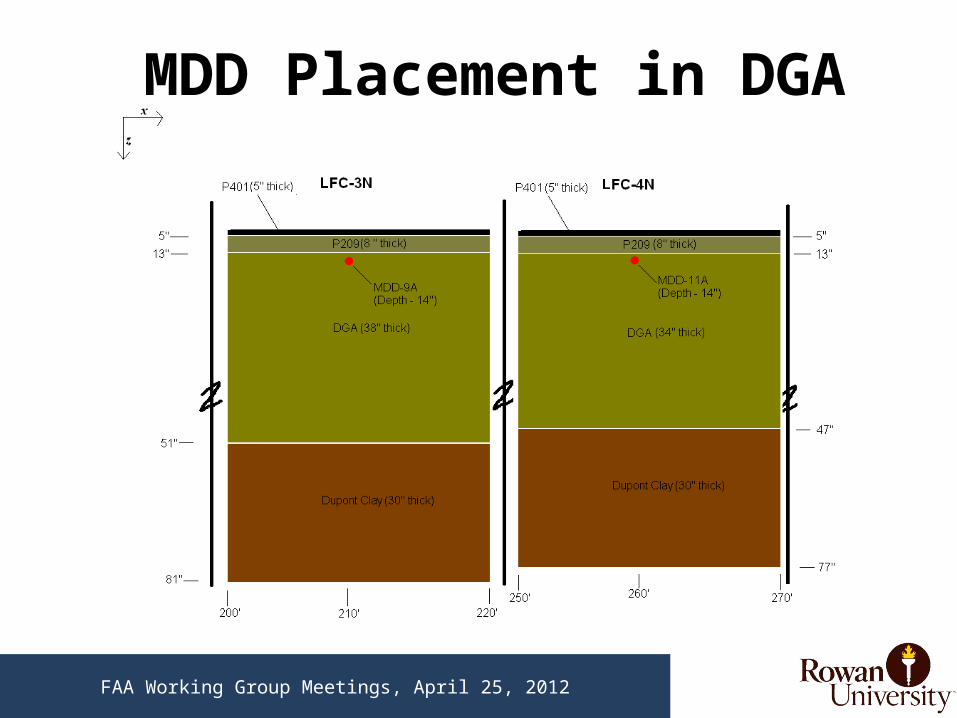
MDD Placement in DGA
FAA Working Group Meetings, April 25, 2012

DGA Comparison of Field and SGC Compaction0 2000 4000 6000 8000 10000 12000 14000
0 2000 4000 6000 8000 10000 12000 14000
-1.4
-1.2
-1
-0.8
-0.6
-0.4
-0.2
0
MDD-9AMDD-11A800 kPa Test 1800 kPa Test 2800 kPa Test 3
Event Number, Gyration Number
Dis
plac
emen
t (in
)
FAA Working Group Meetings, April 25, 2012
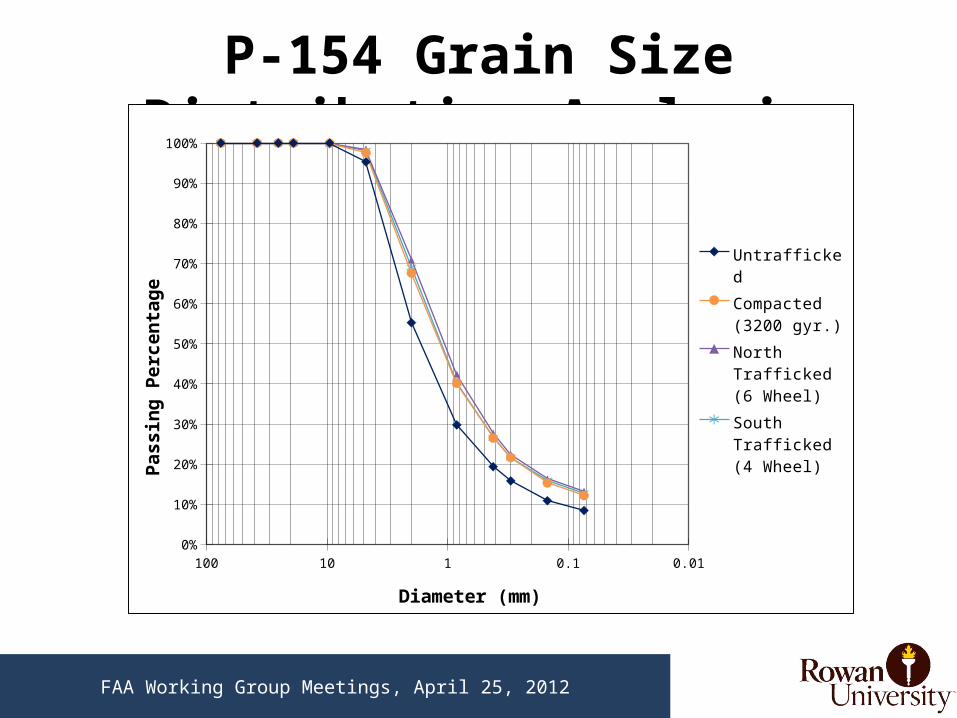
P-154 Grain Size Distribution Analysis
FAA Working Group Meetings, April 25, 2012
0.010.11101000%
10%
20%
30%
40%
50%
60%
70%
80%
90%
100%
Untrafficked
Compacted (3200 gyr.)
North Trafficked (6 Wheel)
South Trafficked (4 Wheel)
Diameter (mm)
Pass
ing
Perc
enta
ge
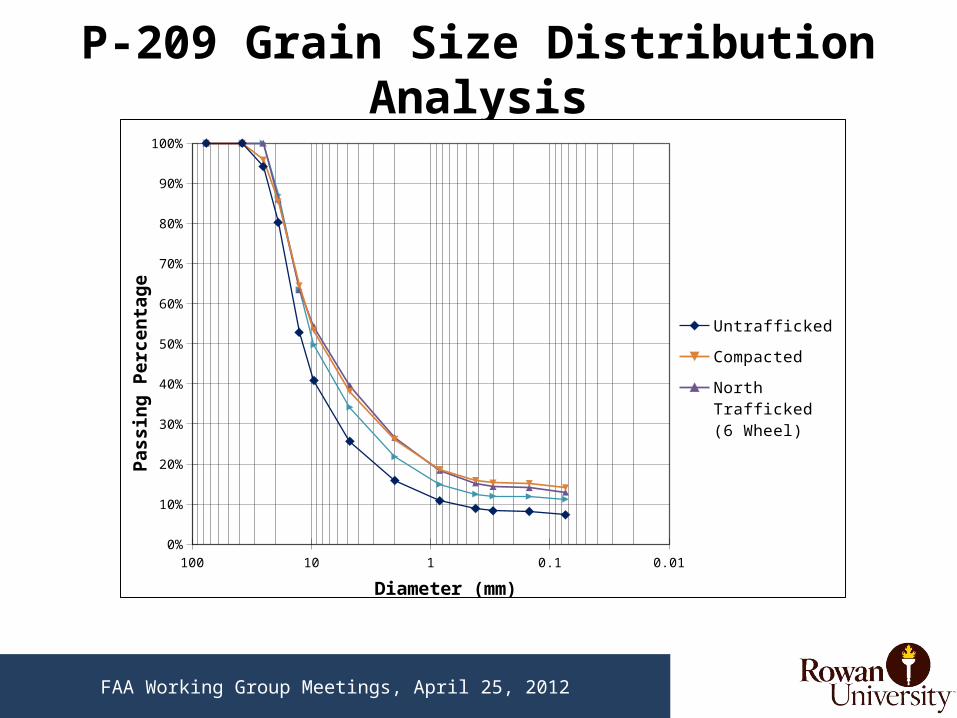
P-209 Grain Size Distribution Analysis
FAA Working Group Meetings, April 25, 2012
0.010.11101000%
10%
20%
30%
40%
50%
60%
70%
80%
90%
100%
Untrafficked
Compacted
North Trafficked (6 Wheel)
South Trafficked (4 Wheel)
Diameter (mm)
Pass
ing
Perc
enta
ge
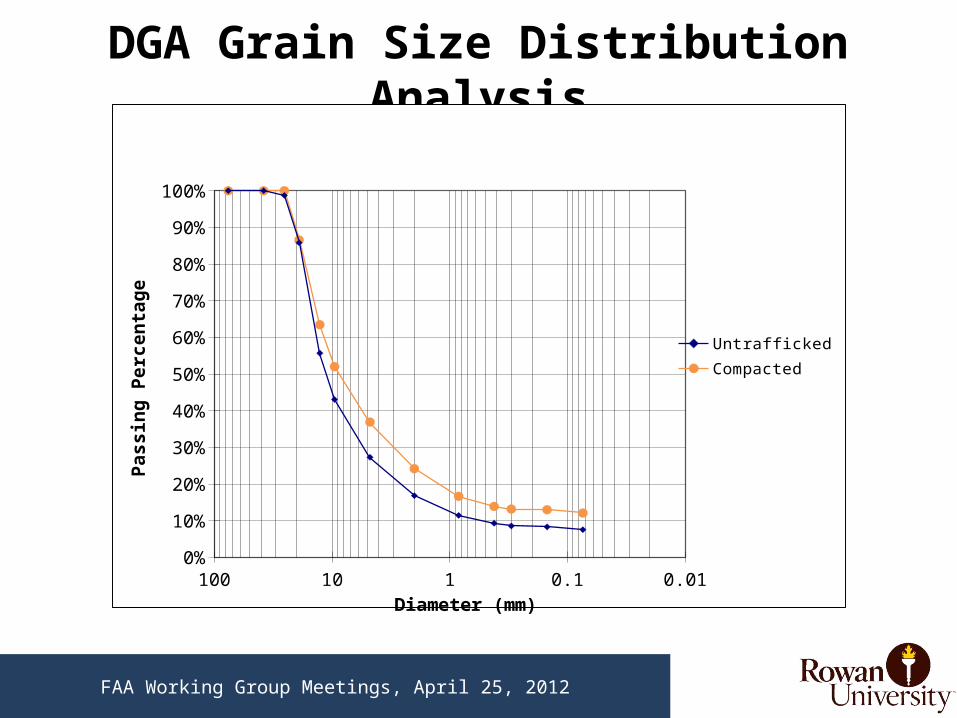
DGA Grain Size Distribution Analysis
0.010.11101000%
10%
20%
30%
40%
50%
60%
70%
80%
90%
100%
UntraffickedCompacted
Diameter (mm)
Pass
ing
Perc
enta
ge
FAA Working Group Meetings, April 25, 2012
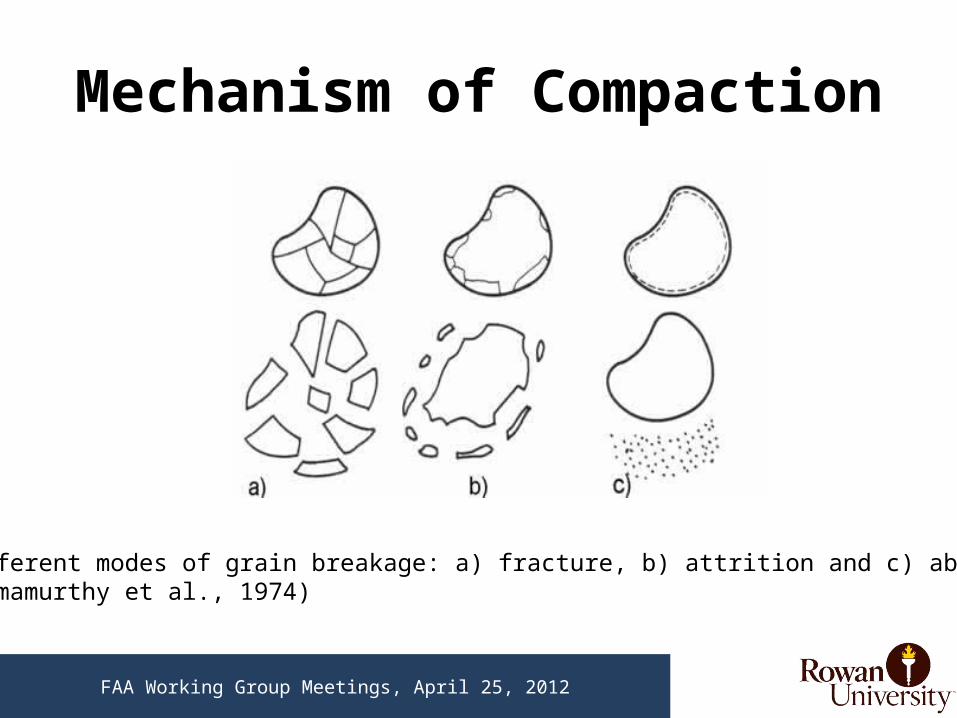
Mechanism of Compaction
Different modes of grain breakage: a) fracture, b) attrition and c) abrasion. (Ramamurthy et al., 1974)
FAA Working Group Meetings, April 25, 2012
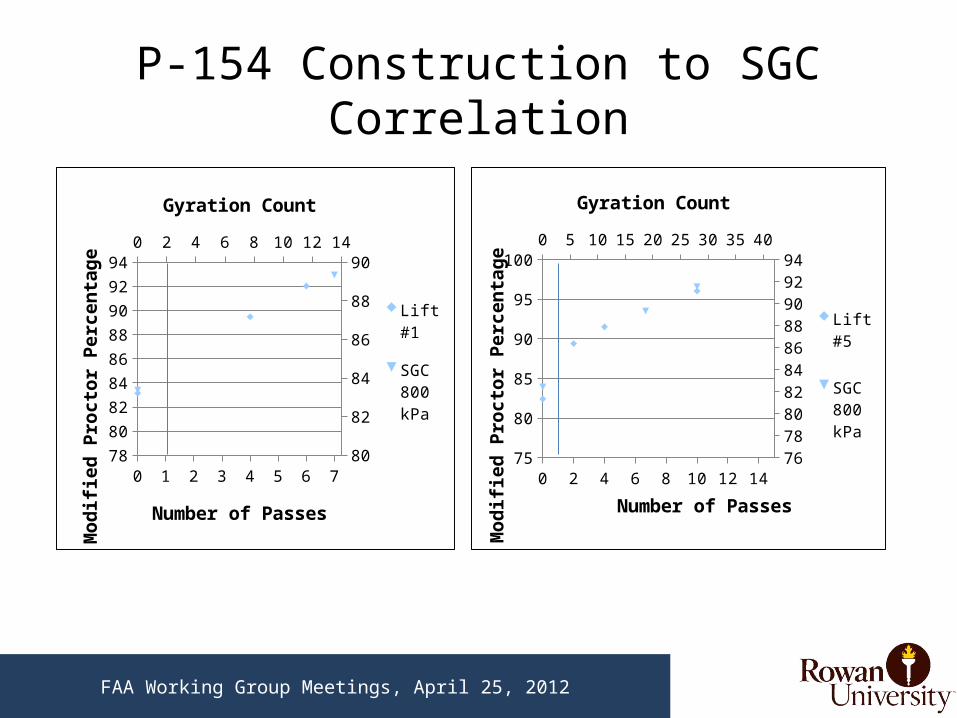
P-154 Construction to SGC Correlation
0 1 2 3 4 5 6 7
0 2 4 6 8 10 12 14
788082848688909294
8081828384858687888990
Lift #1
SGC 800 kPa
Number of Passes
Mod
ified
Pro
ctor
Per
cent
age
Gyration Count
0 2 4 6 8 10 12 14
0 5 10 15 20 25 30 35 40
75
80
85
90
95
100
76788082848688909294
Lift #5
SGC 800 kPa
Number of PassesM
odifi
ed P
roct
or P
erce
ntag
e
Gyration Count
FAA Working Group Meetings, April 25, 2012
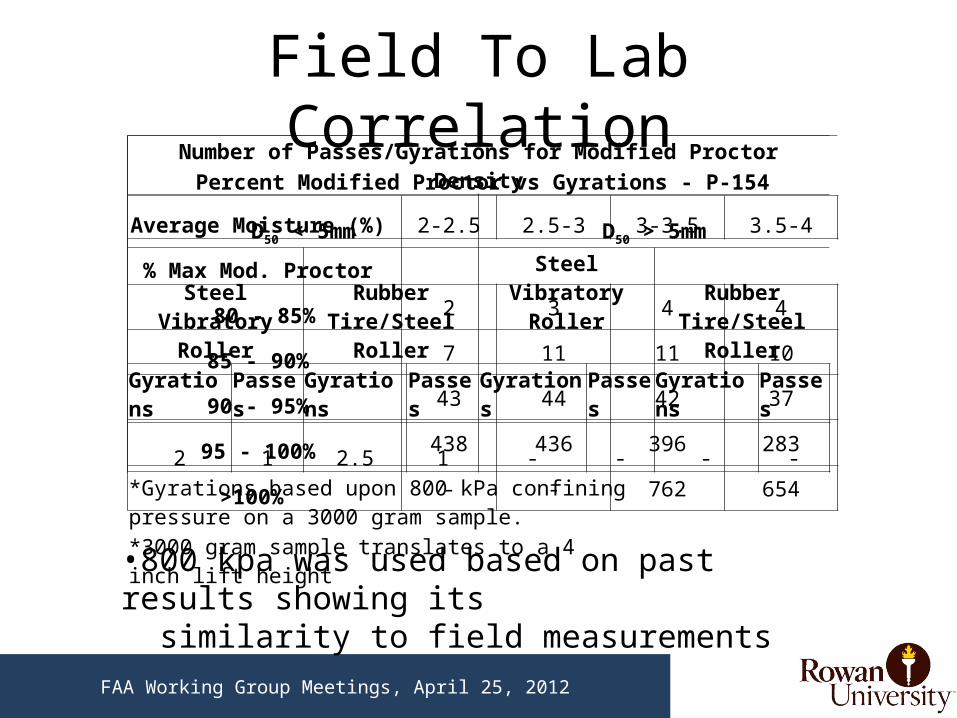
Number of Passes/Gyrations for Modified Proctor Density
D50 < 5mm D50 > 5mm
Steel Vibratory Roller
Rubber Tire/Steel Roller
Steel Vibratory Roller Rubber Tire/Steel
Roller
Gyrations Passes Gyrations Passes Gyrations Passes Gyrations Passes
2 1 2.5 1 - - - -*Gyrations based upon 800 kPa confining pressure on a 3000 gram sample.
*3000 gram sample translates to a 4 inch lift height
Percent Modified Proctor vs Gyrations - P-154
Average Moisture (%) 2-2.5 2.5-3 3-3.5 3.5-4
% Max Mod. Proctor
80 - 85% 2 3 4 4
85 - 90% 7 11 11 10
90 - 95% 43 44 42 37
95 - 100% 438 436 396 283
>100% - - 762 654
Field To Lab Correlation
FAA Working Group Meetings, April 25, 2012
•800 kpa was used based on past results showing its similarity to field measurements
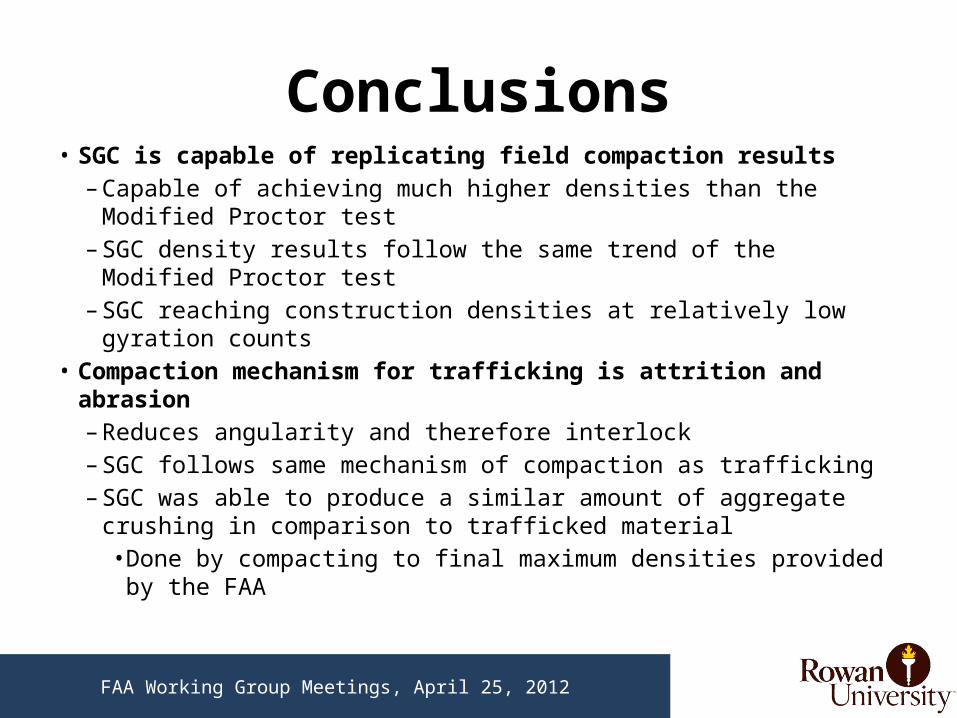
Conclusions• SGC is capable of replicating field compaction results
– Capable of achieving much higher densities than the Modified Proctor test
– SGC density results follow the same trend of the Modified Proctor test
– SGC reaching construction densities at relatively low gyration counts• Compaction mechanism for trafficking is attrition and abrasion
– Reduces angularity and therefore interlock– SGC follows same mechanism of compaction as trafficking– SGC was able to produce a similar amount of aggregate crushing in
comparison to trafficked material• Done by compacting to final maximum densities provided by the
FAA
FAA Working Group Meetings, April 25, 2012
Acknowledgments
• The work described in this presentation was supported by the FAA Airport Technology Research and Development Branch, AJP-6310, Dr. Satish K. Agrawal, Manager, under Grant #11-G-008. The contents of the presentation reflect the views of the authors, who are responsible for the facts and accuracy of the data presented within. The contents do not necessarily reflect the official views and policies of the FAA. The presentation does not constitute a standard, specification, or regulation.
FAA Working Group Meetings, April 25, 2012