Embed Size (px)
Citation preview

REPORT NUMBER: FEP-01-07
EVALUATION OF STRATA® REFLECTIVE
CRACK RELIEF SYSTEM
FINAL REPORT
DECEMBER 2007

i
Technical Report Documentation Page
1. Report No. 2. Government Accession No. 3. Recipients Catalog No. FEP-01-07 4. Title and Subtitle 5. Report Date
Evaluation of Strata® Reflective Crack Relief System December 2007 6. Performing Organization Code
7. Author(s) 8. Performing Organization Report No. Deb Bischoff, P.E., WisDOT Pavement Policy & Design Engineer FEP-01-07 9. Performing Organization Name and Address 10. Work Unit No. (TRAIS) Wisconsin Department of Transportation Division of Transportation System Development, Bureau of Technical Services Materials Management Section / Foundation & Pavements Unit 11. Contract or Grant No. 3502 Kinsman Blvd., Madison, WI 53704-250712. Sponsoring Agency Name and Address 13. Type of Report and Period Covered Wisconsin Department of Transportation Final Report (2001 – 2007) Division of Transportation System Development, Bureau of Technical Services 14. Sponsoring Agency Code Materials Management Section / Foundation & Pavements Unit WisDOT Federal Experimental 3502 Kinsman Blvd., Madison, WI 53704-2507 Project # FEP-01-0615. Supplementary Notes
16. Abstract
In 2001, the Wisconsin Department of Transportation (WisDOT) initiated this Federal Experimental Project to evaluate the effectivenessof Strata® Reflective Crack Relief System, an interlayer designed to delay cracks from reflecting through hot mix asphalt (HMA) overlaysplaced on concrete pavements. Test sections were constructed in Racine County in 2001 and in St. Croix County in 2002. After the existing HMA pavements were milled off, the existing underlying concrete pavement was repaired. A tack coat was applied prior to paving a one-inch thick Strata® interlayer. The interlayer was then overlaid with HMA.
Crack surveys were conducted annually for several years. The results from the Racine County project showed that the Strata® interlayerdelayed reflective cracking in an HMA overlay, over a concrete pavement with doweled full-depth patches, for two years. However, there was no conclusive evidence that Strata® would reduce reflective cracking longer than two years. The results from the St. Croix project showed that the lanes/sections with Strata® performed very well and typically better than the lanes/sections without Strata® for the first two years. Test sections that had Strata® in only one lane consistently performed well in the lane with the Strata®, but very poorly in the adjacent lane without Strata®. Although the test section that had Strata® in both lanes performed fairly well after three years and had an average percentage of reflective cracking in both lanes of 47.5 percent, Control Section 1, which didn't have an interlayer, performed the best with an average percentage of reflective cracking in both lanes of 40 percent.
The Strata® Reflective Crack Relief System was able to delay reflective cracking for two years. By the third year, the test sections with a Strata® interlayer performed comparably to those without an interlayer. Since WisDOT typically performs crack maintenance beginningin year three, the ability of Strata® to reduce reflective cracking for only two years does not result in any cost savings to WisDOT. Thus, the Strata® Reflective Crack Relief System is not a cost effective solution to reduce reflective cracking of an HMA overlay placed over a concrete pavement.17. Key Words 18. Distribution Statement
Strata®, reflective cracking, reflective crack relief, interlayer, stress Distribution Unlimitedabsorbing membrane Authorized for Public Release19. Security Classif. (of this report) 19. Security Classif. (of this page) 21. No. of Pages 22. PriceUnclassified Unclassified

EVALUATION OF STRATA® REFLECTIVE CRACK RELIEF SYSTEM
FINAL REPORT
Wisconsin Federal Experimental Project # FEP-01-06
Final Report # FEP-01-07
By:
Deb Bischoff, P.E. WisDOT Pavement Policy & Design Engineer
Wisconsin Department of Transportation Division of Transportation System Development
Bureau of Technical Services Materials Management Section, Foundation and Pavements Section
3502 Kinsman Blvd. Madison, WI 53704
December 2007 This study was conducted by the Foundation & Pavements Unit of the Wisconsin Department of Transportation, Division of Transportation System Development, Bureau of Technical Services, Materials Management Section. The Federal Highway Administration provided financial and technical assistance for this research project, including review and approval of publications. This publication does not endorse or approve any commercial product even though trade names may be cited, does not necessarily reflect official views or policies of the agency, and does not constitute a standard, specification or regulation.
ii

TABLE OF CONTENTS
TECHNICAL REPORT DOCUMENTATION PAGE....................................................... i
TITLE PAGE...................................................................................................................... ii
TABLE OF CONTENTS................................................................................................... iii
INTRODUCTION ...............................................................................................................1
PRODUCT DESCRIPTION................................................................................................1
HISTORY ............................................................................................................................2
RESEARCH DESCRIPTION..............................................................................................3
TEST SITES ........................................................................................................................3
Racine County................................................................................................................4
St. Croix County ............................................................................................................8
MIX DESIGN ....................................................................................................................12
CONSTRUCTION.............................................................................................................13
PAVEMENT PERFORMANCE RESULTS.....................................................................15
Crack Surveys ..............................................................................................................15
Racine County ........................................................................................................16
St. Croix County.....................................................................................................17
Ride Measurements......................................................................................................19
Rut Depth Surveys .......................................................................................................20
Coring ..........................................................................................................................20
COSTS ...............................................................................................................................22
SUMMARY AND CONCLUSIONS ................................................................................22
RECOMMENDATIONS...................................................................................................24
APPENDIX A................................................................................................................. A-1
APPENDIX B ..................................................................................................................B-1
APPENDIX C ..................................................................................................................C-1
APPENDIX D................................................................................................................. D-1
iii

INTRODUCTION
Many deteriorated pavements are overlaid with hot mix asphalt (HMA) to provide a
smoother riding surface and prolong the pavement life. Reflective cracking is a problem
that can develop in HMA overlays when they are placed over existing concrete or HMA
pavements. A reflective crack is formed when a joint or crack in the existing pavement
propagates up into the HMA overlay. Reflective cracks are primarily caused by
horizontal or vertical movement of the underlying pavement at the transverse joints or
cracks. An old rule of thumb is that reflective cracks propagate up through the HMA
overlay at a rate of one inch per year. However, experience has shown that reflective
cracks have appeared within one year of construction of overlays of varying thicknesses.
Eventually the entire crack pattern of the underlying pavement can reflect into the HMA
overlay. The reflective cracking results in a poor ride, increased maintenance costs, and a
shorter pavement life. To prevent further deterioration of the pavement, Wisconsin
Department of Transportation’s (WisDOT’s) standard practice is to seal or rout and seal
cracks beginning three years after construction of the overlay.
Many products designed to reduce or eliminate reflective cracking have been introduced
in the market over the years. In 2001, WisDOT initiated this Federal Experimental
Project to evaluate the effectiveness of Strata® Reflective Crack Relief System, an
interlayer designed to delay cracks from reflecting through HMA overlays placed on
concrete pavements.
PRODUCT DESCRIPTION
The Strata® Reflective Crack Relief System, currently designed and marketed by
SemMaterials, L.P., consists of a highly elastic, impermeable hot mix interlayer to be
overlaid with HMA. The interlayer is comprised of a high percentage of polymer
modified asphalt binder in a dense fine aggregate mixture. The HMA overlay, which is to
be paved over the Strata® interlayer, is designed to complement the Strata® interlayer,
while meeting the local traffic demands. The Strata® system consists of site selection
recommendations, the interlayer mix design, HMA overlay mix design recommendations,
and SemMaterials’ technical support. It should be noted that at the origin of this research
1

study, the Strata® Reflective Crack Relief System was designed and marketed by Koch
Pavement Solutions. However, since SemMaterials is the current owner of Strata®
technology, all references in this report will be to them.
Literature from SemMaterials suggests that the Strata® Reflective Crack Relief System
can provide several advantages. Firstly, the Strata® system can delay the initial
appearance of reflective cracks for approximately two years. Also, complete reflective
cracking will be delayed three to five years longer than with a fabric and HMA overlay.
The service life of the pavement structure is also estimated to increase by five years. In
addition, the impermeable interlayer protects the underlying pavement from moisture
damage. The Strata® interlayer is manufactured and applied using standard HMA
procedures and equipment. Finally, the Strata® material can be recycled.
The Strata® system is designed for use on concrete pavements that are structurally sound,
with doweled joints in good condition. Any severely distressed areas should be repaired
prior to placing the Strata® interlayer.
HISTORY
In 2001, at the start of this research project, several states, including New Jersey, Illinois,
Kansas, Texas, Missouri, Oklahoma and Iowa, had used Strata® or a sand anti-fracture
layer (SAF) on one or more projects. The SAF layer, very similar to Strata®, is a fine
aggregate graded asphalt mixture using highly polymerized asphalt cement, and is placed
between a concrete pavement and an HMA overlay. In 2001, performance results
reported by the other states varied from good to bad to indifferent. Recently,
SemMaterials reported that through 2006, approximately 585 lane-miles (4.0 million yd2)
of Strata® Reflective Crack Relief System have been placed in twenty states throughout
the U.S.
In 2006, the Center for Advanced Infrastructure & Transportation at Rutgers University
initiated a study for the New Jersey DOT to develop guidelines for the selection of
flexible pavement “systems” on rigid pavements. As part of that study, states were
2

surveyed on their use of flexible pavement overlays on rigid pavements. Twenty-eight
state responses were received and of those 28, 16 responded they had tried “Strata”-type
interlayer mixes, and of those 16, 7 reported that the use of “Strata”-type interlayer mixes
was successful.
RESEARCH DESCRIPTION
The primary objective of this study was to determine if the Strata® Reflective Crack Relief
System is a suitable and cost-effective system for delaying or eliminating reflective cracking
in HMA overlays. Another objective was to determine the effectiveness of Strata® at
protecting the underlying concrete pavement from surface water seeping through any cracks
that did develop in the overlay. Two separate concrete pavement rehabilitation projects were
selected for this research to perform in-situ evaluations of Strata®’s reflective crack
mitigation and sealing characteristics. Test sections and control sections were constructed at
each project site; these sections were monitored and the performance characteristics of the
different sections were documented.
TEST SITES
As illustrated in Figure 1, the test sites were located on IH-94 in Racine and St. Croix
counties.
3

Figure 1. Strata® Test Sites
IH-94 ST. CROIX CO
IH-94 RACINE CO
Racine County
The first project location (Project ID 1032-01-72) was on I-94 in Racine County, a six-lane
divided highway—three lanes in both directions. Technically this interstate is referred to as
an east-west corridor, but in this specific segment the interstate runs north and south. The
existing pavement structure consisted of a variable thickness (4-inch average) HMA overlay
over a concrete pavement. The concrete pavement was originally constructed in 1960 as a
10-inch jointed reinforced concrete pavement (JRCP), over 8 inches of crushed aggregate,
over 9 inches of granular subbase. The reinforcement of the 10-inch concrete pavement
consisted of wire mesh within the slabs and dowel bars at the joints that were spaced 40 feet
apart. This roadway is a principal arterial with a 20-year design equivalent single axle load
(ESAL) of 19.5 million, and an average daily traffic (ADT) projection of 128,000 for the
year 2020, with 15 percent trucks.
In the summer of 2001 this highway section was resurfaced. The project limits included all
six lanes and extended for ten miles, from the Kenosha/Racine County Line to the
4

Racine/Milwaukee County Line. Four research sections were constructed within the project
limits for performance evaluations (one control and one test section in each direction). Each
section spanned the width of the driving lane and one half of the center lane. The eastbound
(EB) research sections began just east (south) of Golf Road and extended for 1.6 miles.
Strata® was applied to 0.8 miles of this stretch; the remaining 0.8 miles of this segment was
constructed without Strata®, the same as the remainder of the project, and was considered
the control section. A Rosphalt HMA overlaid bridge deck existed within the control section
limits and was disregarded in this research effort. The westbound (WB) research sections
extended for 1.6 miles as well, and were located between State Trunk Highway (STH) 20
and 58th Rd. Strata® was applied to a 0.8-mile segment of the WB driving lane and half of
the center lane, with the remaining 0.8 miles serving as an additional control section. See
Figure 2 on page 7 for a layout of the test and control sections.
The test sections consisted of a 1-inch Strata® interlayer, followed by two 2-inch layers of
Superpave E-30. The control sections, as well as the remainder of the project, consisted of a
1-inch layer of Superpave E-30, followed by two 2-inch layers of Superpave E-30. The
pavement structure details of all four sections are as follows:
Test Section 1: Station 1000+00 to 958+00, EB
2-inch Superpave E-30, 12.5 mm HMA surface (PG 70-28p)
2-inch Superpave E-30, 12.5 mm HMA lower layer (PG 64-22)
1-inch Strata® interlayer
10-inch existing jointed reinforced concrete pavement
8 inches existing crushed aggregate base
9 inches existing granular subbase
Test Section 2: Station 770+00 to 813+00, WB
2-inch Superpave E-30, 12.5 mm HMA surface (PG 70-28p)
2-inch Superpave E-30, 12.5 mm HMA lower layer (PG 64-22)
1-inch Strata® interlayer
10-inch existing jointed reinforced concrete pavement
5

8 inches existing crushed aggregate base
9 inches existing granular subbase
Control Section 1: 958+00 to Station 914+91, EB
2-inch Superpave E-30, 12.5 mm HMA surface (PG 70-28p)
2-inch Superpave E-30, 12.5 mm HMA lower layer (PG 64-22)
1-inch Superpave E-30, 12.5 mm HMA lower layer (PG 64-22)
10-inch existing jointed reinforced concrete pavement
8 inches existing crushed aggregate base
9 inches existing granular subbase
Control Section 2: Station 813+00 to 856+00, WB
2-inch Superpave E-30, 12.5 mm HMA surface (PG 70-28p)
2-inch Superpave E-30, 12.5 mm HMA lower layer (PG 64-22)
1-inch Superpave E-30, 12.5 mm HMA lower layer (PG 64-22)
10-inch existing jointed reinforced concrete pavement
8 inches existing crushed aggregate base
9 inches existing granular subbase
6

Figure 2. Racine County Test Site Schematic
Kraut Rd
STA 1003+20 RP=329K+1.00Golf Rd
STH 20
58th Rd
STA 1000+00
STA 958+00
STA 914+91
STA 923+75 RP=332D+0.00
STA 862+65 RP = 333G+0.00
STA 764+20 RP=335G+0.13
STA 856+00
STA 813+00
STA 770+00
WB
EB
ST
RA
TA
TE
ST
SE
CT
ION
1
ST
RA
TA
TE
ST
SE
CT
ION
2
CO
NT
RO
LS
EC
TIO
N 1
CO
NT
RO
LS
EC
TIO
N 2
Rosphalt Bridge Deck
STH 11
CTH K STA 1056+00
STA 756+80
N
7

St. Croix County
The second project (ID 1020-06-70) location was in St. Croix County on I-94 near the town
of Woodville. This part of I-94 is a four-lane divided highway with two lanes in both
eastbound (EB) and westbound (WB) directions. The existing pavement structure consisted
of a variable thickness HMA overlay (2 inches on the east half of the project and 3.5-4
inches on the west half) over a cracked and seated concrete pavement. The concrete
pavement was originally constructed in 1959 as a 9-inch JRCP over 6 inches of crushed
aggregate, over 9 inches of granular subbase. The reinforcement consisted of wire mesh
within the slabs and dowel bars at the joints that were spaced 80 feet apart. The pavement
was cracked and seated and overlaid with HMA in 1988. This roadway is a principal arterial
with 20-year design ESALs of 42 million and an ADT projection of 39,300 for the year
2020, with 24 percent trucks.
In the summer of 2002, one year after the Racine County Strata® test sections were
constructed, this section of I-94 in St. Croix County was resurfaced. The project limits
included both EB and WB lanes and extended for 6.3 miles, roughly from County Trunk
Highway (CTH) BB to STH 128. A total of five sections were constructed within the project
limits in the EB lanes for research purposes (three test sections and two control sections).
Test Section 1 consisted of the Strata® interlayer applied to the passing lane only. Test
Section 2 was split into two segments (2A and 2B) because of a bridge structure and
involved a Strata® interlayer in both the passing and driving lanes. Test Section 3 consisted
of the Strata® interlayer applied to the driving lane only. Test Sections 1 and 3 were
constructed to determine if applying a Strata® interlayer to just one lane, which was less
costly than applying it to both lanes, was effective at delaying or eliminating reflective
cracking in either one or both lanes. The two control sections, which were constructed
without Strata®, were placed directly before and directly after the test sections. In total, the
test and control sections spanned a 1.9-mile segment of the project. See Figure 3 on page 11
for a schematic of the test sections.
The test sections consisted of a 1-inch Strata® interlayer, a 1.5-inch layer of Superpave E-10,
followed by a 2-inch layer of stone matrix asphalt (SMA). The control sections, as well as
8

the rest of the project, consisted of a 2.5-inch lower layer of Superpave E-10, followed by a
2-inch surface layer of SMA. The pavement structure details of all the sections are as
follows:
Control Section 1: Station 130+70 to 136+00, EB
2-inch SMA, 12.5 mm, surface (PG 70-28p)
2.5-inch Superpave E-10, 12.5 mm, lower layer (PG 64-22)
9-inch existing cracked and seated jointed reinforced concrete pavement
6 inches existing crushed aggregate base
9 inches existing granular subbase
Test Section 1: Station 136+00 to 149+00, EB
2-inch SMA, 12.5 mm, surface (PG 70-28p)
1.5-inch Superpave E-10, 12.5 mm, lower layer (PG 64-22)
1-inch Strata® interlayer in passing lane
9-inch existing cracked and seated jointed reinforced concrete pavement
6 inches existing crushed aggregate base
9 inches existing granular subbase
Test Sections 2A & 2B: Stations 149+00 to 155+00 and 161+00 to 206+00, EB
2-inch SMA, 12.5 mm, surface (PG 70-28p)
1.5-inch Superpave E-10, 12.5 mm, lower layer (PG 64-22)
1-inch Strata® interlayer in driving lane and passing lane
9-inch existing cracked and seated jointed reinforced concrete pavement
6 inches existing crushed aggregate base
9 inches existing granular subbase
Test Section 3: Station 206+00 to 219+00, EB
2-inch SMA, 12.5 mm, surface (PG 70-28p)
1.5-inch Superpave E-10, 12.5 mm, lower layer (PG 64-22)
1-inch Strata® interlayer in driving lane
9

9-inch existing cracked and seated jointed reinforced concrete pavement
6 inches existing crushed aggregate base
9 inches existing granular subbase
Control Section 2: Station 219+00 to 232+00, EB
2-inch SMA, 12.5 mm, surface (PG 70-28p)
2.5-inch Superpave E-10, 12.5 mm, lower layer (PG 64-22)
9-inch existing cracked and seated jointed reinforced concrete pavement
6 inches existing crushed aggregate base
9 inches existing granular subbase
10

Figure 3. St. Site Schematic N
Carr Creek UnderSTRUCTURE
42+48 to 43+52
Eau Galle River UnderSTRUCTURE
127+14 to 128+48
155+00
EA
STB
OU
ND
LA
NE
S
206+00
219+00
BEGINPROJECT
(1020-06-70)
ENDPROJECT
(1020-06-70)256+50
EQUATIONSTA. 1199+99.67 BK=
STA. 0+00.00 AH
WE
STB
OU
ND
LA
NE
S
1123+00
12’ 12’
CTH ‘B’
33,349’6.32 mi
1147+35CTH ‘BB’
161+00 STRUCTURE
149+00
130+70
TESTSECTION 1
CONTROL 1
TEST SECTION 2A
TESTSECTION
2B
TESTSECTION 3
CONTROL 2
136+00
232+00
CTH NN UnderSTRUCTURE STRUCTURE
12’ 12’
Carr Creek UnderSTRUCTURE
42+48 to 43+52
STRUCTURE127+14 to 128+48
155+00
EA
STB
OU
ND
LA
NE
S
206+00
219+00
BEGINPROJECT
(1020-06-70)
ENDPROJECT
(1020-06-70)256+50
EQUATIONSTA. 1199+99.67 BK=
STA. 0+00.00 AH
WE
STB
OU
ND
LA
NE
S
1123+00
12’ 12’12’ 12’
CTH ‘B’
33,349’6.32 mi
1147+35CTH ‘BB’1147+35CTH ‘BB’
161+00 STRUCTURE
149+00
130+70
TESTSECTION 1
CONTROL 1
TEST SECTION 2A
TESTSECTION
2B
TESTSECTION 3
CONTROL 2
136+00
232+00
CTH NN UnderSTRUCTURE STRUCTURE
12’ 12’12’ 12’
Carr Creek UnderSTRUCTURE
42+48 to 43+52
STRUCTURE127+14 to 128+48
155+00
EA
STB
OU
ND
LA
NE
S
206+00
219+00
BEGINPROJECT
(1020-06-70)
ENDPROJECT
(1020-06-70)256+50
EQUATIONSTA. 1199+99.67 BK=
STA. 0+00.00 AH
WE
STB
OU
ND
LA
NE
S
1123+00
12’ 12’
CTH ‘B’
33,349’6.32 mi
1147+35CTH ‘BB’
161+00 STRUCTURE
149+00
130+70
TESTSECTION 1
CONTROL 1
TEST SECTION 2A
TESTSECTION
2B
TESTSECTION 3
CONTROL 2
136+00
232+00
CTH NN UnderSTRUCTURE STRUCTURE
12’ 12’
Carr Creek UnderSTRUCTURE
42+48 to 43+52
STRUCTURE127+14 to 128+48
155+00
EA
STB
OU
ND
LA
NE
S
206+00
219+00
BEGINPROJECT
(1020-06-70)
ENDPROJECT
(1020-06-70)256+50
EQUATIONSTA. 1199+99.67 BK=
STA. 0+00.00 AH
WE
STB
OU
ND
LA
NE
S
1123+00
12’ 12’12’ 12’
CTH ‘B’
33,349’6.32 mi
1147+35CTH ‘BB’1147+35CTH ‘BB’
161+00 STRUCTURE
149+00
130+70
TESTSECTION 1
CONTROL 1
TEST SECTION 2A
TESTSECTION
2B
TESTSECTION 3
CONTROL 2
136+00
232+00
CTH NN UnderSTRUCTURE STRUCTURE
12’ 12’12’ 12’
Carr Creek UnderSTRUCTURE
42+48 to 43+52
STRUCTURE127+14 to 128+48
155+00
EA
STB
OU
ND
LA
NE
S
206+00
219+00
BEGINPROJECT
(1020-06-70)
ENDPROJECT
(1020-06-70)256+50
EQUATIONSTA. 1199+99.67 BK=
STA. 0+00.00 AH
WE
STB
OU
ND
LA
NE
S
1123+00
12’ 12’12’ 12’
CTH ‘B’
33,349’6.32 mi
1147+35CTH ‘BB’1147+35CTH ‘BB’
161+00 STRUCTURE
149+00
130+70
TESTSECTION 1
CONTROL 1
TEST SECTION 2A
TESTSECTION
2B
TESTSECTION 3
CONTROL 2
136+00
232+00
CTH NN UnderSTRUCTURE STRUCTURE
12’ 12’12’ 12’12’ 12’12’ 12’
Carr Creek UnderSTRUCTURE
42+48 to 43+52
STRUCTURE127+14 to 128+48
155+00
EA
STB
OU
ND
LA
NE
S
206+00
219+00
BEGINPROJECT
(1020-06-70)
ENDPROJECT
(1020-06-70)256+50
EQUATIONSTA. 1199+99.67 BK=
STA. 0+00.00 AH
WE
STB
OU
ND
LA
NE
S
1123+00
12’ 12’
CTH ‘B’
33,349’6.32 mi
1147+35CTH ‘BB’
161+00 STRUCTURE
149+00
130+70
TESTSECTION 1
CONTROL 1
TEST SECTION 2A
TESTSECTION
2B
TESTSECTION 3
CONTROL 2
136+00
232+00
CTH NN UnderSTRUCTURE STRUCTURE
12’ 12’
Carr Creek UnderSTRUCTURE
42+48 to 43+52
STRUCTURE127+14 to 128+48
155+00
EA
STB
OU
ND
LA
NE
S
206+00
219+00
BEGINPROJECT
(1020-06-70)
ENDPROJECT
(1020-06-70)256+50
EQUATIONSTA. 1199+99.67 BK=
STA. 0+00.00 AH
WE
STB
OU
ND
LA
NE
S
1123+00
12’ 12’12’ 12’
CTH ‘B’
33,349’6.32 mi
1147+35CTH ‘BB’1147+35CTH ‘BB’
161+00 STRUCTURE
149+00
130+70
TESTSECTION 1
CONTROL 1
TEST SECTION 2A
TESTSECTION
2B
TESTSECTION 3
CONTROL 2
136+00
232+00
CTH NN UnderSTRUCTURE STRUCTURE
12’ 12’12’ 12’
Carr Creek UnderSTRUCTURE
42+48 to 43+52
STRUCTURE127+14 to 128+48
155+00
EA
STB
OU
ND
LA
NE
S
206+00
219+00
BEGINPROJECT
(1020-06-70)
ENDPROJECT
(1020-06-70)256+50
EQUATION
Carr Creek UnderSTRUCTURE
42+48 to 43+52
Eau Galle River UnderSTRUCTURE
127+14 to 128+48
155+00
EA
STB
OU
ND
LA
NE
S
206+00
219+00
BEGINPROJECT
(1020-06-70)
ENDPROJECT
(1020-06-70)256+50
EQUATIONSTA. 1199+99.67 BK=
STA. 0+00.00 AH
WE
STB
OU
ND
LA
NE
S
1123+00
12’ 12’12’ 12’
CTH ‘B’
33,349’6.32 mi
1147+35CTH ‘BB’1147+35CTH ‘BB’
161+00 STRUCTURE
149+00
130+70
TESTSECTION 1
CONTROL 1
TEST SECTION 2A
TESTSECTION
2B
TESTSECTION 3
CONTROL 2
136+00
232+00
CTH NN UnderSTRUCTURE STRUCTURE
12’ 12’12’ 12’
Carr Creek UnderSTRUCTURE
42+48 to 43+52
STRUCTURE127+14 to 128+48
155+00
EA
STB
OU
ND
LA
NE
S
206+00
219+00
BEGINPROJECT
(1020-06-70)
ENDPROJECT
(1020-06-70)256+50
EQUATIONSTA. 1199+99.67 BK=
STA. 0+00.00 AH
WE
STB
OU
ND
LA
NE
S
1123+00
12’ 12’12’ 12’
CTH ‘B’
33,349’6.32 mi
1147+35CTH ‘BB’1147+35CTH ‘BB’
161+00 STRUCTURE
149+00
130+70
TESTSECTION 1
CONTROL 1
TEST SECTION 2A
TESTSECTION
2B
TESTSECTION 3
CONTROL 2
136+00
232+00
CTH NN UnderSTRUCTURE STRUCTURE
12’ 12’12’ 12’12’ 12’12’ 12’
Carr Creek UnderSTRUCTURE
42+48 to 43+52
STRUCTURE127+14 to 128+48
155+00
EA
STB
OU
ND
LA
NE
S
206+00
219+00
BEGINPROJECT
(1020-06-70)
ENDPROJECT
(1020-06-70)256+50
EQUATIONSTA. 1199+99.67 BK=
STA. 0+00.00 AH
WE
STB
OU
ND
LA
NE
S
1123+00
12’ 12’12’ 12’
CTH ‘B’
33,349’6.32 mi
1147+35CTH ‘BB’1147+35CTH ‘BB’
161+00 STRUCTURE
149+00
130+70
TESTSECTION 1
CONTROL 1
TEST SECTION 2A
TESTSECTION
2B
TESTSECTION 3
CONTROL 2
136+00
232+00
CTH NN UnderSTRUCTURE STRUCTURE
12’ 12’12’ 12’
Carr Creek UnderSTRUCTURE
42+48 to 43+52
STRUCTURE127+14 to 128+48
155+00
EA
STB
OU
ND
LA
NE
S
206+00
219+00
BEGINPROJECT
(1020-06-70)
ENDPROJECT
(1020-06-70)256+50
EQUATION
11

MIX DESIGN
The Strata® interlayer mixtures for both projects were designed by SemMaterials. These
mix designs were based on performance-related specifications and verified using the
flexural bending fatigue test (AASHTO T 321). SemMaterials also provided
recommendations for the HMA overlay mix designs. Project contractors designed,
produced, and placed the HMA overlay mixtures according to standard WisDOT
specification requirements and common construction practices.
Designed as a highly elastic product and intended to provide maximum stress relief,
Strata® mixtures typically include 8-10 percent of polymer modified asphalt binder. The
percentage of asphalt binder used in the Strata® mixes of the two projects fell within that
typical range, with 8.0 percent on the Racine County project and 9.3 percent on the
St.Croix County project. The asphalt binder on both projects was polymer modified to
provide maximum flexibility to withstand cold Wisconsin winter temperatures and to
help recover from repeated strains imposed on the pavement. Local materials were used
to compose the dense-graded fine aggregate structure associated with Strata®.
The overlay mixtures were designed meeting standard WisDOT Superpave parameters for
projected traffic levels between 10 and 30 million ESALs (based on a 20-year service life).
The overlay mixture used in Racine County had a 5.4 percent optimum asphalt binder
content, while the SMA mixture placed on the St. Croix County project contained 5.3
percent asphalt binder. The upper layers of the overlay mixtures for both projects also
contained polymer modified asphalts (as recommended for these Strata® project
applications). Table 1 indicates a portion of the JMFs (Job Mix Formulas) developed for the
standard overlays. Full mix design details can be found in Appendix A.
12

Table 1. Project HMA Overlay Job Mix Formulas (JMFs)
JMF Property E-30
Overlay SMA
Overlay NMAS 12.5 mm 12.5 mm N des gyrations 100 100 Optimum % Asphalt 5.4 5.3 Asphalt Binder PG 64 - 22 70 - 28 % VMA 14.0 15.7 % VFB 71.0 74.6
3/4" 19.0 mm 100.0 100.0 1/2" 12.5 mm 97.8 89.5 3/8" 9.5 mm 87.5 70.3 # 4 4.75 mm 58.3 27.4 # 8 2.36 mm 38.1 17.5
# 16 1.18 mm 25.3 14.3 # 30 0.600 mm 16.4 12.3 # 50 0.300 mm 9.2 10.9
# 100 0.150 mm 5.8 9.3 # 200 0.075 mm 4.5 8.1
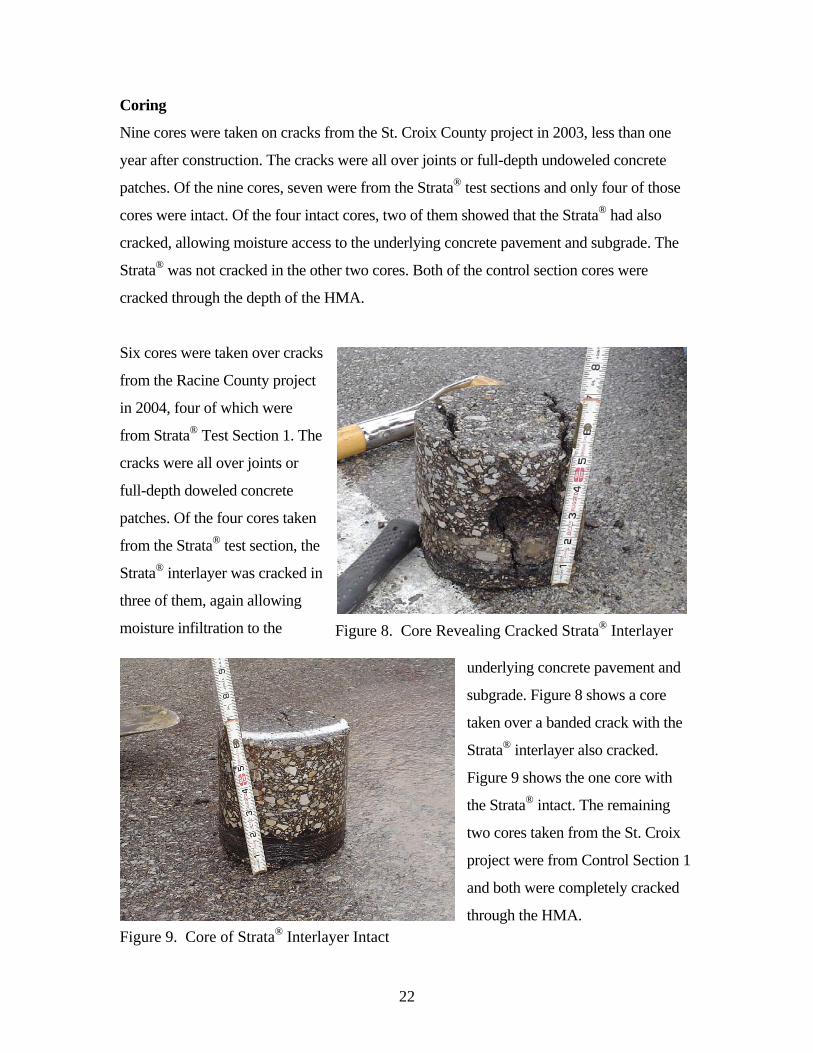
FAA 46.3 47.8 Additional reference tables describing current WisDOT standard specifications for HMA
mixtures are located in Appendix B.
CONSTRUCTION
The Racine County project was paved by Payne and Dolan, Inc. in August and September of
2001, while the St. Croix County project was paved by Mathy Construction Company in
September 2002. Both projects began by milling the existing HMA pavement. The full
depth of the HMA pavement was milled on the Racine County project. The St. Croix
County HMA pavement was milled two inches. Since the existing HMA pavement varied in
thickness from two inches on the east half of the project to about four inches on the west
half, the east half (where the Strata® test sections were to be located) was milled down to
the existing concrete pavement while approximately two inches of HMA remained on the
west half. After milling was completed, the existing concrete pavement was repaired. The
Racine County project’s badly deteriorated joints, slabs, and existing base patches were
13

repaired using full-depth doweled concrete patches. The moderately deteriorated transverse
joints and cracks were filled with asphalt joint repair material and the longitudinal joints
were V-milled and backfilled with HMA. The St. Croix County project’s badly deteriorated
joints were repaired using full-depth undoweled concrete patches.
Although product literature suggests that a tack coat is not needed, a tack coat was
applied on the existing concrete pavement on both projects prior to the Strata®
application as a precautionary measure to minimize or prevent blistering of the interlayer,
which had occurred in other
states. A one-inch thick
Strata® interlayer was placed
over the tack coat in the
Strata® test sections. The
Racine County project Strata®
interlayer was paved 18 feet
wide, covering the driving lane
and half of the center lane in
both test sections. Figures 4
and 5 are photos that were
taken from the Racine County project. During construction, a small section of the Strata®
interlayer was removed from
the underlying concrete
pavement (Figure 4) and the
flexibility of the interlayer was
demonstrated (Figure 5). The
St. Croix County project
Strata® interlayer placement
varied between the three test
sections. The interlayer either
extended across just the
passing lane, just the driving
Figure 4. Applied Strata® Interlayer
Figure 5. Flexibility Demonstration of Strata®
14

lane, or across both lanes. Traffic was not allowed to travel on the Strata® interlayer on
either project until the remaining HMA layers were placed.
No construction problems were encountered during paving operations. The Strata® mix
was produced at about half the rate of a standard mix, but was placed at a similar rate.
The Strata® interlayer had a slightly higher shine on the surface than a standard HMA
mix due to the high asphalt content. Release agents were applied to the hauling and
paving equipment during the construction process, resulting in minimal sticking of the
polymer modified mix. No blistering was observed on the interlayer. According to a
SemMaterials representative, the blistering that had occurred in other states was caused by
entrapped moisture in the concrete pavement, in conjunction with hot weather (90 ºF and
higher) and no tack coat. The maximum ambient temperatures during construction of the
Wisconsin projects were 77 ºF on the Racine project and 79 ºF on the St Croix project, but
the mean temperatures were only 72 ºF and 63 ºF respectively. Since these temperatures
were relatively mild, a tack coat was probably unnecessary, but was used nonetheless as a
precautionary measure.
PAVEMENT PERFORMANCE RESULTS
Crack Surveys
Pavement crack surveys of the existing concrete pavement were conducted after the existing
HMA pavements were milled off. All joints and cracks of the existing concrete pavement
within each test and control section were documented to establish baseline data. Crack
surveys were then conducted annually for several years. The total linear feet of cracking that
developed was compared to the original linear feet of cracking to determine the percentage
of reflective cracking. Since the pavements were monitored for overall performance, no
attempt was made to distinguish between reflective cracking and fatigue cracking, with all
cracks being reported as reflective cracks.
15

Racine County
The crack survey results for Racine County are summarized in Table 2. Since Strata® was
only paved in the driving lane and half of the center lane, only the driving lane results are
displayed. Table C-1 in Appendix C contains the total amounts (in linear feet) of cracking.
Table 2. Percentage of Reflective Cracking in Driving Lane, Racine County Project
2002 (1-YR) 2003 (2-YR) 2004 (3-YR) 2005 (4-YR)Test Section 1 0% 5% 16% 21%
Control 1 0% 11% 15% 19%Test Section 2 0% 1% 6% 6%
Control 2 0% 13% 19% 20%
After one year, none of the sections showed any reflective cracking. After the second year,
the two Strata® test sections had only 5 percent and 1 percent reflective cracking, less than
the two control sections which had 11 and 13 percent. By the third year, Test Section 1,
Control Section 1 and Control Section 2 had comparable amounts of reflective cracking (16,
15 and 19 percent, respectively). Test Section 2 performed the best, with only 6 percent
reflective cracking. Fourth-year results were similar to the previous year with Test Section 1
and Control Sections 1 and 2 performing comparably—21, 19 and 20 percent reflective
cracking, respectively. Test Section 2 still showed only 6 percent reflective cracking in the
fourth year, the same as the previous year.
Evident from saw cuts that extended into the adjacent shoulder and from cores taken from
the project in 2004, most of the reflective cracks were over the joints of the full-depth
concrete patches. Thus, the reflective cracking was likely due to movement of the
underlying patches. Although the full-depth concrete patches of the underlying concrete
pavement were doweled, they were still “working” joints experiencing differential vertical
and horizontal movements. The movement was apparently more than the interlayer could
endure, particularly in Test Section 1.
16

A review of some soil borings taken throughout the project length indicated that the
subsurface soils were generally uniform in the test and control sections, consisting mainly of
silty clay. The two worst sections were Control Section 1, which had a layer of clayey
organics at a depth of six feet, and Strata® Test Section 2, which had a wet layer at a depth
of six to seven feet. Hence, the subgrade didn’t appear to be a factor in the differing
performances between Strata® Test Sections 1 and 2. A summary of the soil boring
information from the Racine County project is located in Appendix D.
In summary, Strata® was able to delay reflective cracking for two years; however, because
of the inconsistent results between the two Strata® test sections, the Racine County project
showed no conclusive evidence that Strata® would reduce reflective cracking longer than
two years.
St. Croix County
The placement of the Strata® interlayer at the St. Croix County project varied among the
three test sections. The Strata® interlayer either extended across just the passing lane (Test
Section 1), across both lanes (Test Section 2), or across just the driving lane (Test Section
3). This layout was designed to identify potential differences in the Strata® interlayer
performance and determine which is most cost-effective. Accordingly, crack survey results
for the St. Croix County site are broken down by lane and are summarized in Table 3.
Tables C-2 and C-3 in Appendix C show the total amounts (in linear feet) of cracking.
17

Table 3. Percentage of Reflective Cracking, St. Croix County Project*
DL PL DL PL DL PLControl 1 (No Strata) 20% 30% 37% 40% 47% 40%
Test Section 1 (Strata in PL) 29% 23% 47% 39% 56% 48%Test Section 2 (Strata in both lanes) 23% 26% 34% 36% 44% 51%
Test Section 3 (Strata in DL) 23% 47% 31% 53% 43% 91%Control 2 (No Strata) 21% 33% 38% 54% 48% 73%
2003 (1-YR) 2004 (2-YR) 2005 (3-YR)
DL = Driving Lane PL = Passing Lane * It should be reiterated that, unlike the repairs of the Racine County project, the full-depth concrete repairs on this project were not doweled; consequently, the concrete patches and the old existing concrete pavement could move independently while subjected to temperature variations and dynamic loading. Hence, the horizontal and vertical movements at the joints of the patches were likely much greater than those on the Racine project, resulting in much greater amounts of reflective cracking.
After one year, Control Sections 1 and 2, which didn’t have a Strata® interlayer, showed the
lowest percentage of reflective cracking in the driving lanes (20 and 21 percent
respectively). Test Section 1, which had Strata® in the passing lane only, had the lowest
percentage of reflective cracking in the passing lane (23 percent), but the highest percentage
of reflective cracking in the driving lane (29 percent) after one year. Test Section 2, which
had Strata® in both lanes, performed second best in the passing lane after one year. Test
Section 3, which had Strata® in the driving lane only, had, by far, the highest percentage of
reflective cracking in the adjacent passing lane, 47 percent, after one year.
Second-year results showed that Test Sections 2 and 3, which both contained Strata® in the
driving lane, had the least amount of reflective cracking in the driving lane (34 and 31
percent respectively). Similarly, Test Sections 1 and 2, which both contained Strata® in the
passing lane, had the least amount of reflective cracking in the passing lane (39 and 36
percent respectively). Test Section 1, which had Strata® in the passing lane only, had the
highest percentage of reflective cracking in the adjacent driving lane (47 percent). Test
Section 3, which had Strata® in the driving lane only, had the second highest percentage of
18

reflective cracking in the adjacent passing lane after two years (53 percent). Overall, after
two years, Test Section 2, which had Strata® in both lanes, performed the best.
By the end of the third year, Test Sections 2 and 3, which both had Strata® in the driving
lane, still had the least amount of reflective cracking in the driving lane (44 and 43 percent
respectively); but Control Section 1, which didn’t have a Strata® interlayer, had the least
amount of reflective cracking in the passing lane. Following the same trend of the previous
two years, Test Section 1 (Strata® in passing lane only) continued to have the highest
percentage of reflective cracking in the adjacent driving lane (56 percent), and Test Section
3 (Strata® in driving lane only) had the highest percentage of reflective cracking in the
adjacent passing lane (91 percent). Although Test Section 2, which had Strata® in both
lanes, performed fairly well after three years and had an average percentage of reflective
cracking in both lanes of 47.5 percent, Control Section 1 (without Strata®) performed the
best with an average percentage of reflective cracking of 40 percent.
Soil Conservation Service maps from the soil survey of St. Croix County indicated that
the soil was relatively uniform in the area of the test and control sections, consisting
primarily of silt loam.
In summary, the results of the first two years showed that the lanes/sections with Strata®
performed better than the lanes/sections without Strata®. Test Sections 1 and 3, which only
had Strata® applied to one lane, consistently showed the highest percentage of reflective
cracking in the adjacent lanes without Strata® after all three years. Thus, applying Strata® to
only one lane of a multi-lane facility was ineffective. By the third year, Control Section 1,
which didn’t have a Strata® interlayer, performed the best overall.
Ride Measurements
Ride was measured with a South Dakota-type profiler and recorded in International
Roughness Index (IRI) values. The IRI is a ride quality measurement of the longitudinal
profile of the pavement and the values were recorded in the standard units of
meters/kilometer. In general, IRI values below 1.5 represent a smooth ride, while values in
19

excess of 2.5 indicate a relatively rough riding pavement. Initial measurements were taken
shortly after construction of the Racine County project and one year after construction of the
St. Croix County project to establish baseline data. Subsequent surveys were conducted
annually through 2007 for the Racine County project and 2006 for the St. Croix County
project. The IRI readings for both projects are shown in Tables 4 and 5.
Ride values were collected in the driving lane and center lane of the Racine County project;
however, since Strata® was only applied in the driving lane and half of the center lane, only
the driving lane results are shown. After six years, the Racine County project results
showed Strata® Test Sections 1 and 2 and Control Section 2 performing uniformly well with
IRI values of 0.74, 0.73, and 0.74, respectively. Control Section 1 had a slightly higher IRI
than the other sections after six years (1.06), but that was also true in 2001 shortly after
construction. So, that appears to be a construction issue rather than performance related. The
final IRI values for the St. Croix County project showed all sections performing relatively
equal with IRI values ranging from 0.90 to 1.10 in both the driving lane and the passing
lane. Overall, the results from both projects show all sections performing relatively equal,
with IRI values indicative of a smooth ride.
Table 4. Racine County Driving Lane IRI (units in m/km)
2001 2002 2003 2004 2005 2006 2007
Strata Test Section 1 0.66 0.85 1.04 0.69 1.14 0.68 0.74Control 1 0.95 1.06 1.07 0.95 1.33 0.95 1.06Strata Test Section 2 0.36 0.66 1.18 1.01 0.82 0.76 0.73Control 2 0.33 0.57 1.39 0.80 0.90 0.80 0.74
20

Table 5. St. Croix County IRI (units in m/km)
DL PL DL PL DL PL DL PLControl 1 1.29 - 1.25 1.28 0.90 1.15 0.98 0.95Strata Test Section 1 1.14 1.31 1.26 1.14 0.93 1.01 0.93 1.10Strata Test Section 2 1.39 1.07 1.22 1.15 0.86 0.99 0.90 0.92Strata Test Section 3 0.99 1.28 1.26 1.06 0.95 0.93 0.95 0.96Control 2 1.17 1.26 1.23 1.06 0.96 0.88 0.99 1.03
2003 2004 2005 2006
Rut Depth Surveys
Rut depths were also measured with the road profiler and recorded in units of inches. The
rut measurements are shown in Tables 6 and 7. All sections on both projects showed
minimal rutting with only negligible differences among the sections.
Table 6. Racine County Rutting (units in inches)
able 7. St. Croix County Rutting (units in inches)
2001 2002 2003 2004 2005 2006 2007DL DL DL DL DL DL DL
Strata Test Section 1 0.01 0.03 0.10 0.09 0.09 0.11 0.11Control 1 0.01 0.03 0.08 0.09 0.06 0.11 0.12Strata Test Section 2 0.01 0.06 0.11 0.12 0.12 0.13 0.16Control 2 0.02 0.07 0.08 0.05 0.06 0.09 0.09 T
DL PL DL PL DL PL DL PLControl 1 0.03 0.02 0.03 0.04 0.06 0.06 0.06 0.04Strata Test Section 1 0.05 0.01 0.02 0.05 0.04 0.08 0.03 0.09Strata Test Section 2 0.03 0.02 0.04 0.05 0.08 0.09 0.07 0.07Strata Test Section 3 0.02 0.05 0.05 0.04 0.06 0.06 0.08 0.04Control 2 0.03 0.06 0.03 0.05 0.04 0.08 0.04 0.07
2005 20062003 2004
21
Coring
Nine cores were taken on cracks from the St. Croix County project in 2003, less than one
year after construction. The cracks were all over joints or full-depth undoweled concrete
patches. Of the nine cores, seven were from the Strata® test sections and only four of those
cores were intact. Of the four intact cores, two of them showed that the Strata® had also
cracked, allowing moisture access to the underlying concrete pavement and subgrade. The
Strata® was not cracked in the other two cores. Both of the control section cores were
cracked through the depth of the HMA.
Six cores were taken over c
from the Racine County project
in 2004, four of which were
from Strata
racks
r
n
in
t and
aining
® Test Section 1. The
cracks were all over joints o
full-depth doweled concrete
patches. Of the four cores take
from the Strata® test section, the
Strata® interlayer was cracked
three of them, again allowing
moisture infiltration to the
underlying concrete pavemen
subgrade. Figure 8 shows a core
taken over a banded crack with the
Strata® interlayer also cracked.
Figure 9 shows the one core with
the Strata® intact. The rem
Figure 8. Core Revealing Cracked Strata® Interlayer
two cores taken from the St. Croix
project were from Control Section 1
and both were completely cracked
through the HMA. Figure 9. Core of Strata® Interlayer Intact
22

In summary, the majority of the cores (5 out of 8) showed that the Strata® interlayer was
also cracked. Thus, any water that seeped through the cracks in the overlay could infiltrate to
the underlying concrete pavement and subgrade.
COSTS
The difference in cost for premium, production, and paving of the Strata® interlayer versus a
standard Type E-30 mix for the Racine County project was an additional $2.83 per square
yard. Thus, the total cost of the Strata® interlayer was approximately $4.88 per square yard.
The total cost of the Strata® interlayer for the St. Croix County project was $5.49 per square
yard.
WisDOT began routing and sealing the cracks on the projects after three years. Since Strata®
did not reduce reflective cracking longer than two years on either of the projects, the amount
of necessary crack routing and sealing was not reduced. Thus, WisDOT did not experience
cost savings. Therefore, a life cycle cost analysis was not performed and the costs are shown
here for informational purposes only.
SUMMARY AND CONCLUSIONS
Construction of the Strata® interlayer went smoothly and no problems were encountered
during paving operations. The Strata® interlayer was placed at about the same rate as a
standard mix.
Results from the Racine County project showed that the Strata® Crack Relief System was
able to delay reflective cracking for two years on an HMA pavement over a concrete
pavement with doweled full-depth concrete patches. After three and four years, the results
were inconsistent—while one of the Strata® test sections performed the best and had the
least amount of reflective cracking, the other Strata® test section performed similarly to the
two control sections. Most of the reflective cracks present were over the joints of full-depth
doweled concrete patches. Since the joints of full-depth doweled patches, similar to
contraction joints, were “working” joints, some movement at the joints was expected. It is
unclear, however, why one Strata® test section showed less reflective cracking than the other
23

sections. A review of soil borings indicated that the subgrade was relatively uniform and
didn’t appear to be a factor in the differing performances between the Strata® test sections. If
the superior performance was due to the Strata® interlayer, it is assumed the results would
e similar in both Strata® test sections. Since the results between the two test sections were
nt, there was no conclusive evidence that Strata® would reduce reflective cracking
ve cracking for only two years in an HMA overlay over a concrete pavement with
ndoweled full-depth concrete patches. After three years, one of the control sections ®
orming comparably well, and were representative of
smooth riding pavement. Final rut measurements were minimal in all sections on both
s among the sections.
as
t of 8 cores. Thus, the Strata interlayer did not protect the underlying
oncrete pavement and subgrade from moisture infiltration.
ed
l
b
inconsiste
longer than two years on an HMA pavement over a concrete pavement with doweled full-
depth concrete patches.
Results from the St. Croix County project showed that the Strata® interlayer slightly delayed
reflecti
u
(without Strata ) performed the best overall.
Ride and rut measurements were taken through 2007 on the Racine County project and
through 2006 on the St. Croix County project. Overall, the final IRI measurements on
both projects showed all sections perf
a
projects, with only negligible difference
As determined from core samples extracted from both projects, the Strata® interlayer w
cracked in 5 ou ®
c
In summary, the Strata® interlayer delayed reflective cracking on both projects for two
years. Third-year results from both projects showed the Strata® test sections performing
similarly to the control sections. Since WisDOT typically performs crack maintenance
(sealing or routing and sealing) beginning in year three, the ability of Strata® to reduce
reflective cracking for only two years does not result in any cost savings to WisDOT. In
addition, the service lives of these pavement structures are not expected to be increas
because of the Strata® interlayer. With no foreseeable benefits to justify the increased initia
construction costs, a life cycle cost analysis was not necessary. Hence, the Strata® interlayer
24

is not cost-effective in reducing reflective cracking of an HMA overlay placed over a
concrete pavement.
RECOMMENDATION
Based on the results of this study, it is recommended that WisDOT not use Strata®
Reflective Crack Relief System to reduce reflective cracking or to extend the service life o
an HMA overlay placed
f
on a concrete pavement.
25

APPENDIX A: MIX DESIGNS

A-1
Figure A-1. Racine County Project E-30 Mix Design
, , Section: , T: N, R:, County:
Design Lab: PAYNE & DOLAN (WAUKESHA) Mix Type: E30-12.5
Design ID: 504101 Last Field Change Test Number:
Date:
Material Description Aggregate Source Pit/Quarry Location Test Number
1 5/8" CHIP FRANKLIN QRY NE, Section: 10, T: 5 N, R: 21, E
2 3/8" CHIP FRANKLIN QRY NE, Section: 10, T: 5 N, R: 21, E
3 MFG’D SAND
4 NATURAL SAND
Sieve Sizes 25.0 (1") 100.0 100.0 100.0 100.0 100.0
19.0 (3/4") 100.0 100.0 100.0 100.0 100.0
12.5 (1/2") 89.0 100.0 100.0 100.0 97.8
9.5 (3/8") 39.5 98.4 100.0 100.0 87.5
4.75 (#4) 6.0 19.0 96.5 89.4 58.3
2.36 (#8) 4.6 5.9 63.3 72.2 38.1
1.18 (#16) 4.3 5.1 38.9 56.3 25.3
0.600 (#30) 4.1 4.8 23.8 36.2 16.4
0.300 (#50) 3.9 4.6 13.4 11.9 9.2
0.150 (#100) 3.7 4.3 7.7 5.2 5.8
75 µm (#200) 3.2 3.7 5.6 4.0 4.5
Agg Blend %: 20.0 25.0 45.0 10.0 100.0
Gsb: 2.599 2.600 2.722 2.671 2.662
% AC (Total): 5.4 Added % Air Voids: 4.04% Agg. Angularity (Fines): 46.3
Grade: PG 64-22 Gmm: 2.523 Gmm Dryback Correction: Source: AMOCO Gmb: 2.421 Unit Wt (PCF): 150.68
AC Sp. Gr: 1.033 @ 25/25°C Gse: 2.749 Fracture: 98.6 1F 98.4 2F
RAP % AC: %VMA 14.0 Thin/Elong: 1.2
Mixing Temp (°C): 163-168 % VFB: 71.0 TSR: 87.4
Compaction Temp (°C): 152 Sand Equiv. (%) 86.4 TSR Comp. Effort: 48.0 N
Design Comp. Effort: 100 Ndes Stability (N): Anitstrip: NONE
Remarks: Satisfactory Nini = 8, %Gmm = 86.2 Nmax = 160, %Gmm = 97.5 DP = 1.2 MOISTURE ABSORPTION = 1.7 Matr’l 1,2 agg test = 217-146-98 Matr’l 3,4 = HONEY CREEK PIT S6, T3N, R19E RACINE CO. This design and review have been updated to reflect the additional satisfactory use of B.P. Amoco PG 64-22 (having a
Verified Date: 06/25/2001 Verified By: JUDIE RYAN
Test Number: 0 - 250 - 0172 - 2001 Labsite: Page 1 of 1
Materials Laboratory Testing System Tests On: Asphalt mix design Type: DR - DESIGN REVIEW
Wisconsin Department of Transportation Bureau of Highway Construction Lab Truax Center, 3502 Kinsman Blvd. Madison, WI 53704
Main Project ID: 0617-32-10
CENTRAL LABORATORY GENERAL TESTING
Quantity:
Date Sampled: Date Received: Date Tested: 06/22/01 06/25/01
By: JACK WEIGEL By: K. HORNBECK
Source: *SOURCE NOT AVAILABLE Legal Description:
1 2 3 4 JMF Blend

Figure A-2. St. Croix County Project SMA Mix Design
Test Number: 0 - 250 - 0064 - 2002 Labsite: Page 1 of 1
Materials Laboratory Testing System Tests On: Asphalt mix design Type: DR - DESIGN REVIEW
Wisconsin Department of Transportation Bureau of Highway Construction Lab Truax Center, 3502 Kinsman Blvd. Madison, WI 53704
Main Project ID: 1020-06-70
HUDSON - MENOMONIE RD, CTH BB - STH 128 I 94
Quantity:
Date Sampled: Date Received: Date Tested: 05/09/02 05/10/02
By: JOHN JORGENSON By: JAMES BONGARD
Source: LAWIN Legal Description: , NE, Section: 18, T: 30 N, R: 8, W County: CHIPPEWA
Design Lab: MATHY CONSTRUCTION CO. Mix Type: E30-12.5 SMA
Design ID: 26-2-1-SMA-12.5 Last Field Change Test Number:
Date:
Material Description Aggregate Source Pit/Quarry Location Test Number
1 5/8" COARSE ROCK LAWIN Pit NE, Section: 18, T: 30 N, R: 8, W
2 3/8" COARSE LAWIN Pit NE, Section: 18, T: 30 N, R: 8, W
3 MAN SAND LAWIN Pit NE, Section: 18, T: 30 N, R: 8, W
4 5/8" X 3/8" ROCK LAWIN Pit NE, Section: 18, T: 30 N, R: 8, W
5 FLY ASH
Sieve Sizes 1 2 3 4 5 JMF Blend
25.0 (1") 100.0 100.0 100.0 100.0 100.0 100.0
19.0 (3/4") 100.0 100.0 100.0 100.0 100.0 100.0
12.5 (1/2") 62.0 100.0 100.0 91.0 100.0 89.5
9.5 (3/8") 11.0 95.0 100.0 65.0 100.0 70.3
4.75 (#4) 1.5 10.0 96.0 21.0 100.0 27.4
2.36 (#8) 1.3 3.2 61.0 7.5 100.0 17.5
1.18 (#16) 1.1 2.8 41.0 4.8 100.0 14.3
0.600 (#30) 1.1 2.5 28.0 3.9 99.0 12.3
0.300 (#50) 0.9 2.2 20.0 3.2 97.0 10.9
0.150 (#100) 0.8 1.8 12.0 2.5 92.0 9.3
75 µm (#200) 0.6 1.3 8.3 1.9 87.0 8.1
Agg Blend %: 22.0 35.0 12.0 24.0 7.0 100.0
Gsb: 2.748 2.726 2.689 2.765 2.400 2.713
% AC (Total): 5.3 Added % Air Voids: 4.02% Agg. Angularity (Fines): 47.8
Grade: 70-28 Gmm: 2.513 Gmm Dryback Correction:
Source: MIF Gmb: 2.412 Unit Wt (PCF): 150.12
AC Sp. Gr: 1.031 @ 25/25°C Gse: 2.733 Fracture: 100.0 1F 98.6 2F
RAP % AC: %VMA 15.8 Thin/Elong: 18.3
Mixing Temp (°C): 135-149 % VFB: 74.6 TSR: 96.5
Compaction Temp (°C): Sand Equiv. (%) 74.0 TSR Comp. Effort: 30.0 N
Design Comp. Effort: 100 Ndes Stability (N): Anitstrip: NONE
Remarks: Satisfactory Nini = 8 %Gmm = 85.7 Nmax = 160 %Gmm = 97.9 DP = 1.6 MA = 0.9 DRAINDOWN = 0.02%
Verified Date: 05/10/2002 Verified By: JUDIE RYAN
A-2

APPENDIX B: 2008 WISDOT STANDARD
SPECIFICATIONS FOR HMA MIXTURES
B-1
Table B-1. Aggregate Gradation Master Range and VMA Requirements
-100 100 90 - 97 100
9.5 mm - 100
4.75 mm ___ ___ ___ ___ 45
2.36 mm 8
75 µm 0 – 6.0 1.0 - 7.0 2.0 - 8.0 2.0 - 10.0 2.0 - 10.0 8.0 - 12.0 10.0 - 14.0
PERCENT MINIMUM
VMA 11.0 12.0 13.0 14.0 15.0 16.0 17.0
SIEVE SIZE OMINAL SIZE
PERCENTS PASSING DESIGNATED SIEVES
37.5 mm 25.0 mm 19.0 mm 12.5 mm 9.5 mm SMA 12.5 mm SMA 9.5 mm
50.0 mm 100
37.5 mm 90 –100 100
25.0 mm 90 max 90 -100 100
19.0 mm ___ 90 max 90 -100 100 100
12.5 mm ___ ___ 90 max 90
___ ___ ___ 90 max 90 -100 58 - 72 90
90 max 25 - 35 35 -
15 – 41 19 - 45 23 - 49 28 - 58 20 - 65 15 - 25 18 - 2
N

Table B-2. Mixture Requirements
Mixture type E - 0.3 E - 1 E - 3 E - 10 E - 30 E - 30x SMA
ESALs x 106 (20 yr design life) < 0.3 0.3 - < 1 1 - < 3 3 - < 10 10 - < 30 ≥ 30 ___
LA Wear (AASHTO T 96)
100 revolutions(max % loss) 13 13 13 13 13 13 13
500 revolutions(max % loss) 50 50 45 45 45 45 45
Soundness (AASHTO T 104) (sodium sulfate, max % loss) 12 12 12 12 12 12 12
Freeze/Thaw (AASHTO T 103) (specified counties, max % loss) 18 18 18 18 18 18 18
Fractured Faces (ASTM 5821) (one face/2 face, % by count) 60 / __ 65 / __ 75 / 60 85 / 80 98 / 90 100/100 100/90
Flat and Elongated (ASTM 5 5 5 5 5 5 20
D4791)
(max %, by weight)
Fine Aggregate Angularity (AASHTO T304, method A, min) 40 40 43 45 45 45 45
Sand Equivalency
(AASHTO T 176, min)
Gyratory Compaction
Gyrations for Nini 6 7 7 8 8 9 8
Gyrations for Ndes 40 60 75 100 100 125 65
Gyrations for Nmax 60 75 115 160 160 205 160
Air Voids, %Va 4.0 4.0 4.0 4.0 4.0 4.0 4.0
(%Gmm @ Ndes) (96.0) (96.0) (96.0) (96.0) (96.0) (96.0) (96.0)
% Gmm @ Nini ≤ 91.5[1] ≤ 90.5[1] ≤ 89.0[1] ≤ 89.0 ≤ 89.0 ≤ 89.0 ___
% Gmm @ Nmax ≤ 98.0 ≤ 98.0 ≤ 98.0 ≤ 98.0 ≤ 98.0 ≤ 98.0 ___
Dust to Binder Ratio[2]
(% passing 0.075/Pbe)
Voids filled with Binder 70 - 80 65 - 78 65 – 75 65 - 75 65 - 75 65 - 75 70 - 80
(VFB or VFA, %) [4] [5] [4] [4] [3] [4] [3] [4] [3] [4]
Tensile Strength Ratio (TSR)
(ASTM 4867)
no antistripping additive 0.70 0.70 0.70 0.70 0.70 0.70 0.70
with antistripping additive 0.75 0.75 0.75 0.75 0.75 0.75 0.75
Draindown at Production ___ ___ ___ ___ ___ ___ 0.30Temperature (%)
[1] The percent maximum density at initial compaction is only a guideline. [2] For a gradation that passes below the boundaries of the caution zone(ref. AASHTO MP3), the dust to binder ratio
limits are 0.6 - 1.6.
[3] For 9.5mm nominal maximum size mixtures, the specified VFB range is 73 - 76%. [4] For 37.5mm nominal maximum size mixes, the specified VFB lower limit is 67%. [5] For 25.0mm nominal maximum size mixes, the specified VFB lower limit is 67%.
(5:1 ratio) (5:1 ratio) (5:1 ratio) (5:1 ratio) (5:1 ratio) (5:1 ratio) (3:1 ratio)
40 40 40 45 45 50 50
0.6 - 1.2 0.6 - 1.2 1.2 - 2.00.6 - 1.2 0.6 - 1.2 0.6 - 1.2 0.6 - 1.2
B-2

APPENDIX C: TOTAL CRACK COUNTS

C-1
Table C-1. Racine County Linear Feet of Reflective Cracking in Driving Lane
able C-2. St. Croix County Linear Feet of Reflective Cracking in Driving Lane
Table C-3. St. Croix County Linear Feet of Reflective Cracking in Passing Lane
Pre-Con 2002 2003 2004 2005Control 1 (No Strata) 120 36 48 48
Test Section 1 (Strata in PL) 372 84 145 177Test Section 2 (Strata in both lanes) 996 254 354 509
Test Section 3 (Strata in DL) 180 84 96 164Control 2 (No Strata) 216 72 116 157
Linear Feet Cracking in Passing Lane
Pre-Con 2001 2002 2003 2004 2005Test Section 1 3007 0 154 468 622
Control 1 2997 6 316 441 571Test Section 2 2748 0 24 166 173
Control 2 2076 0 262 398 406
Linear Feet Cracking in Driving Lane
T
Pre-Con 2002 2003 2004 2Linear Feet Cracking in Driving Lane
005Control 1 (No Strata) 180 36 66 84
Test Section 1 (Strata in PL) 396 115 188 220Test Section 2 (Strata in both lanes) 1140 261 389 499
Test Section 3 (Strata in DL) 264 62 83 114Control 2 (No Strata) 288 60 108 139

APPENDIX D: RACINE COUNTY SOIL BORING
INFORMATION

Table D-1. Summary of Soil Boring Information from the Racine County Project
# 130 # 132 # 134 # 136 # 1385” 5” 5” 5” 7” 5” 6” 5” 5” 4 4” 5” 5” 5” 5”
HMA HMA HMA HMA HMA HMA HMA HMA HMA H HMA HMA HMA HMA HMA11”
concrete11”
concrete11”
concrete11”
concrete10”
concrete11”
concrete10”
concrete11”
concrete10”
concrete con10”
concrete10”
concrete10”
concrete10”
concrete10”
concrete14” 18” 12” 12” 12” 14” 14” 14” 13” 1 12” 13” 13” 13” 12”
base co. base co. base co. base co. base co. base co. base co. base co. base co. bas base co. base co. base co. base co. base co.CL CL CL CL CL CL CL ML ML CL CL CL CL SC
2.7’-10’ 2.8’-10’ 2.4’-10’ 2.5’-10’ 2.7’-10’ 2.6’-10’ 2.7’-6’ 2.7’-5.5’ 2.3’-3. 2.2’-10’ 2.3’-10’ 2.3’-10’ 2.3-3’ 2.2’-10’OL OL CL ML
6’-9’ 5.5’-8’ 3.5’-10 3’-8’CL CL CLD
-1 9’-10’ 8’-10’ 8’-10’
AE –1.5’-4.0’
AE –1.5’-7.0’
AE –1.5’-10.0’
AE –1.5’-5.0’
AE –1.5’-7.0’
AE –1.5’-10.0’
AE –1.5’-9.0’
AE –1.5’-8.0’
AE –1.5’-5 1.5’-5
AE –1.5’-5.0’
AE –1.5’-6.0’
AE –1.5’-6.0’
AE –1.5’-10’
AE –1.5’-10.0’
mo moistwet at 7.5’
Test Section 1 (Strata® 1) Control 1 Test Section ta® 2) Control 2
moist moist moist moist moist moist moist moist moist
base co. – Base CourseCL – Silty Clay
moist moist moist moist
ML – Clayey Silt, Slightly OrganicOL – Clayey Topsoil or Clayey PeatSC – Clayey SandAE – Auger Easy
# 157 # 159 # 161 # 163 # 149 # 151 # 153 # 155 # 126 # 128.5”MA9” crete2”e co.
CL5’ 2.1’-10’
’
.5’AE –
.0’ist
wet at 6.0’
2 (Stra# 157 # 159 # 161 # 163 # 149 # 151 # 153 # 155 # 126 # # 130 # 132 # 134 # 136 # 138
5” 5” 5” 5” 7” 5” 6” 5” 5” 4 4” 5” 5” 5” 5”HMA HMA HMA HMA HMA HMA HMA HMA HMA H HMA HMA HMA HMA HMA11”
concrete11”
concrete11”
concrete11”
concrete10”
concrete11”
concrete10”
concrete11”
concrete10”
concrete con10”
concrete10”
concrete10”
concrete10”
concrete10”
concrete14” 18” 12” 12” 12” 14” 14” 14” 13” 1 12” 13” 13” 13” 12”
base co. base co. base co. base co. base co. base co. base co. base co. base co. bas base co. base co. base co. base co. base co.CL CL CL CL CL CL CL ML ML CL CL CL CL SC
2.7’-10’ 2.8’-10’ 2.4’-10’ 2.5’-10’ 2.7’-10’ 2.6’-10’ 2.7’-6’ 2.7’-5.5’ 2.3’-3. 2.2’-10’ 2.3’-10’ 2.3’-10’ 2.3-3’ 2.2’-10’OL OL CL ML
6’-9’ 5.5’-8’ 3.5’-10 3’-8’CL CL CLD
-1 9’-10’ 8’-10’ 8’-10’
AE –1.5’-4.0’
AE –1.5’-7.0’
AE –1.5’-10.0’
AE –1.5’-5.0’
AE –1.5’-7.0’
AE –1.5’-10.0’
AE –1.5’-9.0’
AE –1.5’-8.0’
AE –1.5’-5 1.5’-5
AE –1.5’-5.0’
AE –1.5’-6.0’
AE –1.5’-6.0’
AE –1.5’-10’
AE –1.5’-10.0’
mo moistwet at 7.5’
Test Section 1 (Strata® 1) Control 1 Test Section ta® 2) Control 2
moist moist moist moist moist moist moist moist
# 157 # 159 # 161 # 163 # 149 # 151 # 153 # 155 # 126 # # 130 # 132 # 134 # 136 # 1385” 5” 5” 5” 7” 5” 6” 5” 5” 4 4” 5” 5” 5” 5”
HMA HMA HMA HMA HMA HMA HMA HMA HMA H HMA HMA HMA HMA HMA11”
concrete11”
concrete11”
concrete11”
concrete10”
concrete11”
concrete10”
concrete11”
concrete10”
concrete con10”
concrete10”
concrete10”
concrete10”
concrete10”
concrete14” 18” 12” 12” 12” 14” 14” 14” 13” 1 12” 13” 13” 13” 12”
base co. base co. base co. base co. base co. base co. base co. base co. base co. bas base co. base co. base co. base co. base co.CL CL CL CL CL CL CL ML ML CL CL CL CL SC
2.7’-10’ 2.8’-10’ 2.4’-10’ 2.5’-10’ 2.7’-10’ 2.6’-10’ 2.7’-6’ 2.7’-5.5’ 2.3’-3. 2.2’-10’ 2.3’-10’ 2.3’-10’ 2.3-3’ 2.2’-10’OL OL CL ML
6’-9’ 5.5’-8’ 3.5’-10 3’-8’CL CL CLD
-1 9’-10’ 8’-10’ 8’-10’
AE –1.5’-4.0’
AE –1.5’-7.0’
AE –1.5’-10.0’
AE –1.5’-5.0’
AE –1.5’-7.0’
AE –1.5’-10.0’
AE –1.5’-9.0’
AE –1.5’-8.0’
AE –1.5’-5 1.5’-5
AE –1.5’-5.0’
AE –1.5’-6.0’
AE –1.5’-6.0’
AE –1.5’-10’
AE –1.5’-10.0’
mo moistwet at 7.5’
Test Section 1 (Strata® 1) Control 1 Test Section ta® 2) Control 2
moist moist moist moist moist moist moist moist moist
base co. – Base CourseCL – Silty Clay
moist moist moist moist
ML – Clayey Silt, Slightly OrganicOL – Clayey Topsoil or Clayey PeatSC – Clayey SandAE – Auger Easy
128.5”MA9” crete2”e co.
CL5’ 2.1’-10’
’
.5’AE –
.0’ist
wet at 6.0’
2 (Stra128.5”MA9” crete2”e co.
CL5’ 2.1’-10’
’
.5’AE –
.0’ist
wet at 6.0’
2 (Stra
moist
base co. – Base CourseCL – Silty Clay
moist moist moist moist
ML – Clayey Silt, Slightly OrganicOL – Clayey Topsoil or Clayey PeatSC – Clayey SandAE – Auger Easy


![BC Strata Property Act - bazingahelp.zendesk.com · STRATA PROPERTY ACT [SBC 1998] ... 78 Acquisition of land by strata corporation ... Part 15 — Strata Plan Amendment and Amalgamation](https://img.dokumen.tips/doc/110x75/5b1695857f8b9a596d8cce51/bc-strata-property-act-strata-property-act-sbc-1998-78-acquisition-of.jpg)