Embed Size (px)
Citation preview

Pertanika J. Sci. & Technol. 29 (4): 3099 - 3112 (2021)
SCIENCE & TECHNOLOGYJournal homepage: http://www.pertanika.upm.edu.my/
Article history:Received: 28 May 2021Accepted: 9 August 2021Published: 28 October 2021
ARTICLE INFO
E-mail addresses:[email protected] (Zuraira Libasin)[email protected] (Wan Suhailah Wan Mohamed Fauzi)[email protected] (Ahmad Zia Ul-Saufie)[email protected] (Nur Azimah Idris)[email protected] (Noor Azizah Mazeni)*Corresponding author
ISSN: 0128-7680e-ISSN: 2231-8526 © Universiti Putra Malaysia Press
DOI: https://doi.org/10.47836/pjst.29.4.46
Evaluation of Single Missing Value Imputation Techniques for Incomplete Air Particulates Matter (PM10) Data in MalaysiaZuraira Libasin1, Wan Suhailah Wan Mohamed Fauzi2, Ahmad Zia ul-Saufie3*, Nur Azimah Idris1 and Noor Azizah Mazeni1
1Department of Computer and Mathematical Sciences, Universiti Teknologi MARA, Cawangan Pulau Pinang, Permatang Pauh Campus, 13500 Permatang Pauh, Penang, Malaysia2Faculty of Chemical Engineering with Environment, Universiti Teknologi MARA, 40450 Shah Alam, Selangor, Malaysia3Faculty of Computer and Mathematical Sciences, Universiti Teknologi MARA, 40450 Shah Alam, Selangor, Malaysia
ABSTRACT
The missing value in the dataset has always been the critical issue of accurate prediction. It may lead to a misleading understanding of the scenario of air pollution. There might only be a small number of missing (5% to 10%) answers to each problem, but the missing details may vary. This research is focused mainly on solving long gap missing data. Single missing value imputation means replacing blank space in the monitoring dataset from chosen Department of Environment (DoE) monitoring station with the calculated value from the best technique for long gap hours. The variable that is mainly being a monitor is PM10. The technique focused on this research is the single imputation technique. Furthermore, this technique was tested on the Tanjung Malim monitoring station dataset
by fitting with five performance indicators. The result was compared with the previous study, whether it is the best used for long gap hour data. Four stages need to be followed to complete this research. The steps are data acquisitions, characteristic analysis of missing value, single imputation approach, verification of approach and suggestion of the best technique. This research used four existing imputation techniques: series mean (SM), mean of nearby points (MNP), linear

Pertanika J. Sci. & Technol. 29 (4): 3099 - 3112 (2021)3100
Zuraira Libasin, Wan Suhailah Wan Mohamed Fauzi, Ahmad Zia ul-Saufie, Nur Azimah Idris and Noor Azizah Mazeni
trend (LT), and linear interpolation (LIN). This research shows that the interpolation technique is the best technique to apply particulate matter missing data replacement with the least mean absolute error and better performance accuracy.
Keywords: Air pollution, imputation, linear interpolation, missing data, performance indicator
INTRODUCTION
Air pollution cases nowadays being a primary concern around the world. It is due to its effect on the environment and the human population’s health when it accumulates in high concentrations in the atmosphere. The common pollutants mainly source from soot, smoke, mould, pollen, methane and even carbon dioxide (Ward, 2019).
These pollutants defected humans’ health by irritating the eyes, nose, and throat. It can also cause wheezing, coughing, chest tighten also worsening the existing lung and heart disease. The worst-case can cause cancer and damage the immunization, neurological and reproductive systems (Department of Environment, 2018). The effects it brings to our environment also can be considered severe as it causes acid rain, eutrophication, haze, congenital disabilities and disease on wildlife, ozone depletion, crop and forest damage and finally, global climate change (Department of Environment, 2018).
Since many sources cause air pollution, air pollution monitoring is needed to control and monitor contamination. Of course, the way to monitor air pollution is by remote instrument. The data collected will be analysed by the researchers to know the exact statistics of pollution levels. However, sometimes when carrying the experiment, there are loopholes present. In this case, the missing data for analysis make the researchers facing difficulties.
This missing data occurs due to equipment failure, human errors, routine maintenance, and changes in sitting monitors or other factors (Ali & Darcy, 2017). It can be detected since there is much missing value in the data stream table collected from Tanjung Malim, Perak station. There are two types of missing data which are ignorable and non-ignorable. Ignorable data exist in three forms. The first is missing data that is linked to sampling. The second is missing at random, known as MAR data (Ali & Darcy, 2017). The third is missing completely at random (MCAR) (Norazian et al., 2008). The Missing Not at Random (MNAR) is considered not ignorable (Little & Rubin, 2019) if there are no present simple solutions for treating the missing data. A model must be postulated for MNAR missingness, which must be included in the study to avoid bias (De Leeuw & Meijer, 2008).
The missing value in the dataset has always been the critical issue of accurate prediction. It may lead to a misleading understanding of the scenario of air pollution. There might only be a small number of missing (5% to 10%) answers to each problem, but the missing details may be various (https://www.bauer.uh.edu/jhess/documents/2.pdf).
Pertanika J. Sci. & Technol. 29 (4): 3099 - 3112 (2021) 3101
Evaluation of Single Imputation for Incomplete PM10 Data
Previously research developed and enhanced new or existing imputation methods to solve for long gap missing data. However, few studies have tried to find an effective method to boost imputation output for long-term consecutive missing values (Anh et al., 2011).
Interpolation is a well-known technique used in numerical analysis and has different approaches in environmental data sets (Zainudin & Noor, 2009). The interpolation of the technique is introduced to overcome the problem of missing data. This research’s chosen interpolation technique is single imputation, which replaces the calculated value in the blank space of the collected data set from the monitoring station. Recently, the previous study is only suitable for short gaps (l<3 hours) and medium gaps (4 hours<l<18 hours), where l is known as length. However, the previous techniques are unsuitable for the long gaps (l>19 hours), due to poor performance and less accuracy. Therefore, this study aims to evaluate the single imputation technique in dealing with the long gaps of missing air pollution data to improve the performance. The single imputation approach was carried out using four different techniques and chose the best one by looking at their performance. This finding will overcome the misleading interpretation as well as inaccurate prediction due to the missing data. As a result, the chosen best single imputation technique will improve the accuracy in minimising the missing values problem, especially to the long gap’s condition.
MATERIALS AND METHODS
This research’s scope is to determine the missing value in air pollution data which variable stands from particulate matter (PM10). Data were acquired from the Department of Environment (DoE) Malaysia. In this study, the Tanjung Malim monitoring station is chosen because it is strategically placed to detect transboundary haze pollution, harmful and affecting health quality (Latif et al., 2018).
The hourly data from 2002 until 2016 consists of variables sulfur dioxide (SO2), carbon monoxide (CO), carbon dioxide (CO2), ozone (O3) and particulate matters (PM10). However, data of PM10 in the year 2005 only was considered in this study because it has the smallest missing value percentage and can support extensive data shown in Figure 1. Therefore, this variable will be calculated using the performance indicator at a different percentage of missing value.
Monitoring data of the year 2005 for PM10 in Tanjung Malim were selected to simulate missing data. The data set consists of 8731 valid data set with 53 missing data counts. The mean and standard deviation values for the entire observed data set are 43.00882 and 28.860522, respectively. The missing data counts for the data ranging from 0.6% to 2.9%. The most extensive data set lies in 2005 with 8731 data, with the lowest missing values count. As a reason, this data set is used for the single imputation technique to know which of the techniques is the best fit for long gaps hours (l>19 hours). The data will be split into three missingness groups: 2.5%, 5%% and 10% within 24 hours.

Pertanika J. Sci. & Technol. 29 (4): 3099 - 3112 (2021)3102
Zuraira Libasin, Wan Suhailah Wan Mohamed Fauzi, Ahmad Zia ul-Saufie, Nur Azimah Idris and Noor Azizah Mazeni
Simulation of Missing Data
Once the data is divided into three missingness groups: 2.5%, 5% and 10%, it is ready to be served for simulations. The data will be used to compare four single imputation techniques. For 24 hours, in each per cent of missingness, the data will be grouped into a different level of complexity where it is divided by hour’s gaps (length, l). There are the short gaps, consist of (l<3 hours), medium gaps (4 hours<l<18 hours) and long gaps (l>19 hours). It serves as a purpose that shows the different hour gaps will have different best imputation techniques. However, mainly, the real purpose is to know the best fit technique for long gaps hours. Figure 2 illustrates the simulation process steps in general (Sukatis et al., 2019).
Figure 1. The percentage of PM10 missing value from 2002 to 2016
Figure 2. The steps of the simulation process in general
Pertanika J. Sci. & Technol. 29 (4): 3099 - 3112 (2021) 3103
Evaluation of Single Imputation for Incomplete PM10 Data
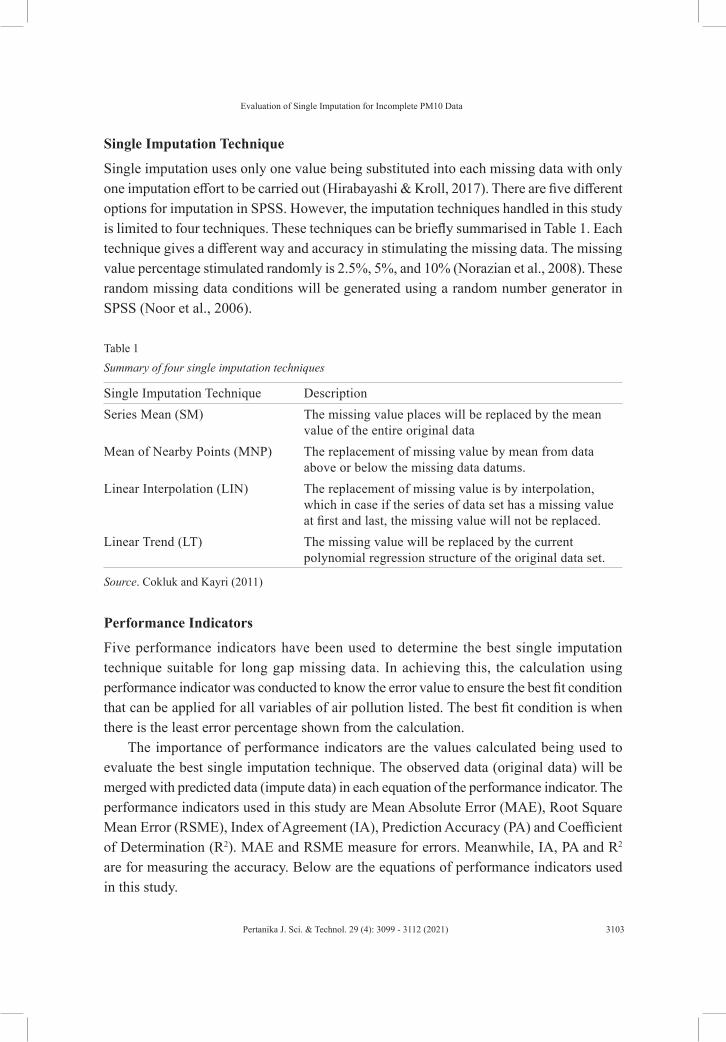
Single Imputation Technique
Single imputation uses only one value being substituted into each missing data with only one imputation effort to be carried out (Hirabayashi & Kroll, 2017). There are five different options for imputation in SPSS. However, the imputation techniques handled in this study is limited to four techniques. These techniques can be briefly summarised in Table 1. Each technique gives a different way and accuracy in stimulating the missing data. The missing value percentage stimulated randomly is 2.5%, 5%, and 10% (Norazian et al., 2008). These random missing data conditions will be generated using a random number generator in SPSS (Noor et al., 2006).
Table 1Summary of four single imputation techniques
Single Imputation Technique DescriptionSeries Mean (SM) The missing value places will be replaced by the mean
value of the entire original dataMean of Nearby Points (MNP) The replacement of missing value by mean from data
above or below the missing data datums.Linear Interpolation (LIN) The replacement of missing value is by interpolation,
which in case if the series of data set has a missing value at first and last, the missing value will not be replaced.
Linear Trend (LT) The missing value will be replaced by the current polynomial regression structure of the original data set.
Performance Indicators
Five performance indicators have been used to determine the best single imputation technique suitable for long gap missing data. In achieving this, the calculation using performance indicator was conducted to know the error value to ensure the best fit condition that can be applied for all variables of air pollution listed. The best fit condition is when there is the least error percentage shown from the calculation.
The importance of performance indicators are the values calculated being used to evaluate the best single imputation technique. The observed data (original data) will be merged with predicted data (impute data) in each equation of the performance indicator. The performance indicators used in this study are Mean Absolute Error (MAE), Root Square Mean Error (RSME), Index of Agreement (IA), Prediction Accuracy (PA) and Coefficient of Determination (R2). MAE and RSME measure for errors. Meanwhile, IA, PA and R2 are for measuring the accuracy. Below are the equations of performance indicators used in this study.
Source. Cokluk and Kayri (2011)
Pertanika J. Sci. & Technol. 29 (4): 3099 - 3112 (2021)3104
Zuraira Libasin, Wan Suhailah Wan Mohamed Fauzi, Ahmad Zia ul-Saufie, Nur Azimah Idris and Noor Azizah Mazeni
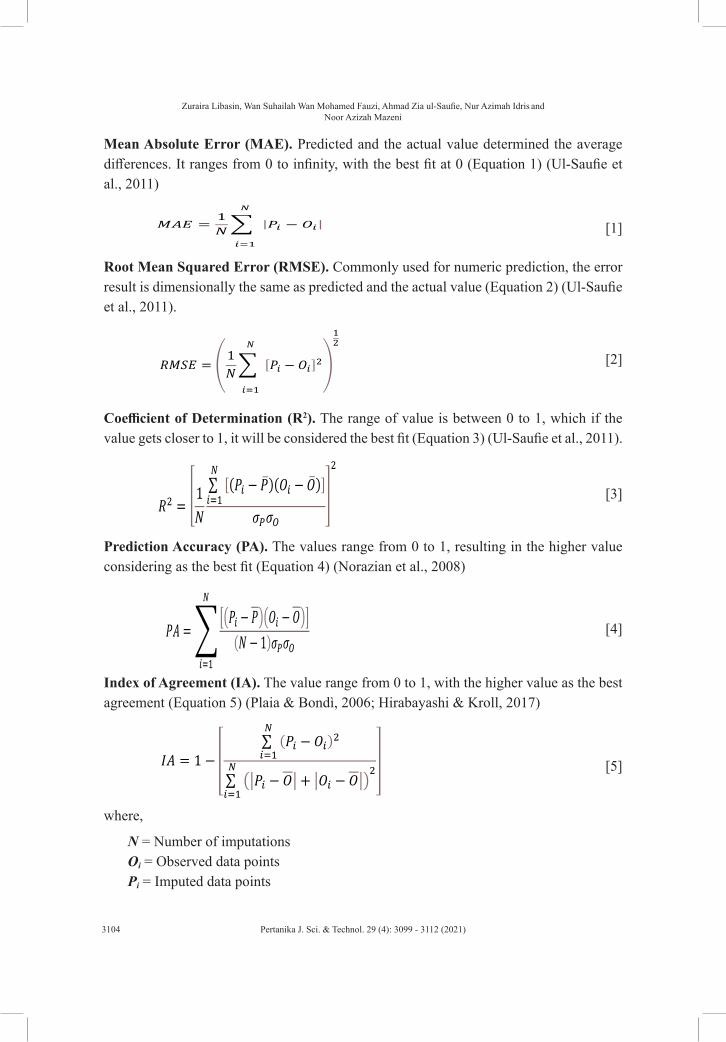
Mean Absolute Error (MAE). Predicted and the actual value determined the average differences. It ranges from 0 to infinity, with the best fit at 0 (Equation 1) (Ul-Saufie et al., 2011)
[1]
Root Mean Squared Error (RMSE). Commonly used for numeric prediction, the error result is dimensionally the same as predicted and the actual value (Equation 2) (Ul-Saufie et al., 2011).
[2]
Coefficient of Determination (R2). The range of value is between 0 to 1, which if the value gets closer to 1, it will be considered the best fit (Equation 3) (Ul-Saufie et al., 2011).
[3]
Prediction Accuracy (PA). The values range from 0 to 1, resulting in the higher value considering as the best fit (Equation 4) (Norazian et al., 2008)
[4]
Index of Agreement (IA). The value range from 0 to 1, with the higher value as the best agreement (Equation 5) (Plaia & Bondì, 2006; Hirabayashi & Kroll, 2017)
[5]
where,
N = Number of imputationsOi = Observed data pointsPi = Imputed data points

Pertanika J. Sci. & Technol. 29 (4): 3099 - 3112 (2021) 3105
Evaluation of Single Imputation for Incomplete PM10 Data
= Average of imputed data = Average of observed data = Population standard deviation of the imputed data= Population standard deviation of the observed data
RESULTS AND DISCUSSION
Figure 3 below shows the cases of missing values on particulate matter (PM10) in 2005 from Tanjung Malim station, which has the most extended tail. The evidence can be related to the DoE statement, which said that the haze episode in August 2005 could be considered a severe case.
The concern involved the whole part of Klang Valley, which Air Pollution Index (API) reached about 500 on August 11. A few days later, the haze shifts to Malaysia’s northern states, causing the unhealthy API reading for northern states (Latif et al., 2018).
Figure 3. Distribution of particulate matter (PM10) for the entire year from 2002 to 2016
Pertanika J. Sci. & Technol. 29 (4): 3099 - 3112 (2021)3106
Zuraira Libasin, Wan Suhailah Wan Mohamed Fauzi, Ahmad Zia ul-Saufie, Nur Azimah Idris and Noor Azizah Mazeni
An Evaluation of Single Imputation Technique by Gap Length
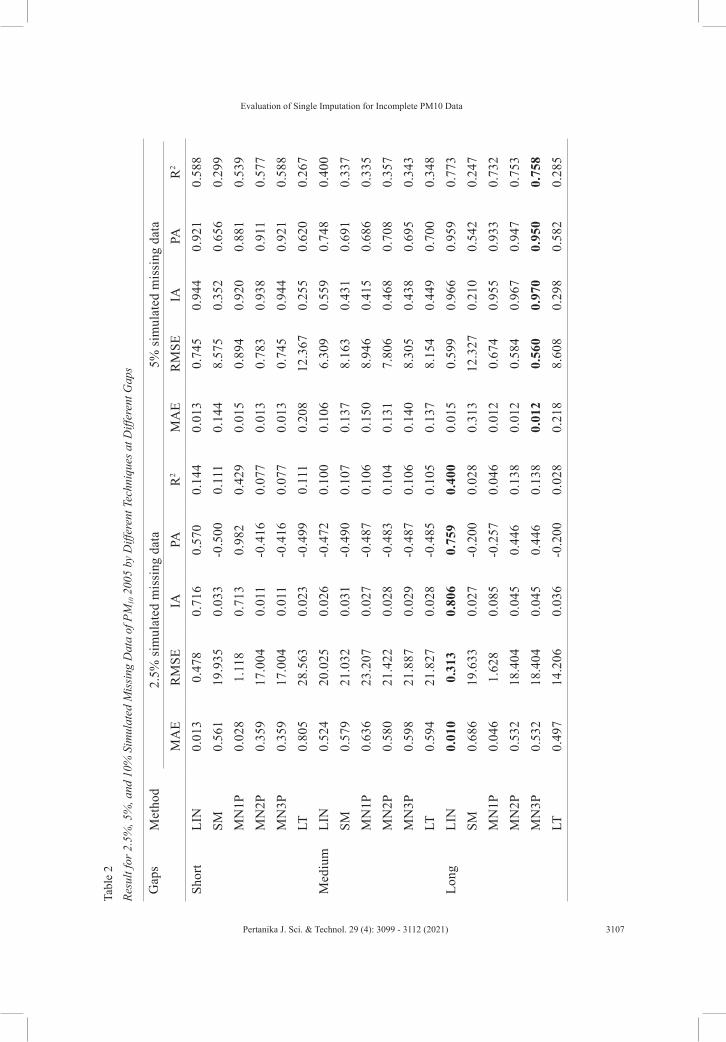
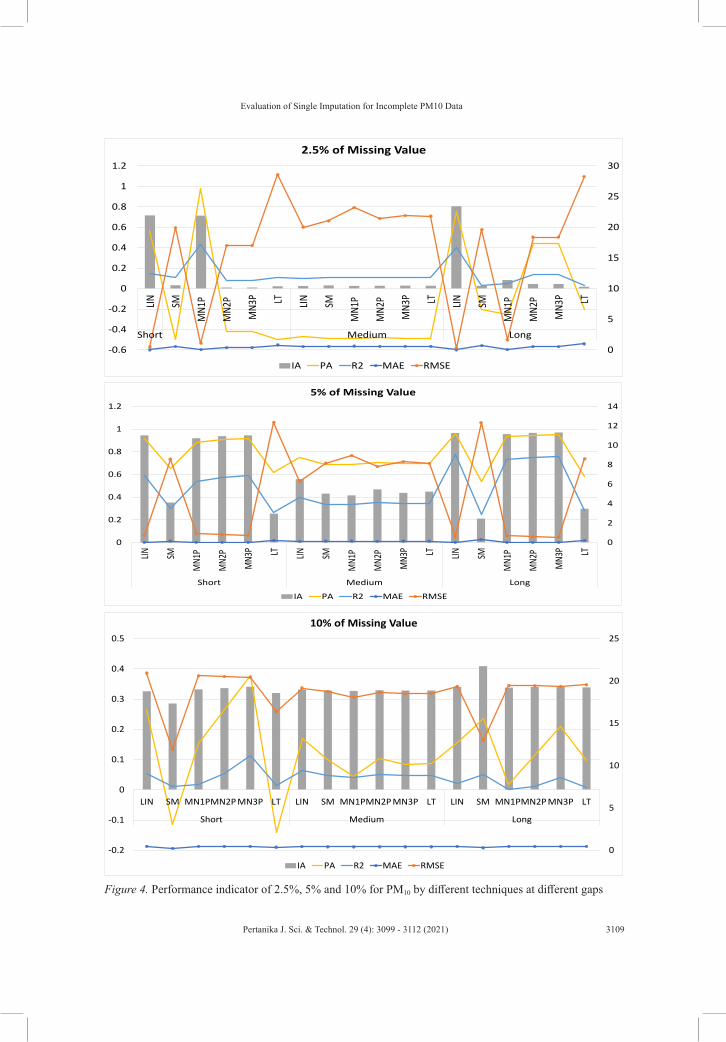
Data set from 2005 being simulated using SPSS by dividing it into three different per cent of missingness which is 2.5, 5 and 10. Each degree of percentage missingness simplifies into three different levels of complexity: short gap, medium gap, and long gap. Each gap being tested using four different single imputation techniques of techniques results in the finding, as shown in Table 2 and Figure 4.
From 2.5% missing value, at the short gap, the discovery of the best technique lies on Mean Nearby One Point, which has a slightly lower value of performance error of 0.028 and 1.118 depending on MAE and RSME compared to linear interpolation technique. However, it also needs to correlate with the performance accuracy, which the previous
technique has the highest value of PA of 0.981, indicated it is the best technique. Next, for the medium gap, the better technique that can be applied lies on Mean Nearby One Point, although, at the beginning of the early gap hours, the technique tends to be on Linear Interpolation. Finally, as for the long gap, the best fit technique falls on Linear Interpolation, with the lowest value of 0.009 of MAE and the highest value of 0.805 of IA in performance accuracy.
From the 5% missing value, at the short gap, the better techniques are Linear Interpolation and Mean Nearby Three Points, which have the same findings of 0.012 MAE and 0.944 IA. Therefore, it can be relatively said that the predicted data readings for both techniques from these gaps are almost the same. Next, for medium gaps, it also suggested Linear Interpolation and Mean Nearby Three Points as a better fit. Finally, as for the long gap, the best technique found is Mean Nearby Three-Point which has 0.559 RSME and 0.969 IA.
On the other hand, from the 10% missing value at the short gap, the Series Mean has a lower performance error which consists of 0.213 MAE and 11.907 RSME. However, the technique does not make accuracy since the performance accuracy is much better in Mean Nearby Three Points with an R2 of 0.113. Next, for medium gaps, it also suggested that the Series Mean technique is a better fit. Finally, as for the long gap, the best technique found is Series Mean which has RMSE and IA of 13.005 and 0.409, respectively. This result has shown how close the results in RSME for predicting the missing value at the stated hours’ gaps.
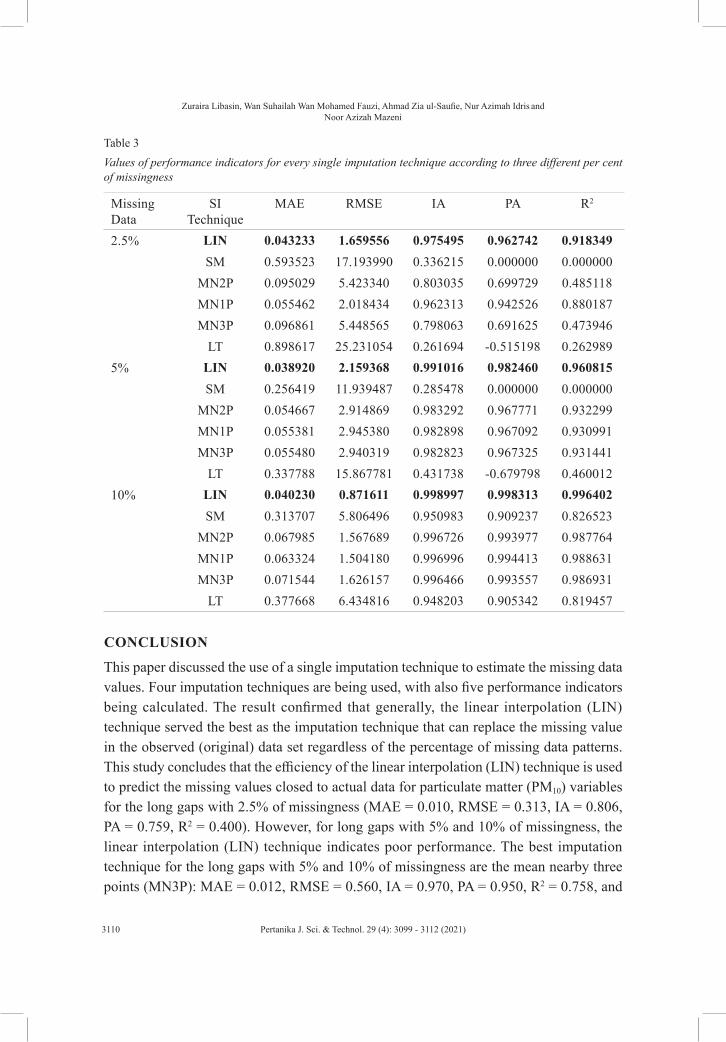
Table 3 shows the results for three patterns of missing data, each with their performance measuring performance error (MAE and RSME) and performance accuracy (IA, PA and R2). At 2.5% missing data, linear interpolation technique rules out others technique as it has the lowest reading of performance error (MAE = 0.043233, RSME = 1.659556) and highest performance accuracy (IA = 0.975495, PA = 0.962742, R2 = 0.918349). Next, at 5% missing data, it also showed that linear imputation technique fit best with (MAE = 0.038920, RSME = 2.159368) and (IA = 0.991016, PA = 0.982460, R2 = 0.960815). Finally,
Pertanika J. Sci. & Technol. 29 (4): 3099 - 3112 (2021) 3107
Evaluation of Single Imputation for Incomplete PM10 Data
Gap
sM
etho
d2.
5% si
mul
ated
mis
sing
dat
a5%
sim
ulat
ed m
issi
ng d
ata
MA
ER
MSE
IAPA
R2
MA
ER
MSE
IAPA
R2
Shor
tLI
N0.
013
0.47
80.
716
0.57
00.
144
0.01
30.
745
0.94
40.
921
0.58
8SM
0.56
119
.935
0.03
3-0
.500
0.11
10.
144
8.57
50.
352
0.65
60.
299
MN
1P
0.02
81.
118
0.71
30.
982
0.42
90.
015
0.89
40.
920
0.88
10.
539
MN
2P
0.35
917
.004
0.01
1-0
.416
0.07
70.
013
0.78
30.
938
0.91
10.
577
MN
3P0.
359
17.0
040.
011
-0.4
160.
077
0.01
30.
745
0.94
40.
921
0.58
8LT
0.80
528
.563
0.02
3-0
.499
0.11
10.
208
12.3
670.
255
0.62
00.
267
Med
ium
LIN
0.52
420
.025
0.02
6-0
.472
0.10
00.
106
6.30
90.
559
0.74
80.
400
SM0.
579
21.0
320.
031
-0.4
900.
107
0.13
78.
163
0.43
10.
691
0.33
7M
N1P
0.
636
23.2
070.
027
-0.4
870.
106
0.15
08.
946
0.41
50.
686
0.33
5M
N2P
0.
580
21.4
220.
028
-0.4
830.
104
0.13
17.
806
0.46
80.
708
0.35
7M
N3P
0.59
821
.887
0.02
9-0
.487
0.10
60.
140
8.30
50.
438
0.69
50.
343
LT0.
594
21.8
270.
028
-0.4
850.
105
0.13
78.
154
0.44
90.
700
0.34
8Lo
ngLI
N0.
010
0.31
30.
806
0.75
90.
400
0.01
50.
599
0.96
60.
959
0.77
3SM
0.68
619
.633
0.02
7-0
.200
0.02
80.
313
12.3
270.
210
0.54
20.
247
MN
1P
0.04
61.
628
0.08
5-0
.257
0.04
60.
012
0.67
40.
955
0.93
30.
732
MN
2P
0.53
218
.404
0.04
50.
446
0.13
80.
012
0.58
40.
967
0.94
70.
753
MN
3P0.
532
18.4
040.
045
0.44
60.
138
0.01
20.
560
0.97
00.
950
0.75
8LT
0.49
714
.206
0.03
6-0
.200
0.02
80.
218
8.60
80.
298
0.58
20.
285
Tabl
e 2
Resu
lt fo
r 2.5
%, 5
%, a
nd 1
0% S
imul
ated
Mis
sing
Dat
a of
PM
10 2
005
by D
iffer
ent T
echn
ique
s at D
iffer
ent G
aps
Pertanika J. Sci. & Technol. 29 (4): 3099 - 3112 (2021)3108
Zuraira Libasin, Wan Suhailah Wan Mohamed Fauzi, Ahmad Zia ul-Saufie, Nur Azimah Idris and Noor Azizah Mazeni
Table 2 (Continued)
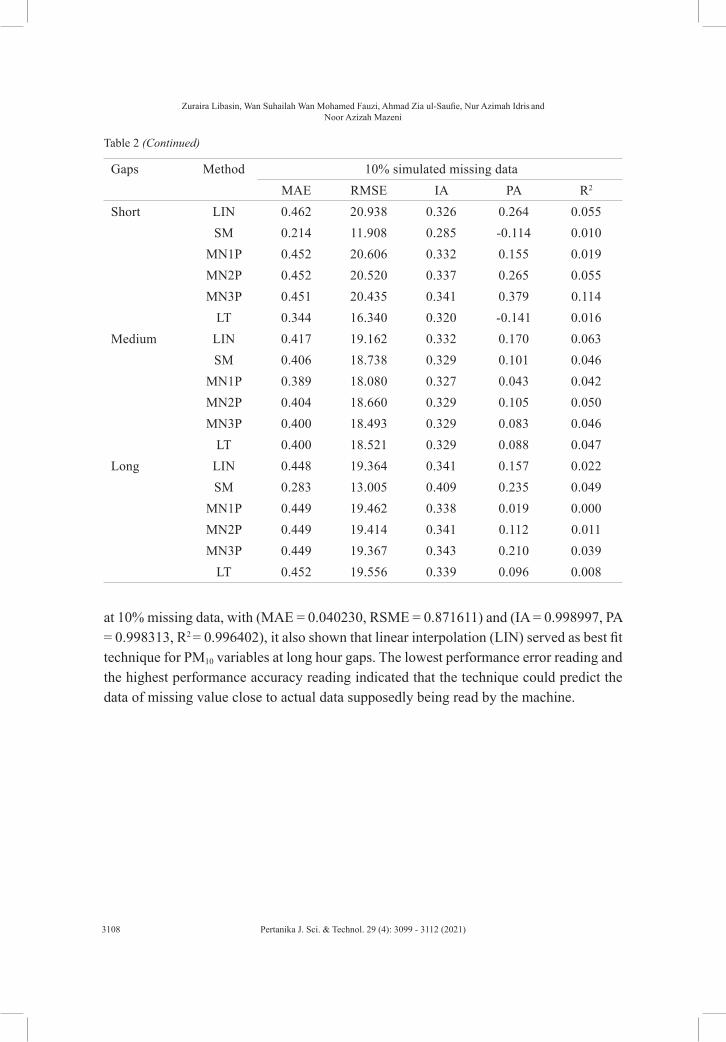
Gaps Method 10% simulated missing dataMAE RMSE IA PA R2
Short LIN 0.462 20.938 0.326 0.264 0.055SM 0.214 11.908 0.285 -0.114 0.010
MN1P 0.452 20.606 0.332 0.155 0.019MN2P 0.452 20.520 0.337 0.265 0.055MN3P 0.451 20.435 0.341 0.379 0.114
LT 0.344 16.340 0.320 -0.141 0.016Medium LIN 0.417 19.162 0.332 0.170 0.063
SM 0.406 18.738 0.329 0.101 0.046MN1P 0.389 18.080 0.327 0.043 0.042MN2P 0.404 18.660 0.329 0.105 0.050MN3P 0.400 18.493 0.329 0.083 0.046
LT 0.400 18.521 0.329 0.088 0.047Long LIN 0.448 19.364 0.341 0.157 0.022
SM 0.283 13.005 0.409 0.235 0.049MN1P 0.449 19.462 0.338 0.019 0.000MN2P 0.449 19.414 0.341 0.112 0.011MN3P 0.449 19.367 0.343 0.210 0.039
LT 0.452 19.556 0.339 0.096 0.008
at 10% missing data, with (MAE = 0.040230, RSME = 0.871611) and (IA = 0.998997, PA = 0.998313, R2 = 0.996402), it also shown that linear interpolation (LIN) served as best fit technique for PM10 variables at long hour gaps. The lowest performance error reading and the highest performance accuracy reading indicated that the technique could predict the data of missing value close to actual data supposedly being read by the machine.
Pertanika J. Sci. & Technol. 29 (4): 3099 - 3112 (2021) 3109
Evaluation of Single Imputation for Incomplete PM10 Data
0
5
10
15
20
25
-0.2
-0.1
0
0.1
0.2
0.3
0.4
0.5
LIN SM MN1PMN2P MN3P LT LIN SM MN1PMN2P MN3P LT LIN SM MN1PMN2P MN3P LT
Short Medium Long
10% of Missing Value
IA PA R2 MAE RMSE
Figure 4. Performance indicator of 2.5%, 5% and 10% for PM10 by different techniques at different gaps
0
2
4
6
8
10
12
14
0
0.2
0.4
0.6
0.8
1
1.2
LIN SM
MN1
P
MN2
P
MN3
P LT LIN SM
MN1
P
MN2
P
MN3
P LT LIN SM
MN1
P
MN2
P
MN3
P LTShort Medium Long
5% of Missing Value
IA PA R2 MAE RMSE
0
5
10
15
20
25
30
-0.6
-0.4
-0.2
0
0.2
0.4
0.6
0.8
1
1.2
LIN SM
MN1
P
MN2
P
MN3
P LT LIN SM
MN1
P
MN2
P
MN3
P LT LIN SM
MN1
P
MN2
P
MN3
P LT
Short Medium Long
2.5% of Missing Value
IA PA R2 MAE RMSE
Pertanika J. Sci. & Technol. 29 (4): 3099 - 3112 (2021)3110
Zuraira Libasin, Wan Suhailah Wan Mohamed Fauzi, Ahmad Zia ul-Saufie, Nur Azimah Idris and Noor Azizah Mazeni
CONCLUSION
This paper discussed the use of a single imputation technique to estimate the missing data values. Four imputation techniques are being used, with also five performance indicators being calculated. The result confirmed that generally, the linear interpolation (LIN) technique served the best as the imputation technique that can replace the missing value in the observed (original) data set regardless of the percentage of missing data patterns. This study concludes that the efficiency of the linear interpolation (LIN) technique is used to predict the missing values closed to actual data for particulate matter (PM10) variables for the long gaps with 2.5% of missingness (MAE = 0.010, RMSE = 0.313, IA = 0.806, PA = 0.759, R2 = 0.400). However, for long gaps with 5% and 10% of missingness, the linear interpolation (LIN) technique indicates poor performance. The best imputation technique for the long gaps with 5% and 10% of missingness are the mean nearby three points (MN3P): MAE = 0.012, RMSE = 0.560, IA = 0.970, PA = 0.950, R2 = 0.758, and
Table 3Values of performance indicators for every single imputation technique according to three different per cent of missingness
Missing Data
SI Technique
MAE RMSE IA PA R2
2.5% LIN 0.043233 1.659556 0.975495 0.962742 0.918349SM 0.593523 17.193990 0.336215 0.000000 0.000000
MN2P 0.095029 5.423340 0.803035 0.699729 0.485118 MN1P 0.055462 2.018434 0.962313 0.942526 0.880187MN3P 0.096861 5.448565 0.798063 0.691625 0.473946
LT 0.898617 25.231054 0.261694 -0.515198 0.2629895% LIN 0.038920 2.159368 0.991016 0.982460 0.960815
SM 0.256419 11.939487 0.285478 0.000000 0.000000MN2P 0.054667 2.914869 0.983292 0.967771 0.932299MN1P 0.055381 2.945380 0.982898 0.967092 0.930991 MN3P 0.055480 2.940319 0.982823 0.967325 0.931441
LT 0.337788 15.867781 0.431738 -0.679798 0.460012 10% LIN 0.040230 0.871611 0.998997 0.998313 0.996402
SM 0.313707 5.806496 0.950983 0.909237 0.826523 MN2P 0.067985 1.567689 0.996726 0.993977 0.987764MN1P 0.063324 1.504180 0.996996 0.994413 0.988631MN3P 0.071544 1.626157 0.996466 0.993557 0.986931
LT 0.377668 6.434816 0.948203 0.905342 0.819457

Pertanika J. Sci. & Technol. 29 (4): 3099 - 3112 (2021) 3111
Evaluation of Single Imputation for Incomplete PM10 Data
series mean (SM): MAE = 0.283, RMSE = 13.005, IA = 0.409, PA = 0.235, R2 = 0.049, respectively.
Simulation results for this research demonstrate that the linear interpolation (LIN) technique produces the lowest performance error and is most accurate compared to other techniques for 2.5%, 5% and 10% of missingness without being separated into different gaps. Therefore, it is to be believed that when dealing with another data set for PM10, the result produced will still be the same, which consists of the lowest MAE and RSME. It is also noticeable that the IA, PA and R2 values approach to digit one, which is the best-fit conditions for performance accuracy. It proves the result obtained in the research by Norazian et al. (2008) that the linear interpolation (LIN) technique gives the best estimates for the 10%, 15%, and 25% missing values to the annual hourly monitoring records for PM10 in Seberang Perai, Penang, Malaysia.
However, further research needs to be done since this research’s limitation is the stated techniques of imputations already implemented in SPSS and are used vastly by previous researchers. Nevertheless, all in all, it can be said that if further experiment needs to be conducted, the Linear Interpolation technique is still the best among four available techniques in SPSS based on the experiment results.
Since this simulation only focuses on the PM10 variable, it cannot be said the techniques are valid to be used for other pollutants variables such as SO2, CO2, CO, and O3. However, in other previous literature from previous researchers, the result from different techniques apart from what is being programmed in SPSS already achieved success with some work limitations. In a nutshell, further study should be conducted for the other variables to determine the actual value for missing data to determine whether the different variables may affect this experiment results.
ACKNOWLEDGEMENT
The research was funded by 600-IRMI/FRGS 5/3 (289/2019). Thank you to the Faculty of Computer and Mathematical Sciences, Universiti Teknologi MARA, for their support and thanks to the Department of Environment Malaysia for providing air quality monitoring data.
REFERENCESAli, S., & Dacey, S. (2017). Technical review: performance of existing imputation methods for missing data
in SVM ensemble creation. International Journal of Data Mining & Knowledge Management Process (IJDKP), 7(6), 75-91. https://doi.org/10.5121/ijdkp.2017.7606
Anh, N. T. N., Kim, S. H., Yang, H. J., & Kim, S. H. (2011). Hidden dynamic learning for long-interval consecutive missing values reconstruction in EEG time series. In 2011 IEEE International Conference on Granular Computing (pp. 653-658). IEEE Publishing. https://doi.org 10.1109/grc.2011.6122674

Pertanika J. Sci. & Technol. 29 (4): 3099 - 3112 (2021)3112
Zuraira Libasin, Wan Suhailah Wan Mohamed Fauzi, Ahmad Zia ul-Saufie, Nur Azimah Idris and Noor Azizah Mazeni
Cokluk, O., & Kayri, M. (2011). The effects of methods of imputation for missing values on the validity and reliability of scales. Educational Sciences: Theory and Practice, 11(1), 303-309.
De Leeuw, J., & Meijer, E. (2008). Introduction to multilevel analysis. In Handbook of multilevel analysis (pp. 1-75). Springer. https://doi.org/10.1007/978-0-387-73186-5_1
Department of Environment. (2018). Malaysia environmental quality report 2018. DoE Publication.
Hirabayashi, S., & Kroll, C. N. (2017). Single imputation method of missing air quality data for i-tree eco analyses in the conterminous United States. Retrieved January 1, 2021, from https://www.itreetools.org/documents/51/Single_imputation_method_of_missing_air_quality_data_for_i-Tree_Eco_analyses_in_the_conterminous_United_States.pdf
Latif, M. T., Othman, M., Idris, N., Juneng, L., Abdullah, A. M., Hamzah, W. P., Khan, M. F., Sulaiman, N. M. N., Jewaratnam, J., Aghamohammadi, N., Sahani, M., Xiang, C. J., Ahamad, F., Amil, N., Darus, M., Varkkey, H., Tangang, F., & Jaafar, A. B. (2018). Impact of regional haze towards air quality in Malaysia: A review. Atmospheric Environment, 177, 28-44. https://doi.org/10.1016/j.atmosenv.2018.01.002
Little, R. J., & Rubin, D. B. (2019). Statistical analysis with missing data (Vol. 793). John Wiley & Sons.
Noor, N. M., Yahaya, A. S., Ramli, N. A., & Abdullah, M. M. A. (2006). The replacement of missing values of continuous air pollution monitoring data using mean top bottom imputation technique. Journal of Engineering Research & Education, 3, 96-105.
Norazian, M. N., Shukri, Y. A., & Azam, R. N. (2008). Estimation of missing values in air pollution data using single imputation techniques. ScienceAsia, 34(3), 341-345. http://doi.org/10.2306/scienceasia1513-1874.2008.34.341
Plaia, A., & Bondi, A. L. (2006). Single imputation method of missing values in environmental pollution data sets. Atmospheric Environment, 40(38), 7316-7330. https://doi.org/10.1016/j.atmosenv.2006.06.040
Sukatis, F. F., Noor, N. M., Zakaria, N. A., Ul-Saufie, A. Z., & Suwardi, A. (2019). Estimation of missing values in air pollution dataset by using various imputation methods. International Journal of Conservation Science, 10(4), 791-804
Ul-Saufie, A. Z., Yahya, A. S., Ramli, N. A., & Hamid, H. A. (2011). Comparison between multiple linear regression and feed forward back propagation neural network models for predicting PM10 concentration level based on gaseous and meteorological parameters. International Journal of Applied, 1(4), 42-49.
Ward, N. (2019). Air pollution. Retrieved January 1, 2021, from https://prezi.com/wyokg7n0uuru/air-pollution/
Zainudin, M. L., & Noor, N. M. (2009, June 20-22). The single interpolation and statistical technique: A review of application in air quality data sets. In Proceedings of Malaysian Technical Universities Conference on Engineering and Technology (MUCEET2009) (pp. 1-4). Pahang, Malaysia