Embed Size (px)
Citation preview

9th International Conference on Fracture Mechanics of Concrete and Concrete Structures
FraMCoS-9 V. Saouma, J. Bolander and E. Landis(Eds)
1
Lo
ad
Displacement (mm)
Shear strength
Flexural strength
Monotonic loading
A
Cyclic loading
Figure 1: Shear failure after yielding of tension
reinforcing bar.
EVALUATION OF SHEAR STREGNTH DEGRADATION OF RC COLUMN
SUBJECTED TO CYCLIC LOADING
LI FU*, HIKARU NAKAMURA
*, HIROKI FURUHASHI
*, YOSHIHITO YAMAMOTO
*
AND TAITO MIURA*
*Nagoya University
Civil and Environmental Engineering, Nagoya, Japan
e-mail: [email protected]
Key words: Shear failure after yielding, Shear strength degradation, 3-D RBSM, Cyclic loading
Abstract: When a reinforced concrete (RC) member is subjected to cyclic loading, the shear
failure after flexural yielding of tension reinforcing bars (called as shear failure after flexural
yielding in this study) is often observed at a small deformation, although it ordinarily suffers
flexural failure and shows good deformation ability under monotonic loading. This study presented
a numerical method to quantitatively evaluate shear strength degradation of RC member utilizing
three dimensional Rigid-Body-Spring-Model (3-D RBSM). The behaviors of a RC column
subjected to cyclic loading and repeated loading on one side were simulated by 3-D RBSM, and the
behaviors of shear strength degradations were quantitatively evaluated. As a consequence, the
different degradation rate of shear strength between cyclic loading and repeated loading on one side
was clarified, and the reasonability of the numerical method was confirmed by comparing
numerical shear strength degradation curve with previously statistically proposed degradation
curves based on the test results.
1 INTRODUCTION
In the seismic design for a RC member, one
of the basic requirements is that brittle shear
failure should be prevented and the shear
strength exceeds the shear demand
corresponding to the flexural strength [1, 2, 3].
Although a good designed RC member under
monotonic loading ordinarily suffers flexural
failure and shows good deformation
performance, if it is subjected to cyclic loading,
the load carrying capacity often decreases at
smaller deformation after the flexural yielding
of tension reinforcing bars and ultimately
shear failure occurs. Since the deformation
ability of RC member is significant in seismic
deformation-based design, many researchers
have investigated the influences of several
factors such as web reinforcement ratio,
tension reinforcement ratio, axial load and
shear span-to-depth ratio on the ultimate
deformation ductility of RC member by
numerical and experimental studies [4, 5, 6, 7,
8].
DOI 10.21012/FC9.070
Li Fu, Hikaru Nakamura, Hiroki Furuhashi, Yoshihito Yamamoto and Taito Miura
2
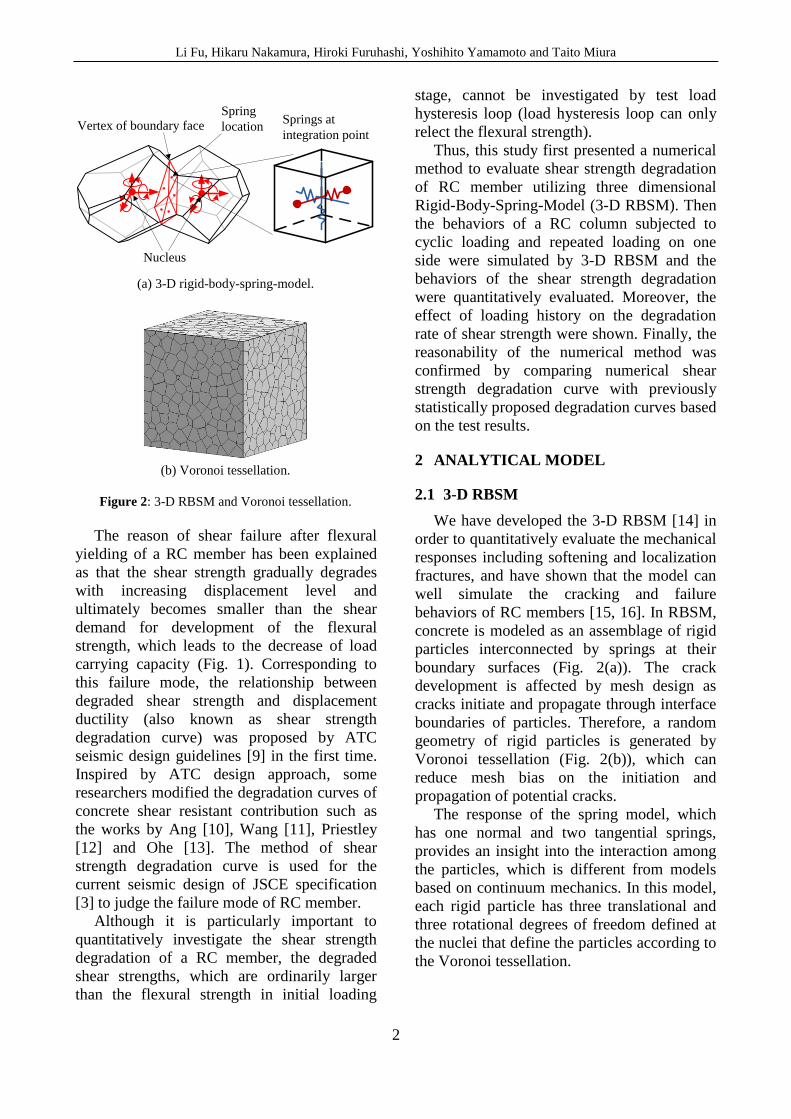
Vertex of boundary face
Nucleus
Spring
locationSprings at
integration point
(a) 3-D rigid-body-spring-model.
(b) Voronoi tessellation.
Figure 2: 3-D RBSM and Voronoi tessellation.
The reason of shear failure after flexural
yielding of a RC member has been explained
as that the shear strength gradually degrades
with increasing displacement level and
ultimately becomes smaller than the shear
demand for development of the flexural
strength, which leads to the decrease of load
carrying capacity (Fig. 1). Corresponding to
this failure mode, the relationship between
degraded shear strength and displacement
ductility (also known as shear strength
degradation curve) was proposed by ATC
seismic design guidelines [9] in the first time.
Inspired by ATC design approach, some
researchers modified the degradation curves of
concrete shear resistant contribution such as
the works by Ang [10], Wang [11], Priestley
[12] and Ohe [13]. The method of shear
strength degradation curve is used for the
current seismic design of JSCE specification
[3] to judge the failure mode of RC member.
Although it is particularly important to
quantitatively investigate the shear strength
degradation of a RC member, the degraded
shear strengths, which are ordinarily larger
than the flexural strength in initial loading
stage, cannot be investigated by test load
hysteresis loop (load hysteresis loop can only
relect the flexural strength).
Thus, this study first presented a numerical
method to evaluate shear strength degradation
of RC member utilizing three dimensional
Rigid-Body-Spring-Model (3-D RBSM). Then
the behaviors of a RC column subjected to
cyclic loading and repeated loading on one
side were simulated by 3-D RBSM and the
behaviors of the shear strength degradation
were quantitatively evaluated. Moreover, the
effect of loading history on the degradation
rate of shear strength were shown. Finally, the
reasonability of the numerical method was
confirmed by comparing numerical shear
strength degradation curve with previously
statistically proposed degradation curves based
on the test results.
2 ANALYTICAL MODEL
2.1 3-D RBSM
We have developed the 3-D RBSM [14] in
order to quantitatively evaluate the mechanical
responses including softening and localization
fractures, and have shown that the model can
well simulate the cracking and failure
behaviors of RC members [15, 16]. In RBSM,
concrete is modeled as an assemblage of rigid
particles interconnected by springs at their
boundary surfaces (Fig. 2(a)). The crack
development is affected by mesh design as
cracks initiate and propagate through interface
boundaries of particles. Therefore, a random
geometry of rigid particles is generated by
Voronoi tessellation (Fig. 2(b)), which can
reduce mesh bias on the initiation and
propagation of potential cracks.
The response of the spring model, which
has one normal and two tangential springs,
provides an insight into the interaction among
the particles, which is different from models
based on continuum mechanics. In this model,
each rigid particle has three translational and
three rotational degrees of freedom defined at
the nuclei that define the particles according to
the Voronoi tessellation.

Li Fu, Hikaru Nakamura, Hiroki Furuhashi, Yoshihito Yamamoto and Taito Miura
3
σ
ε0.02fc
’ *
12
34
56
7
8
9 10
(a) Normal spring.
12
3
4,14
5
67
89 10
11
12
1315
16
17
γ
τ
(b) shear spring (σ=constant).
Figure 3: Hysteresis of stress-strain relationship.
Beam element
Zero-size link
Reinforcement
direction
Figure 4: Reinforcing bar element arrangement.
τ
ss2s1
1
2
310
45
6
7
8 9 11
τmax
-0.1τmaxS1=0.2mm
S2=0.4mm
0.1τmax
-τmax
Figure 5: Bond stress-slip relationship.
2.2 Concrete material model
The constitutive models for tension,
compression and shear springs used in 3-D
RBSM are constructed by uniaxial
relationships. The details of the models and the
related model parameters for monotonic
loading analysis have been described in the
research conducted by Yamamoto [14].
Moreover, by using the same model
parameters, the models for cyclic loading
analysis containing unloading and reloading
paths, which regards the models for monotonic
loading as the envelop curve, were developed
[16].
Fig. 3(a) shows the typical hysteresis loop
of the normal spring for cyclic loading. The
unloading paths in the tension zone pass
toward the point of stress σ=-0.02 fc’* (fc’* is
the nominal concrete compressive strength) on
the compression loading path. The reloading
paths in the tension zone pass toward the start
point of the unloading. The stiffness of the
unloading in the compression zone is the
initial elastic modulus E.
Fig. 3(b) shows the typical hysteresis loop
of the shear spring. The stiffness of the
unloading and reloading is the initial elastic
modulus G. In addition, after the stress reaches
zero on the unloading path, the stress keeps
zero until the strain reaches the residual strain
of the opposite sign.
2.3 Reinforcing bar and bond models
Reinforcing bar is modeled as a series of
regular beam elements (Fig. 4) that can
simulate the bending effects. In this model, the
reinforcement can be freely positioned within
the member, regardless of the mesh design of
concrete [17]. At each beam node, two
translational and one rotational degrees of
freedom are defined by means of the springs.
The reinforcement is attached to the concrete
particles by zero-size link elements, which
provide a load-transfer mechanism between a
concrete particle and a beam node. A bi-linear
model is assumed for the stress-stain relation
of reinforcement. Crack development is
strongly affected by the bond interaction
between concrete and reinforcement of linked

Li Fu, Hikaru Nakamura, Hiroki Furuhashi, Yoshihito Yamamoto and Taito Miura
4
400
N
P
800
3200
1000 1650
Φ9D19
D19
300 400
50
50
Unit: mm
(a) Specimen outline.
400
1000 1400 250
Loading plate element
(b) Numerical model.
Figure 6: Specimen outline and numerical model.
0 10 20 30 40 50 600
100
200
300
400
Displacement (mm)
Load
(kN
)
Analysis of repeated loading on one sideTest of repeated loading on one side
Figure 7: Load-displacement relationship of repeated
loading on one side analysis.
-60 -40 -20 0 20 40 60-300
-200
-100
0
100
200
300
Displacement (mm)
Cyclic load analysisCyclic load test
Lo
ad (
kN
)
Figure 8: Load-displacement relationship of cyclic
loading analysis.
element. After yielding of reinforcement, the
hardening coefficient is assumed as 1/100. Fig.
5 shows the bond-stress relation. Up to the
shear strength τmax, the relation proposed by
Suga [18] is applied and the relation proposed
by CEB-FIB [19] is used for the post peak
behavior. As the typical hysteresis loop, the
stiffness of reloading and unloading is the
initial secant stiffness of the ±0.1τmax stress
points. After the stress reaches the level of
±0.1τmax on the unloading paths, the stress
keeps this level until the slip reaches the
residual slip of the opposite sign.
3 SIMULATION OF SHEAR FAILURE
AFTER FLEXURAL YIELDING OF
TENSION REBAR OF A RC COLUMN
In this chapter, the numerical result of shear
failure after flexural yielding of a RC column
simulated by 3-D RBSM was discussed [20].
3.1 Numerical model
The 3-D RBSM analyses of cyclic loading
and repeated loading on one side of the RC
column tested by Oota [21] were conducted
and it was confirmed that the analyses can
accurately simulate the deformation behaviors
until failure. The details of the objective RC
column are shown in Fig. 6(a). The footing
and the column were 1000mm and 1650mm in
height, respectively. And the column had a
cross section of 800mm×400mm with an
effective depth of 350mm. The loading plate
was 1400mm high from the column base,
namely the shear span-to-effective depth ratio
was 4.0. Sixteen longitudinal reinforcing bars
of D19 type were arranged with a concrete
cover thickness of 50mm (tension
reinforcement ratio: 0.82%). The stirrups of
Φ9 type were arranged with a space of 200mm
in shear span (web reinforcement ratio: 0.08%).

Li Fu, Hikaru Nakamura, Hiroki Furuhashi, Yoshihito Yamamoto and Taito Miura
5
(a) Deformation behavior at +1δy.
(b) Deformation behavior at +2δy.
(c) Deformation behavior at +3δy.
(d) Deformation condition at +4δy.
-10.0Mpa0.0
(e) Axial compressive stress distribution at +4δy.
Figure 9: Deformation behaviors and axial compressive
stress distribution (repeated loading on one side).
The yield strengths of longitudinal reinforcing
bars and stirrups were 365.5Mpa and
372.2Mpa, respectively, and the compressive
strength of concrete was 28.6Mpa. Shear load
(P) was imposed by displacement control and
the peak displacement of cyclic loading and
repeated loading on one side were increased
stepwise with the increment of yield
displacement (δy), which was around 10mm
(each displacement level was repeatedly
loaded ten loops). In addition, during the shear
loading a1Mpa axial load (N) was applied to
the top of the column.
As a result of the test, under cyclic loading,
the load carrying capacity of the column
decreased at the displacement level of -4δy as
shear failure after flexural yielding occurred;
under repeated loading on one side, however,
the original load carrying capacity could be
maintained until the displacement level of +8δy.
In order to reduce computing time, one-
quarter model (cross section: 200mm×400mm)
of the RC column was constructed (Fig. 6(b)),
and the average element size of concrete rigid
particles was 30mm, which was recommended
by Yamamoto [14]. And the reinforcing bars
were modeled by beam and zero-link elements
discretely. The footing area was fixed by three
plates (rigid prism) and the axial load was
applied to the plate on the top of the column.
By controlling displacement, cyclic loading or
repeated loading on one side was imposed on
the shear loading plates (1400mm from footing
column interface). Moreover, as the test load
hysteresis under ten loops of repeated loading
overlapped virtually, in 3-D RBSM analysis,
one load loop will be simulated for each
displacement level.
3.2 Analytical result
Fig. 7 illustrates the load-displacement
relationships for repeated loading on one side
(test and 3-D RBSM analysis). Since one-
quarter model was applied, the numerical load
in this study has been magnified four times the
original output. Consequently, the analytical
curve agreed well with the experimental result,
where the RC column could maintain the
original load carrying capacity until the
deformation of +5δy.
Fig. 8 shows the load-displacement
relationships for cyclic loading (test and 3-D
RBSM analysis) and it was observed that the
spindled shape of load-displacement curves at
initial load stage changed to inverse S-shape
with the increase of displacement level, which
signified a development of shear deformation,
and the load carrying capacities decreased with
a high rate at the deformation of -4δy.
The numerical deformation behaviors
(deformation was magnified eight times the
original output in this study) for each
displacement level and the axial compressive

Li Fu, Hikaru Nakamura, Hiroki Furuhashi, Yoshihito Yamamoto and Taito Miura
6
(a) Deformation behavior at +1δy.
(b) Deformation behavior at +2δy.
(c) Deformation behavior at +3δy.
(d) Deformation behavior at +4δy.
-10.0Mpa0.0
(e) Axial compressive stress distribution at +4δy.
Figure 10: Deformation behaviors and axial
compressive stress distribution (cyclic loading).
stress distribution in the column central section
(at the deformation of +4δy) of repeated
loading on one side are illustrated in Fig. 9. It
was observed that the flexural cracks first
initiated near the footing-column joint at the
initial deformation of +1δy (Fig. 9(a)). Then,
the flexural cracks propagated toward the
compression zone and the crack widths
became larger with the increase of
displacement level (Fig. 9(b), (c), (d)). At the
deformation of +4δy, the localization of
compressive stress due to bending was
confirmed (Fig. 9(e)), which indicated that
bending deformation was dominant to the
behavior of RC column under repeated loading
on one side.
Fig. 10 gives the numerical deformation
behaviors and the axial compressive stress
distribution for cyclic loading. Until the
deformation of +2δy, same flexural crack
propagation as that under repeated loading on
one side was observed (Fig. 10(a), (b)). At the
displacement of +3δy, however, shear
deformation became notable, that is, diagonal
shear cracks generated at footing-column joint
(Fig. 10(c)), which was different from that
under repeated loading on one side (Fig. 9(c)).
After that, the shear deformation rapidly
developed and became remarkable, which
resulted in the shear failure of the RC column
at the displacement of +4δy (Fig. 10(d)).
Moreover, as shown in Fig. 10(e), it was noted
that the compressive stress intensively
distributed along the diagonal shear cracks at
the displacement of +4δy, which indicated that
the shear deformation behavior became
dominant at the ultimate stage.
Based on the above numerical result, it was
confirmed that 3-D RBSM cannot only
accurately simulate the bending deformation
under repeated loading on one side but also the
deformation transformation from bending to
shear due to cyclic loading of a RC member.
4 EVALUATION OF SHEAR
STRENGTH DEGRADATION
4.1 Evaluation approach of shear strength
degradation
The reason of shear failure after flexural
yielding of a RC member under cyclic loading
has been explained as that the shear strength
gradually degrades and ultimately becomes
smaller than the flexural strength with the
increase of displacement level. And it is
significant to seismic deformation-based
design to quantitatively evaluate the degraded
shear strengths after each load cycle.
Considering that the degraded shear strengths
cannot be directly investigated by test load
hysteresis as the test load carrying capacity
cannot exceed the flexural strength, in this
chapter, we proposed a numerical approach for
quantitative evaluation of shear strength

Li Fu, Hikaru Nakamura, Hiroki Furuhashi, Yoshihito Yamamoto and Taito Miura
7
Pu: flexural strength
Pu’: flexural strength
Vu: shear strength
A
Load
Dispalcement
fy: 365.5Mpa→900Mpa
Figure 11: Numerical approach for evaluation of the
degraded shear strength after first load cycle.
0 10 20 30 40 50 60 70 800
100
200
300
400
Displacement (mm)
Lo
ad (
kN
)
Monotonic (fy=365.5Mpa)Monotonic (fy=900Mpa) After first cycleAfter second cycle After third cycleAfter fourth cycle
Figure 12: Load-displacement relationships for
evaluation of the degraded shear strengths after each
load cycle (repeated loading on one side).
degradation by using 3-D RBSM.
The numerical approach for evaluation of
the degraded shear strength after first load
cycle (cyclic loading condition) of a RC
member will be described by Fig. 11. The
black load curve represents the load-
displacement relationship obtained by cyclic
loading analysis of a RC member and it is
obvious that the load carrying capacity cannot
exceed the flexural strength (Pu). Thereby, the
degraded shear strength (Vu) after first load
cycle, which is ordinarily larger than the
flexural strength (Pu), cannot be directly
investigated. Thus, an approach that makes the
flexural strength (Pu) larger than the original
shear strength (Vu) is desired for evaluation by
numerical load hysteresis. And this is noted
that can be achieved in 3-D RBSM analysis at
the end of the first load cycle (point A)
without affecting the degraded shear strength
(Vu) by the way increasing the yield stress of
longitudinal reinforcing bars, according to the
evaluation formulae of flexural and shear
strengths expressed by Eq. (1)-(4), utilized in
JSCE standard specification [3]. It was
apparent that the change of the yield stress of
longitudinal reinforcement only has influence
on the flexural strength, which can also be
acknowledged in other design guidelines [1].
Pu=fyAs(d-0.4x)/a (1)
Vu=Vc+Vs (2)
Vc=0.20fc’1/3ρt
1/3d-1/4(0.75+1.4/(a/d))bwd (3)
Vs=Awfyw(sinα+cosα) (4)
Where, the term Pu is the flexural strength
under primary tension failure; the term fy is the
yield stress of longitudinal reinforcement; the
term d is the column effective depth; the term
x is the depth of the equivalent rectangular
stress block; the term a is the length of shear
span; the term Vu is the total shear strength; the
term Vc is the shear strength provided by
concrete contribution; the term Vs is the shear
resistance sustained by web reinforcement; the
term fc’ is the nominal concrete compression
strength; the term ρt is the tension
reinforcement ratio; the term bw is the column
width; the term Aw is the area of a set of web
reinforcement; the term fyw is the yield strength
of web reinforcement; the term α is the
diagonal crack angle to column’s axis.
In this study, the flexural strength (Pu) was
increased to an extremely larger level (Pu’)
than the original shear strength (Vu) at the end
of first load cycle (Fig. 11), and after that a
monotonic loading (dotted red curve) was
imposed to the RC column until shear failure.
The peak load obtained by the monotonic
loading was regarded as the degraded shear
strength after first load cycle. Similarly, the
degraded shear strengths after each load cycle
were further investigated, which allows an

Li Fu, Hikaru Nakamura, Hiroki Furuhashi, Yoshihito Yamamoto and Taito Miura
8
0 10 20 30 40 50 600
100
200
300
400
Displacement (mm)
Lo
ad (
kN
)
Monotonic (fy=365.5Mpa)Monotonic (fy=900Mpa) After first cycleAfter second cycle After third cycleAfter fourth cycle
Figure 13: Load-displacement relationships for
evaluation of the degraded shear strengths after each
load cycle (cyclic loading).
0 1 2 3 4 5 60
0.2
0.4
0.6
0.8
1
1.2
Ductility ratio μ
Red
uct
ion
co
effi
cien
t α
PriestleyOhe・YoshikawaJSCE standard specificationCyclic loadingRepeated loading on one side
Figure 14: Shear strength degradation curves.
evaluation of the relationship between
degraded shear strength and displacement
level.
4.2 Result of degraded shear strengths
after each load cycle
Based on the proposed numerical approach,
the 3-D RBSM analyses for evaluation of the
degraded shear strengths after each load cycle
of repeated loading on one side and cyclic
loading were carried out. The yield stresses of
longitudinal reinforcing bars were increased
from the original 365.5Mpa to 900Mpa at the
end of a certain load cycle in order to obtain an
extremely large flexural strength.
The analytical load-displacement curves
locating in the first quadrant for evaluation of
the degraded shear strengths of repeated
loading on one side and cyclic loading are
plotted in Fig. 12 and Fig. 13, respectively. In
addition, the load-displacement curves of the
monotonic loading analysis with large rebar
yield stress (fy=900Mpa) (for reference of the
original shear strength) and the monotonic
loading analysis with normal rebar yield stress
(fy=365.5Mpa) (for reference of the flexural
strength) are also illustrated. The peak loads
after each load cycle were marked, which were
regarded as the degraded shear strengths (the
load at the displacement of 60mm was
regarded as the peak load for the case after
fourth load cycle of cyclic loading).
As a consequence, for the shear strength
degradation due to repeated loading on one
side (Fig. 12), it was noted that the shear
strength degraded with the increasing number
of load cycles but it was still larger than the
flexural strength (after fourth load cycle),
thereby the load carrying capacity could be
maintained by the RC column (Fig. 7); for the
shear strength degradation due to cyclic
loading (Fig. 13), it was found that the shear
strength decreased with a much larger rate
than that under repeated loading on one side
with the increasing number of load cycles, and
it significantly decreased and became much
smaller than the flexural strength after fourth
load cycle, thereby the load carrying capacity
of the RC column was reduced (Fig. 8).
It was apparent that based on the proposed
numerical approach the different behaviors of
shear strength degradation under repeated
loading on one side and cyclic loading could
be quantitatively evaluated.
4.3 Evaluation of shear strength
degradation curves
Many researches [3, 12, 13] have proposed
shear strength degradation curves of RC
member under cyclic loading based on the
statistical process of test results (herein, the

Li Fu, Hikaru Nakamura, Hiroki Furuhashi, Yoshihito Yamamoto and Taito Miura
9
shear strength represented is the concrete shear
resistant contribution Vc), and they are plotted
in Fig. 14 (reduction coefficient α means the
ratio of the degraded concrete contribution to
the original strength obtained by monotonic
loading test).
Regarding the numerical evaluation of the
degraded concrete contributions of the RC
column used in this study, they were
calculated by subtracting the web
reinforcement contribution Vs from the
obtained degraded shear strengths calculated
in chapter 4.2. And the web reinforcement
contribution could be evaluated by the
difference of the shear strengths between the
RC columns with and without web
reinforcement by 3-D RBSM monotonic
loading analyses with large yield stress of
rebar.
By this way, the numerical degradation
curves of concrete contributions of repeated
loading on one side and cyclic loading of the
RC column were obtained (Fig. 14). As a
result, compared with the previous degradation
curves for design, which were summarized by
test results, it was noted that the numerical
degradation behavior under cyclic loading
presented the same trend and the degradation
rate with increasing deformation ductility was
slightly larger than the design curves proposed
by Priestley and Ohe · Yoshikawa. In addition,
the degradation rate of repeated loading on one
side was extremely slow, which was very
different from that under cyclic loading.
Based on the above result, it was clarified
that the proposed evaluation method by 3-D
RBSM for shear strength degradation of RC
member is applicable and helpful.
5 CONCLUSIONS
(1) The behaviors of repeated loading on
one side and cyclic loading tests for a RC
column were accurately simulated by 3-D
RBSM. Under cyclic loading, shear
deformation gradually became dominant and
ultimately shear failure after flexural yielding
of tension reinforcing bars occurred at small
deformation ductility, whereas bending
deformation was dominant to the behavior
under repeated loading on one side.
(2) The numerical method by 3-D RBSM
for quantitatively evaluation of shear strength
degradations due to cyclic loading and
repeated loading on one side was proposed.
(3) Based on the shear strength
degradations obtained by 3-D RBSM, it was
found that shear strength degraded rapidly
with increasing number of load cycles under
cyclic loading, whereas it was reduced slowly
under repeated loading on one side, thereby
shear failure occurred in cyclic loading.
(4) Comparing with the degradation curves
proposed by statistical process of test results,
the numerical degradation curve of cyclic
loading shows same trend, which proves the
applicability of the numerical method for
evaluation of shear strength degradation by 3-
D RBSM.
REFERENCES
[1] Building code requirements for structural
concrete and commentary, ACI 318-05,
and ACI 318R-11, American Concrete
Institute (ACI), Farmington Hills, 2011
[2] CEB model code for seismic design of
concrete structures, No. 165, 1985.
[3] Standard Specifications for Concrete-
Design. JSCE, 2012.
[4] Park, R.1982. Ductility of Square-Confined
Concrete Columns, ASCE ST4, Vol. 108,
No. 4: 929-950.
[5] Saatcioglu, M. 1991. Deform Ability of
Reinforced Concrete Columns, ACI Struct.
J., Vol. 127: 421-452.
[6] Panagiotakos, B., T. and Fardis, N., M.
2001. Deformations of Reinforced
Concrete Members at Yieldingand
Ultimate, ACI Struct. J., Vol. 98(2): 135-
148.
[7] Priestley, M. J. N.1981. Ductility of
Spirally-Confined Concrete Columns,
ASCE ST1, Vol. 107, No. 1: 181-202.
[8] Ishibashi, T., Nakayama, Y. and Tsuyoshi,
T. 2001. Failure Mode of Reinforced
Concrete Column without Hoop

Li Fu, Hikaru Nakamura, Hiroki Furuhashi, Yoshihito Yamamoto and Taito Miura
10
Reinforcement, Journal of JSCE, No. 676,
V-51: 13–18. (in Japanese)
[9] Seismic retrofitting guidelines for
highway bridges, Applied Technology
Council (ACT6-2), Redwood City, Calif.,
1983.
[10] Ang, B. G., Priestley, M. J. N. and Paulay,
T. 1989. Seismic Shear Strength of
Circular Reinforced Concrete Columns,
ACI Struct. J., 86(1), 45-59.
[11] Wong, Y. L., Paulay, T. and Priestley, M.
J. N. 1993. Response of Circular
Reinforced Concrete Columns to Multi-
directional Seismic Attack, ACI Struct. J.,
90(2), 45-59.
[12] Priestley, M. J. N., Seible, F. and Carvi, G.
M. 1996. Seismic Design of Retrofit of
Bridges, A Wiley-Interscience Publication.
[13] Ohe, R. and Yoshikawa, H. 2002. Study
on Shear Strength Degradation of Single
Reinforced Concrete Columns under
Repeated Large Deformation, Journal of
JSCE, No. 711, V-56: 59–71. (in
Japanese)
[14] Yamamoto, Y., Nakamura, H., Kuroda, I.
and Furuya, N. 2008. Analysis of
Compression Failure of Concrete by
Three Dimensional Rigid Body Spring
model, Journal of JSCE, Vol. 64: 612–
630. (in Japanese)
[15] Gedik, Y. H., Nakamura, H., Yamamoto,
Y., Kunieda, M. and Furuya, N. 2011.
Analysis of Compression Failure of
Concrete by Three Dimensional Rigid
Body Spring model, Cement & Concrete
Composites, Vol. 33: 978–991.
[16] Yamamoto, Y., Nakamura, H., Kuroda, I.
and Furuya, Nobuaki. 2014. Crack
Propagation Analysis of Reinforced
Concrete Wall under Cyclic Loading
Using RBSM, European Journal of
Environmental and Civil Engineering, Vol.
18(7-8): 780-792.
[17] Bolander, JE. and Hong, GS. 2002. Rigid-
Body-Spring Networks Modeling of
Prestressed Concrete Members, ACI
Struct. J., Vol. 99(5): 595-604.
[18] Suga, M., Nakamura, H., Higai, T. and
Saito, S. 2001. Effect of Bond Properties
on the Mechanical Behavior of RC Beam,
Proceedings of Japan Concrete Institute,
Vol. 23(3): 295-300. (in Japanese)
[19] Comite Euro-International du Beton. 1990.
CEB-FIB Model Code 1990 First Draft,
CEB, Paris.
[20] Nakamura, H., Furuhashi, H., Yamamoto,
Y. and Miura, T. 2014. Evaluation of
Shear Strength Degradation of RC
Member Subjected to Cyclic Loading,
Journal of JSCE, Vol. 71, No. 1: 48–57.
(in Japanese)
[21] Ohta, M. 1979. An Experimental Study
on the Behavior of Reinforced Concrete
Bridge Piers under Cyclic Loadings.
Journal of JSCE, No. 292: 65–74. (in
Japanese)