Embed Size (px)
Citation preview

Page 1 of 289th Joint FAA/DoD/NASA 2006 Aging Aircraft Conference
March 6-9, 2006
EVALUATION OF RISK AND POSSIBLE MITIGATION SCHEMES FORPREVIOUSLY UNIDENTIFIED HAZARDS
William Linzey, Micah McCutchan, and Michael TraskosLectromechanical Design Company
Richard Gilbrech, Ph.D.NASA Langley Research Center
Robert CherneyOrbital Sciences Corporation
George SlenskiWright Patterson Air Force Base
Walter Thomas IIINASA Goddard Space Flight Center
Preface
In April 2004, the NASA Engineering and Safety Center (NESC) was commissioned byNASA’s Chief Safety and Mission Assurance (S&MA) Officer to review and render a technical opinion on theprobability of a catastrophic failure related to this scenario: The Space Shuttle Program (SSP) recognizeda zero-fault-tolerant design related to an inadvertent firing of the primary reaction control system (RCS)jets on the Orbiter during mated operations with the International Space Station (ISS). It was determinedthat an un-commanded firing of an RCS jet could cause serious damage or loss of both the SSP Orbiterand the ISS. Several scenarios were suggested in which an un-commanded firing of the RCS jet ispossible [1]. These scenarios include an arc track event in the 28-volt heater circuits that could result in awire-to-wire short to the adjacent reaction control jet wire. In this worst-case scenario, enough currentand power could be applied to activate the reaction control jet valves and fire a thruster. The followingreport summarizes the work that was sponsored by the NESC as part of their assessment of the Orbiterinadvertent firing of a RCS thruster while attached to the ISS [2].
IntroductionBackground
During the life cycle of an aircraft or spacecraft, new information and performance data change (and eveninvalidate) engineering assumptions that were made during the initial design and development of aplatform. This information can affect many aspects of ownership including the validity of any previoussafety analyses. In some cases, a new failure mode may be postulated, found to be a significant threat, andappropriate mitigation techniques developed and deployed to reduce the newly discovered threat to anacceptable level. Where necessary, laboratory evaluation may be needed to acquire data to evaluate newrisks, solutions, and advance a technical way forward. The development of mitigation techniques toprevent un-commanded firing of the Space Shuttle’s primary RCS jets is an example of such a process.

Page 2 of 289th Joint FAA/DoD/NASA 2006 Aging Aircraft Conference
March 6-9, 2006
This report presents the results of arc track testing conducted to determine if such a transfer of power toun-energized wires is possible and/or likely during an arcing event, and to evaluate an array of protectionschemes that may significantly reduce the possibility of such a transfer. The results of these experimentsmay be useful for determining the level of protection necessary to guard against spurious voltage andcurrent being applied to safety critical circuits.
It was not the purpose of these experiments to determine the probability of the initiation of an arc trackevent ― only if an initiation did occur could it cause the undesired event: an inadvertent thruster firing.The primary wire insulation used in the Orbiter is aromatic polyimide, or Kapton®, a construction knownto arc track under certain conditions [3]. Previous Boeing testing has shown that arc tracks can initiate inaromatic polyimide insulated 28 volts direct current (VDC) power circuits using more realistic techniquessuch as chafing with an aluminum blade (simulating the corner of an avionics box or lip of a wire tray), orvibration of an aluminum plate against a wire bundle [4]. Therefore, an arc initiation technique waschosen that provided a reliable and consistent technique of starting the arc and not a realistic simulation ofa scenario on the vehicle. Once an arc is initiated, the current, power and propagation characteristics ofthe arc depend on the power source, wire gauge and insulation type, circuit protection and seriesresistance rather than type of initiation. The initiation method employed for these tests was applying anoil and graphite mixture to the ends of a powered twisted pair wire.
The flight configuration of the heater circuits, the fuel/oxider (or ox) wire, and the RCS jet solenoid weremodeled in the test configuration so that the behavior of these components during an arcing event couldbe studied. To determine if coil activation would occur with various protection wire schemes, 145 testswere conducted using various fuel/ox wire alternatives (shielded and unshielded) and/or differentcombinations of polytetrafuloroethylene (PTFE), Mystik® tape and convoluted wraps to preventunwanted coil activation.
Test results were evaluated along with other pertinent data and information to develop a mitigationstrategy for an inadvertent RCS firing. The SSP evaluated civilian aircraft wiring failures to search foraging trends in assessing the wire-short hazard. Appendix 2 applies Weibull statistical methods to thesame data with a similar purpose.
Experimental DetailTest Specimen Configuration and Experimental Setup
Twenty-nine different configurations were tested, with five tests per configuration for a total of 145 tests.All test configurations consisted of heater wires and a set of fuel/ox wires. Heater circuits were made oftwisted pairs and fuel/ox wires were either two twisted pairs, one twisted quad, or two shielded twistedpairs, as shown in Figure 1. In all tests, the heater circuits and fuel/ox bundles were bundled together andan arc was initiated in the heater wire bundle. The arc was allowed to propagate down the length of thebundle and damage to the fuel/ox bundle was assessed.

Page 3 of 289th Joint FAA/DoD/NASA 2006 Aging Aircraft Conference
March 6-9, 2006
Figure 1. Fuel/Ox Wire Options
Within the set of 145 tests, there were subtle differences in the bundle configurations depending on thenumber of heater circuits, the type of fuel/ox wire, and the materials used to assemble and protect thebundle. These configurations were grouped into four distinct types, displayed in Figure 2. The applicationof the protection scheme changed both the size and weight for the fuel/ox bundles. Each protectionscheme had a unique impact on the size and weight of the wire bundle. The range of possibleconfigurations is shown in Figure 3.
The type of fuel/ox wire, protection schemes, and circuit protection for each group of five tests aresummarized in Table 1. Each protection scheme was applied according to Boeing Orbiter wire harnessassembly and installation specifications ML0303-0013D and ML0303-0014N. A description of thetwelve different protection schemes evaluated is provided in Appendix 1.

Page 4 of 289th Joint FAA/DoD/NASA 2006 Aging Aircraft Conference
March 6-9, 2006
Shield
GNDRTN
28 VDC
GNDRTN 28 VDC
GNDRTN
28 VDC
LacingCord
OXCOIL
OXRTN
Configuration 2: 3 Power CircuitsFuel/Ox Wires: 2 Shielded Twisted PairNo Protective Over Wrap
Configuration 3: 3 Power CircuitsFuel/Ox Wires: 2 Shielded Twisted Pair1 or 2 Layers of Protective Over wrap
OXCOIL
OXRTN
Shield
GNDRTN
28 VDC
GNDRTN 28 VDC
GNDRTN
28 VDC
1 or 2 Layersof ProtectiveOver wrap
LacingCord
GNDRTN
28 VDC
GNDRTN 28 VDC
28 VDC GNDRTN
OXCOIL
OXRTN
LacingCord
1 or 2 Layersof ProtectiveOver wrap
Configuration 4: 3 Power CircuitsFuel/Ox Wires: 2 Twisted pair1 or 2 Layers of Protective Over wrap
GNDRTN
28 VDC OXCOIL
FUELCOIL
FUELRTN
OXRTN
Configuration 1: 1 Power CircuitFuel/Ox Wires: Twisted QuadNo Protective Over wrap
LacingCord
GNDRTN
28 VDC
FUELRTN
OXCOIL
FUELCOIL
OXRTN
28 VDC GNDRTN
GNDRTN
28 VDC
Fuel/Ox Wires: Twisted QuadNo Protective Over wrap
Configuration 1: 3 Power Circuits
LacingCord
FUELRTN
FUELCOIL
FUELRTN
FUELCOIL
FUELRTN
FUELCOIL
Figure 2. Cross-section of Protection Schemes and Heater Wire Circuits

Page 5 of 289th Joint FAA/DoD/NASA 2006 Aging Aircraft Conference
March 6-9, 2006
Figure 3. Composite Photo of Various Protection Configurations
Table 1. Test Configurations Evaluated
1st Layer(Bottom)
2nd Layer(Top)
N264 1-5 1 1 Twist Quad NA NA 15 A
N264 6-10 1 3 Twist Quad NA NA 15 A
N264 11-15 2 3 2 Sh/Tw/Pair NA NA 15 A
N264 16-20 3 3 2 Sh/Tw/Pair PTFE Wrap None 15 A
N264 21-25 3 3 2 Sh/Tw/Pair Mystik None 15 A
N264 26-30 3 3 2 Sh/Tw/Pair Convolute None 15 A
N264 31-35 3 3 2 Sh/Tw/Pair PTFE Wrap PTFE Wrap 15 A
N264 36-40 3 3 2 Sh/Tw/Pair PTFE Wrap Mystik 15 A
N264 41-45 3 3 2 Sh/Tw/Pair PTFE Wrap Convolute 15 A
N264 46-50 3 3 2 Sh/Tw/Pair Mystik PTFE Wrap 15 A
N264 51-55 3 3 2 Sh/Tw/Pair Mystik Mystik 15 A
N264 56-60 3 3 2 Sh/Tw/Pair Mystik Convolute 15 A
N264 61-65 3 3 2 Sh/Tw/Pair Convolute PTFE Wrap 15 A
N264 66-70 3 3 2 Sh/Tw/Pair Convolute Mystik 15 A
N264 71-75 3 3 2 Sh/Tw/Pair Convolute Convolute 15 A
N264 76-80 4 3 2 Tw/Pair PTFE Wrap None 15 A
N264 81-85 4 3 2 Tw/Pair Mystik None 15 A
N264 86-90 4 3 2 Tw/Pair Convolute None 15 A
N264 91-95 4 3 2 Tw/Pair PTFE Wrap PTFE Wrap 15 A
N264 96-100 4 3 2 Tw/Pair PTFE Wrap Mystik 15 A
N264 101-105 4 3 2 Tw/Pair PTFE Wrap Convolute 15 A
N264 106-110 4 3 2 Tw/Pair Mystik PTFE Wrap 15 A
N264 111-115 4 3 2 Tw/Pair Mystik Mystik 15 A
N264 116-120 4 3 2 Tw/Pair Mystik Convolute 15 A
N264 121-125 4 3 2 Tw/Pair Convolute PTFE Wrap 15 A
N264 126-130 4 3 2 Tw/Pair Convolute Mystik 15 A
N264 131-135 4 3 2 Tw/Pair Convolute Convolute 15 A
N264 136-140 1 1 Twist Quad NA NA 10 A
N264 141-145 1 3 Twist Quad NA NA 10 A
Protection Schemes CircuitProtection
(fuse rating)
HarnessConfig #
Test ## HeaterCircuits
Fuel/Ox Wire
ShieldedTwisted PairNo Protection
1 LayerPTFE Wrap
1 LayerMystik(3 wraps)
1 LayerConvolute
2 LayersPTFE Wrap
2 LayersMystik
2 LayersConvolute

Page 6 of 289th Joint FAA/DoD/NASA 2006 Aging Aircraft Conference
March 6-9, 2006
Each of the four harness configurations, displayed in Figures 4a through 4d, required a slightly differentexperimental setup. Differential voltage probes and current shunts are included at appropriate locations inthe circuits to capture useful information during the arcing event (Figures 4a through 4d). Data werecollected on a Nicolet Vision Datalogger at 1 kilosample (KS)/sec.
Coi
ls
ChAmp
ChAmp
25' of 20 awgtwisted pairCurrent Shunt
Current Shunt
Current Shunt
Current Shunt
VoltageMeasurement
VoltageMeasurement
Bundle
Heater Wire
Fuel/Ox Wire
15 Amp Fuse
VoltageMeasurement
28 VDC
Power On
Oil/GraphiteMixture
Accelerometers
Fuel/OxValves
Figure 4a. Harness Configuration 1: 1 Heater Circuit, Fuel/Ox = Unshielded Twisted Quad
Harness configuration 1 (Figure 4a) was the simplest configuration, with only one heater circuit. Thisconfiguration was used in Tests 1 through 5 with unprotected twisted quad for the fuel/ox wires. Thissetup corresponds to the configuration that exists in some locations on the Orbiter.
Ch1
Oil/GraphiteMixture
Bundle
Ch9
Ch8
Ch6
Ch7
ChargeAmp
ChargeAmp
Accelerometers
Fuel/OxValves
Coi
ls
25' of 20 AWGTwisted Pair
15 AmpFuses (3) Ch2
Ch10
Ch12
Ch3
Ch11
Ch13
Ch5
Ch4
Ch15
Ch16
Fuel/Ox: 1 Twisted Quad
Figure 4b. Harness Configuration 1: 3 Heater Circuits, Fuel/Ox = Unshielded Twisted Quad
Harness configuration 1 with three heater circuits (Figure 4b) was used in Tests 5 through 10 for theunprotected twisted quad. This series of tests represents the configuration that presently exists in somelocations on the Orbiter. Tests performed in this group determined whether the present Orbiterconfiguration would allow enough voltage and current to be transferred to the fuel/ox wires to cause coilactivation.

Page 7 of 289th Joint FAA/DoD/NASA 2006 Aging Aircraft Conference
March 6-9, 2006
Ch2
Ch10
Ch12
Ch3
Ch11
Ch13
Ch5
Ch1
Oil/GraphiteMixture
Ch4
Ch16
Ch15
15 AmpFuses (3)
Fuel/Ox: 2 Shielded Twisted Pairs
25' of 20 AWGTwisted Pair
Coi
ls
Fuel/OxValves
Accelerometers
ChargeAmp
ChargeAmp
Ch7
Ch6
Ch8
Ch9
Ch14
Bundle
Fuel/Ox Protection
Figure 4c. Harness Configurations 2 and 3: 3 Heater Circuits, Fuel/Ox = Shielded Twisted Pair
Harness configurations 2 and 3, with three heater circuits (Figure 4c), were used in Tests 11 through 75.This series of tests used two twisted shielded pairs for the fuel/ox wires, and included five tests for eachof the protection schemes identified in Table 2. Note that the purple box highlights the fuel/ox wires. Itshould be recognized that each twisted shielded pair had its own metal shield and that one shield does notprotect both twisted pairs of fuel/ox wire (see Figures 1 and 2).
Coi
ls
ChAmp
ChAmp
Ch2
Ch10
Ch12
Ch3
Ch11
Ch13
Ch5
Ch6
Ch7
Ch8
Ch9
Ch1
Bundle
Oil/GraphiteMixture
Fuel/Ox Protection
Configuration 4Fuel/Ox: 2 Twisted Pairs
15 AmpFuses (3)
Ch16
Ch15
Ch4
Figure 4d. Harness Configuration 4: 3 Heater Circuits, Fuel/Ox = 2 Unshielded Twisted Pairs
Harness configuration 4 (Figure 4d) was used in Tests 76 through 145. This configuration was essentiallythe same as configurations 2 and 3, with unshielded twisted pairs replacing the shielded twisted pairs forthe fuel/ox wires. This test series included five specimens for each of the protection schemes identified inTable 1.
Heater circuits were represented in the test configurations, but the actual heaters were not. On the Orbiter,the heater switching is located in the fuel/ox valve assembly. Therefore, even when the heaters are off, theheater wires are energized up to the switch at the valve. In this series of tests the heaters were simulated in

Page 8 of 289th Joint FAA/DoD/NASA 2006 Aging Aircraft Conference
March 6-9, 2006
the “off” position (open circuit). If the heaters had been included in the test circuit the heaters would have been in parallel with the arc. There would have been little effect on the arc except that the additionalheater current would cause the circuit protection to trip earlier limiting the damage.
The 25 feet of 20 American Wire Gage (AWG) (Figures 4a through 4d) wire was used to simulate anevent that may occur away from the power bus ― this represents the configuration on the Orbiter. Theresistance of the 25 feet of wire (~0.25 ohms in both the feeder and return) limits the power in the arc, butalso slows the speed that the arc travels and increases the time before the circuit protection (fuse) opens.The later two of these factors tend to increase the collateral damage caused by the arc. While theadditional resistance of the 25 feet of wire tends to stabilize the arc, too much resistance (wire) inhibitsthe arc.
Research into fuel/ox circuits indicated that the aft thrusters are protected, such that “a steady state load current of 15 amperes (amp) shall cause the fusible link to open” (Rockwell Procurement Specification MC477-0263, paragraph 3.4.5). Therefore, the 15 amp fuse was conservative since at this value, thecurrent would not cause the fuse to open. However, without more detailed information, the moreconservative protection was used. The forward reaction jet driver (RJD) uses smaller fuses. Therefore,additional tests using harness configuration 1 specimens were performed using 10 amp fuses as protectionfor the heater circuits.
Test Procedure
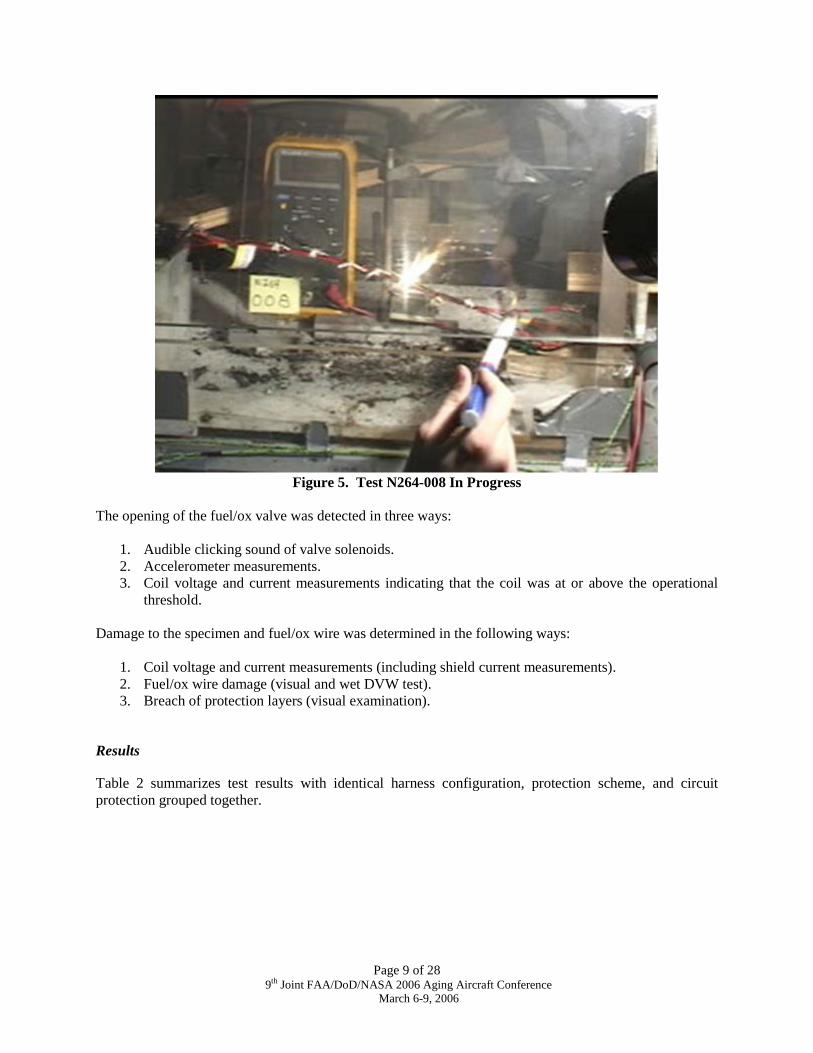
After all preliminary checks were performed, the heater circuits were energized and the oil/graphitemixture was used to initiate the arc. The arc was allowed to propagate the length of the sample. The arcevent tripped the circuit protection, self–extinguished the arc, or stopped when it reached the end of thesample. After the power was turned off, the specimen was removed from the testing chamber and all testinformation was recorded. A visual inspection of the sample gave preliminary indications of theeffectiveness of the protection scheme. For each sample, wet dielectric voltage withstand (DVW) test wasused to determine if the insulation of the fuel/ox wires was actually compromised. Figure 5 is a still shot(captured from video) of Test N264-008 in progress.
Page 9 of 289th Joint FAA/DoD/NASA 2006 Aging Aircraft Conference
March 6-9, 2006
Figure 5. Test N264-008 In Progress
The opening of the fuel/ox valve was detected in three ways:
1. Audible clicking sound of valve solenoids.2. Accelerometer measurements.3. Coil voltage and current measurements indicating that the coil was at or above the operational
threshold.
Damage to the specimen and fuel/ox wire was determined in the following ways:
1. Coil voltage and current measurements (including shield current measurements).2. Fuel/ox wire damage (visual and wet DVW test).3. Breach of protection layers (visual examination).
Results
Table 2 summarizes test results with identical harness configuration, protection scheme, and circuitprotection grouped together.

Page 10 of 289th Joint FAA/DoD/NASA 2006 Aging Aircraft Conference
March 6-9, 2006
Table 2. Test Results Summary Grouped by Experimental Conditions
The background color of the rows signifies the possibility of an arc track event causing the fuel/ox valveto open or caused damage to the fuel/ox wire according to the following:
• Red: It is likely that the fuel/ox valve would open due to an arc track event. This wouldnot be an unexpected event should an arc track occur.
• Yellow: It is unlikely that the fuel/ox valve would open due to an arc track event;however, significant damage to the fuel/ox wires could be expected.
• Green: It is very unlikely that the fuel/ox valve would open due to an arc track event. It isalso unlikely that significant damage to the fuel/ox wires could be expected.
The results columns provide the following information:
Audible Click, Valve Opened: When the fuel/ox valve opened and closed, a clicking sound could easilybe heard. This column records the number of tests in each group of 5 in which the valve opening/closingwas heard.
Accelerometer Activity: The accelerometers, placed on the valve solenoids, were used to “listen” for valve movement. The accelerometer records if movement was detected for any test in the group of 5.
1st Layer(Bottom)
2nd Layer(Top)
N264 1-5 1 1 Twist Quad NA NA 15 A 5/5 Yes 24 V / 2.1 A Yes NA
N264 6-10 1 3 Twist Quad NA NA 15 A 4/5 Yes 23 V / 2.0 A Yes NA
N264 136-140 1 1 Twist Quad NA NA 10 A 2/5 Yes 24.8 V / 2.1 A Yes NA
N264 141-145 1 3 Twist Quad NA NA 10 A 0/5 No 3.5 V/ 0.1 A Yes NA
N264 11-15 2 3 2 Sh/Tw/Pair NA NA 15 A 0/5 No 2.2 V / 0.2 A Yes NA
N264 16-20 3 3 2 Sh/Tw/Pair PTFE Wrap None 15 A 0/5 No < 1 V Slight 4/5
N264 21-25 3 3 2 Sh/Tw/Pair Mystik None 15 A 0/5 No < 1 V Slight* 2/5*N264 26-30 3 3 2 Sh/Tw/Pair Convolute None 15 A 0/5 No < 1 V No 2/5
N264 31-35 3 3 2 Sh/Tw/Pair PTFE Wrap PTFE Wrap 15 A 0/5 No < 1 V No 0/5
N264 36-40 3 3 2 Sh/Tw/Pair PTFE Wrap Mystik 15 A 0/5 No < 1 V No 0/5
N264 41-45 3 3 2 Sh/Tw/Pair PTFE Wrap Convolute 15 A 0/5 No < 1 V No 0/5
N264 46-50 3 3 2 Sh/Tw/Pair Mystik PTFE Wrap 15 A 0/5 No < 1 V No 1/5
N264 51-55 3 3 2 Sh/Tw/Pair Mystik Mystik 15 A 0/5 No < 1 V No 0/5
N264 56-60 3 3 2 Sh/Tw/Pair Mystik Convolute 15 A 0/5 No < 1 V No 0/5
N264 61-65 3 3 2 Sh/Tw/Pair Convolute PTFE Wrap 15 A 0/5 No < 1 V No 0/5
N264 66-70 3 3 2 Sh/Tw/Pair Convolute Mystik 15 A 0/5 No < 1 V No 0/5
N264 71-75 3 3 2 Sh/Tw/Pair Convolute Convolute 15 A 0/5 No < 1 V No 0/5
N264 76-80 4 3 2 Tw/Pair PTFE Wrap None 15 A 0/5 No < 1 V Yes 4/5
N264 81-85 4 3 2 Tw/Pair Mystik None 15 A 0/5 No < 1 V Slight 3/5
N264 86-90 4 3 2 Tw/Pair Convolute None 15 A 0/5 No < 1 V No 1/5
N264 91-95 4 3 2 Tw/Pair PTFE Wrap PTFE Wrap 15 A 0/5 No < 1 V No 0/5
N264 96-100 4 3 2 Tw/Pair PTFE Wrap Mystik 15 A 0/5 No < 1 V No 1/5
N264 101-105 4 3 2 Tw/Pair PTFE Wrap Convolute 15 A 0/5 No < 1 V No 0/5
N264 106-110 4 3 2 Tw/Pair Mystik PTFE Wrap 15 A 0/5** No** < 1 V** No 0/5
N264 111-115 4 3 2 Tw/Pair Mystik Mystik 15 A 0/5 No < 1 V No 0/5
N264 116-120 4 3 2 Tw/Pair Mystik Convolute 15 A 0/5 No < 1 V No 0/5
N264 121-125 4 3 2 Tw/Pair Convolute PTFE Wrap 15 A 0/5 No < 1 V No 0/5
N264 126-130 4 3 2 Tw/Pair Convolute Mystik 15 A 0/5 No < 1 V No 0/5
N264 131-135 4 3 2 Tw/Pair Convolute Convolute 15 A 0/5 No < 1 V No 0/5
Max CoilVolt/Current
Reading
CircuitProtection
(fuse rating)
* Specimen N264 – 021 had only 1 wrap of Mystik Tape instead of 3 called for in ML 0303-0014. This shield for this specimen failed the DVW where the shield for the other 4 specimen in this configuration did not.** Specimen N264 – 106: movement of sample during arc caused Fuel/Ox valve clip lead to touch the heater terminal block and the valve opened. However this was not due to arcing damage or power transferred by the arc. Note: The protection layers were not fullybreached.
Damage toFuel/OxWires
Breach of AllProtection
Layers
HarnessConfig #
Test ## HeaterCircuits
Fuel/Ox WireAccelero-
meter Activity
Audible Click,Valve
Opened
Protection Schemes

Page 11 of 289th Joint FAA/DoD/NASA 2006 Aging Aircraft Conference
March 6-9, 2006
Max Coil Volt/Current Reading: The column shows if there was any electrical activity in the fuel/oxwire even though it was not to an amplitude that opened the valve. If the valve did open at ambientpressure during the test, the current required to open the valve under flight pressure would be higher.These values were used to show that the valve would or would not have opened if it were pressurized.Note: Momentary spikes in voltage and current were not used to determine maximum values.
Damage to Fuel/Ox Wires: Damage indications were the wet DVW test and visual examination. Thecharacterization“Slight” only indicates superficial damage to the insulation.
Breach of All Protection Layers: Determined visually in post-test, this can be used to judge the merit ofa given protection scheme.
The considerations that led to the placement of the groups in the red, yellow or green categories followalong with examples of typical test data.
Red: Likely that the fuel/ox valve would open due to an arc track event
The Configuration 1 groups, with unprotected twisted quad fuel/ox wire, were the only ones placed in thiscategory. Eleven (11) of the 20 tests resulted in the fuel/ox valve opening. Table 3 shows data for theindividual tests. Both 1 and 3 heater circuit tests caused the valve to open. From this data, it is evident thatthe 15 amp fuses allowed the whole specimen to be damaged without opening while the 10-amp fuselimited the arc damage by opening before much damage could occur. In general, the 10-amp fuse wouldopen as soon as the arc entered the main bundle and reached a spot-tie. However, even with the 10 ampfuse limiting damage, it was still possible to have the fuel/ox valve open for durations up to one seconddue to the arc. While the 3 heater circuit 10 amp fuse group did not cause the fuel/ox valve to open in anyof the five tests, it was still placed in this category because of the damage caused to the fuel/ox wire.Also in Test 144, there was arcing directly to one of the coil return wires.
Note: Classical statistical analyses were performed on Tables 3 through 6. It was determinedthat they do support the trends shown in the tables.

Page 12 of 289th Joint FAA/DoD/NASA 2006 Aging Aircraft Conference
March 6-9, 2006
Table 3. Tests Results of the Unprotected Specimens
*The signals oscillated around zero and were most likely from electrical noise generated by the arcingevent.
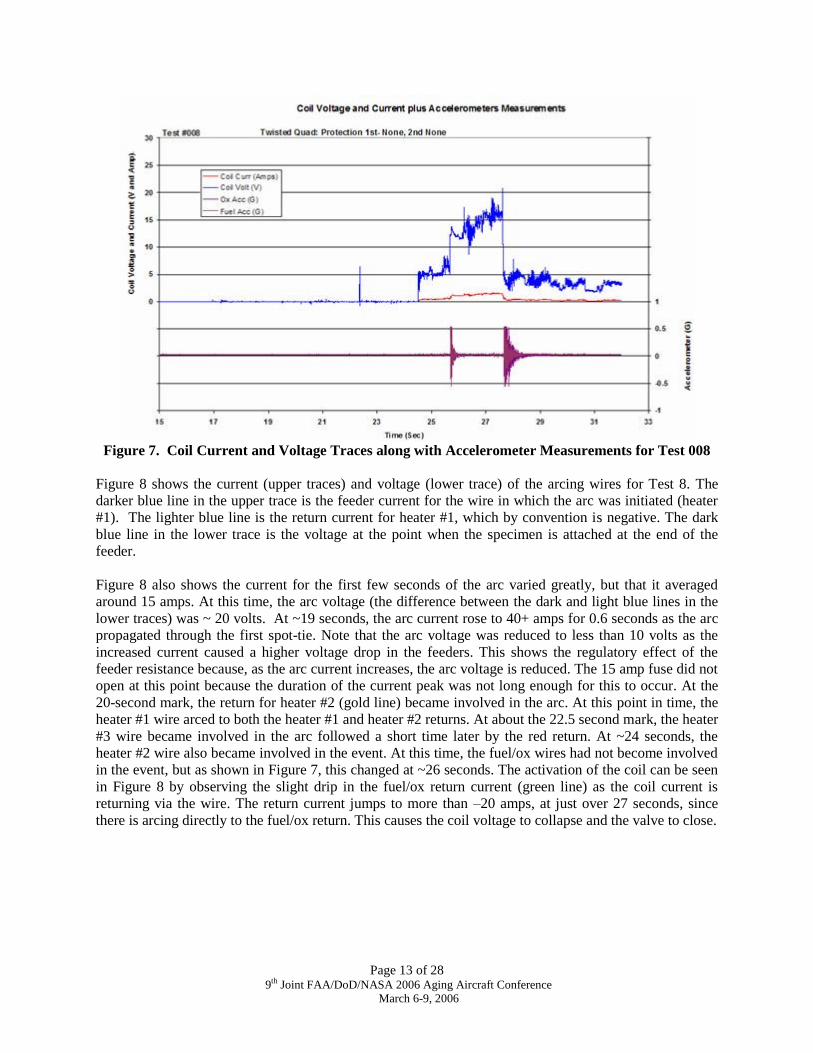
Figure 7 shows the coil voltage and current traces along with the accelerometer reading for Test 008 inwhich the fuel/ox valve opened. Just before the 26 second mark, ~5 volts (blue line) was measured acrossthe coil with an associated current, < 0.5 amps (red line), measured through the coil. This indicates thatthe insulation of the fuel/ox wire feeding the high side of the coil was compromised and there was arcingdirectly to the conductor of that wire. This arcing current returned to ground through the coil with theresistance of the coil (~11.5 ohms) limiting the current. At this voltage/current level the coil was notactivated, and the valve remained closed. After ~0.5 seconds the arcing produced a higher voltage acrossthe coil (~12 volts) and the coil activated. The valve opened as recorded by the accelerometers (violetline). Note that the second accelerometer also recorded the opening, but since the traces overlap, it cannotbe seen. The voltage across the coil rose to over 15 volts and then collapsed as the fuel/ox return wiresalso became directly involved in the arc. It was impossible to maintain a voltage across the coil (seediscussion of Figure 8 in the next paragraph). The accelerometers also recorded the closing of the valve atabout 28 seconds.
V AmpN264 - 001 15 A 1 Y 6 N 24 2.1 4.6N264 - 002 15 A 1 Y 6 N 18 1.4 1N264 - 003 15 A 1 Y 7 N 20 0.8 < .05N264 - 004 15 A 1 Y 6 N 14 1.1 0.8N264 - 005 15 A 1 Y 8 N 15 1.3 0.9N264 - 006 15 A 3 Y 8 N N N 22 1.9 2.2N264 - 007 15 A 3 Y 8 N N N 10 0.8 0.3N264 - 008 15 A 3 Y 9 N N N 15 1.4 2N264 - 009 15 A 3 Y 8 N N N 21 1.8 0.7N264 - 010 15 A 3 N 8 N N N 5 0.4 NAN264 - 136 10 A 1 Y 4 N 24 2.0 0.25N264 - 137 10 A 1 Y 2 Y 24 2.1 1N264 - 138 10 A 1 N 2 Y 0 0.0 NAN264 - 139 10 A 1 N 2 Y 15* 0.2* NAN264 - 140 10 A 1 N 1 Y 0 0.0 NAN264 - 141 10 A 3 N 1 Y N N 0 0.0 NAN264 - 142 10 A 3 N 1 Y N N 0 0.0 NAN264 - 143 10 A 3 N 1 Y N Y 0 0.0 NAN264 - 144 10 A 3 N 2 Y N N 3.5* 0.1* NAN264 - 145 10 A 3 N 1 Y Y Y 0 0.0 NA
H#2 H#3
DurationValve
Opened(sec)
FuseRating
Test #
Typical EnergizedCoil Voltage &
Current
# ofHeaterCircuits
ValveOpened?(AudibleClicking)
Len ofArc Dam(inchs).
Fuse Opened
H#1
Page 13 of 289th Joint FAA/DoD/NASA 2006 Aging Aircraft Conference
March 6-9, 2006
Figure 7. Coil Current and Voltage Traces along with Accelerometer Measurements for Test 008
Figure 8 shows the current (upper traces) and voltage (lower trace) of the arcing wires for Test 8. Thedarker blue line in the upper trace is the feeder current for the wire in which the arc was initiated (heater#1). The lighter blue line is the return current for heater #1, which by convention is negative. The darkblue line in the lower trace is the voltage at the point when the specimen is attached at the end of thefeeder.
Figure 8 also shows the current for the first few seconds of the arc varied greatly, but that it averagedaround 15 amps. At this time, the arc voltage (the difference between the dark and light blue lines in thelower traces) was ~ 20 volts. At ~19 seconds, the arc current rose to 40+ amps for 0.6 seconds as the arcpropagated through the first spot-tie. Note that the arc voltage was reduced to less than 10 volts as theincreased current caused a higher voltage drop in the feeders. This shows the regulatory effect of thefeeder resistance because, as the arc current increases, the arc voltage is reduced. The 15 amp fuse did notopen at this point because the duration of the current peak was not long enough for this to occur. At the20-second mark, the return for heater #2 (gold line) became involved in the arc. At this point in time, theheater #1 wire arced to both the heater #1 and heater #2 returns. At about the 22.5 second mark, the heater#3 wire became involved in the arc followed a short time later by the red return. At ~24 seconds, theheater #2 wire also became involved in the event. At this time, the fuel/ox wires had not become involvedin the event, but as shown in Figure 7, this changed at ~26 seconds. The activation of the coil can be seenin Figure 8 by observing the slight drip in the fuel/ox return current (green line) as the coil current isreturning via the wire. The return current jumps to more than –20 amps, at just over 27 seconds, sincethere is arcing directly to the fuel/ox return. This causes the coil voltage to collapse and the valve to close.

Page 14 of 289th Joint FAA/DoD/NASA 2006 Aging Aircraft Conference
March 6-9, 2006
Figure 8. Current and Voltages in the Arcing Event in Test Specimen 008
Figure 9 is the post-test photo of Test Specimen 008 which used 15-amp fuses. The figure shows theextensive damage to both the fuel/ox wire and the heater wire. A section of several of the heater wireshave been destroyed (evaporated) in the arc.
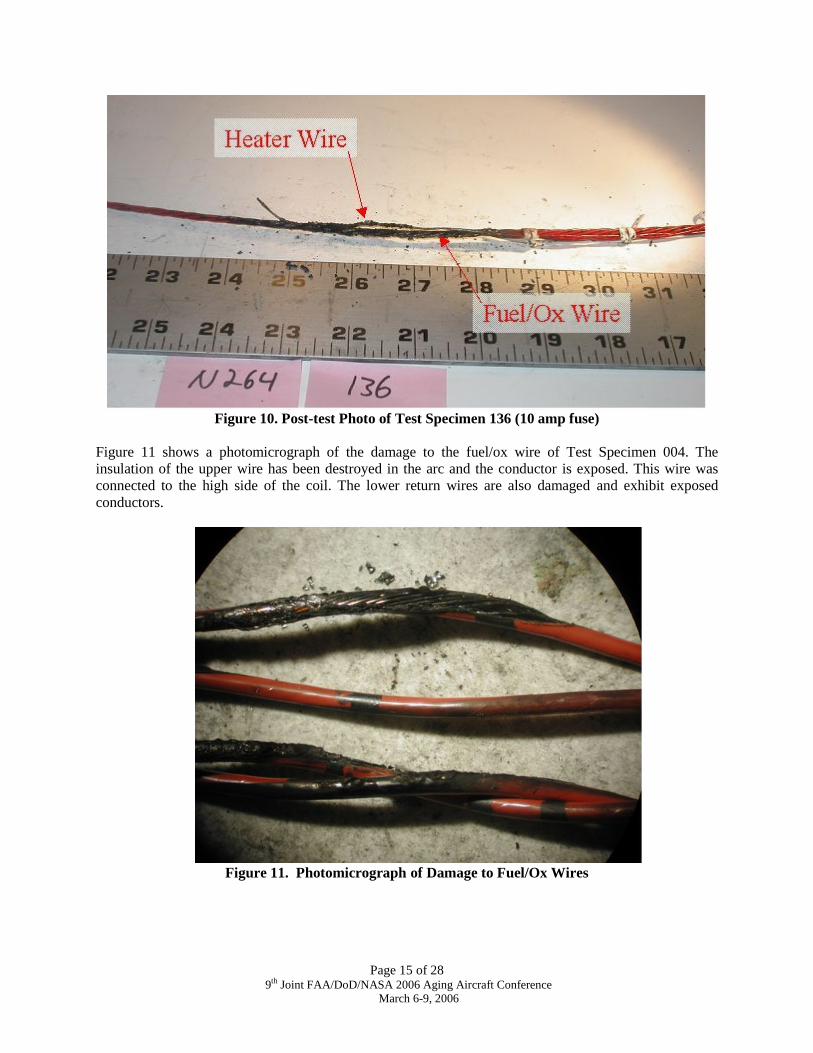
Figure 10 shows the post-test photo from Test Specimen 136 which used 10-amp fuses. There is muchless damage than in Figure 9, as the 10-amp fuse protected the test specimen. However, there still issignificant damage to the fuel/ox wires.
Figure 9. Post-test Photo of Test Specimen 008 (15 amp fuse)
Page 15 of 289th Joint FAA/DoD/NASA 2006 Aging Aircraft Conference
March 6-9, 2006
Figure 10. Post-test Photo of Test Specimen 136 (10 amp fuse)
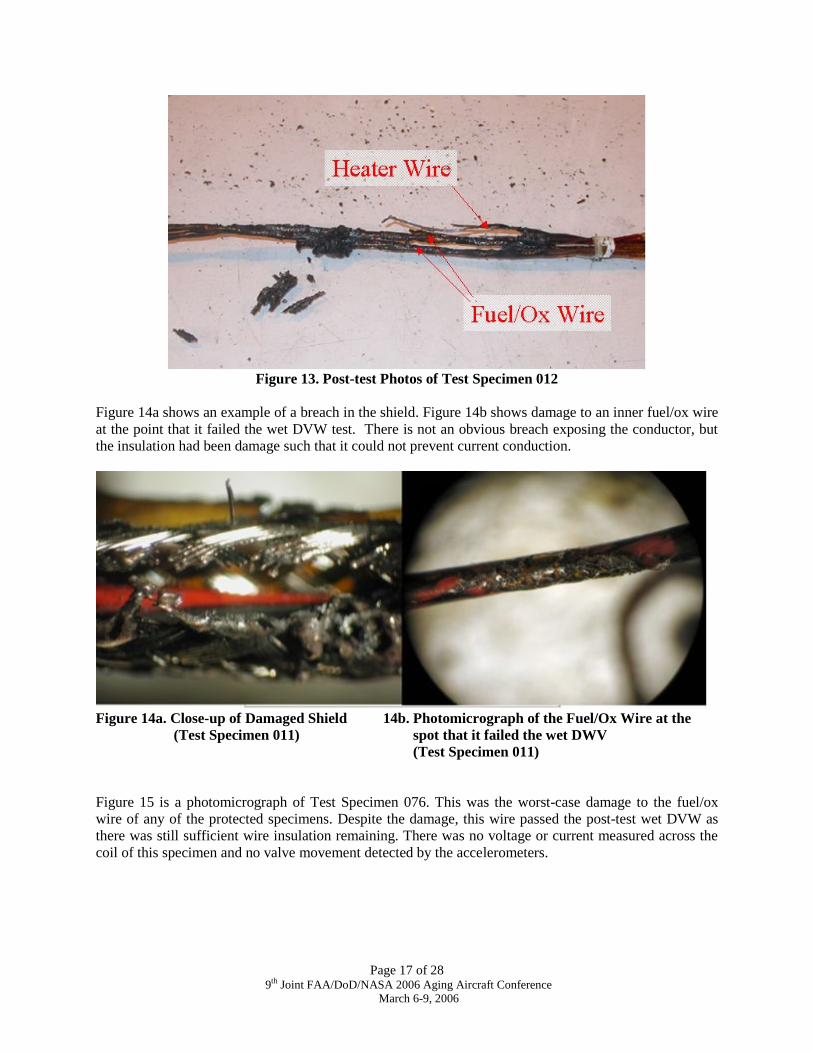
Figure 11 shows a photomicrograph of the damage to the fuel/ox wire of Test Specimen 004. Theinsulation of the upper wire has been destroyed in the arc and the conductor is exposed. This wire wasconnected to the high side of the coil. The lower return wires are also damaged and exhibit exposedconductors.
Figure 11. Photomicrograph of Damage to Fuel/Ox Wires

Page 16 of 289th Joint FAA/DoD/NASA 2006 Aging Aircraft Conference
March 6-9, 2006
Yellow: Unlikely that the fuel/ox valve would open due to an arc track event
Two groups (011-015 and 76-80) were placed in this category. The fuel/ox wires of the former wereunprotected, shielded twisted pairs and the latter were twisted pairs (non-shielded) protected with onewrap of PTFE tape. Figure 12 shows the voltage and current across the coil for Test 012. There is noactivity except oscillations of a few volts after the 22-second mark. These oscillations were most likelyfrom electrical noise generated by the arcing event. The fuel/ox wire from Test 012 passed the wet DVWtest indicating that there could not have been direct current going from the arc to the fuel/ox wire. Thus,there was only a capacitive/inductive coupled current. The sampling rate of the data logger was too lowto obtain frequency information for the oscillations. There is no movement of the valve detected by theaccelerometers.
Figure 12. Voltage and Current across the Coil and Accelerometer Measurements for TestSpecimen 012
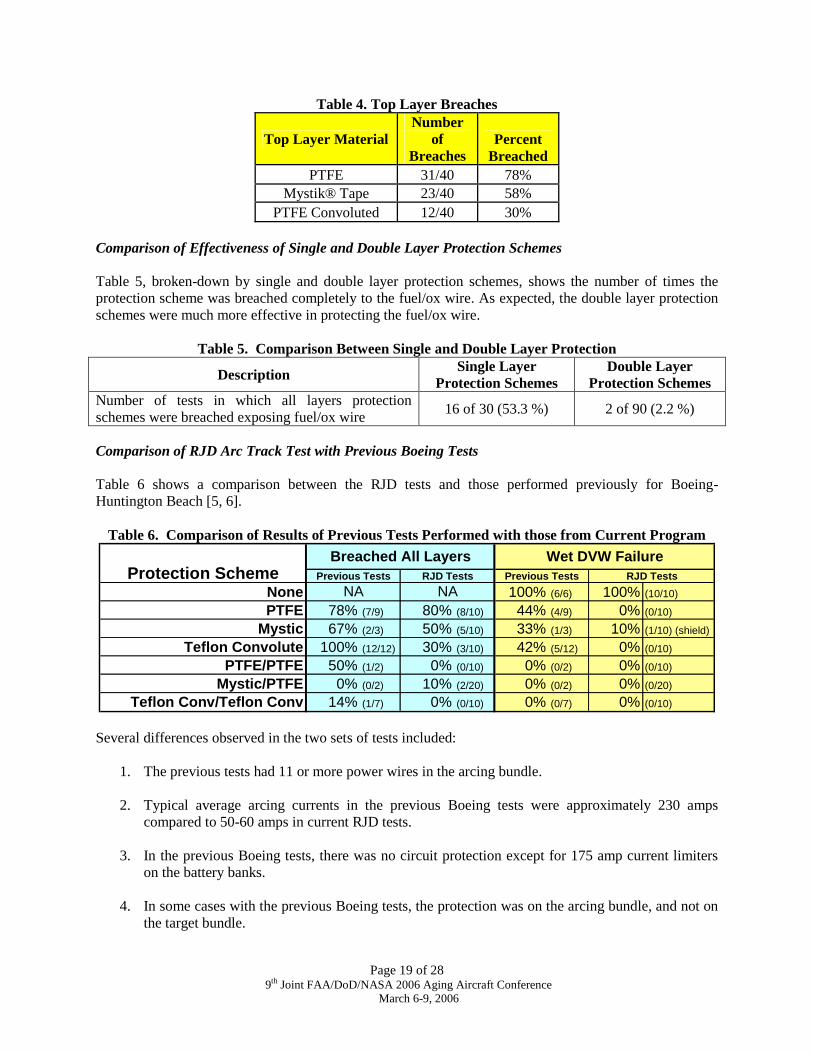
Figure 13 shows the post-test photo of Test Specimen 012. There has been damage to the fuel/ox wiresand the shield has been exposed in several places. Because of the heat generated by arcing to the shield, itremains possible that the fuel/ox wire inside the shield may be heat damaged. However, as long as theshield is intact, it is impossible for voltage and current to be transferred from the arc to the inner wires.
Page 17 of 289th Joint FAA/DoD/NASA 2006 Aging Aircraft Conference
March 6-9, 2006
Figure 13. Post-test Photos of Test Specimen 012
Figure 14a shows an example of a breach in the shield. Figure 14b shows damage to an inner fuel/ox wireat the point that it failed the wet DVW test. There is not an obvious breach exposing the conductor, butthe insulation had been damage such that it could not prevent current conduction.
Figure 14a. Close-up of Damaged Shield 14b. Photomicrograph of the Fuel/Ox Wire at the(Test Specimen 011) spot that it failed the wet DWV
(Test Specimen 011)
Figure 15 is a photomicrograph of Test Specimen 076. This was the worst-case damage to the fuel/oxwire of any of the protected specimens. Despite the damage, this wire passed the post-test wet DVW asthere was still sufficient wire insulation remaining. There was no voltage or current measured across thecoil of this specimen and no valve movement detected by the accelerometers.

Page 18 of 289th Joint FAA/DoD/NASA 2006 Aging Aircraft Conference
March 6-9, 2006
Figure 15. Post-test Photomicrograph of Fuel/Ox Wire Test Specimen 076
Green: Very unlikely that the fuel/ox valve would open due to an arc track event
The data review for all tests in the green category indicated no voltage or measurable current across thecoil. There was no valve movement detected by the accelerometers in any of these tests.
Visual examination of these specimens showed that in many cases the protection did not breach throughthe protective layers and the fuel/ox wires were in “like new” condition. In some cases, the protection wasbreached and slight damage occurred to the fuel/ox wire such as spot charring of the topcoat.
Comparison of Effectiveness of Different Protection Materials
A goal of the project was to compare the effectiveness of the different protection materials in preventingarcing damage. For protection of the fuel/ox wires, 120 tests were performed with permutations of PTFEwrap, Mystik® tape wrap, and PTFE convoluted tubing (see Table 2). From these 120 tests, 40 testsamples were constructed with each of the protection materials as the top layer of protection. In 10 of the40 test specimens it was the only layer of protection; in the other 30 test specimens, it was the top layer ofa multilayer protection. Test specimens were visually examined after the tests to determine if the top layerof protection was breached completely. Table 4 shows the number of times each material was breached.
Page 19 of 289th Joint FAA/DoD/NASA 2006 Aging Aircraft Conference
March 6-9, 2006
Table 4. Top Layer Breaches
Top Layer MaterialNumber
ofBreaches
PercentBreached
PTFE 31/40 78%Mystik® Tape 23/40 58%
PTFE Convoluted 12/40 30%
Comparison of Effectiveness of Single and Double Layer Protection Schemes
Table 5, broken-down by single and double layer protection schemes, shows the number of times theprotection scheme was breached completely to the fuel/ox wire. As expected, the double layer protectionschemes were much more effective in protecting the fuel/ox wire.
Table 5. Comparison Between Single and Double Layer Protection
Description Single LayerProtection Schemes
Double LayerProtection Schemes
Number of tests in which all layers protectionschemes were breached exposing fuel/ox wire 16 of 30 (53.3 %) 2 of 90 (2.2 %)
Comparison of RJD Arc Track Test with Previous Boeing Tests
Table 6 shows a comparison between the RJD tests and those performed previously for Boeing-Huntington Beach [5, 6].
Table 6. Comparison of Results of Previous Tests Performed with those from Current Program
None 100% (6/6) 100% (10/10)
PTFE 78% (7/9) 80% (8/10) 44% (4/9) 0% (0/10)
Mystic 67% (2/3) 50% (5/10) 33% (1/3) 10% (1/10) (shield)
Teflon Convolute 100% (12/12) 30% (3/10) 42% (5/12) 0% (0/10)
PTFE/PTFE 50% (1/2) 0% (0/10) 0% (0/2) 0% (0/10)
Mystic/PTFE 0% (0/2) 10% (2/20) 0% (0/2) 0% (0/20)
Teflon Conv/Teflon Conv 14% (1/7) 0% (0/10) 0% (0/7) 0% (0/10)
Protection SchemeNA NA
Wet DVW FailurePrevious Tests RJD TestsPrevious Tests
Breached All LayersRJD Tests
Several differences observed in the two sets of tests included:
1. The previous tests had 11 or more power wires in the arcing bundle.
2. Typical average arcing currents in the previous Boeing tests were approximately 230 ampscompared to 50-60 amps in current RJD tests.
3. In the previous Boeing tests, there was no circuit protection except for 175 amp current limiterson the battery banks.
4. In some cases with the previous Boeing tests, the protection was on the arcing bundle, and not onthe target bundle.

Page 20 of 289th Joint FAA/DoD/NASA 2006 Aging Aircraft Conference
March 6-9, 2006
5. In the previous Boeing tests, when two applications of protection were used, one application wason the arcing bundle and one application was on the target bundle.
The results show that the higher current levels, and therefore high power in the earlier tests, caused moredamage than observed in the present tests. In fact, the higher level of current defeated the single layerprotection schemes and in many cases damaged the protected wires. The higher current tests did breachthe Teflon® convolute more consistently than the other protection, which is different than the present testresults. The double layer protection schemes did provide adequate protection even with the higher currentlevel of the earlier tests, although they could also be breached also. In general, the results of the earliertests correlate with the present tests when the increase of power of the earlier experiments is considered.
Conclusions
During the life cycle of an aircraft or spacecraft, new failure scenarios are discovered which must beaddressed in order to meet safety design requirements. An example is the discovery of a failure conditionthat could lead to an inadvertent firing of a Space Shuttle RCS thruster when the Shuttle is attached to theISS. Analysis suggests an inadvertent thruster firing could be catastrophic to both vehicles. In theOrbiter, the thruster valve control wiring is bundled with 28 VDC wiring which has sufficient voltage andcurrent to open a valve and cause the un-commanded thruster firing. This failure scenario only became asafety concern well into the life cycle of the Shuttle. In response to this hazard, a systematic laboratoryapproach for determining the effectiveness of selected wire protection schemes was developed. Theresult was a process for electrically isolating Space Shuttle RCS control wiring from adjacent powerwiring in the presence of an arc track event. Test results show a single layer of Teflon convoluted tubingor Mystik® tape and, to a lesser extent, PTFE tape is adequate to protect critical wires against moderatecurrent (50 to 60 amps) arcing faults. A double layer protection approach using the three above materialsprovides the best isolation from adjacent arcing faults and is recommended for high current applications.
References
[1] Risk Assessment of Wire Failures Causing Uncommanded Orbiter RCS Firing while Docked atthe ISS, Datta K., Krause P.A., and Greulich, O.R.
[2] Space Shuttle Orbiter Reaction Jet Driver (RJD) Independent Technical Assessment/InspectionReport, NASA Engineering and Safety Center (NESC), March 22, 2005. NASA/TM-2005-213750/Version 1. R. Gilbrech et al.
[3] “Managing Electrical Connection Systems and Wire Integrity on Legacy Aerospace Vehicles,” Paper at the Fourth Joint NASA/ /FAA/DOD Conference on Aging Aircraft, St. Louis, Mo.September 2000. S. Sullivan and G. Slenski.
[4] Summary Report on the Orbiter Kapton™ Insulated Wire Arc Track Investigation, Report Number N200316JU01, Lectromechanical Design Company for The Boeing Company undercontract M0M8XXM-86371M, July 16, 2001, W. Linzey.
[5] “Convoluted Tube and Teflon Tape Wrap Effectiveness in Redundancy Separation”, ReportNumber: N202730AP01, Lectromechanical Design Company for The Boeing Company undercontract M1M8XXM-863731H, April 30, 2001, W. Linzey.
[6] “Teflon Convoluted Tube Effectiveness in Redundancy Separation”, Report Number: N204306AU01, Lectromechanical Design Company for The Boeing Company under contractM1M8XXM-863746H, August 1, 2001, W. Linzey.

Page 21 of 289th Joint FAA/DoD/NASA 2006 Aging Aircraft Conference
March 6-9, 2006
Appendix 1. Listing of 12 Different Protection Schemes Tested
* These protection schemes are not includes in the ML 0303-0013 or ML 0303-0014 specifications.
Fabricated per Space Shuttle Program wiring spec ML0303-0013 and ML0303-0014 (Section 4.1.3 : ‘Protection’)
First (or bottom)Layer
Second (or top) Layer
1 PTFE Wrap None 1 Wrap 10 mil PTFE tape: 25-75% Overlap (Section 4.1.3.2.3)
2 Mystik 7503 Tape None 3 Wraps 4 mil Mystik Tape: 50% Overlap (Section 4.1.3.2.4)
3 Teflon ConvolutedTubing
None 1 application 5/8” convolute (Section 4.1.3.2.6)
4 PTFE Wrap PTFE Wrap 2 Wraps 10 mil PTFE tape (Section 4.1.3.4.3)
5* PTFE Wrap Mystik 7503 Tape 1 Wrap 10 mil PTFE (Section 4.1.3.2.3) then 3 Wraps 4 milMystik (Section 4.1.3.2.4)
6 PTFE Wrap Teflon Convoluted Tubing 1 Wrap 10 mil PTFE then 1 application 5/8” convolute (Section4.1.3.4.1)
7 Mystik 7503 Tape PTFE Wrap 3 Wraps 4 mil Mystik Tape: 50% Overlap then 1 Wrap 10 milPTFE tape: 25-75% Overlap (Section 4.1.3.4.4)
8 Mystik 7503 Tape Mystik 7503 Tape 6 Wraps 4 mil Mystik Tape: 50% Overlap (Section 4.1.3.4.5)
9 Mystik 7503 Tape Teflon Convoluted Tubing 3 Wraps 4 mil Mystic Tape: 50% Overlap then 1 application5/8” convolute (Section 4.1.3.4.2)
10* Teflon ConvolutedTubing
PTFE Wrap 1 application 5/8” convolute (4.1.3.2.6) then 1 Wrap 10 mil PTFE tape (Section 4.1.3.4.3)
11* Teflon ConvolutedTubing
Mystik 7503 Tape 1 application 5/8” convolute (Section 4.1.3.2.6) then 3 Wraps 4mil Mystic Tape: 50% Overlap (Section 4.1.3.2.4)
12 Teflon ConvolutedTubing
Teflon Convoluted Tubing 1 application 5/8” convolute then 1 application 1” convolute (Section 4.1.3.4.6)

Page 22 of 289th Joint FAA/DoD/NASA 2006 Aging Aircraft Conference
March 6-9, 2006
Appendix 2
Does Civil Aircraft Wiring Exhibit Aging?
Walter Thomas IIINASA Goddard Space Flight Center
Greenbelt, Maryland
A previous Space Transportation System (STS) report [1] had reviewed FAA wiring incidents involving civilaircraft to estimate wiring short circuit statistics. Wiring short circuit incidents were counted to derive anoccurrence statistic. This provides only a frequency of occurrence–the number of failures per some timeinterval; no information on how or if failures vary over time (infant mortality, random, or wear-out) results.To accomplish that, one needs to know when events occur (with respect to a relevant time scale) anddetermine whether failures are decreasing, not changing or increasing with time. The Weibull distribution isideally suited for determining failure character as the plot slope will show the failure rate as decreasing,increasing, or not changing, given a credible statistical fit.
Weibull analyses on civil aircraft wiring incidents were performed in a previous Shuttle wiring report [2].Those data were updated for civil aircraft operated in air carrier service with records taken from the FAAAircraft Incident Database System (AIDS).* Search keywords were: “short,” “shorted,” “shorting,” “short circuit,” “wire,” and “wiring”. Data included incidents from 1978 to 2005. Connectors are a wiringcomponent, so connector events were included. Only air carrier/commercial and air taxi/commuter incidentswere used. Each incident was reviewed for relevance and consequence†; duplicate events were removed.Table I summarizes the records reviewed and used by the author for Weibull analyses.
Table I. Summary of FAA AIDS Wiring Damage Occurrences
KeywordAir carrier/commercial
Air taxi/commuter
Total“hits”
# relevant &non-con-sequential
# avail. forWeibullanalyses
Short 185 128 313 - -Shorted 97 81 178 - -Shorting 9 5 14 - -
Short circuit 5 3 8 - -97 31
Wire 137 176 313 - -Wiring 62 25 87 - -
153 61Total 495 418 913 250 92
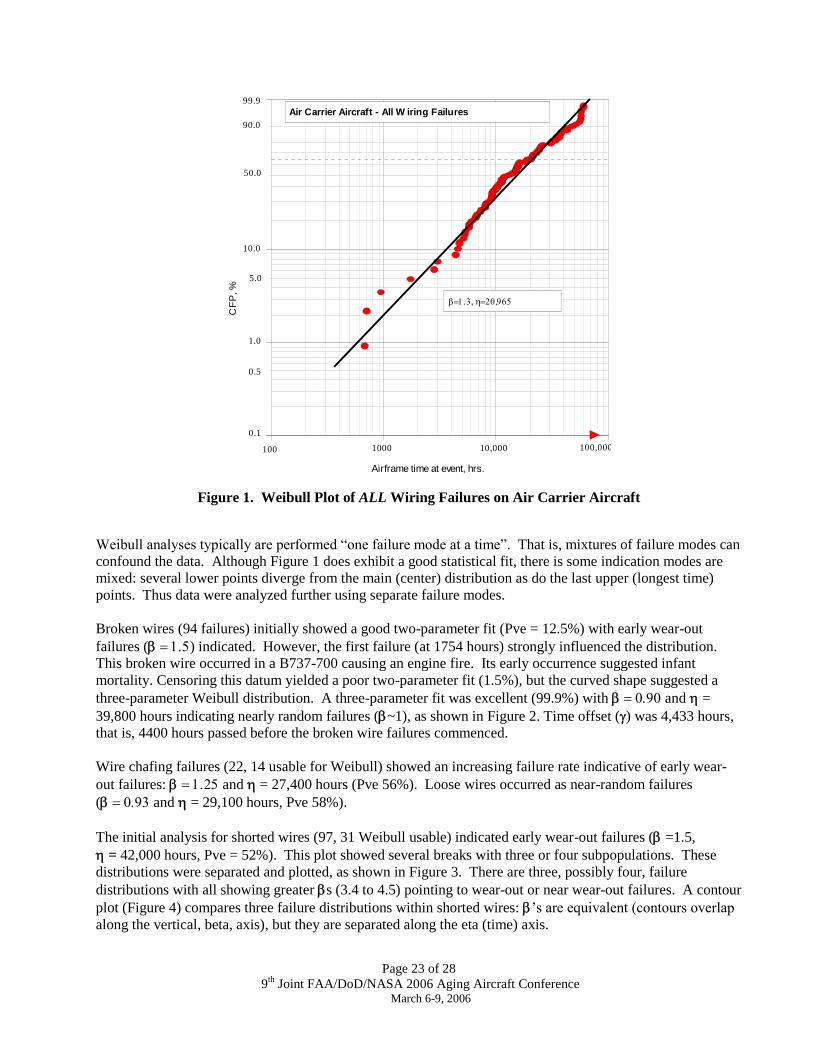
All wiring failures (broken, chafed, loose, shorted and “other” failures; 250 relevant occurrences, 92 usable for Weibull) are shown in Figure 1. These data fit a Weibull distribution well (Pve =41.6%‡). For all wiringfailures, air carrier aircraft show “early wear-out” failures as indicated by a Weibull slope () greaterthan one.
* http://www.nasdac.faa.gov/†Relevance means that the incident reflect a wire event; for example, “short” returned aircraft landing short of the runway incidentsand “wire” returned “struck a wire on take-off,” etc. A consequential event is a wire failure resulting from a cause other than wiredeterioration with age; for example shorts caused by fire, liquid contamination, overstress, or another component failing.‡ “Pve” is P-value estimate indicating goodness of fit; a Pve greater than 10% indicates a good Weibull fit.
Page 23 of 289th Joint FAA/DoD/NASA 2006 Aging Aircraft Conference
March 6-9, 2006
100 100,0001000 10,000
0.1
1.0
5.0
10.0
50.0
90.0
99.9
Airframe time at event, hrs.
CF
P,%
Air Carrier Aircraft - All W iring Failures
0.5
Figure 1. Weibull Plot of ALL Wiring Failures on Air Carrier Aircraft
Weibull analyses typically are performed “one failure mode at a time”. That is, mixtures of failure modes canconfound the data. Although Figure 1 does exhibit a good statistical fit, there is some indication modes aremixed: several lower points diverge from the main (center) distribution as do the last upper (longest time)points. Thus data were analyzed further using separate failure modes.
Broken wires (94 failures) initially showed a good two-parameter fit (Pve = 12.5%) with early wear-outfailures () indicated. However, the first failure (at 1754 hours) strongly influenced the distribution.This broken wire occurred in a B737-700 causing an engine fire. Its early occurrence suggested infantmortality. Censoring this datum yielded a poor two-parameter fit (1.5%), but the curved shape suggested athree-parameter Weibull distribution. A three-parameter fit was excellent (99.9%) with and =39,800 hours indicating nearly random failures (~1), as shown in Figure 2. Time offset () was 4,433 hours,that is, 4400 hours passed before the broken wire failures commenced.
Wire chafing failures (22, 14 usable for Weibull) showed an increasing failure rate indicative of early wear-out failures: and = 27,400 hours (Pve 56%). Loose wires occurred as near-random failures(and = 29,100 hours, Pve 58%).
The initial analysis for shorted wires (97, 31 Weibull usable) indicated early wear-out failures (=1.5,= 42,000 hours, Pve = 52%). This plot showed several breaks with three or four subpopulations. Thesedistributions were separated and plotted, as shown in Figure 3. There are three, possibly four, failuredistributions with all showing greater s (3.4 to 4.5) pointing to wear-out or near wear-out failures. A contourplot (Figure 4) compares three failure distributions within shorted wires: ’s are equivalent (contours overlap along the vertical, beta, axis), but they are separated along the eta (time) axis.

Page 24 of 289th Joint FAA/DoD/NASA 2006 Aging Aircraft Conference
March 6-9, 2006
Figure 2. Weibull Plot for Air Carrier Broken Wire Failures
Figure 3. Shorted Wire Failures in Air Carrier Aircraft

Page 25 of 289th Joint FAA/DoD/NASA 2006 Aging Aircraft Conference
March 6-9, 2006
As this three distribution model is credible, aircraft wiring shorts likely manifest as wear-out failuresdistributed over a range ofoperational times. These several “large ” distributions combine over a wide timescale to produce an apparent lower-early wear-out distribution.
Figure 4. Comparing Weibull Parameters for Shorted Wires in AirCarrier Aircraft (90% confidence intervals)
Helicopters and general aviation type aircraft are used in air carrier/commercial and air taxi/commuteroperations. The previous analysis [2] suggested possible differences in wiring failure rates between air carrier(transport) and general aviation aircraft. Additional data in this study was used to test that hypothesis.Weibull data are summarized in Table II.
Table II. Wiring Failure Data forComparing Aircraft “Classes”
Aircraft Class n , hours Pve, %Helicopters 8 2.4 7,900 86
General Aviation 25 1.6 8,700 63Large/Transport 81 1.3 21,000 42
A contour plot (Figure 5) compares these wiring failures. Helicopters and general aviation aircraft wiringfailures have s equivalent to those for large/transport aircraft. However, helicopter and general aviationaircraft failures occurred much sooner–note the distinct separation between etas (time axis). Thus generalaviation aircraft (and helicopter) wiring failures do occur earlier than those in large aircraft. No cause (whygeneral aviation failures occur earlier) can be determined from these data.

Page 26 of 289th Joint FAA/DoD/NASA 2006 Aging Aircraft Conference
March 6-9, 2006
Figure 5. Comparison of Wiring Failure Distributions Between Helicopters, General Aviationand Large/Transport Aircraft used in Air Carrier/Air Taxi/Commuter Service
The above Weibull plots do not represent fleet in-service failure probabilities. To derive fleet failureprobabilities, cumulative “non-failed” (i.e., no wiring failures) operating hours for each aircraft type (thoseincurring wiring failures) need to be summed. (That data was unavailable in the previous analysis [2]).Adding non-failed operating times (“right censored” data) will drive the Weibull plots down the probability scale and increase characteristic lifetimes (’s). Slopes should be relatively unaffected [3].
An example illustrates including non-failed operating times. The SAAB SF-340 aircraft was considered.Annual in-flight operating times were taken from the Transtat database§. Figure 6 is a Weibull plot with andwithout non-failed operating times (suspensions). Adding non-failed data pushed the failure distributiondown the probability axis and slightly diminished its slope. This is expected since adding right suspensionsalters the failure ranks. Characteristic life also increased substantially. Another example using data for CE-402 aircraft showed similar results: its bi-modal distribution increased s (7720 to 15,000 hours and 17,400 to21,400 hours) and decreased s (2.2 to 2.1 and 11.5 to 9.3) when non-failed flight hours were added.
Figure 6. Accounting for Non-Failed Flight Hours, SF-340 Aircraft
§ http://transtats.bts.gov/
Page 27 of 289th Joint FAA/DoD/NASA 2006 Aging Aircraft Conference
March 6-9, 2006
Given reliable total annual flight hours for each aircraft type that exhibit wiring failures, complete fleet wiringfailure probabilities could be compiled. As that was not the intent of this or the prior work, the exampleserves to demonstrate what needs to be done to compute true fleet probabilities.
To determine whether wiring is “aging”, one can examine failures over time (i.e., airframe hours atoccurrence) and analyze the data using a Weibull distribution. An increasing failure rate― that is, morefailures occurring as operating time increases― indicates “aging.” [An analogy is human mortality: peopleare more likely to die (fail) as the get older (“age”).] Weibull slopes (s) greater than one show an increasingfailure rate; larger slopes (i.e., more than about four) indicate wear-out failures. From one to less than fourare “early” wear-out failures. Slopes less than one show infant mortality. For a detailed interpretation, seeReference [3].
In summary, Weibull analyses have shown to be useful for evaluating wiring on aging aircraft. This work,based on FAA aircraft incident records for air carrier, air taxi, commuter and commercial operations over1978 through 2005 returned over 900 incidents of which 250 were relevant to wire aging. Approximately 90records contained airframe hours (at occurrence). Subsequent Weibull analyses showed the following:
1. Shorted wires occurred most frequently (153 occurrences) followed by broken wires (120). Chafedand loose wires occurred less frequently, 26 and 13 occurrences, respectively.
2. Air carrier aircraft showed early wear-out wiring failures (= 1.2) when all failures were combined.
3. Broken wire failures occurred approximately randomly over time (= 0.9); characteristic life () was39,800 hours and the “failure-free” time was 4400 hours (three parameter Weibull distribution).
4. Wire chafing occurred as early wear-out failures, with = 1.25 and = 27,400 hours.
5. Loose wire failures were approximately random (= 0.93) with a characteristic life of 29,100 hours.
6. Shorted wires showed wear-out failures having three distributions occurring over 1000 to 60,000hours with ’s of 3.4 and 4.5. The distributions were distinct and separate.
7. Wire shorts and chafing both showed aging; shorts were wear-out and chafing early wear-out failures.
8. Wiring failures manifested significantly later for large transport aircraft compared to general aviationaircraft and helicopters. General aviation and helicopter wiring failures were similar. Weibull swere the same for all three aircraft classes.
9. Adding non-failed flight operating times to wiring failures decreases fleet failure probabilities (vs.analyzing failures-only data). Slopes decreased slightly and characteristic lives increasedsignificantly.
Page 28 of 289th Joint FAA/DoD/NASA 2006 Aging Aircraft Conference
March 6-9, 2006
Acknowledgements
The author of this Appendixgratefully acknowledges Mr. George Slenski’s encouragement topublish thesedata. Dr. R. Gilbrech, Mr. R. Kichak, Mr. R. Cherney, Mr. G. Williams and Dr. V. Volovoi supported theoriginal study on which this work is based. Dr. R. Abernethy mentored the author and reviewed the originalstudy manuscript. This work was supported by the NASA Engineering and Safety Center through the SpaceShuttle Orbiter Reaction Jet Driver (RJD) Independent Technical Assessment/Inspection.
References
[1] S. Roshan-Zamir, Space Shuttle Analysis, SSMA-04-002SAIC, “Space Shuttle Failed-On ThrusterAnalysis, Probability of Failure Assessment,” Safety and Mission Assurance Directorate (NA), Space Shuttle Division (NC), NASA Johnson Space Center, Houston, Texas, Contract Number NAS(-19180,January 9, 2004, 15 pp.
[2] W. Thomas, III, “Wiring Damage Analysis for STS OV-103,” pp. G-1 to G-33 in Appendix G of R.Gilbrech et al, NASA/TM-2005-213750/Version 1, Space Shuttle Orbiter Reaction Jet Driver (RJD)Independent Technical Assessment/Inspection Report, NESC Report, March 2005, 155 pp.
[3] R. B. Abernethy, The New Weibull Handbook, Fourth Ed., North Palm Beach, Florida, September 2000,p. 3-5. (ISBN 0-9653062-1-6).