Embed Size (px)
Citation preview

Evaluation of QT Correction Formulas Based on Electrocardiograms from Population Studies
S. Perz, A. Pfeufer, S. Kääb*, R. Küfner, K.H. Englmeier,H.E. Wichmann for the KORA Study Group
GSF- Forschungszentrum für Umwelt und Gesundheit, Neuherberg, Institut für Medizinische Informatik, Institut für Humangenetik
und Institut für Epidemiologie*LMU/Klinikum-Großhadern, München
QT/QTc Interval Heidelberg, 17.-18.11.2005
Evaluation of QT Correction Formulas
• Cardiac arrhytmias cause up to 50% of sudden cardiac death.• Little knowledge about the specific conditions that trigger the
situation any one individual• Development of severe cardiac rhythm diturbances and cardiac
mortality is associated with a prolonged QT interval
Background
QT/QTc Interval Heidelberg, 17.-18.11.2005

Sinus Node
AV-Node
His-Bundle
Purkinje-FibersRightBundle
LeftBundle QRS:
Excitation
QT:
Excitation+Repolarization
ECGECG--SignaturesSignatures: Definition: Definition

QT interval and correction for heart rate
QT/QTc Interval

QT Interval Correction for Heart Rate
QT correction according to Bazett
QTc = QT * (60/heart rate) 1/2 [ms]
RR = (60/heart rate) *1000 [ms]
QTc = QT * (RR/1000) 1/2 [ms]
QT/QTc Interval Heidelberg, 17.-18.11.2005
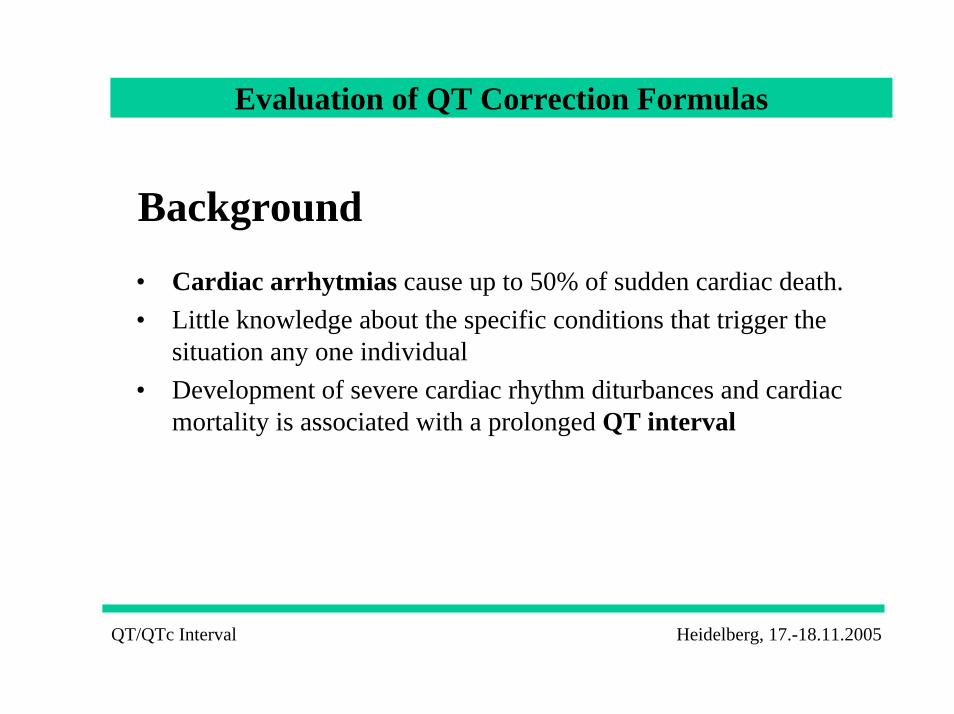
QT correction formulaeBazett: QTc = QT * RR 1/2
Fridericia: QTc = QT * RR 1/3
Framingham: QTc = QT + 0.154*(1000 – RR)
Nomogram: QTc = QT + 0.116* (1000 - RR) if RR > 1000QTc = QT + 0.156* (1000 - RR) if 600 < RR <1000QTc = QT + 0.384* (1000 - RR) if RR < 600
Towords Optimisation of QT Correction for Heart Rate
QT/QTc Interval Heidelberg, 17.-18.11.2005

Towords Optimisation of QT Correction for Heart Rate
Objective
• To identify the best fit of QT-RR relation considering fourknown QT correction formulae using computerized ECG measurement derived from
- a population-based survey and - a population-based follow-up
GSF- KORA Study Group Perz et al.

Population-based studies of the MONICA Project Augsburg
Time table of the Monica Project Augsburg.
Survey and follow-up ECG data used for QT and QTc interval evaluation
GSF – MONICA/KORA Study Group

Population-based studies in Southern Germany
Study region- City of Augsburg and
two surrounding rural districts
- Population register coversabout 530,000 persons
GSF – MONICA/KORA Study Group

Monica Augsburg Surveys: ECG examination and data collection
• Twelve lead resting ECG
•1 st record: Survey 1984/85
• 2 nd record: Follow-up 1987/88
• N = 3299
Computerized ECG Analysis
MONICA Augsburg Surveys Perz et al.
Computerized ECG Analysis
Advantages• Expert knowledge
• Reproducibility of the analysis• Electronic storage of measurement and
interpretation for• Statistical analysis
Valid Phenotyping
GSF Institute of Medical Informatics KORA Study Group

QT distribution (N=3299)
0
5
10
15
20
25
260 300 340 380 420 460 500 540
(ms)
%
GSF KORA Study Group Perz et al.

Heart rate distribution (N=3299)
0
5
10
15
20
25
30 40 50 60 70 80 90 100 110 120
Heart rate (1/min)
%
GSF- KORA Study Group Perz et al.

QT vs. RR (N=3299)
250
300
350
400
450
500
550
400 600 800 1000 1200 1400 1600
RR (ms)
QT
(ms)
---- BZ---- CR---- FH---- NG
GSF- KORA Study Group Perz et al.

QT and QTc Distributions
0
5
10
15
20
25
260 300 340 380 420 460 500 540
(ms)
%
QTQTc (BZ)QTc (CR)QTc (FH)QTc (NG)
GSF- KORA Study Group Perz et al.

Towords Optimisation of QT Correction for Heart Rate
Variable m (ms) s (ms) Rsd2
QT 383.6 26.5 -
QTc (Bazett) 401.8 21.4 0.35
QTc (Cubic Root) 395.4 18.5 0.49
QTc (Framingham) 395.8 18.2 0.53
QTc (Nomogram) 397.1 17.9 0.54
GSF- KORA Study Group Perz et al.

Towords Optimisation of QT Correction for Heart Rate
The benefit of different QT correctionformulae
Inter-individual differencesSurvey data (1st ECGs)
? Intra-individual differences of QT intervalsFollow-up data (1st vs. 2nd ECGs)
GSF- KORA Study Group Perz et al.
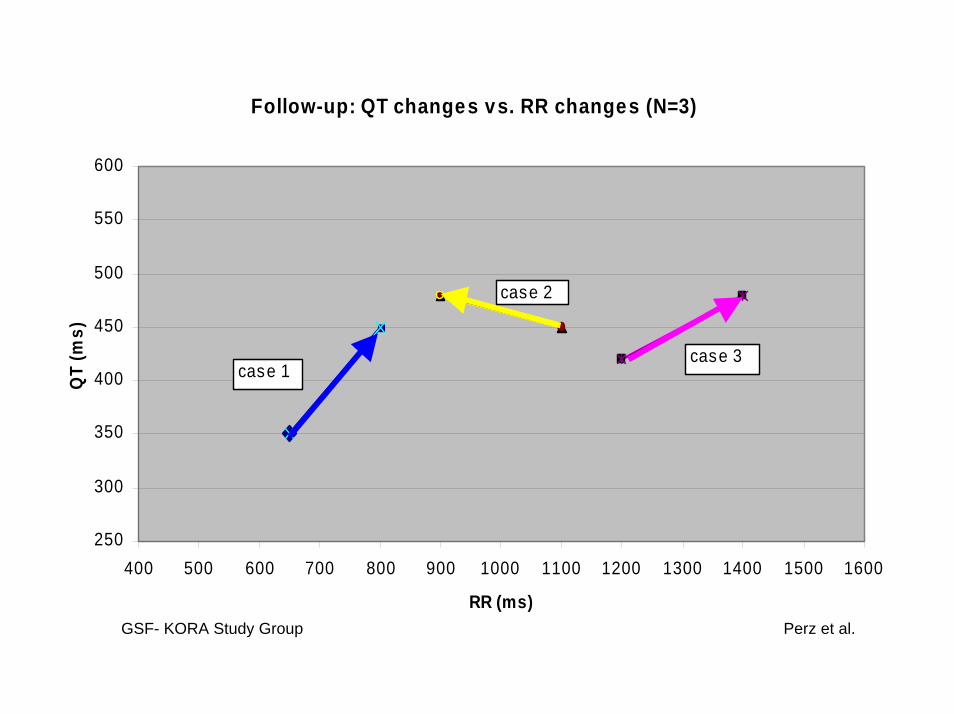
Follow-up: QT changes vs. RR changes (N=3)
250
300
350
400
450
500
550
600
400 500 600 700 800 900 1000 1100 1200 1300 1400 1500 1600
RR (ms)
QT
(ms)
case 1
case 2
case 3
GSF- KORA Study Group Perz et al.

300
350
400
450
500
550
300 350 400 450 500 550
Q T 1 ( m s )
300
350
400
450
500
550
300 350 400 450 500 550
QTc_BZ(1) (m s)
QTc
_BZ(
2)
(m
s)
300
350
400
450
500
550
300 350 400 450 500 550
QTc_ CR(1) (ms)
QTc
_CR
(2)
(m
s)
300
350
400
450
500
550
300 350 400 450 500 550
QTc_FH(1) (ms)
QTc
_FH
(2)
(m
s)
300
350
400
450
500
550
300 350 400 450 500 550
QTc_NG(1) (ms)QTc
_NG
(2)
(m
s)
Cubic root
Bazett
QT Framingham
Nomogram
QT and QTc intervals: 1st vs. 2nd measurement (N=3299)
Best fit?
GSF- KORA Study Group: Perz et al.

Distributions of QT and QTc Differences: 2nd - 1st measurement
0
5
10
15
20
25
30
35
-120 -100 -80 -60 -40 -20 0 20 40 60 80 100 120
ms
%
DQTDQTBZDQTCRDQTFHDQTNG
GSF- KORA Study Group Perz et al.

Towords Optimisation of QT Correction for Heart Rate
2 nd – 1 st measurementof variable
m (ms) s (ms) Ric2
QT 3.0 21.0 -QTc (Bazett) -0.5 16.8 0.36QTc (Cubic Root) 0.7 13.8 0.57QTc (Framingham) 0.4 13.9 0.56QTc (Nomogram) 0.6 13.6 0.58
GSF- KORA Study Group Perz et al.
Towords Optimisation of QT Correction for Heart Rate
Summary and Conclusion
• Correction of the QT- Interval for heart rate reduces thevariance of the QT interval
- cross-sectionally on a population-based scale- individually (follow-up)
• The QT correction formulas according to the Nomogrammethod, according to theFramingham study and also according to Fridericia are significantly superior to Bazett‘sformula.
GSF- KORA Study Group Perz et al.

Towords Optimisation of QT Correction for Heart Rate
References (1)
Bazett HC. An analysis of time relations of the electrocardiogram. Heart 1920;7: 353- 70
Fridericia LS. Die Systolendauer im Elektrokardiogramm bei normalen Menschen und bei Herzkranken. Acta Med Scand 1920,53: 469
Sagie A, Larson MG, Goldberg RJ, Bengtson JR, Levy D. An improved method for adjusting the QT interval for heart rate (the Framingham Heart Study). Am J Cardiol 1992; 70:797-801.
Karjalainen J, Viitasalo M, Mänttäri M, Manninen V. Relation between QT intervals and heart rates from 40 to 120 beats/min in rest electrocardiograms of men and a simple method to adjust QT interval values. JACC 1994, 23(7): 1547-53
GSF- KORA Study Group Perz et al.

Towords Optimisation of QT Correction for Heart Rate
References (2): GSF publications based on investigations of the QT interval (2004-2005)
Perz S, Pfeufer A, Holle R, Hinterseer M, Küfner R, Englmeier K-H, Wichmann H-E, and Kääb S for the KORA Study Group: Does Computerized ECG Analysis Provide Sufficiently Consistent QT Interval Estimates For Genetic Research? In: Analysis of Biomedical Signals and Images – Proceedings of the 17th Biennial International EURASIP Conference Biosignal 2004, Brno, Czech Republic, June 23-25, 2004 (Eds. J. Jan, J.Kozumplik, I. Provaznik), Vutium Press, 47-49 (2004)
Perz S, Küfner R, Meisinger C, Ziegler D, Englmeier KH and the KORA Study Group: The Effect of Different QT interval Corrections for Heart Rate on the QT Distributions in Diabetics and Non-Diabetic Subjects. In: Proceedings der 38. DGBMT-Jahrestagung, Ilmenau, 22.-24.9.2004 (Eds. U. Boenick, A. Bolz, 296-297 (2004)
Pfeufer A, Jalilzadeh S, Perz S, Mueller JC, Hinterseer M, Illig T, Akyol M, Huth C, Schopfer-Wendels A, Kuch B, Steinbeck G, Holle R, Nabauer M, Wichmann HE, Meitinger T, Kaab S. Common variants in myocardial ion channel genes modify the QT interval in the general population: results from the KORA study. Circ Res. 2005 Apr 1;96(6):693-701.
GSF- KORA Study Group Perz et al.

Towords Optimisation of QT Correction for Heart Rate
References (3)
Rautaharju PM, Warren JW,Calhoun HP: Estimation of QT prolongation – a persistent and avoidable error in computer electrocardiography. J Electrocardiol 1990, 23, 111-117.
de Bruyne MC, Hoes AW, Kors JA, A. Hofman A,. van Bemmel JH, Grobbee E. Prolonged QT interval predicts cardiac and all-cause mortality in the elderly: The Rotterdam Study. Eur Heart J 1999; 20: 278-84.
Kass RS, Moss AJ. Long QT syndrome: novel insights into the mechanisms of cardiac arrhythmias. J Clin Invest 2003;112(6):810-5.
Busjahn A, Knoblauch H, Faulhaber HD, Boeckel T, Rosenthal M, Uhlmann R, Hoehe M, Schuster H, Luft FC. QT interval is linked to 2 long-QT syndrome loci in normal subjects. Circulation 1999; 99(24):3161-4.
GSF KORA Study Group

Towords Optimisation of QT Correction for Heart RateEvaluation of QT Correction Formulas
Vielen Dank!
QT/QTc Herbstworkshop, Heidelberg, 17.-18.11.2005 Siegfried Perz