Embed Size (px)
Citation preview

Graduate Theses, Dissertations, and Problem Reports
2020
Evaluation of Process and Economic Feasibility of Implementing a Evaluation of Process and Economic Feasibility of Implementing a
Topping Cycle Cogeneration System Topping Cycle Cogeneration System
Unique Karki [email protected]
Follow this and additional works at: https://researchrepository.wvu.edu/etd
Part of the Energy Systems Commons
Recommended Citation Recommended Citation Karki, Unique, "Evaluation of Process and Economic Feasibility of Implementing a Topping Cycle Cogeneration System" (2020). Graduate Theses, Dissertations, and Problem Reports. 7737. https://researchrepository.wvu.edu/etd/7737
This Thesis is protected by copyright and/or related rights. It has been brought to you by the The Research Repository @ WVU with permission from the rights-holder(s). You are free to use this Thesis in any way that is permitted by the copyright and related rights legislation that applies to your use. For other uses you must obtain permission from the rights-holder(s) directly, unless additional rights are indicated by a Creative Commons license in the record and/ or on the work itself. This Thesis has been accepted for inclusion in WVU Graduate Theses, Dissertations, and Problem Reports collection by an authorized administrator of The Research Repository @ WVU. For more information, please contact [email protected].

Graduate Theses, Dissertations, and Problem Reports
2020
Evaluation of Process and Economic Feasibility of Implementing a Evaluation of Process and Economic Feasibility of Implementing a
Topping Cycle Cogeneration System Topping Cycle Cogeneration System
Unique Karki
Follow this and additional works at: https://researchrepository.wvu.edu/etd
Part of the Energy Systems Commons

Evaluation of Process and Economic Feasibility of Implementing a
Topping Cycle Cogeneration System
Unique Karki
Thesis submitted to the Benjamin M. Statler College of
Engineering and Mineral Resources at
West Virginia University
in a partial fulfillment
of the requirement for the degree of
Master of Science
in
Industrial Engineering
Bhaskaran Gopalakrishnan, Ph.D., P.E., Chair
Ashish Nimbarte, Ph.D.
Kenneth H. Means, Ph.D., P.E.
Department of Industrial and Management Systems Engineering
Morgantown, West Virginia
July 2020
Keywords: Topping Cycle CHP, Cogeneration, Steam Boilers, Economics
Copyright 2020 Unique Karki

Abstract
Evaluation of Process and Economic Feasibility of Implementing a Topping Cycle
Cogeneration System
Unique Karki
Industrial applications that require steam for their end-uses generally utilize steam boilers that are
at higher size than what is typically required. Similarly, gas turbine-based power plants corroborate
the gas turbine system and eventually relieve the exhaust into the atmosphere. These facilities
include food, paper, chemicals, refining, and primary metal manufacturing industries. This
research focuses on the scope of a topping cycle combined heat and power (CHP) system by
pushing the load on the boiler to a higher limit, or a gas turbine operation in place of a boiler
system for a topping cycle CHP and its economic feasibility by utilizing the turbine exhaust to
achieve the technological and economical evaluation of a CHP system. The excess steam is run
through a condensing steam turbine to generate power that can offset the facility’s electricity usage
cost and under favorable conditions, sell electricity back to the grid. Similarly, the steam turbine
outlet water can be used to satisfy the plant’s heating needs in the form of comfort and district
heating. A decision tool was developed to evaluate the technical and economic feasibility of a
topping cycle CHP system, which can emulate a given facility’s steam or gas system and its
operational parameters with steam turbines. It will help the user realize the point of breakeven (in
terms of fuel cost incurred and overall cost savings) at the desired steam flow rate for a
corresponding boiler system. Similarly, sensitive analysis of energy, power, cost savings, and
payback of investment to boiler and steam parameters is also carried out. The research would
provide necessary insights into the most appropriate parameters that will enable a CHP system to
be advantageous in technical and economic aspects. The research determines that the fuel cost,
electricity cost, and the steam quantity flowing through the turbines are the most important
parameters for a desirable payback on the investment.

iii
Dedication
To my beloved Dad, Bharat, and my late mother, Jamuna, for endless love, compassion and
support, and my little brother, Aryan; the pillar of my life.

iv
Acknowledgment
I would like to wholeheartedly express my sincerest gratitude and appreciation to my research
advisor and committee chair, Dr. Bhaskaran Gopalakrishnan for his motivation, persistence, and
immense knowledge that he bestowed upon me during this adventure. My journey throughout
graduate school, academic research, and later, the profession I chose arose from his continual and
everlasting support. With his unwavering guidance and humility, he made me believe that big
things happen if you work enough. Needless to say, without his mentorship and assistance, this
research would not have been possible. I would also like to sincerely thank my committee member
Dr. Ashish Nimbarte for assisting me academically and professionally during my studies and
research. He was a constant mentor and a confidante, who always helped me in every instance. I
would like to thank my committee member, Dr. Kenneth Means, for his time and support, and for
alternative feedbacks to the research.
I would also like to acknowledge my friends and family, who were always there in the form of
constant joy and support. And finally, my little brother, who is more like a big brother to me, for
always showering me with advice.

v
Table of Contents
Abstract ........................................................................................................................................... ii
Dedication ...................................................................................................................................... iii
Acknowledgment ........................................................................................................................... iv
List of Figures .............................................................................................................................. viii
List of Tables .................................................................................................................................. x
Nomenclature ................................................................................................................................. xi
1 Introduction ............................................................................................................................. 1
1.1 Fossil fuel usage and need for energy efficiency measures ............................................. 4
1.1.1 Energy efficiency significance .................................................................................. 4
1.1.2 Exergy losses in the system ...................................................................................... 5
1.1.3 Shale gas vs. conventional fuels in energy-efficient systems ................................... 6
1.2 Type of CHP Systems ...................................................................................................... 7
1.2.1 Topping Cycles ......................................................................................................... 7
1.2.2 Bottoming Cycles...................................................................................................... 8
1.2.3 Combined Cycles ...................................................................................................... 9
1.3 Discussion on topping and bottoming cycles ................................................................. 10
1.4 Parameters to be studied ................................................................................................. 11
1.4.1 Boiler Parameters .................................................................................................... 12
1.4.2 Heat Recovery Options ........................................................................................... 14
1.2.3 Process Support Equipment .................................................................................... 16
1.2.4 Miscellaneous ......................................................................................................... 18
1.5 Need for Research .......................................................................................................... 20
1.6 Research Objectives ....................................................................................................... 21
1.7 Limitations ..................................................................................................................... 22
1.8 Conclusion ...................................................................................................................... 23
2 Literature Review .................................................................................................................. 24

vi
2.1 Applications and workings of CHP systems .................................................................. 24
2.2 Feasibility Study of CHP systems .................................................................................. 25
2.3 Energy Efficiency Study in CHP systems ...................................................................... 28
2.4 Design and operational parameters studies .................................................................... 30
2.5 Power generation and its integration to the grid ............................................................ 37
2.6 Conclusion ...................................................................................................................... 38
3 Research Approach ................................................................................................................ 39
3.1 Data Collection ............................................................................................................... 39
3.2 Variable determination ................................................................................................... 41
3.3 Generation of DSS ......................................................................................................... 41
3.4 Data analysis using the DSS........................................................................................... 41
3.5 Results ............................................................................................................................ 42
3.5.1 Block diagram of the CHP system .......................................................................... 42
3.6 Model ............................................................................................................................. 42
3.6.1 Detailed calculations ............................................................................................... 47
3.6.2 Savings and payback on investment ....................................................................... 47
3.6.3 Sensitivity analysis.................................................................................................. 47
3.7 Conclusion ...................................................................................................................... 48
4 Model Development .............................................................................................................. 49
4.1 Assumptions ................................................................................................................... 49
4.2 Input Parameters and tabs .............................................................................................. 49
4.2.1 Boiler-based CHP system ....................................................................................... 51
4.2.2 Gas turbine-based CHP system ............................................................................... 53
4.3 Process and calculations ................................................................................................. 54
4.3.1 Boiler-based CHP system ....................................................................................... 54
4.3.2 Gas-turbine based CHP system ............................................................................... 58
4.4 Output spreadsheet ......................................................................................................... 59
4.5 Conclusion ...................................................................................................................... 66
5 Model Execution ................................................................................................................... 67
5.1 Boiler-based CHP system .............................................................................................. 67

vii
5.1.1 Verification process ................................................................................................ 67
5.1.2 Boiler diagram ........................................................................................................ 69
5.1.3 Results ..................................................................................................................... 70
5.1.4 Sensitivity Analysis ................................................................................................ 72
5.1.5 Key findings ............................................................................................................ 76
5.2 Gas turbine-based CHP system ...................................................................................... 76
5.2.1 Verification process and block diagram ................................................................. 76
5.2.2 Results ..................................................................................................................... 80
5.2.3 Sensitivity analysis.................................................................................................. 80
5.2.4 Key findings ............................................................................................................ 85
6 Conclusion and Future Work ................................................................................................. 87
7 Bibliography .......................................................................................................................... 90

viii
List of Figures
Figure 1-1: CHP as a Percentage of National Generating Capacity [3] ......................................... 3
Figure 1-2: Thermodynamic cycles arranged according to their stack temperature range [10] ... 10
Figure 1-3: Energy consumption breakdown in the United States, 2018 [24].............................. 20
Figure 2-1: Commercial Businesses with Topping Cycle CHP Systems, 2014 [46] ................... 35
Figure 2-2: Commercial Business Prime Mover in CHP Systems, 2014 [46] ............................. 35
Figure 3-1: Design of the Decision Support System - 1 ............................................................... 45
Figure 3-2: Design of the Decision Support System – 2 .............................................................. 46
Figure 3-3: Primary spreadsheet ................................................................................................... 46
Figure 4-1: COGENTEC input screen-1....................................................................................... 51
Figure 4-2: COGENTEC input screen-2....................................................................................... 52
Figure 4-3: COGENTEC input screen-2....................................................................................... 52
Figure 4-4: Gas turbine-based CHP input screen ......................................................................... 53
Figure 4-5: Computation of boiler-based CHP parameters-1 ....................................................... 54
Figure 4-6: Computation of boiler-based CHP parameters-2 ....................................................... 55
Figure 4-7: Computation of boiler-based CHP parameters-3 ....................................................... 57
Figure 4-8: Computation of gas turbine-based CHP parameters-1 ............................................... 58
Figure 4-9: Computation of gas turbine-based CHP parameters-2 ............................................... 58
Figure 4-10: Buttons to move between spreadsheets .................................................................... 59
Figure 4-11: Boiler diagram result using a condensing turbine ................................................. 60
Figure 4-12: Payback on investment result and sensitivity analysis graphs ................................. 62
Figure 4-13: Gas turbine-based CHP results ................................................................................ 63
Figure 4-14: Gas turbine-based CHP (Backpressure turbine) ...................................................... 64
Figure 4-15: Gas turbine-based topping cycle CHP (condensing turbine) ................................... 65
Figure 5-1: Input values for the facility-Part 1 ............................................................................. 68
Figure 5-2: Input values for the facility- Part 2 ............................................................................ 69
Figure 5-3: Results for the boiler-based CHP cycle ..................................................................... 70
Figure 5-4: Boiler diagram using a condensing turbine ................................................................ 71
Figure 5-5: Pinch analysis between input and output parameters – Part 1 ................................... 72
Figure 5-6: Pinch analysis between input and output parameters – Part 2 ................................... 73
Figure 5-7: Sensitivity analysis on payback on investment period to NG and electricity usage cost
....................................................................................................................................................... 75

ix
Figure 5-8: Pinch analysis between the payback on investment period, natural gas cost and
electricity usage cost ..................................................................................................................... 75
Figure 5-9: Input values with the UMass Amherst Case study [55] ............................................. 77
Figure 5-10: Case study input and output parameters [55] ........................................................... 78
Figure 5-11: Gas-turbine based CHP system output..................................................................... 79
Figure 5-12: Results ...................................................................................................................... 80
Figure 5-13: Gas Turbine Pinch analysis graphs - 1 ..................................................................... 82
Figure 5-14: Gas Turbine Pinch analysis graphs - 2 ..................................................................... 83
Figure 5-15: Gas turbine Pinch analysis graph - 3 ........................................................................ 84
Figure 5-16: Impact of varying electricity and natural gas cost on payback on investment ........ 85

x
List of Tables
Table 1-1: CHP Capacity by state (2012) [3] ................................................................................. 2
Table 1-2: Applications of gas and steam turbines [18] ............................................................... 16
Table 3-1: Quantitative values of the parameters ......................................................................... 40
Table 5-1: Key findings for the Boiler-based CHP system .......................................................... 76
Table 5-2: Key findings for the gas turbine-based cogeneration system ...................................... 85

xi
Nomenclature
CHP Combined Heat and Power
COGENTEC Cogeneration Topping Cycle Evaluation
MW Megawatt
kW Kilowatt
CO2 Carbon dioxide
HVAC Heating, Ventilation, and Air Conditioning
SRC Steam Rankine Cycle
ORC Organic Rankine Cycle
MMBtu Metric Million British Thermal Unit
DSS Decision Support System
PRV Pressure Reducing Valve
B.P. Backpressure Turbine
DSIRE Database of State Incentives for Renewables and EfficiencyR
HRSG Heat Recovery Steam Generator
EPA Environmental Protection Agency
kWh Kilowatt-hour
MWh Megawatt-hour
PP Pinch Point
AP Approach Point
dT Difference in Temperature
SSMT Steam System Modeler Tool
TWh Terawatt-hour
PLC Programmable Logic Controller
EA Excess air %
SR Stoichiometric Ratio
Cpg Specific heat capacity of combustion gas
PA Pre-heated combustion air
LHV Lower heating value of fuel
HHV Higher heating value of fuel
BS Boiler savings with burner controls

xii
TR Initial temperature rise during combustion
hs Specific enthalpy of inlet steam
hprv Specific enthalpy of PRV outlet steam
hmw Specific enthalpy of makeup water
1
1 Introduction
Cogeneration (Combined Heat and Power, CHP) is the concurrent generation of mechanical power
(electrical energy) and useful thermal energy from process heating systems such as furnaces,
heaters, and kilns. It is prevalently used to retrieve the lost thermal energy, in the form of stack
gases or steam, from those processes to generate electricity, thereby reducing the total energy usage
(fuel consumption and electrical energy) and emissions of greenhouse gases. It delivers fuel and
electrical energy services to industries in a single energy-efficient step. A typical CHP system
consists of on-site electrical generators, prime movers, and fossil fuel-fired equipment (boilers/gas
turbines). The exhaust from these machines is distributed, thereby producing energy, increasing
efficiency, reliability and simultaneously reducing losses on the system. Reliability is reasonably
increased by installing these systems as they increase the facility’s resiliency by mitigating the
adverse effects on the facility without affecting its runtime during power outages. The reliability
and significantly higher efficiency as compared to the conventional generation of heat and power
make CHP systems lucrative in industries and residential areas.
Properly designed CHP systems offer efficiencies greater than most other sources, including steam
turbines. Similarly, CHP systems have higher efficiency and lower electricity and heat cost. They
can often achieve total system efficiencies of 60%–80% compared to only about 45%– 50% for
conventional separate heat and power generation (total system efficiency is the sum of power and
useful thermal energy divided by the fuel consumption to generate both energy services) by
avoiding losses and capturing heat energy typically wasted in power generation to provide heating
and cooling [1]. The most prevalent method of electricity generation conventional power plants
that use fossil fuels for combustion. However, this system can also be operated by the utilization
of renewable fuels such as biomass as the main source of fuel. Adequate availability of energy is
significant for the economic development of a nation. Abuelnuor et al. [2] state that 80% of the
electricity in the world is generated by thermal and natural gas power plants. Going forward with
this scenario and existing energy policies around the world, this number is unlikely to decelerate.
This can be attributed to the higher unit cost of renewable energy resources than that of
conventional energy resources. However, in recent years, renewable energy sources, CHP, waste

2
heat recovery, and combined cycle power generation are emerging with positive impacts. An
increase in methods of combined heat and power generation has brought forward numerous
parameters that aid in the higher efficiency of the process. Therefore, discovering optimal working
conditions based on different parameters can be a novel approach to achieve higher efficiencies in
these plants. These analyses would pave the path for better plant efficiency, energy savings,
economic benefits, and greenhouse gas emission reduction. However, manipulation of the
parameters should not be done sporadically as the economic aspects of CHP plants are relatively
more sensitive to change in input parameters than that of classical power plants.
Table 1-1: CHP Capacity by state (2012) [3]
CHP Capacity States in the U.S.
>2,000 MW
Alabama, California, Florida, Indiana,
Louisiana, Michigan, New Jersey, New York,
Oregon, Pennsylvania, Texas
1,000-1,999 MW
Georgia, Illinois, Massachusetts, North
Carolina, South Carolina, Virginia,
Washington, Wisconsin
400-999 MW
Arkansas, Colorado, Connecticut, Iowa,
Maine, Maryland, Minnesota, Mississippi,
Ohio, Oklahoma, Tennessee
100-399 MW
Arizona, Idaho, Kansas, Kentucky, Missouri,
Montana, Nebraska, Nevada, New Mexico,
Utah, West Virginia, Wyoming
<100 MW
Alaska, New Hampshire, Hawaii, North
Dakota, Rhode Island, South Dakota,
Vermont
While CHP is a relatively older technology, its usage in the United States is minimal. On the other
hand, European countries (Denmark, Finland, and Russia) are the global leaders in the
implementation of CHP systems [4], [5]. They have performed excellent work in cutting back
fossil fuel usage by notably increasing the culture of these systems in industries, government

3
offices, and residential areas. They are performing exceptionally well in generating renewable
energy resources from wind, water, and CHP, thereby bringing the country closer to their mission
of zero-carbon emissions. A recent decline in wind energy and sea-water level in Denmark made
the CHP system more popular, resulting in the Danish government turn more aggressive in
embracing the CHP culture. Denmark uses bioenergy such as wood, straws, and other
biodegradable waste products instead of coal and natural gas to generate heat and power. This
novel solution decreases the usage of fossil fuels by a huge margin. Similarly, Italy also has a
tremendous amount of power generation from CHP systems. However, their power generation is
still attributed to the usage of natural gas. The industries are provided with lucrative incentives to
invest and implement in CHP plants. This is a major obstacle in the United States. Many industries
have huge potential to install CHP systems, which would generate more power than they use.
However, the incentives and the price of electricity per unit are not sustainable if it is sent back to
the grid, due to which industries are hesitant to implement it.
Figure 1-1: CHP as a Percentage of National Generating Capacity [3]
1%3% 3% 3%
5% 6% 7% 8% 8% 9%
12% 12%15% 16% 16%
19%
29%31% 32%
39%
52%
0%
10%
20%
30%
40%
50%
60%

4
1.1 Fossil fuel usage and need for energy efficiency measures
1.1.1 Energy efficiency significance
Most industrial and thermal power plants are highly energy-intensive. They use natural gas, coal,
and fuel oils to operate their manufacturing processes. Similarly, power plants solely generate
electricity by burning coal and natural gas in the presence of air as the primary fuel, thereby
producing combustion gas to operate gas turbines. Gas turbines are connected to power generators
that generate electricity by utilizing the mechanical energy produced by the turbines in the
generators. However, in order to produce the required amount of electrical energy, a tremendous
amount of energy must be supplied in the form of natural gas and coal. The usage of these forms
of energy sources depletes the contents in the energy reservoirs accumulated on the planet during
the span of millions of years. Similarly, the combustion of these fossil fuels aggravates the negative
impact of greenhouse gases in the atmosphere by increasing it astronomically by greenhouse gases.
It is identical in different industrial plants that specialize in the manufacturing of fiberglass, water
and wastewater, metal fabrication, pulp and paper, and chemicals. These industries use fossil fuels
directly as well as energy in the form of electricity. Irrespective of the method of energy
consumption, it is evident that industries require a large amount of energy to operate.
The high usage of fossil fuels has adverse effects on the environment and the entire planet. The
first negative effect is the depletion of energy resources that were formed meticulously in the span
of millions of years. The human civilization has no method to mass-produce fossil fuels that can
satisfy the needs of the planet. Shafiee et al. [6] derived a new formula using the Klass decision
support system and estimated that the worldwide reservoir for oil, coal, and gas will be
extinguished in approximately 35, 107, and 37 years respectively. The urgency of this depletion
should not be neglected. Similarly, the second effect of a high amount of fossil fuel usage is the
greenhouse gases that are produced due to their combustion. Fossil fuels produce a large amount
of CO2 that is trapped in the atmosphere, thereby increasing the global temperature, leading to
climate change. Moreover, the usage of fossil fuels contributes to water pollution and land
degradation. Coal runoff, oil leaks, and fracking lead to pollution of water resources such as rivers,
lakes, and oceans. Finally, mining and oil extraction involve large masses of lands in the form of
extraction, transportation, and distribution. The extraction, transportation, and usage of fossil fuels

5
have detrimental effects on all living beings on the planet. Therefore, it is of utmost importance to
embrace clean energy with immediate effect, to decelerate climate change. One of the major ways
of lessening the usage of fossil fuel for industries and power plants is to implement CHP systems.
These systems can be used to produce onsite electricity and offset electrical and thermal energy
usage and cost in the respective plants. Moreover, the industrial plants can also sell excess
electrical energy back to the power grid, thereby reducing the load on the thermal power plants
eventually.
1.1.2 Exergy losses in the system
Similarly, exergy losses should be accounted for in CHP plants to increase the overall efficiency.
Exergy losses in a CHP system can be defined as the amount of reversible work that can be
obtained at a maximum rate to achieve the system’s equilibrium to that of the environment. The
exergy analysis profusely includes the second law of thermodynamics, where a maximum entropy
is achieved. In an irreversible process, decreasing exergy losses amount to an increase in the
overall efficiency, thereby decreasing the amount of fossil fuel consumption and greenhouse gas
emissions. The exergy losses can occur mostly in the heat exchangers, combustion chambers of a
gas turbine system and boilers, and waste heat. These losses can be mitigated to achieve higher
energy and cost savings in the facility. Similarly, the exergy production cost is an important factor
that should be analyzed by the facilities in their processes. The exergy cost of steam, waste heat,
and electricity should be considered and mitigated individually to minimize the cost of the
operation of a CHP system. The second law of thermodynamics formula calculates the exergy
losses in the system, that can be quantified and ranked among other exergy losses. The highest
exergy losses in the system components should be dealt with first, followed by the remaining
losses. By following these sequences of operations, exergy losses can be acknowledged and
decreased in a CHP power plant. The research does not advertently address the exergy losses in
the system; however, CHP plants have to include mitigation of exergy losses in system components
such as boiler and gas turbine combustion chambers, heat exchangers, compressors and boiler
walls to achieve higher power and minimal losses in the system.

6
1.1.3 Shale gas vs. conventional fuels in energy-efficient systems
The discovery of adequate shale gas in the United States has made it simpler and effective to
procure it for industrial, commercial, and residential usages [7]. Shale gas is a form of natural gas
found within the shale formations. The impact of shale gas in the industrial sector has been
tremendous, and the trend of this usage has rapidly spread throughout the world. One of the major
advantages of shale gas is that it produces lesser CO2 than that of coal and oils. The marginal cost
of shale gas in the United States is approximately $4/MMBtu at the current time. Similarly, shale
gas has been used instead of coals due to the amendments in the Clean Air Act, which is a sign of
what is to come in terms of fuel consumption [7]. People constantly move to cheaper and better
sources, which is why the shale gas boom is prevalent in this century. Researchers concur that due
to the abundance availability of shale gas, it will be readily available for a cheap price in the long
run. With such innovations, shale gas can be used as the fuel in CHP systems to get better energy
savings at a reduced cost, while also acquiring energy efficiency incentives from the federal and
state governments.
CHP systems have a great potential to offset the energy usage and cost in industrial and power
plants. Steam can be generated by directly using fuel or by utilizing waste heat from the stack to
generate steam. The process where steam is generated by utilizing fuel for combustion is called a
topping cycle CHP. Similarly, the process where the steam is generated by utilizing the heat
content in the boiler/furnace stack to generate steam and use a steam turbine to generate electricity
is called a bottoming cycle CHP. Topping cycle requires additional fuel whereas the bottoming
cycle does not require additional fuel to operate. Similarly, the topping cycle and bottoming cycle
can be operated simultaneously to achieve higher efficiencies and yields, resulting in a combined
cycle CHP system. In a typical industrial setting where boilers and furnaces are used for process
heating, topping cycle is an ideal solution for offsetting energy costs. The plants can generate
electricity and heat that can be used to offset their electricity usage cost and natural gas cost by
utilizing the substitute heat generated from the cycle. Industrial plants that do not operate their
boilers/furnaces at full load are a perfect candidate to embrace the topping cycle CHP for energy
cost reduction. Similarly, thermal power plants are also applicable to the topping cycle CHP. The
processes in thermal power plants generate flue gases with high-grade heat content. These flue

7
gases can be used in gas turbines to generate electricity, and the medium grade heat exiting out of
the gas turbines can be used to generate steam for power and heat generation.
CHP systems can increase the efficiency of fuel use: the combined production of electricity and
heat, is apparently, more efficient than that of a separate production. These qualities are well-
known, but there has been difficulty in assessing the efficiency of combined heat and power since
the inception of this technology in the past. However, in recent times, implementing combined
heat and power in the industries to increase the plant overall efficiency is becoming easier and
common. Wang et al. [8] enhanced different CHP plants’ performance implemented in the cement
industry to recover the available waste heat. The authors reviewed several industrial facilities,
identifying the most appropriate CHP technology for each of them according to the facility size.
For the topping cycle, CHP systems can satisfy the electric demand at full load. In these
configurations, however, the heat demand might not be fully satisfied, and an auxiliary boiler
might be needed to satisfy the remaining thermal load. This mode of operation is bound to make
the plant self-sufficient in terms of electric loads, avoiding energy exchanges with the grid. CHP
can be implemented using three different cycles (i) topping cycle, (ii) bottoming cycle, and (iii)
combined cycles. In this section, the main goal is to study the workings and principles of the
respective cycles.
1.2 Type of CHP Systems
1.2.1 Topping Cycles
U.S. DOE’s Office of Efficiency and Renewable Energy (EERE) defines the topping cycle as “an
approach where fuel is used first to generate electricity or mechanical power in a “prime mover”
such as a gas turbine or reciprocating energy. Exhaust energy is captured and used for a secondary
purpose, such as heating or cooling the facility [9].” As, the amount of heat required in a facility
is proportional to the amount of fuel used, topping CHP systems are generally designed to satisfy
a baseload thermal demand of a facility. The topping cycle is the most prevalent form of CHP,
barring some industries where high-grade heat is required. Steam produced by the boilers is at the
required pressure and temperature for the process. Therefore, if the boiler is operating at full load
producing steam for the processes only, the topping cycle cannot be implemented. However, if the
boiler is working at a partial-load, then it can be pushed to work at full-load, and the excess steam

8
generated can be expanded in a steam turbine coupled to a generator to generate electricity.
Similarly, the rejected heat from the boiler can also be used for manufacturing processes, domestic
heating, and absorption chilling. As the efficiency of the system increases with CHP, there are
higher fuel savings than that of separate thermodynamic cycles.
The topping cycle typically includes gas turbines or a steam boiler as the primary energy
generating equipment. Gas turbines are an excellent candidate for a topping cycle CHP as they
generate a significant amount of electricity as compared to the fuel energy provided to run the
system. Similarly, steam boilers in a topping cycle CHP system generate steam and then, the
electricity. The outlet steam from the steam turbine is used for heating and cooling the facility
through HVAC systems and absorption chillers. This research studies the effects of various
topping cycle parameters on the technical and economic aspects of implementing a topping cycle
CHP system with a boiler or a gas turbine.
1.2.2 Bottoming Cycles
U.S. DOE’s Office of Energy Efficiency and Renewable Energy (EERE) defines bottoming cycle
as “an approach where the fuel is used to provide thermal input to a furnace or other high-
temperature industrial processes, and a portion of the rejected heat is then recovered and used for
power production, typically in a waste heat boiler/steam turbine system [9].” Waste heat from
furnaces and other industrial processes can be classified as a high, moderate, and low grade in
terms of the temperature range. However, only 25% to 30% of the input fuel energy is eventually
converted to usable power, where the remaining energy is dispersed to the environment as waste
heat. It is estimated that a substantial amount of energy can be recovered from waste heat in the
industries and residential areas and utilized to produce additional heat and power. Prevalently,
bottoming cycles are carried out using the Steam Rankine cycle (SRC), Organic Rankine Cycle
(ORC), and Kalina cycle [10]. SRC uses waste heat to generate steam, which subsequently expands
through a turbine, generating power. It can be operated to generate power in the range of 10-1,000
MW with maximum efficiency at the level of 47%. Waste heat temperature of 1,800°F is optimal
to achieve higher efficiency [10]. Korobitsyn, however, states that the performance of SRC
decreases drastically with the reduction in waste heat temperature. In the Steam Rankine

9
Bottoming cycle, electrical efficiencies of up to 58% can be achieved with the plant capacities
within the range of 350 to 500 MW of electrical power [11].
Industries and facilities that have medium and lower grade waste heat are suited for ORC and
Kalina cycles as they have lower boiling points than that of steam at the same pressure. ORC
operates on the same principle as SRC but uses pure, high-pressure organic fluids as well as
organic mixtures that have a lower environmental impact. The working fluids in ORC have been
recorded to have boiling points as low as 164°F [12]. ORC with biomass burner for combustion
and thermal oil as the working fluid to achieve an overall efficiency of 88%. However, more work
must be done to increase the electrical efficiency of CHP which is limited (18%) due to loss of
residual heat. The major drawback of SRC and ORC is its constant temperature of vaporization.
Kalina [13] proposed a novel cycle to substitute steam in an SRC, where a mixture of working
fluids of varying concentration is used to account for the temperature of the hot and cold flows of
the medium. In most Kalina cycles, a mixture of ammonia and water is used. At different points
in the cycle, the fluid composition in the mixture changes as ammonia vaporizes first, thereby
decreasing its concentration which results in the boiling temperature increment of the mixture.
Therefore, the temperature differences between the waste heat and the working fluid result in
efficiency rise in bottoming cycles.
1.2.3 Combined Cycles
Combined cycles corroborate a high-temperature topping cycle and low- or medium-temperature
bottoming cycles. Different cycles such as Otto cycle, joule cycle, and high-temperature fuel cells
operate at high temperatures but generate a lot of waste heat. Combining two cycles increases the
overall efficiency as the heat rejected by one cycle can be utilized by the other cycle that operates
in medium-grade temperature. Korobitsyn [10] ranked the most common cycles according to their
working temperature range, as shown in Fig. 1-2.

10
Figure 1-2: Thermodynamic cycles arranged according to their stack temperature range
[10]
1.3 Discussion on topping and bottoming cycles
Topping and bottoming cycles have distinct differences. Topping cycles use primary fuel to
generate steam and hence electricity whereas bottoming cycles use the exhaust from the fuel using
equipment to generate steam and electricity. The main reason to implement one of these cycles is
solely based on the working conditions of a facility. A facility whose processes require high-grade
steam to operate is a prime candidate for a bottoming cycle. Bottoming cycle utilizes high-grade
waste heat from industrial processes to generate steam at various pressure, which in turn generates
electricity and heat. It does not require additional primary fuel in the furnace if the waste heat is
maintained at the same temperature and mass flow rate. This property makes the bottoming cycle
popular in industries as this cycle re-uses energy from a source that is supposedly transmitted out
of the facility otherwise. However, topping cycle CHP is only possible when additional fuel is
provided to the burner to produce excess steam. This cycle does not require an additional waste
heat recovery boiler, as the primary furnace is used to produce steam. The topping cycle can be
implemented by any facility which does not run its boilers at full load. If a boiler is working at full
load and the process uses all the generated steam, then a topping cycle CHP cannot be
implemented. Therefore, the main parameters required for a bottoming cycle and a topping cycle

11
are the temperatures of the waste heat and the possibility of high enthalpy excess steam generation
respectively. The intended purpose of these processes is the same; however, the processes are
fundamentally different.
Another difference between these two cycles is that the topping cycle primarily focuses on the
electrical power generation whereas the bottoming cycle prioritizes heat generation. This is further
evident by the fact that bottoming cycles require high-grade heat to operate. Bottoming cycles can
be of tremendous help in energy-intensive industries such as paper, refining, iron, and steel
industries. From an economic standpoint, the topping cycle offers better effects in terms of energy
savings. The enthalpy of steam can be changed as per the requirement of the cycle to increase the
energy transfer between the steam and the steam turbines, thereby resulting in higher overall
efficiency. In the bottoming cycle, the temperature of waste heat is not a parameter that can be
suitably changed without interfering with the manufacturing process. Therefore, we will be at the
mercy of the manufacturing process parameters in the bottoming cycle.
Topping cycle is a better alternative for a large proportion of industries that produce medium grade
heat for their processes. Lower pressure and temperature of steam are easier to handle without
doing a significant revamp on the process. Moreover, the number of industries that produce
medium grade heat is considerably greater than that of the industries that produce high-grade heat.
Therefore, the application of the topping cycle is very significant in energy savings and greenhouse
gas emissions reduction. As a result, analysis of various operational parameters in the topping
cycle CHP system for attaining favorable economics is studied in this research.
1.4 Parameters to be studied
CHP topping cycles can generate a wide range of power and heat based on the process and
equipment parameters. The parameters can range from the type of equipment such as turbines and
boilers to changes in weather. The study focuses on various parameters that aid the enhancement
of a CHP topping cycle. The parameters studied in this study are described below in brief.

12
1.4.1 Boiler Parameters
A traditional boiler is used to generate steam at required pressure and temperature by burning fuel
such as natural gas, coal, and fuel oil. Topping cycle requires a boiler that can generate excess
steam other than the required processes. The quality of steam can vary with the nature of the fuel
used, controls on the burners, and different supplementary options on the boiler such as heat
recovery, condensate return, and pre-heat using economizers. The nature of the boiler parameters
that can be manipulated to obtain the necessary quality and quantity of steam is described in brief
below.
(a) Boiler Capacity
The capacity of a boiler is typically defined as the amount of steam (in lbs.) produced by the boiler
in an hour. Likewise, the boiler capacity, in some cases, can also be categorized as the amount of
heat transferred from the fuel to the water (in MMBtu per hour). The size of a boiler is directly
proportional to the amount of heat and power that can be recovered. In most facilities, the boilers
are oversized to provide a substantial margin of capacity. It works competently in different
industries; however, the efficiency is lower as most boilers used in typical facilities are
conventional boilers. Higher capacity boilers can be pushed to full-load conditions to produce
larger quantities of steam, thereby increasing the power generation to satisfy the plant’s electrical
demand and sell the remaining power back to the electricity grid. Boilers with different capacities
can be set in the decision support system (DSS) produced from this study to determine the
favorability of a topping cycle system in CHP plants.
(b) Boiler efficiencies
Boiler efficiencies are generally categorized into combustion efficiency and thermal efficiency.
Thermal efficiency is the ratio of steam generated by the boiler to the fuel input. Similarly,
combustion efficiency is the measure of the effectiveness of the transfer of heat content of the fuel
into usable heat. The efficiencies of the boiler system in CHP systems can largely affect the heat
and power generation. The rated input and output capacity differ because of combustion efficiency.
Lower efficiencies would create a higher gap between the input and output capacity and vice versa.
Therefore, the combustion efficiency of a boiler is a significant parameter for the amount of steam
generation. It is largely dependent on steam energy, various losses in the boiler system, and the

13
energy in input fuel. Combustion efficiency, for the most part, is steady. To improve it, the system
must go significant changes and maintenance in the furnace and reduce the loss in flue gases.
However, thermal efficiency depends only upon the energy in fuel and steam. It is also the ratio of
output and input boiler capacity. Thermal efficiency accounts for the heat loss through the boiler
jacket during boiler firing while combustion efficiency does not. The study includes the analysis
of the topping cycle CHP in different combustion and thermal efficiencies.
(c) System losses
The boiler system has various losses that decrease its combustion and thermal efficiencies. Mainly,
the losses are the stack losses and surface heat losses. These losses typically represent about 20%
of the fuel input to the boiler [14]. The stack losses can be of significant importance in the CHP
topping cycle because they can be used to preheat combustion air and boiler feed water using a
heat exchanger and economizer respectively. The various temperatures of stack losses are used in
this study to discern the efficiency of the CHP systems. Similarly, boiler losses are mainly
comprised of surface losses such as radiation and convection. A reduction of surface losses through
convection and radiation can reduce the fuel input, and consequently, increase the overall
efficiency. Energy loss in stack gas is not considered as part of the boiler losses. They are
independent of the amount and nature of fuel-fired in the boiler, but rather depend upon the size
and piping surface area of the boiler system. Boiler losses are estimated to be around 1%-3% of
total fuel energy [15]. Similarly, percentage loss in the process steam is the embodiment of energy
losses due to steam traps, steal leaks, and inadequate surface insulation. This is typical to an
individual facility; therefore, an effect of the percentage of loss in process steam is an important
parameter to determine the CHP properties.
(d) Burner controls and operation
Burner controls in the boiler can significantly increase energy and cost savings. Parameters such
as air-fuel ratio, excess air regulation, and burner modulation can provide better flexibility in the
working of the boiler. These controls help the burner change its settings dynamically as per the
requirements of the process. Fuel saved would result in higher heat and power generation in the
CHP system. The United States has a significant amount of natural gas in its reserve. Therefore,
most industries in the USA use natural gas for combustion. However, various industries throughout

14
the world, where natural gas and other fuel are scarce, still use coal for combustion. Burner controls
help increase the combustion efficiency of the primary heating equipment. The effect of an
operative burner control is explored in this study.
(e) Fuels
The fuels that are considered in this study are coal, natural gas, and #4 fuel oil. These fuels are
widely used, and they produce various amounts of energy during combustion. Single fuel firing in
considered for this study. Similarly, the cost of fuel also plays an important role in deciding the
nature of fuel to be used. The cost of fuel and its combustion property determines the amount of
heat generation and the efficiency of a CHP cycle. Therefore, it is imperative to include various
fuel properties in the study.
(f) Steam and water end-uses
A boiler can generate high pressure and high-temperature steam, which can later be used for
various end purposes. High-pressure steam is generally used in the steam turbines, whereas the
low and medium pressure steams are used in the manufacturing process. Three types of steam are
typically used for the processes (i) high-pressure steam (ii) low-pressure steam, and (iii) saturated
steam. If the process requires low-pressure steam, a Pressure Reducing Valve (PRV), or a
backpressure turbine (B.P.) is used. Backpressure turbines can be used instead of a PRV to generate
electricity while also satisfying the process heating needs concurrently. In cases where saturated
water/steam is needed by the process, PRV with desuperheater is utilized by the DSS. PRVs exhibit
isenthalpic expansion whereas B.P. turbines exhibit isentropic expansion. Similarly, the saturated
water coming out from the steam turbines can be used in comfort heating for the facility. The study
will involve various end-uses requirements in different industries, hospitals, and residential areas
where CHP systems are run.
1.4.2 Heat Recovery Options
a) Pre-heating options
Boiler feedwater and combustion air can often be pre-heated to reduce fuel usage in boilers. A heat
exchanger is used to revert the flue gases (exhaust gas) with high temperatures into the heat
exchanger, where it exchanges heat with the ambient air. An increase in the temperature of the

15
ambient air reduces the energy required by the fuel to carry out combustion. Once the ambient/pre-
heated combustion air is brought into contact with the fuel, there is a sudden rise in internal
combustion temperature in the combustion chamber. The temperature rise is largely dependent
upon the amount of excess air and the type of fuel. The temperature rise of the combustion gasses
can be calculated by subtracting the combustion temperature with ambient/pre-heated combustion
air. Similarly, economizers are used in industries to pre-heat the boiler feed water. The feed water
is sensibly heated by the flue gases to a temperature below its boiling point. Likewise, the heat
exchangers also have a wide range of efficiency. Higher efficiency will result in better heat transfer
between the two fluids, thereby increasing the CHP system’s efficiency. These parameters can be
largely significant in CHP operations, by reducing energy usage and increasing overall system
efficiency.
b) Blowdown
Boiler blowdown is significant for a continued boiler operation because it reduces the quantity of
the chemical concentrations such as chemical solids and dissolved minerals. Without blowdown,
the boiler and its piping could get damaged eventually. However, removing blowdown water
means energy loss in the boiler system. Thermal energy from the blowdown stream can be
recovered in the form of flash steam and pre-heating of makeup water [16]. These two options
must be carried out with precision to remove all the chemical concentrations from the blowdown
stream. As continuous blowdown must be monitored and carried out if the boiler runs, a significant
amount of energy is wasted from this operation. The study accounts for a continuous blowdown
system as most industrial boilers exhibit continuous blowdown. The blowdown recovery is a key
element in energy savings in CHP operation, which would be studied in the DSS.
c) Condensate return
Condensate liquid retains the sensible energy that the steam possessed. Therefore, condensate
liquid can be returned to the boiler to decrease fuel usages and increase boiler efficiency. Another
advantage of using condensate is that it does not have to be treated again if the boiler feedwater is
already treated. Similarly, makeup water cost can also be reduced by using a higher amount of
condensate in the boiler. The amount of condensate return that a facility can achieve plays a

16
significant role in energy cost savings as the condensate can have as much as 16% of the energy
in steam.
1.2.3 Process Support Equipment
a) Steam Turbines
Steam turbines are the prime mover considered in the preliminary portion of this study. The steam
turbines extract the thermal energy from the steam and transform it into mechanical work, and
consequently electricity. The condensing steam turbines can emit significantly low-pressure steam,
which is later condensed in a condenser. Similarly, backpressure steam turbines use up energy in
steam and omit low or medium pressure steam, without condensing the steam. These turbines are
mostly used in power plants where the sole purpose of the processes is to generate electricity.
Steam turbines can be installed in the facility as per the end-uses requirements of steam and hot
water. The cost of a steam turbine normally ranges from $1,136/kW for a 500 kW steam turbine
to $666/kW for a 15,000 kW steam turbine, while $682/kW for a 3,000 kW steam turbine at the
current time [17].
Table 1-2: Applications of gas and steam turbines [18]
CHP System Advantages Disadvantages Overall
Efficiency Sizes
Gas Turbine
-High reliability
-Low emissions
-Less cooling
required
-Requires a high-pressure
gas compressor
-Poor efficiency at low
loading
-Output falls as ambient
temperature rises
66% to 71% 500 kW to
300 MW
Steam Turbine
-Higher efficiency
-Flexibility in fuel
type
-Long working life
-High reliability
-Slow startup
-Low power to heat ratio Up to 80%
50 kW to
300+ MW
b) Gas Turbines
Gas turbines are fundamentally different from that of the steam turbines. Gas turbines are used
while there is a significant need for power generation (typically 25 MW to 300 MW). They utilize
air as the working fluid and work on the principle of the Brayton cycle [10]. Atmospheric air is
17
brought into the system and compressed by a compressor. Like most of the internal combustion
engines, fuel is injected into the compressed air to actuate ignition, thereby creating combustion
energy with high energy content. The gas, then, enters the turbine and expands by transferring its
heat energy to the mechanical energy in the turbines and consequently, electrical energy in the
turbine generator. Power plants can implement topping cycle CHP by generating steam from the
exhaust gas coming out of the gas turbines. The usage of gas turbines to operate a topping cycle
CHP cycle is studied in this research by keeping in mind about different power plants that might
be releasing the medium grade heat gas into the atmosphere. The typical cost of a gas turbine
system is $3,320/kW for a 3,300 kW gas turbine, $2,817/kW for a 4,324 kW gas turbine,
$2,017/kW for a 7,487 kW gas turbine and $1,276/kW for a 40,485 kW gas turbine at the current
time [19].
c) Pressure Reduction Valves (PRV)
The high-pressure steam generated by the boilers is not necessary for every industrial process.
Most of the time, the generated steam is only used in the manufacturing processes. Therefore,
pressure reduction valves are used in various sectors where steam at different pressures is required.
Similarly, a facility might have more than one type of turbine based on its operation at different
pressures. Low pressure, medium pressure, and high-pressure turbines can be run using steam at
different pressures, which can be readily obtained using PRVs.
d) Deaerators
Boiler deaerators are commonly used to remove dissolved oxygen and CO2 from the boiler
feedwater. The removal of these gases prevents corrosion due to oxidation and gas attachment in
the boiler system. If the boiler feedwater is treated effectively, then the amount of blowdown water
will be reduced, preventing energy and volumetric losses in the system.
e) Condenser
Condensers are significant when a facility uses steam turbines. The condensers cool the steam and
achieve phase change from steam to water. However, if a backpressure steam turbine is used, the
condensers are not implemented, as the steam coming out of these turbines are used in different

18
operations. Condensate from the condenser can be cycled back to the boiler and mixed with boiler
feed water to reduce fuel usage. Various condenser parameters will be analyzed in the DSS.
f) Absorption Chillers
Absorption chillers work based on separating and recombining working fluids with the help of
low-pressure steam or hot water to produce cooling. Low-pressure steam from a backpressure
turbine is a prime candidate for facilities to implement absorption chillers instead of mechanical
chillers. The overall cost of an absorption chilling system is $1,800/nominal ton at the current time
[20]. Also, 15 psig of low-pressure steam flowing at 5,400 lbs./hr would produce 300 nominal ton
of cooling [21]. These values are integrated into this research for calculations.
g) Piping
The overall piping in the CHP system changes the efficiency and output of the CHP system.
Various sizes of pipes would change the flow rate and the pressure of the steam. Similarly, there
will be a significant amount of losses if the piping is not insulated. This study will involve the
insulation of pipes at various levels to calculate the overall heat loss and power generation due to
its effect.
1.2.4 Miscellaneous
a) Weather
Various ambient air conditions throughout the air induce certain changes in the combustion in the
boiler. When the ambient air temperature is lower, the pre-heater has to transfer more heat to raise
the temperature, which in turn, would require more fuel consumption for combustion. Therefore,
the fuel consumption would be different for the same amount of ambient air during a different time
of the year.
b) Grid Interconnection cost
One of the most difficult challenges in operating a successful CHP system is a favorable grid
interconnection cost for the facilities and the utilities. The inevitable increase in different
renewable sources of energy would lead to the revision of interconnection requirements and
processes. Numerous states in the US have various grid interconnection costs, but the similarity

19
among all the states and the utilities is that the grid interconnection cost is high. Bird et al. [22]
listed out three major interconnection challenges (i) scarce information about the grid (ii)
unnecessary equipment requirements (iii) lack of consistent equipment requirements. The
development in grid interconnection has a long way to go. The main scope of the grid
interconnection cost is to incorporate it with the CHP system to calculate the actual payback on
investment of the system.
Similarly, CHP systems are also an example of a distributed generation. It paves the way for an
industry or a commercial facility to connect to the grid and supply clean and reliable electricity.
One of the other major advantages of distributed generation is the changes in electricity prices
based on time of day (spot trading). Major energy-efficient states in the U.S. have distributed
generation where the electricity price changes at on-peak and off-peak periods. Applying
engineering analysis to the distributed generation would result in higher cost savings and cleaner
energy.
c) Cost of electricity sold
The cost of the electricity sold is significantly dependent on the grid interconnection cost and its
integration. As of now, the cost of integrating a facility to a grid and the price of electricity sold to
the grid are contrary to what the facility pays for purchasing the electricity. The study will involve
various selling prices of electricity in the calculations so that the DSS can be used in most of the
US.
d) Clean energy incentives
There are wide ranges of incentives available in the United States when there is an adequate
amount of renewable energy generation. DSIRE is one of the most inclusive sources in the United
States to explore different energy efficiency and renewable energy incentives [23]. The incentives
can be filtered as per the states and utility providers. It is an initiative run by North Carolina State
Clean Energy Technology. They synthesize several DSSs to help search federal and state-level
energy efficiency incentives which are up to date. Similarly, they also manage archives of the older
policies for reference. The site mostly brings forth renewable energy incentives including wind,
solar, geothermal, and hydropower energy; however, there are various energy efficiency incentives
20
by reducing energy usage and cost in the plant. Facilities throughout the United States can explore
in detail the DSIRE incentives before and after implementing the CHP systems to offset their
implementation cost.
1.5 Need for Research
With modernization and industrialization of facilities still on a growing trend to stand out in the
global avenue, most industries must increase their production on all fronts. An increase in
production is often accompanied by an increase in energy usage. Fossil fuels are the most
consumed form of energy on the planet. The overall percentage of fuel consumption in the United
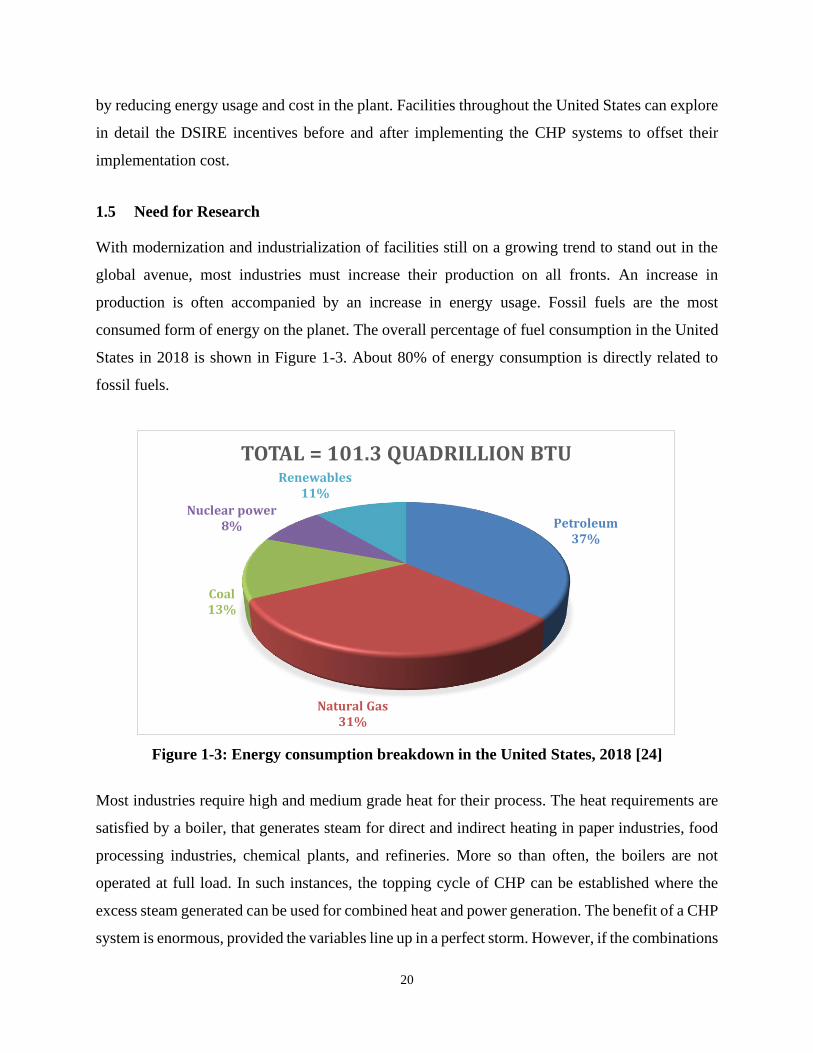
States in 2018 is shown in Figure 1-3. About 80% of energy consumption is directly related to
fossil fuels.
Figure 1-3: Energy consumption breakdown in the United States, 2018 [24]
Most industries require high and medium grade heat for their process. The heat requirements are
satisfied by a boiler, that generates steam for direct and indirect heating in paper industries, food
processing industries, chemical plants, and refineries. More so than often, the boilers are not
operated at full load. In such instances, the topping cycle of CHP can be established where the
excess steam generated can be used for combined heat and power generation. The benefit of a CHP
system is enormous, provided the variables line up in a perfect storm. However, if the combinations
Petroleum37%
Natural Gas31%
Coal13%
Nuclear power8%
Renewables11%
TOTAL = 101.3 QUADRILLION BTU

21
of variables are not optimal, the system is not technically and economically feasible. Much
literature has been focusing on the bottoming cycle of the CHP, where the flue gases are used to
generate steam in a Heat Recovery Steam Generator (HRSG) to drive the prime mover and
generate electricity and heat. The existing research findings in the bottoming cycle (mostly with
gas turbines and their parameters) pertaining to their energy and exergy analysis do not help
comprehensively in the analysis of the technical and economic feasibility for a topping cycle CHP
in industries.
Therefore, the industrial plants can make extensive use of a Decision Support System (DSS) that
can help them evaluate the feasibility of a topping cycle CHP for their existing processes. It can
help them to devise the advantages and the disadvantages of monetary, power, and energy
considerations based upon the demand side over time. These results can be found out by using a
DSS where a user can enter the input variables, vary the values of the variables based on the ranges
that do not affect the existing system and obtain, for each case, the changes in technological and
economic feasibility. A contradictory situation with the absence of a DSS would lead to a facility
follow the path set up by a vendor, without realizing whether it is economically viable or not.
Similarly, it is a complicated task to commence a plan for a system as big as CHP in industries.
Convincing the upper management to implement new processes can be a daunting task for the
employees. For a topping cycle, there are minimally available programs that would evaluate the
feasibility of the system based on the equipment and operating parameters in their processes. This
study further aids the industries to procure the economic benefits or loss pertained by incorporating
a CHP system. A DSS will bridge the gap between an idea and its implementation by incorporating
mathematical values and measurements.
1.6 Research Objectives
The main objectives of this study are listed below:
1. Design and develop a spreadsheet-based DSS to analyze and study the process and
economic feasibility of the topping cycle CHP system.
2. Pinch analysis of energy, process heat, cost parameters related to the technical and
economic feasibility of a topping cycle CHP system.

22
3. Verification of the DSS.
The primary objective of this research is to study the topping cycle of CHP using a boiler, various
end uses and the dominant variables, and their effect on desirable economic benefits. Implementing
CHP is a necessary step towards energy usage reduction and clean energy. However, the challenges
of recognizing a successful system before implementing it are still scarce and research has not
been carried out in this regard. The study will collect ample parameters which can be modified as
per the requirements and characteristics of a facility and get the decision on the topping cycle CHP
system.
Secondly, the research also reflects upon the pinch analysis of energy, electricity generated, cost
savings, energy savings, and payback on investment of investment with respect to the changes in
the abovementioned parameters. A typical pinch analysis include site survey where process heat
and other equipment data. A heat balance is carried out to validate the data analysis. Realistic
targets are set for the DSS by including constraints if any. Finally, the DSS is created for the
analysis. The analysis would let the user know the effect of different parameters on the selected
output and devise methods to generate better output modifying the parameters as per the facility’s
needs. The study will produce outcomes based on the best, medium, and worst scenarios while
setting up CHP systems in a facility with a certain pressure, temperature, and quantity requirements
of steam to payback on investment and power generation.
Finally, the study is aimed to design and develop a DSS that enhances the decision-making
capability in a topping cycle CHP (using backpressure or condensing turbine) where the boiler(s)
are not working at full load. The DSS aims to determine whether a topping cycle CHP can be
implemented for economic benefits in different industries. The ranges of values of different input
parameters that will devise the lowest payback on investment from the DSS can be implemented
in the facility.
1.7 Limitations
This research study does not consider the impacts of parameters in the heat and power generation
on a dynamic scale. The study only involves the relationship of different parameters for boilers of

23
any given capacity to generate a decision. There are no continuous recordings of data which would
record the steam energy and power output uninterruptedly. The study also does not comprise of
bottoming as research in these fields has been abundantly done. Finally, the research does not
consider vapor recompression cycle as a method for generating pressurized steam for end uses.
1.8 Conclusion
The growing need for fossil fuel and its effects on the environment has been on a growing trend
since its discovery. The development of CHP systems in industries, residential and commercial
areas will be of tremendous help to reduce fossil fuel usage to satisfy energy demands. The use of
the topping cycle CHP would change the way industries utilize energy and pay for the usage. This
will also result in lesser greenhouse gas emissions. This research study aims to develop a DSS that
can be consistently used by facilities to get hindsight on the economic benefits of installing a
topping cycle CHP system.
24
2 Literature Review
2.1 Applications and workings of CHP systems
Singh et al. [25] performed a detailed study of the advantages of CHP plants that can operate by
using prime movers such as reciprocating engines, steam turbines, gas turbines, microturbines, and
fuel cells. Reciprocating engines, steam turbines, and gas turbines have been in use for a while,
whereas microturbines and fuel cells are the technologies that are still in their infancy. Steam
turbines (0.1-250 MW) and gas turbines (0.5-250 MW) have the maximum power generation
capability while reciprocating engines (0.02-6 MW), microturbines (0.025-0.25 MW) and fuel
cells (0.003-1.2 MW) have the lowest. Similarly, fuel cells have the lowest emissions because they
do not require fuel for combustion. Instead, they generate heat and power through electrochemical
processes. Likewise, heat recovery steam generators (HRSG), instead of a boiler, are used to
generate steam from the exhaust gas thermal energy and absorption chillers, instead of electric
chillers, are used to generate thermally activated cooling. The authors state that CHP plants
eliminate transmission and distribution losses. Moreover, through increase reliability and power
quality, the plant equipment is always online, resulting in an uninterrupted revenue generation.
Based on the Northeast Blackout of 2003, the authors present the fact that 10 out of 12 CHP sites
performed without any interruption. CHP plants also minimize greenhouse gas emissions. The
U.S. EPA reported that CHP plants have avoided 11.8 million metric tons of CO2 by initiating 410
CHP projects. Similarly, 20% of the CHP systems have payback on investment of fewer than 2
years, 40% offer a payback on investment of 2 to 4 years, and the remaining 40% offer a payback
on investment of 4 to 6 years. Apart from the industries, CHP systems can be used in hospitals,
residential, universities, supermarkets, and restaurants. Finally, the authors theorize that CHPs
have the potential to produce significant economic and environmental benefits, however, the
collaborative efforts between the customers and utility partners should overcome cost-related
barriers for effective implementation.
Khan et al. [26] investigated gas and steam bottoming cycles with heat exchanger and HRSG
respectively. The effects of turbine inlet temperature, pressure ratio, and exhaust gas flow rate are
studied concerning the thermal efficiency and exergy loss of exhaust gas. The topping cycle
embraced for this research is the gas turbine cycle which receives combustion air from the

25
compressor. There are two bottoming cycles: (i) air bottoming cycle using a heat exchanger to heat
the ambient air and generate power from a second gas turbine (ii) steam bottoming cycle which
utilizes an HRSG to generate steam and rotate a steam turbine. Ambient temperature, the mass
flow rate of air and steam, isentropic efficiency of pump compressors and turbines were kept
constant in this study. The new work that is done by the combined cycle, topping cycle and
bottoming cycles are calculated. The net-work of the gas turbine cycle increases with the turbine
inlet temperature and mass fraction of exhaust gas but decreases with pressure ratio. Similarly, the
higher the turbine inlet temperature, the higher power is recovered through the bottoming cycles.
The authors conclude that higher turbine inlet temperature is significant to utilize the heat
exchangers and HRSG in the bottoming cycle to increase power generation and combined cycle
efficiency.
Waste heat recovery is a major part of any combined cycle. The heat recovery equipment recovers
the waste heat by generating steam in a heat exchanger or an HRSG. Butcher et al. [27] conducted
a study on the performance of waste heat recovery systems based on a second law analysis. The
parameters considered for this study are temperature, net-work output, and entropy generation
under various operating conditions. The HRSG consists of an economizer, an evaporator and a
superheater. The system is assumed to be in a steady-state with no pressure drop on the steam side.
The authors found that higher pinch points resulted in higher gas temperature in the economizer,
thereby reducing heat exchanger efficiency and steam generation. Similarly, the second law
efficiency increases when the exhaust gas inlet temperature is increased. Moreover, exhaust gas
temperature with different composition of oxygen percentage affects the efficiency differently.
Higher oxygen percentage decreased the second law efficiency of HRSG. The authors state that
the parameters to increase the second low efficiency can help us to efficiently convert energy input
into work output and realize how well the thermodynamic means are utilized.
2.2 Feasibility Study of CHP systems
Frigo et al. [28] conducted a feasibility study of a CHP system comprising of steam turbine and
biomass gasification for tissue paper production. The primary objective of this study is to evaluate
whether a CHP plant based on biomass as fuel can be operated, technically and economically, or
not. The plant operates on the bottoming cycle. The combustion chamber produces high pressure

26
superheated steam which is used to drive the steam turbine for electricity generation. A wood
gasification process is used to furnish the syngas applied in high-temperature hoods. Similarly,
steam required for drying is bled from the steam turbine. Steam turbine outlet has a condenser,
deaerator, and a preheater to warm up boiler feed water. Likewise, the combustion air is preheated
using exhaust gas. For a paper production of 80 tons/day, the steam powerplant achieved a net
electrical efficiency of 23.9%. It proves that different fuels can be used as an alternative at places
where natural gas is not readily available to run CHP plants.
Ahmadi et al. [29] studied the thermodynamic and economic performance of thermal power plants
(coal-fired power plant, natural gas-fired power plant, combined cycle power plant, and CHP and
trigeneration power plants) to understand the inherent energy and exergy losses. The authors found
that the highest exergy loss occurs in the combustion chamber and boilers. Energy and exergy
efficiencies can be improved by using equipment such as fuel cells and desalination units because
they prevent heat losses. Combined cycle power plants have maximum exergy destruction in the
combustion chamber as the materials cannot withstand the critically high temperature and pressure.
The authors conclude that the plants can be more efficient if they work in supercritical conditions
with optimal working conditions.
Bilgen [30] studied the exergy and engineering of two gas turbine-based CHP plants. The first
plant comprised of a gas turbine system (gas turbine, compressor, combustion chamber, and
expander), HRSG, and a steam turbine, and the second plant comprised of just a gas turbine system.
The author studied the exergy based on the first and second laws of thermodynamics and the
engineering analysis based on the levelized cost and payback on the investment period. Gibbs
function and Lagrangian multipliers were used to find the equilibrium composition temperature
and pressure, and the combustion chamber feed. Similarly, for the engineering evaluation, a
modular cost estimating DSS is used. The DSS is used to calculate the economic parameters,
levelized cost, and payback on the investment period for CHP. For the gas turbine-based system,
a CHP system achieved fuel utilization efficiency improvement of 105% and an exergy efficiency
improvement of 40%. Likewise, for the gas turbine-steam turbine system, the fuel utilization
efficiency and the exergy efficiency were lower than that of the gas turbine system. Finally, the
27
author agrees with the reported data that the standalone gas turbine CHP plants have better
efficiency than that of the gas turbine system integrated with steam turbines.
Holmberg et al. [31] researched the fuel-costs allocation and CO2 emissions in a CHP plant
generating heat for paper drying and electricity for the plant and selling back to the grid. The plant
uses black liquor and bark from the mill as partial fuel, and oil from the market to satisfy the
remaining fuel demand. Fuel costs and CO2 emissions allocation to generate heat and power in
this study is done by (i) energy method, (ii) exergy method, and (iii) market-based method. The
market-based method is when the electricity price is based on the market price. The authors aimed
to uncover the cost allocation differences between the earnings of the CHP plant (energy producer)
and the energy procurement cost of the paper mill (energy purchaser). The study concluded that
varying fuel and electricity costs influence the revenue of the plant and the energy procurement
cost of the mill. Therefore, the most profitable method for the plant was the energy method because
it assigns the fuel costs equally to power and heat, resulting in the price of heat becoming higher.
However, for the paper mill, the exergy method resulted in the lowest procurement cost. The
exergy method accounts for the earnings made by selling back the bark and black liquor to the
CHP plant, which might lead to lower energy procurement costs for the mill. Similarly, the energy
method generates the highest CO2 emissions for heat, whereas the market-based method allocated
lower emissions.
Ozkan et al. [32] studied the exergy analysis to determine the exergy losses in a two gas turbines-
based bottoming cycle CHP plant to decrease the exergy losses, thereby increasing the efficiency
of the plant. The author utilizes the second law of thermodynamics for the analysis. The analysis
involves exergy losses in the heat exchanger, combustion chamber, steam boiler, gas turbine, and
compressor. The CHP system has a total capacity of 55,000 MWe/yr. The physical and chemical
exergy of the CHP plant is taken into consideration. Exergy losses in the parameters are calculated
using the physical and the chemical exergy losses formula. The sources of irreversibility are
accounted for and reduced to mitigate exergy losses and increase efficiency. The author infers to
increase the efficiency of the combustion chamber, heat exchanger, and the steam boiler to
decrease maximum possible exergy losses without significantly changing the process. Exergy
losses are at its peak in the heat exchanger at around 44.44%, Therefore, the author concludes that

28
implementing energy efficiency measures in the heat exchanger at first would result in a higher
efficiency increase.
2.3 Energy Efficiency Study in CHP systems
Beyene [33] brought out a concept of eco-park, a cluster of different injuries in proximity, where
the input and output of the CHP systems of those plants can be utilized by the others to generate
better economic and environmental benefits. The study aimed to reveal the energy efficiency
benefits from CHP. The author explains how the existing electricity distribution system, mostly
reliable, can malfunction during power outages. Commencement of decentralized CHP systems
can be a legitimate alternative to the less efficient grid systems of today. Topping cycle parameters
can be altered to generate energy for electricity production and heat recovery at the scale required
by the plant’s end uses. The review of the two cycles concludes that the topping cycles are more
flexible and have higher efficiencies than their counterparts. The author studied five topping cycles
and five bottoming cycles with various power and heat requirements for this research. It is found
that the power distribution in CHP systems is less challenging than the thermal distribution. This
is explained by the nature of thermal distribution in terms of steam, hot water, chilled water, and
district heating. The author concludes that CHP, especially topping cycles, can be beneficial in
economic and environmental issues improvements. Their installation can pave the way for other
parameters that reduce waste, consequently increasing performance by these added benefits.
However, more parameters can be defined to gain a significant leap in the field of CHP plant
optimization.
Murugan et al. [34] studied the effect on cycle efficiency with a reduction in energy loss and
irreversibility at different points of a combined cycle such as heat input point work output point,
and heat rejection part. The outcomes of the combined cycle are compared with a stand-alone
Rankine steam cycle. The combined cycle consists of water as the working fluid in the topping
cycle and ammonia-water mixture in the bottoming cycle. The authors found that combined cycles
are, indeed, better in terms of efficiency by 2.1% than a stand-alone Rankine steam cycle at the
same inlet conditions. Similarly, there is a 20% reduction in energy loss in the condenser of the
compared cycle than that of the stand-alone Rankine cycle. Therefore, different working fluids can
29
be used to better the efficiency of the cycle and the power generation. In this study, the ammonia-
water mixture was concluded as the best working fluid in the combined bottoming cycle.
One of the major objectives of this study is to determine a sweet spot in the topping cycle CHP
based on different operating parameters. Ferreira et al. [35] studied the method to increase the
efficiency and annual savings of high-grade temperature furnaces through the topping cycle. Two
production lines that consist of a furnace (average setpoint 1,652°F) each as the main source of
heat for quenching. Propane gas is used to heat the furnaces (approximately 30% energy usage in
the plant/year). Gas microturbines are used in the topping cycle, as they are cost-effective and have
more savings. Similarly, turbines exhaust gas is best matched to the heat required by other
processes in the plant such as pre-heater, baths/air dryers, and annealing furnaces. The method laid
out by the authors are: (i) no efficiency measure (ii) Replacement of fuel from propane to natural
gas (iii) Reuse of flue gas in secondary furnaces (iv) Reuse of flue gas in microturbine (15 kWe)
(v) Reuse of flue gas in microturbine (30 kWe) (vi) Reuse of flue gas in microturbine (65 kWe).
The experiments showed that the fifth scenario (30 kWe output) was the best match between energy
output and energy requirements. However, maximum savings can be achieved in the existing plant
by installing a 45 kWe microturbine, as the rated microturbine would utilize all the exhaust gas
resulting in optimal efficiency. Scenario (v) produced annual cost savings increase by 40%, energy
usage reduction by 17.2%, and CO2 emissions reduction by 7.8%.
Maheshwari et al. [36] evaluated steam turbines, gas turbines, and ammonia-water turbines to
achieve improvements in their performance by varying their thermodynamic settings. In a
combined cycle, the energy generated from the bottoming cycle is hugely dependent on the
effective energy utilization by the topping cycle. The three turbines system are arranged in
different combinations to carry out thermodynamic analysis of various parameters. For the systems
with ammonia-water turbines and gas turbines, at constant cycle pressure ratio, ammonia mass
fraction is varied, thereby resulting in a reduction of work output. This is aided by the reduction in
mass of water, while the mass of ammonia increases; since enthalpy of water is more than that of
ammonia, the net enthalpy of the mixture decreases when ammonia mass fraction is increased.
Similarly, for a simple gas turbine-based combined cycle system, the efficiency of the cycle

30
increases when the cycle pressure ratio increases because lesser input fuel is required for
combustion due to an increase in the ambient air temperature.
Carpenter et al. [37] quantified energy savings by improving the boiler controls with auto-
modulation on the firing rate and decrement in excess air percentage during combustion. These
parameters greatly influence the boiler combustion efficiency and the energy loss in stack gases.
A decrease in energy content in the stack gas ultimately increases the combustion efficiency and
the amount of fuel that is burnt during the combustion resulting in cleaner combustion. The author
attained an 11% increase in the combustion efficiency by implementing automatic modulation of
firing rate. Similarly, with calculations, the excess air percentage can be kept at 10% for better
combustion and higher energy efficiency.
2.4 Design and operational parameters studies
Nag et al. [38] researched the design and operation of a heat recovery steam generator to achieve
minimum irreversibility. Gas turbines operate in conjunction with HRSG and steam turbines,
which create a significant link between the topping and bottoming cycles. The authors have
provided a method to minimize entropy generation due to the loss of energy during the steam
generation in HRSG. The parameters considered for this study are gas pressure, exhaust gas
temperature, steam temperature, heat capacity ratio, and the number of transfer units of the
economizer and evaporator. Nag et al. found that the entropy increased with an increase in gas
pressure and temperature. The lesser temperature would decrease the irreversibility in the process;
however, the steam temperature would also be lowered. Similarly, entropy generation decreases
for higher heat capacity ratio. Besides, for exhaust gas with temperature from the gas turbine of
the topping cycle, the steam generated would be higher for the respective heat capacity. Finally,
the authors conclude that the HRSG should work in its maximum capacity to achieve minimum
exergy loss.
Somcharoenwattana et al. [39] carried out a study to improve the operational parameters of two
natural-gas CHP plants, working on the principle of the bottoming cycle, by changing the system
design and operational schedule during on-peak and off-peak period for more flexible operation.
The CHP operation (52.5 MW) includes two individual 20 MW gas turbines, two HRSGs, one

31
steam turbine with the power of 12.5 electrical output, four auxiliary boilers, and three absorption
chillers. In the first case, the author replaces the existing gas turbines, thereby increasing the
overall efficiency from 48% to 61%, natural gas savings of 24%, and CO2 emission reduction of
27%. The existing gas turbines were old and exhibited numerous breakdowns and unstable
conditions. They were replaced by newer gas turbines with half the heat rate (rate of fuel consumed
for electricity production (kWh)) and gross electrical efficiency of 41.7% (a 17% increase). The
author states that the higher the ambient air temperature, the lower the electricity generation.
Therefore, the temperature of the inlet air for the gas turbine was reduced from 91.4°F to 55.4°F
by using the chilled water from the absorption chiller. This change in the inlet gas temperature
parameter increased the overall efficiency to 61% and power output (MWh/year) by 91% (from
389,294 MWh/year to 744,775 MWh/year). Similarly, in the second case, a CHP plant (9.9 MW)
which supplies electricity and cooling for the building was chosen. There was a vivid difference
between the cooling load profiles during the day and night. The author introduced two chilled
water storage tanks that are used to charge the chilled water at night and discharge into the building
during the day, resulting in a reduction in chiller size and gas turbine system. The chilled water
requirements during the night, albeit lower requirement, were satisfied by two mechanical chillers,
while the absorption chiller generated chilled water and stored them in the water storage tanks.
The author concludes that longer operating hours of absorption chillers and gas turbines would
generate higher revenue. Therefore, changes in parameters such as decrement in inlet gas
temperature in gas turbines and increment in operational hours would result in higher electricity
and cooling generation.
Valdes et al. [40] studied the influence of different parameters such as ambient temperature and
pressure, isentropic efficiency of the gas turbine, superheaters and reheaters temperature,
evaporators, and economizers on the thermo-economic performances of combined cycled gas
turbine power plants on full-load and partial-load. The authors use the cash flow DSS and energy
generation cost as the two thermo-economic DSS. The single pressure combined cycle gas turbine
power plant results (for cost generation and cash flow) were used as the reference points in the
study. For the full-load study, a decrease in pressure (P), pinch points (PP), approach points (AP),
and gas to steam temperature difference (dT) at the superheater increased efficiency whereas an
increase in the total heat transfer area resulted in efficiency increase. For partial load, however,

32
when the load on the gas turbine was decreased, the efficiency and gross power decreased too.
When the load is under 55%, the cash flow starts to be negative which means that the cost of
generation is higher than the selling price to the grid. The authors concluded that the results are
significantly dependent on the type of turbine selected and the initial design parameters. The
document also inferred that modification in design parameters defines the generating cost or cash
flow series better than that of efficiency. Finally, it showed that a generating cost optimization
should be done for a liberalized electricity market and cash flow optimization in a regulated
market.
Similarly, there have been studies on individual equipment in a combined cycle. Franco et al. [41]
devised an experiment for the optimum design of heat recovery steam generators (HRSG), a
significant component of a combined cycle, for maximum performance. The authors carried out
the study in two steps: (i) changes in the main parameters such as the pressure, temperature, and
mass flow rate of the gas, water, and steam (ii) changes in the HRSG design for better heat transfer
in the bottoming cycle. In the first step, the minimization of the exergy loss due to the difference
in temperature and pressure of the exhaust gas and water was considered whereas in the second
step, the geometry of HRSG, that includes volume minimization or compactness maximization
while maintaining performances related to heat flow and pressure drop, is considered. The authors
achieved an exergy loss reduction of 25% by increasing the surface length ratio of the HRSG tubes
by 5-6%, the volume of the HRSG by 8%, and the compactness of HRSG from 120 to 140 m2/m3.
Arrieta et al. [42] performed a study on the effects of ambient temperature in a natural gas run
combined-cycle thermal power plant consisting of two gas turbines, two HRSGs (with
supplementary firing) and steam-turbine. The power generated by the plant is inversely
proportional to the ambient air temperature, which means that a minute change in the ambient
temperature influences the power generated and revenues drastically. Similarly, lower ambient air
pressure shows a similar trend in power generation as that of temperature. Finally, a decrease in
air’s relative humidity increases the plant’s efficiency. Out of the three parameters discussed
above, the temperature is the most pre-dominant parameter, therefore the other parameters such as
pressure, relative humidity, electric frequency, power factor, and fuel characteristics were kept
constant in this study. The study was carried with simulation using Gate Cycle software, where

33
data from the gas turbines, HRSGs, steam turbines, condensers, and other equipment were set up.
The gas temperature increase after supplementary firing in the HRSG is also considered for the
overall power generation. The results indicated that the maximum ambient air temperature (95°F)
and minimum gas temperature after supplementary firing (977°F) generated 468 MW power,
whereas the minimum ambient temperature (32°F) and maximum gas temperature after
supplementary firing (1,247°F) generated 642 MW. The simulation also showed a variation of
overall cycle efficiency of 3.4%. This inferred that the use of supplementary firing in the HRSG
would increase the power generated in the gas cycles, however decreasing the thermal efficiency.
Thermal efficiency decrement is associate with higher fuel usage by the supplementary firing in
HRSG.
Similarly, Şen et al. [43] also performed a study about the influence of ambient temperature on the
power generation of a natural gas-run combined cycle power plant. Ambient air temperature
between 46.4°F and 73.4°F was used to study its effects. The authors recorded the power at
different temperatures with the help of transmitters and transformers and analyzed the respective
data using data acquisition card (DAQ) and supervisory control and data acquisition (SCADA).
The loggers were used to measure the energy from the gas turbines and steam turbines at different
ambient air temperature range. The results were a power generation of 227.7 MW at 46.4°F
ambient temperature and 197.3 MW at 73.4°F. The authors concluded that the higher temperature
ambient air has lesser oxygen in the air entering the combustion chamber, thereby affecting the
combustion process and the energy it produces.
Oh et al. [44] evaluated the economic feasibility of a gas turbine-based CHP to a hotel or an office
building in Seoul, South Korea. The study considered the annual energy demand for electricity,
heating, and cooling along with operational parameters, equipment, and industrial policy. The
author utilizes a mixed-integer linear programming method to obtain the most optimal solution of
parameters used for a hotel or an office building. The optimization planning process includes the
assumption of annual electricity, heating, and cooling demands based on a priori. Similarly, the
study does not consider the grid interconnection cost, and the fac the overall electricity generated
by the CHP system. Based on the linear programming method, the author presents formula to
calculate the energy supply-demand, annual cooling demand, and the annual variable cost. Finally,

34
the total annual cost for the investment is calculated by generating the sum of the annual variable
and the annual fixed cost. Data related to the maximum and the minimum electricity, heat, and
cooling demands were collected from the hotel and an office building of similar sizes. The author
found out the implementation of a gas turbine based cogeneration system did not generate a
desirable payback on investment. However, the implementation of a gas turbine based CHP was
economically feasible for a hotel. The payback on investment for the hotel was 6 years, and the
payback on investment for the office building was 9 years.
CHP systems have the versatility to be implemented in the power plants, industrial facilities,
commercial and institutional facilities such as colleges, universities, hospitals, hotels, offices, K12
schools, and nursing homes. Unsurprisingly, according to a report produced by the U.S Department
of Energy, the CHP systems in the commercial facilities account for 50% of the total CHP systems
in the United States [45]. The report highlights successful CHP installations in industrial and
commercial facilities. The report highlights a group of office buildings that has a 4.3 MWe topping
cycle CHP plant which provides 100% of the electricity needs to the buildings. Similarly, the CHP
system also integrates a 1,050-ton absorption chiller for cooling needs during summer. Another
example is a data center that implemented a microturbine topping cycle CHP system to generate
enough energy to operate a 300-ton absorption chiller for its cooling needs. Figures 2-1 and 2-2
show the commercial and industrial facilities that use the CHP system and their prime mover
respectively.

35
Figure 2-1: Commercial Businesses with Topping Cycle CHP Systems, 2014 [46]
Figure 2-2: Commercial Business Prime Mover in CHP Systems, 2014 [46]
Arzbaecher et al. [47] conducted a study on a waste heat recovery in industries and how it can be
utilized for other industrial applications using pinch analysis. The author consults several literature
and industries to identify high-grade waste heat utilization opportunities from equipment such as
furnaces, boilers, and kilns. The opportunities are identified and associated with the recent energy
savings and advancement methods. To satisfy the research target, the author uses pinch analysis.
The analysis identifies the most promising waste heat recovery opportunities without influencing
Healthcare , 368, 14%
Wastewater and Solid Waste
Facilities, 295, 12%
Multifamily Buildings, 283,
11%
Colleges/Universities, 272, 11%
Hotels and Recreation, 265,
10%
K-12 Schools, 253, 10%
Government Sites, 181, 7%
Office Buildings, 134, 5%
Utilities, 127, 5%
District Energy, 49, 2%
Other , 340, 13%
Boiler/ Steam Turbine
32%
Combined Cycle58%
Combustion Turbine
8%
Reciprocating … Other 1%
36
the process integration and energy efficiency of the facility negatively. The author processes a site
survey to gather data from the heat, sets the target to achieve the maximum heat recovery, design
the DSS and optimize in terms of cost-effectiveness, and the optimized trade-off between the
efficiency of the plant and total energy and fuel cost. The pinch analysis is extremely useful to
continuously track record of energy cost and savings. The author concludes that the potential for
the waste heat recovery is tremendous as only 5% of the industries in the United States implement
waste heat recovery. Similarly, waste heat recovery by a significant number of industries would
result in a reduction in greenhouse gas emissions.
McBrien et al. [48] studied the energy savings from heat recovery in an integrated steel supply
chain through pinch analysis. The author uses pinch analysis to compare a standard heat recovery
process and an integrated heat recovery process in the research. The author found out that an
integrated heat recovery process could save up to 2.37 MMBtu/ton of hot rolled steel, instead of a
1.42 MMBtu/ton of hot rolled steel savings by using a conventional heat recovery process. The
author also provided methods to extend the heat recovery methods and data collection to all the
primary steel industries. The work is conducted by creating a mass and energy balance of the steel
supply chain at first. Later, a pinch analysis is introduced to deduce possible energy savings by
recovering the waste heat from the processes. The materials that already have heat or are heated to
a certain process temperature are identified as the prime candidate for waste heat recovery.
Steam System Modeler Tool (SSMT) is used to carry out calculations related to the steam turbines,
deaerators, and PRVs [49]. SSMT is extremely useful to chart out a boiler system with up to three
steam headers and compare it with a second DSS to track the changes in the output systems when
an input parameter is changed. The overall goal of SSMT is to increase the steam system efficiency
in industrial facilities. Various boiler parameters such as the pressure, temperature, specific
enthalpy, specific entropy, combustion efficiency, and isentropic efficiency of the turbines are used
as a determining factor for the changes in output quality such as power generation and overall
system efficiency.

37
2.5 Power generation and its integration to the grid
Asmar et al. [50] carried out a study to develop a decision-making policy to quantify the most
optimal CHP system that can be integrated into the electricity grid. Setting up CHP plants
decentralizes the electricity sector. The CHP plants can be linked to the electricity grid without
major expenses, resulting in the control of losses and assaults. The study is based on gas turbine
CHP systems. A decision-making strategy named “Multi-objective optimization” is used for the
study. The main aim of the simulation is to find a CHP power that is favorable to the economy and
the environment. It corresponds to ten years of CHP integration to the power grid with an average
operational hour of 8000 hours/year. The simulation is carried out 1000 times, generating around
15,000 solutions. The solutions discover the objective function of the total cost and pollutant
emissions to be minimized by setting up CHP. The dependent variables (cost and pollutant
emissions) are displayed in a linear regression DSS. The equations are also dependent on the
energy demand and the nature of the system. Therefore, the multilinear equation is the relationship
between power, total cost, and polluting emissions in a span of ten years. So, the power
corresponding to the smallest residue is termed as the best option to be integrated into the grid.
This process is the selection of best CHP to be adapted to the level of integration required and
encouraging subsidies are introduced to motivate the customers to pursue CHP. The authors
conclude that the choice of pursuing CHP is also largely dependent on the wish of the customer
(public or private).
The total energy consumption in the Italian paper industry is estimated to be 7.01 TWh/yr, out of
which 5.54 TW/yr of energy is generated for the production. It provides a unique opportunity to
implement CHP systems. Therefore, Gambini et al. [4] made a case study on high-efficiency CHP
systems for the paper industry in Italy where the incentive scheme for selling electricity back to
the grid has been modified with better rates for the unit selling price of electricity in the recent
years. Gatecycle software is used for the detailed design of the CHP systems. It can be used to
manipulate pressure, temperature, and enthalpy conditions of the working fluid (mainly water),
therefore, obtaining different efficiency and output power. The authors study internal combustion
engines (ICE), gas turbine (GT), backpressure turbine steam power plant (BPT-SPP), condensing
turbine steam power plant (CT-SPP), and combined cycle power plants (CCPP). There were two
conditions for selecting the best CHP systems; (i) the electricity generated should be equal to the

38
electricity demand of the plant (electricity cannot be sent to the national grid) (ii) Consequently,
the remaining energy should be used to maximize heat generation to achieve maximum HeatCHP
/Energy ratio, resulting in high-efficiency CHP (HEC). The results of the study were enumerated
through energy, economic and environmental parameters, that were later added to get a total key
performance indicator to compare the studied CHP systems. The study indicated that gas turbines
(GT) were the best CHP system for the selected paper industry. For the reference, the gas turbine
CHP system primarily consists of a gas turbine to generate electricity and an HRSG to generate
steam for heating.
2.6 Conclusion
This literature review reveals the prominence of the research work done in the field of CHP. It is
shown that significant research work has been carried out in the field of bottoming and combined-
cycle CHP systems. The work done by various authors for the bottoming and combined cycles has
been studied and implemented by various governmental, industrial, and commercial facilities
around the world. However, the literature survey iterates that there is no such DSS to enable an
industrial practitioner to evaluate the technical and economic aspects of a topping cycle CHP
system. The DSS developed in this study will address this need.
39
3 Research Approach
This research aims to develop a system to analyze the economic and technical feasibility of a
topping cycle CHP system and pinch analysis of variables and parameters to obtain higher power
generation and lower payback on the investment. It is most commonly applied to an industrial
facility where a boiler at a partial-load is utilized for process heating requirements and the
remaining capacity of the boiler is utilized to operate the CHP system by using a steam turbine.
Similarly, the research also involves a CHP opportunity with a gas turbine system instead of a
steam boiler. The gas turbine system is operated to generate electricity for the topping cycle, and
the turbine exhaust is utilized by a waste heat recovery boiler to generate steam for a steam turbine
and respective end uses.
3.1 Data Collection
In order to successfully carry out the research, extensive studies were performed on CHP systems
that use boilers and gas turbines. Facilities that utilize boilers had to be studied for implementing
CHP. As the topping cycle is only possible where there is an excess generation of steam from a
boiler, data collection, and facility selection was critical. Several discussions had to be carried out
with the plant personnel to convey the message about CHP’s significance related to energy and
cost savings. The energy consumption and cost incurred to the facility also had to be considered.
The data collection activity was significant because of the amount of equipment that had to be
considered. The list of equipment and parameters that had to be considered for the study are, while
not limited to, listed below:
a. Boiler (its parameters) – Steam properties and losses
b. Steam piping – Steam flow and losses
c. PRVs – Steam pressure reduction
d. Comfort heating
e. Fuel usages
f. Deaerator
g. Economizer
h. Air pre-heater

40
The plant personnel was interviewed for the data procurement related to the abovementioned
equipment and parameters. Data was collected from a paper industry that uses high-pressure steam
to dry their products before shipping them out. A significant amount of heat energy was required
by the process to fulfill the product specification and demand. The facility also fitted quite well to
the scope of a topping cycle CHP as the boiler used natural gas as the fuel and was being operated
to about 30% of its total capacity. The stack temperature of the boiler was measured with a
combustion analyzer which calculated the combustion efficiency of the boiler furnace. In addition
to this, it also calculated the temperature of the flue gas, the temperature of the ambient air, and
the percentage of excess air during combustion. Boiler parameters such as boiler pressure and
temperature were recorded from the boiler display screen. The facility had a centralized computer
that dynamically recorded most of the parameters in the boiler system. The data were later run
through the spreadsheet-based DSS to validate its accuracy in an industrial setup. The recorded
parameters are shown in Table 3-1.
Table 3-1: Quantitative values of the parameters
Boiler Parameter Values
Boiler rated capacity 204 MMBtu/hr
Boiler maximum steam generation 150,000 lbs/hr
Boiler combustion efficiency 56.96%
Excess air % during combustion 18.52%
Present steam generation 46,500 lbs/hr
Steam pressure 186 psig
Steam temperature 6640F
Boiler blowdown % 3.26%
Process 1 steam requirement 33,500 lbs/hr
Process 1 steam pressure 176 psig
Process 1 steam temperature 3740F
Process 2 steam requirement 10,000 lbs/hr
Process 2 steam pressure 60 psig
Process 2 steam temperature 3250F
Process steam loss 100% (sent to sewer)
Does the facility preheat combustion air? No
Does the facility implement blowdown heat recovery? No
Does the facility have burner controls? No

41
3.2 Variable determination
Variables have been selected for the DSS as per the requirements in a boiler/turbine-based CHP
system. A literature survey has been carried out on topping cycle CHP systems, and are mentioned
in chapter 2. These parameters, as defined in chapter 2, were also found to be an integral part of a
boiler operating system in the facility. Therefore, these variables had to be considered during the
development of the DSS. Finally, after collecting the values of these parameters from the facility,
they are entered into the DSS for data analysis and result generation.
3.3 Generation of DSS
After the procurement of the data from the paper facility, the DSS was generated by referencing
the reviewed literature and the parameters during the data collection. A hypothetical DSS was also
developed for a gas turbine-based CHP system. The calculations and feasibility of the gas turbines
in CHP systems were verified by consulting numerous research papers related to them. As a result,
it was possible to integrate a gas turbine and a waste heat recovery boiler for a combined topping
cycle in the DSS. The DSS has two different input sheets (i) boiler (ii) gas turbine. The values
have to be entered into the respective parameter cells to successfully operate the DSS. Once a user
inputs all the necessary parameters, the DSS calculates the variables such as total cost and energy
savings, the flow of steam throughout the system, and payback on investment, among other
variables. Similarly, the DSS also generates a spreadsheet with a block diagram for the entire CHP
system (technical aspects) and also has values of important steam and energy parameters
displayed. Finally, the DSS generates a result page that has all the economic aspects of the
respective system for the facility. The result sheet displays total savings, cost incurred, and
payback on investment on the investment. Finally, the result page also generates graphs related to
the pinch point analysis for the change in output variables at different ranges of the input variables.
3.4 Data analysis using the DSS
As mentioned in Section 3.3, the data collected from the facility (as shown in 3.1) were entered
through the DSS. The user enters the values of input parameters as requested in the input
questionnaire in the boiler/gas turbine screen. Some buttons help a user to navigate between the
input sheet, the block diagram sheet, and the result sheet. The navigation buttons are carefully
programmed to move through different sheets corresponding to the usage of backpressure or a

42
condensing turbine for power generation. As the implementation of either of the two turbines
significantly changes the design of the CHP system, two spreadsheets have been developed for
each of the turbine usages. The user can enter the values of various parameters repeatedly to
operate the DSS several times. The DSS will procure the results based on the changes in variables.
There are various options of energy efficiency measures that a user can change such as pre-heating
the combustion air, burner controls using automatic modulation and excess air control, blowdown
heat recovery, and type of turbine used. Based on the data entered by the user, the DSS will
generate results commensurate with the energy, fuel, and water cost.
3.5 Results
3.5.1 Block diagram of the CHP system
Once the user enters all the data and clicks on the “go-to boiler/gas turbine diagram” button in the
input spreadsheet, the DSS navigates the DSS to the block diagram spreadsheet. It is a
comprehensive block diagram that consists of equipment such as boiler, economizer, deaerator,
steam turbines, PRVs, process steam usage, and make-up water inflow. Similarly, the block
diagram also has numerical values related to the steam/water flow rate at different points of the
cycle, their pressure and temperature. For the gas turbine system, there are two block diagrams;
one is when the user chooses a backpressure turbine and absorption cooling and the other one is
when the user chooses a condensing turbine. The diagram makes it easier for a user (experienced
or a layman) to understand the CHP system that they want to set up in the facility.
3.6 Model
Like previously described, the main purpose of this research is to identify opportunities in the
topping cycle CHP system in industries that utilize boilers and gas turbines as their primary heat
generator. The idea is to identify a range of values in the independent variables for which the
payback on investment is the lowest by implementing sensitivity analysis between the respective
variables. An excel-based DSS is developed to identify opportunities for the same. Sensitivity
analyses are carried out with respect to output variables such as power generation and payback on
investment. Different input variables that incur a substantial impact on the output variables are
selected for the sensitivity analyses. Input variables are selected as per their severity of impact on

43
the output. Users will be able to enter variables related to the input side of boilers and gas turbines.
The DSS will finally provide the block diagram of the CHP system and the results, primarily
focused on the payback on the investment period of the investment. The DSS has set boundaries
regarding the operational pressure and temperature of the steam. They are as follows:
1. The operating temperature of the superheated steam should be between 320F and 1,5000F.
2. The operating pressure of the superheated steam should be between -14.5949 psig and
1,085 psig.
3. The operating temperature of the saturated liquid/steam should be between 320F and 7050F.
4. The operating pressure of the saturated liquid/steam should be between -14.61 psig and
3,185 psig.
The DSS is further strengthened by the addition of superheated and saturated steam tables [51]
based on the IAMWS Industrial formulation 1997 for the thermodynamics properties of water and
steam (IAPWS-IF97). The DSS interpolates the pressure and temperature of the steam that the
user provides and returns the accurate values of specific enthalpy and specific entropy, by
consulting the steam tables. The DSS also returns the values of steam temperature for the
corresponding pressure and specific entropy. Other than these values, the DSS performs algebraic
calculations to generate the results and the payback on investment in implementing the
opportunity, ultimately.
Figure 3-1 shows the fundamental design of the DSS in MS ExcelR. The primary box mentions the
first choice that a user will have while using the DSS. The DSS computes the total energy savings,
cost savings, and payback on investment. The user can tabulate between the CHP diagram sheet
(boiler and gas turbine, separately), input parameter sheet, and the result sheet. In this section, the
DSS for a topping cycle CHP with a boiler/gas turbine is presented. The power generated by the
steam turbines is directly proportional to the amount of steam that is provided to them. Therefore,
a significant amount of steam has to be utilized by the steam turbines to generate electricity that
would result in a desirable payback on investment. The DSS has options to input up to four
different processes and corroborate them with pressure-reducing valves (PRV) or a backpressure
turbine, solely depending upon the profit. Similarly, the excess steam is run through the steam

44
turbines (condensing or backpressure turbine) to generate power, while returning the condensate
in the CHP system. Input parameters include, and are not limited to, steam quantity, steam
pressure, steam temperature, excess air percentage, and boiler stack gas temperature. These
parameters compute the output values of the boiler such as combustion efficiency, thermal
efficiency, energy in the steam, and losses in steam and boiler system. The CHP systems only
account for superheated steam and generate the specific enthalpy of steam as per the pressure and
the temperature of steam. The DSS is equipped with saturated and superheated steam tables that
automatically calculates the specific enthalpy and specific entropy of the steam at corresponding
pressure and temperature. Based on the specific enthalpy of the steam at the turbine inlet and outlet,
the total energy transfer from the steam to the turbine blades is calculated. The energy transfer,
while considering the turbine’s isentropic efficiency and the generator efficiency, is used to
calculate the total power generation in kilowatt (kW).

45
Figure 3-1: Design of the Decision Support System - 1

46
Figure 3-2: Design of the Decision Support System – 2
Figure 3-3: Primary spreadsheet
Figure 3-3 lets the user choose the primary equipment among the gas turbine and boiler. Based on
the requirement of the facility, a CHP system with a boiler or a gas turbine can be selected. The
boiler system is integrated with fuels such as natural gas, coal, and #4 fuel oil whereas the gas

47
turbine system is integrated with natural gas only because natural gas is widely used as the
reference fuel for gas turbines all over the world [52]. After the selection of the desired primary
equipment, the user is guided to the input section of the spreadsheet, where input parameters as
stated should be entered.
3.6.1 Detailed calculations
The DSS does meticulously detailed calculations to compute results on the summary and the block
diagram sheet. These calculations cannot be brought into the display using the navigation buttons.
However, they can be viewed on the parameter input sheet. These calculations are a fundamental
part of this DSS. They are a comprehensive display of numerous values that are not shown in the
result and the block diagram sheet. These values include specific enthalpy and entropy at every
stage of the cycle. Similarly, the calculated values also include information regarding boiler
feedwater, combustion, steam, steam turbines, HVAC, absorption chilling, deaerator, and
economizer.
3.6.2 Savings and payback on investment
The “go-to result” button on every spreadsheet navigates the user to the “result” spreadsheet where
the total cost savings and payback on investment is tabulated. The table also includes costs incurred
by fuel and water consumption. The savings are generated from natural gas savings through
comfort heating, electricity, and demand savings. Finally, the payback on investment period on
investment is calculated by utilizing the cash inflow and outflow for the CHP process.
3.6.3 Sensitivity analysis
The DSS has an integrated sensitivity analysis graph creator that automatically creates graphs for
pinch analysis of different output variables based on the changes occurring on the input variables.
Effect of the steam and boiler properties on the power generation and the payback on investment
is shown by the analysis. The analysis is dynamically created, and any change in the input variables
changes the graph as per the relationship between the input and the output parameters. It means
that the user can change the input parameters anytime during its usage, and the graph will let the
user know about the most favorable numbers for a topping cycle CHP. The analysis can be done

48
by the facilities themselves by referring the graphs to correctly devise a procedure to implement a
CHP system with desirable payback on investment.
3.7 Conclusion
The proposed model is a decision management system designed in an MS ExcelR with multiple
tabs that calculates the economic and technical feasibility of a topping cycle CHP system with a
steam boiler or a gas-turbine as the primary heat generator. Once the data is entered into the DSS,
the program calculates and displays the results. The results include a CHP system block diagram
with boiler/gas-turbine, detailed calculations, results on total savings and payback on investment,
and pinch analysis.

49
4 Model Development
4.1 Assumptions
1. Inlet mass flow rate is equal to the outlet mass flow rate in the steam turbines.
2. Steam passing through the steam turbines exhibit the isentropic process.
3. Steam flowing through the PRVs exhibits the isenthalpic process.
4. The boiler feed water leaves the deaerator and the economizer as the saturated liquid at the
respective pressure.
4.2 Input Parameters and tabs
Values of parameters that dictate the output values such as power generation and payback on the
investment of a boiler/gas-turbine based CHP systems are shown in the input screen. The name of
the decision support system is termed as Cogeneration Topping Cycle Evaluation (COGENTEC)
in this study.
Similarly, COGENTEC has 8 main tabs where a user can navigate using macro buttons that are
designed for each tab. These tabs have unique functions that are exclusive to either a steam boiler
or a gas turbine-based CHP system. Basic description of each tab is listed below:
1. Main tab
The “Main” tab is opened automatically every time the user opens COGENTEC. In this tab, the
user can select the type of primary equipment (Gas turbine/Boiler) and the choice of fuel for their
operation. Once selected, the user presses the “continue” button to load a corresponding tab of
selection. The “continue” tab is coded to recognize the selection of one of the primary equipment
and its fuel type.
2. Boiler tab
If the user selected “Boiler” in the “Main” tab, then COGENTEC directs to the “Boiler” tab where
the user is required to enter the input parameters for a boiler-based cogeneration system. The input
parameters are related to the boiler operations, turbine operations, water and steam quantity,

50
energy, fuel, and water cost. After the user enters the required values for the parameters as shown
in Figures 4-1, 4-2, and 4-3, COGENTEC computes the diagram and the result. Consequently, the
user can select the “Boiler diagram” or the “Results” button to navigate to the respective tabs.
3. Boiler Diagram
The “Boiler Diagram” tab consists of an elaborated block diagram of a typical CHP system with
the values based on the input parameters entered by the user for their analysis. The tab has
comprehensive data related to the mass flow rate of water/steam in different parts of the CHP
system. The user can go to either of the “Boiler” tab or the “Results” tab from this tab.
4. Result – Boiler
The “Result – Boiler” tab is generated by COGENTEC when the user selects the “Results” button
in the “Boiler” tab or the “Boiler Diagram” tab. This tab includes the total energy cost and
expenditure for the proposed CHP system. It also shows the overall payback on the investment for
the CHP system. Similarly, the tab also has pinch analysis data corresponding to several input and
output variables for a more comprehensive analysis of the system and data.
5. Gas turbine
The tab “Gas turbine” is opened when the user selects the gas turbine as the primary equipment.
The input section can be used by the user to enter variables related to a gas-turbine-based CHP
system. Similar to the “Boiler” tab, the user can select on the “Gas turbine diagram” button or the
“Results” button.
6. Diagram – GT BPT
When the user selects a backpressure turbine as the choice of steam turbine, the user is directed to
the “Diagram – GT BPT” tab which has the comprehensive CHP system block diagram that
includes a backpressure turbine. The tab also has the “Results” button and the “Go back to input
page” for navigation.
7. Diagram – GT CT

51
When the user selects a condensing turbine as the choice of the steam turbine, the user is directed
to the “Diagram – GT CT” tab which has the CHP system block diagram that includes a condensing
turbine. The user can open the results tab by clicking on the “Results” button within this tab.
8. Result – GT
The results of the gas turbine-based CHP system displays the energy cost and expenses of the
proposed system. Similarly, the tab also has pinch analysis graphs to analyze the data and the
variable correlation. The user can go back to the “gas turbine diagram” tab or the “input” tab if
more analysis or modifications are required.
COGENTEC also has five more tabs (i) Constants (ii) Steam tables (iii) Saturated table (iv)
Entropy (v) P-S. The constant tab has values of the thermodynamic and operational constant that
are required for the study. The steam tables tab has the superheated properties of steam. Similarly,
the saturated table tab has the saturated properties of steam and water. Entropy and the P-S tabs
have specific entropy values of saturated and superheated steam.
4.2.1 Boiler-based CHP system
Figure 4-1: COGENTEC input screen-1

52
Figure 4-2: COGENTEC input screen-2
Figure 4-3: COGENTEC input screen-2
Figures 4-1, 4-2, and 4-3 show the input screen of COGENTEC for a topping cycle CHP system
using the boiler. The input screen is user-friendly and easy to work with. In figure 4-1, the user
starts with entering boiler rated capacity, excess air during combustion, ambient air temperature,
boiler stack gas temperature, steam quantity, steam pressure, steam temperature, blowdown
percentage, makeup water pressure and temperature. COGENTEC also has options to include
blowdown heat recovery, boiler controls, and pre-heat combustion air using boiler stack gas. These
energy efficiency measures are beneficial for plants with respect to energy and cost savings. If the
plant does not have these measures, to begin with, it is suggested to implement them for a reduction
in fuel consumption and CO2 emissions. Facilities can achieve a substantial leap in combustion
efficiency by implementing these measures. Similarly, the user can enter operational parameters
for up to four processes that require superheated or saturated steam as high-grade or medium/low-
grade heat respectively. COGENTEC provides an option for the user to account for a backpressure
turbine instead of a PRV in cases where steam pressure is reduced as per the requirements.
Backpressure turbines reduce the pressure of the steam while generating electricity at the same
time. COGENTEC accounts for the economic aspects of installing a backpressure turbine and lets
the user know if it is beneficial or not.
In Figure 4-2, the outlet steam from the steam turbine system and the processes, after accounting
for the possible losses, is then used for absorption cooling during summer (yearly in cases where

53
cooling is required all the time) and heating during winter months. As the primary objective of a
topping cycle is power generation, excess heat can only be used by the HVAC and chiller units in
this study. Facilities are suggested to do an in-depth study to develop a situation for using the heat
in outlet steam for district heating. Figure 4-3 lets the user input their utility, fuel, and water cost.
The utility and the fuel costs are a constant price that the facilities pay to the utility companies.
COGENTEC does not address or include the “time of day” costs that can vary constantly and
arbitrarily within the same facility. The spot trading at various times of the day is prevalent in
states such as California, Massachusetts, and Ohio. However, in states such as West Virginia and
Vermont, distributed generation is not practiced. The user will have to enter the constant price of
electricity that they owe to the facility for electricity usage every month. These values are utilized
by COGENTEC to calculate expenditure and savings incurred by implementing the project.
4.2.2 Gas turbine-based CHP system
Figure 4-4: Gas turbine-based CHP input screen
In Figure 3-3, if the user selects the gas turbine, then COGENTEC redirects to the gas turbine input
spreadsheet. The gas turbine CHP system is fundamentally different from the boiler-based CHP
system. In the input section of the gas turbine system, the user has to enter the mass flow rate,
pressure, and temperature of the inlet air, efficiency of the compressor, generator and the turbine,
the pressure ratio of the compressor and pressure losses in the gas turbine system. Similarly, gas

54
turbines exhaust gas is considered to be a high-grade heat source, therefore, the user has the option
to install a waste heat recovery boiler to generate steam for using it in steam turbines. The user can
enter the waste heat boiler’s parameters such as its efficiency, mass flow rate of water, steam
pressure, temperature, and boiler blowdown percentage.
4.3 Process and calculations
Once the user enters the input parameters in the gas turbine or boiler input sheet, COGENTEC
computes the output parameters within the spreadsheet and displays them in the boiler/gas turbine
block diagram spreadsheet and the resulting spreadsheet.
4.3.1 Boiler-based CHP system
Figure 4-5: Computation of boiler-based CHP parameters-1

55
Figure 4-6: Computation of boiler-based CHP parameters-2
Figures 4-5 and 4-6 displays the calculations carried out in the spreadsheet for properties related
to boiler feedwater, boiler combustion and losses, process and turbine steam, steam turbine,
comfort heating, and absorption cooling. For example, the boiler thermal efficiency utilizes the
heating value of the fuel, excess air percentage, and stoichiometric ratio of the fuel. There are two
different ways the spreadsheet calculates the thermal efficiency. They are explained below.
4.3.1.1 Thermal Efficiency without burner controls
Burner controls include automatic modulation and reduction in excess air utilization for increasing
energy efficiency. Burner modulation mode changes the burner firing rate periodically between
the preset limits to maintain the boiler pressure and temperature at a desirable operation range.
Similarly, it also reduces boiler purge and draft losses, thereby letting the boiler to work in low
firing mode frequently. The optimal amount of excess air percentage for complete combustion of
fuel is about 10% [37]. However, the majority of burners operate with excess air higher than 10%.
Burner controls automatically operate boiler with excess air as low as 10% for higher fuel
efficiency, while overseeing complete combustion. Similarly, Carpenter et. al [37] also estimated
typical savings up to 11% while using boiler modulation with PLCs. The calculation for calculating
thermal efficiency (TE) with boiler controls is shown below:
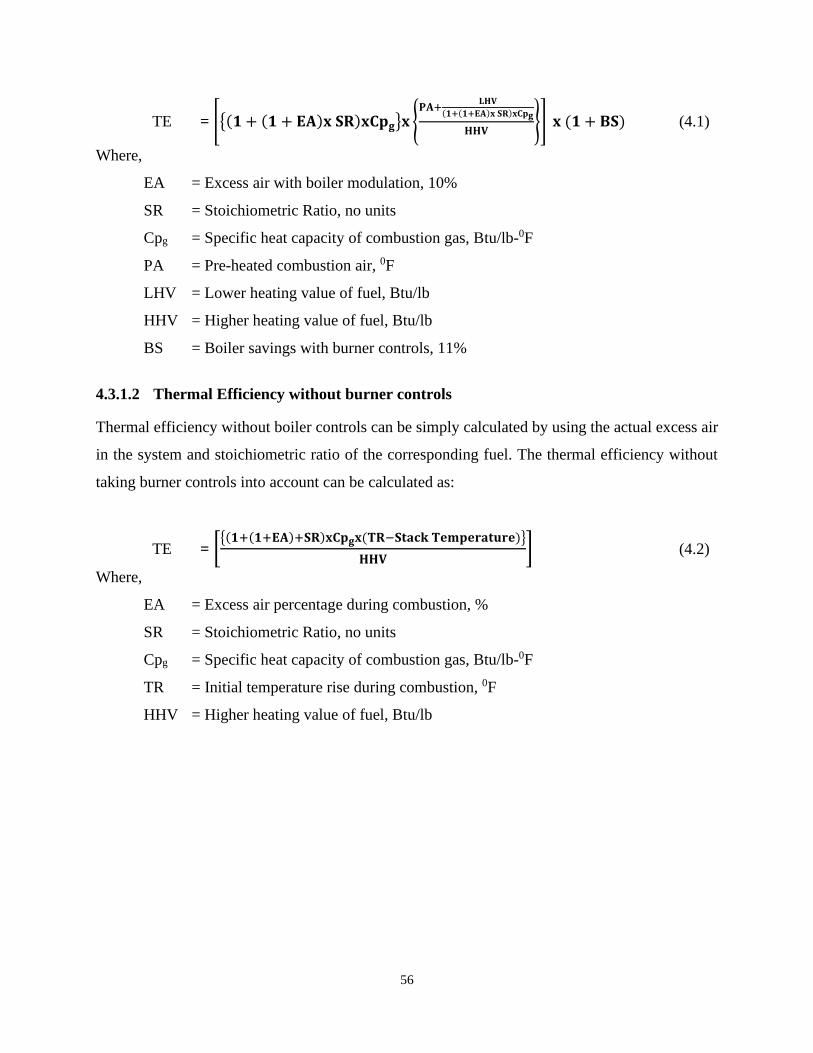
56
TE = [{(𝟏 + (𝟏 + 𝐄𝐀)𝐱 𝐒𝐑)𝐱𝐂𝐩𝐠}𝐱 {𝐏𝐀+
𝐋𝐇𝐕
(𝟏+(𝟏+𝐄𝐀)𝐱 𝐒𝐑)𝐱𝐂𝐩𝐠
𝐇𝐇𝐕}] 𝐱 (𝟏 + 𝐁𝐒) (4.1)
Where,
EA = Excess air with boiler modulation, 10%
SR = Stoichiometric Ratio, no units
Cpg = Specific heat capacity of combustion gas, Btu/lb-0F
PA = Pre-heated combustion air, 0F
LHV = Lower heating value of fuel, Btu/lb
HHV = Higher heating value of fuel, Btu/lb
BS = Boiler savings with burner controls, 11%
4.3.1.2 Thermal Efficiency without burner controls
Thermal efficiency without boiler controls can be simply calculated by using the actual excess air
in the system and stoichiometric ratio of the corresponding fuel. The thermal efficiency without
taking burner controls into account can be calculated as:
TE = [{(𝟏+(𝟏+𝐄𝐀)+𝐒𝐑)𝐱𝐂𝐩𝐠𝐱(𝐓𝐑−𝐒𝐭𝐚𝐜𝐤 𝐓𝐞𝐦𝐩𝐞𝐫𝐚𝐭𝐮𝐫𝐞)}
𝐇𝐇𝐕] (4.2)
Where,
EA = Excess air percentage during combustion, %
SR = Stoichiometric Ratio, no units
Cpg = Specific heat capacity of combustion gas, Btu/lb-0F
TR = Initial temperature rise during combustion, 0F
HHV = Higher heating value of fuel, Btu/lb

57
Figure 4-7: Computation of boiler-based CHP parameters-3
Similarly, in Figure 4-7, the calculated parameters for one of the four processes are shown. The
process thermal demand, PRV outlet pressure, backpressure turbine implementation, and steam
requirement are entered by the user in the input section. When a process requires saturated steam
at a lower pressure, a PRV with desuperheating is selected by COGENTEC. It calculates additional
makeup water required by the PRV to reduce the pressure to the desired state. PRV with
desuperheater utilizes makeup water to expand the superheated steam into saturated steam/water.
Outlet enthalpy from the PRV (with desuperheating) is assumed to be the specific enthalpy of
saturated steam at the outlet pressure. Similarly, the outlet steam temperature after the
desuperheating process in the PRV is also assumed to be the saturated steam temperature at the set
pressure. The calculations for PRV with a desuperheater is shown below:
Makeup water for PRV = Steam flow rate x (hs- hprv)
hprv-hmw (4.3)
Where,
hs = Specific enthalpy of inlet steam, Btu/lb
hprv = Specific enthalpy of PRV outlet steam, Btu/lb
hmw = Specific enthalpy of makeup water, Btu/lb

58
4.3.2 Gas-turbine based CHP system
Figure 4-8: Computation of gas turbine-based CHP parameters-1
Figure 4-9: Computation of gas turbine-based CHP parameters-2

59
Figures 4-8 and 4-9 illustrate the calculated parameters in a gas turbine-based CHP system.
COGENTEC computes the power generated by the gas turbine, a steam turbine in the Rankine
cycle, and the Organic Rankine cycle (ORC). The user selects an option to implement a condensing
turbine or a backpressure turbine to generate electricity from the steam coming out of the waste
heat recovery boiler. COGENTEC automatically integrates an ORC based on the working fluid of
ammonia and water mixture. While it does not do calculations of an ORC in detail, the research
assumes that for a 1 MMBtu/hr of energy transferred from the hot water to the working fluid in
the ORC, 36 kW of electrical energy is generated [53], [54]. Similarly, with a backpressure turbine,
COGENTEC calculates savings and investment costs for an absorption chilling system as well.
4.4 Output spreadsheet
COGENTEC has five output screens for the boiler and gas turbine-based CHP system. They are
shown below:
1. Boiler diagram
2. Result – Boiler
3. Diagram – Gas turbine (Backpressure turbine)
4. Diagram – Gas turbine (Condensing turbine)
5. Result – Gas turbine
There are specific buttons in each spreadsheet to move between them. These buttons simplify the
user interface and let a user switch to different sheets as per their needs. Figure 4-10 shows the
switching buttons. The gas turbine diagram (either with a backpressure turbine or a condensing
turbine) sheet is opened when the user clicks on the first button shown below. COGENTEC decides
which spreadsheet to open depending upon the utilization of the steam turbine for the bottoming
cycle. Similarly, clicking on the “results” button would lead the user to the results page where total
cost savings, investment cost, the payback on investment period on investment, and the sensitivity
graphs are located.
Figure 4-10: Buttons to move between spreadsheets

60
Figure 4-11: Boiler diagram result using a condensing turbine

61
The boiler based-CHP diagram is an inclusive diagram that corporates the major processes and
equipment in a topping cycle CHP system. Figure 4-11 presents a flowchart of the CHP process
which starts with boiler feed water going into the boiler. The boiler heats the water to change its
phase to superheated steam as per the requirement of the facility’s processes. COGENTEC allows
up to four different industrial processes that utilize superheated steam, low-pressure steam, and
saturated water. Similarly, the excess steam is directed into a backpressure turbine or a condensing
steam turbine, that generates electricity. In cases that utilize a backpressure turbine, the outlet
steam still has a substantial amount of energy that is transferred to the working fluid in absorption
chilling and comfort heating. However, if a condensing turbine is used, the turbine outlet is
saturated water which cannot be used for absorption chilling. Therefore, in cases where a
condensing turbine is used, the facility can utilize the turbine outlet water for comfort heating
during the winter season.
The user can enter the percentage loss in steam during the process. The makeup water is then
mixed with the turbine outlet water in a condenser, and later with makeup water. Condensate is
then returned to the boiler through a deaerator and an economizer. The deaerator uses a portion of
steam from the boiler. The amount of steam consumed by the deaerator is depended upon the
temperature and amount of the condensate. The deaerator loses a percentage of steam which
contains dissolved oxygen and CO2. The flash steam removes dissolved oxygen and impurities
from the condensate and sends it to the boiler economizer where it is heated up to its saturated
temperature.
The boiler diagram also has boiler losses, stack losses, blowdown losses, the total power generated
embedded in it. The diagram is aimed to help the user to carefully gauge the process and its
parameters.

62
Figure 4-12: Payback on investment result and sensitivity analysis graphs

63
Figure 4-12 shows the results of the boiler-based CHP system that constitutes the capital cost,
annual cost, annual savings, and the payback on investment. If the total cost incurred on fuel and
water is more than that of the cost savings, then COGENTEC will calculate the payback on
investment is extremely high and not feasible. The capital cost includes the cost of the steam
turbine, absorption chiller, and grid interconnection costs (if applicable). The table processes the
total savings, capital cost, and annual cost to calculate the payback on investment on the
investment.
Similarly, the spreadsheet also has numerous graphs for pinch analysis which lets the user know
about the what-if scenarios for different variable values. The graphs are generated by plotting the
major input variables against the output variables. Some examples include steam flowrate vs. kW
generation, steam pressure vs. kW generation, and turbine exit pressure vs. payback on investment.
The result sheet has different sensitivity graphs that analyze the impact of change in the
independent variable on the dependent variable. Figure 4-13, 4-14, and 4-15 show the results of a
gas turbine-based CHP.
Figure 4-13: Gas turbine-based CHP results

64
Figure 4-14: Gas turbine-based CHP (Backpressure turbine)

65
Figure 4-15: Gas turbine-based topping cycle CHP (condensing turbine)

66
Finally, COGENTEC performs sensitivity analysis using different input variables that have a
substantial impact on output parameters such as power generation and payback on investment
period. The simple payback on investment period includes the cost of steam turbines, gas turbines,
absorption chillers, energy, and water cost. The sensitivity charts help users picture the range of
independent variables that result in corresponding savings.
4.5 Conclusion
Microsoft ExcelR-based decision support system “COGENTEC” was designed to evaluate the
technical and economic feasibility of a topping cycle based CHP system. COGENTEC has the
technical capability of incorporating two types of CHP topping cycle systems (i) boiler-based CHP
system (ii) gas turbine-based CHP system. The boiler-based CHP system utilizes a steam boiler
whose excess steam is used to generate electricity aided by a steam turbine. Similarly, Gas-turbine
based CHP system utilizes a gas turbine unit and a waste heat recovery boiler to generate steam
from the turbine exhaust to generate electricity. COGENTEC computes the results such as the
power generation, payback on the investment, a block diagram of the CHP system, and graphs on
the sensitivity analysis is various operating parameters. The user can analyze the results and the
ranges of values calculated by the sensitivity analysis graphs to decide whether or not to implement
a topping cycle CHP system in their facility.

67
5 Model Execution
5.1 Boiler-based CHP system
As mentioned in Section 4.2.1, the data collected from the facility are entered in the input screen
of the COGENTEC. The information is then processed in COGENTEC and displayed in the result
and boiler diagram tab. The process that COGENTEC utilizes is described in the sections below.
5.1.1 Verification process
The input parameters from Table 3.1 are selected as per the requirements of the plant which has
an opportunity for the topping cycle. The plant has a natural gas boiler of rated capacity 204.8
MMBtu/hr that can generate a maximum 150,000 lbs/hr of steam consistently. However, only
43,500 lbs/hr of steam is generated in the current scenario to satisfy the heat requirements for two
plant processes. The validation process will have the boiler run at its maximum capacity and
generate steam at the required pressure and temperature as per its capability. The output power
using a condensing steam turbine will be generated at the designated steam flow rate, pressure,
temperature, specific enthalpy, and specific entropy. The fuel used in the boiler is natural gas and
its price is $3.0/MMBtu and the cost of electricity is $0.09/kWh. The measurements of power will
help to get the data on the economic benefits of power generation by varying several major
parameters. The change in steam quantity would also change the amount of electricity and
supplemental heat generation in the pinch analysis. The study is carried out under the current
pressure and temperature condition of steam that the facility has been working with. The analysis
provides us the respective amount of heat and power generation. Similarly, a sensitivity analysis
chart is developed for the relationship between the output parameters and the change in input
parameters to identify a point of breakeven in terms of cost savings and natural gas usage cost.
The boiler system in the facility has an economizer which utilizes the heat content from the flue
gas to pre-heat the feed water going to the boiler furnace. The stack temperature is 1,3570 and it
heats the boiler feed water to a temperature of 2260F and a pressure of 192 psig. Pre-heating the
boiler feedwater reduces the load on the burners and saves natural gas usage. Similarly, the stack
gas can also be used to pre-heat the combustion air going to the burners, thereby reducing natural
gas usage. However, this energy efficiency method is not implemented by the facility. The boiler

68
is set at a steam flow rate of 150,000 lbs/hr, out of which 43,500 lbs/hr is used for the process, and
the remaining steam is used to rotate the prime mover for power generation. A condensing steam
turbine is used for the validation process because it generates more power than a backpressure
turbine. The steam that enters the turbine is at 186 psig and 6640F and comes out of the turbine at
-10 psig and 1660F, generating power by moving the blades of the turbine. The steam at a negative
pressure is immediately condensed by a condenser that is attached to the turbine, thereby losing
its latent heat of vaporization. Finally, the saturated water can be used to heat the air for comfort
heating during the winter season. In a case where a backpressure turbine is used, the outlet steam
can also be used conveniently for an absorption chiller system. After utilizing the heat content
from the turbine water, makeup water is introduced to the system to fill in the void created by the
usage of all the steam by the process. The mixture of water is then sent to the deaerator for water
treatment, after which it enters the economizer gaining sensible heat by exchanging heat with the
stack air. Finally, the water is sent back to the boiler to complete the loop. Figures 5-1 and 5-2
show the input parameters and input values for the facility.
Figure 5-1: Input values for the facility-Part 1

69
Figure 5-2: Input values for the facility- Part 2
5.1.2 Boiler diagram
Figure 5-3 shows the boiler diagram for the facility during the validation process. While generating
the maximum amount of steam (150,000 lbs/hr, 186 psig, 664°F) for this boiler, the energy content
in the steam is calculated to be 203.32 MMBtu/hr. The maximum capacity of the boiler is 204
MMBtu/hr, so the generation of the steam is mathematically accurate. This process would establish
the boiler at full-load, and the electricity generation would be maximum. It shows the total power
generated as 6,708 kW when the steam at the mass flow rate of 101,610 lbs/hr passes through a
condensing steam turbine and exits as saturated water by losing its latent heat of vaporization in
the turbine condenser. The steam headed to the industrial process is used without any recovery.
Therefore, 49,890 lbs/hr of water is pumped into the cycle as make-up water. The usage of a

70
condensing turbine made it impossible to implement an absorption chilling system as the turbine
outlet water does not have enough energy to support trigeneration. However, the water can be used
for comfort heating through HVAC systems during winter as shown in the diagram. The mixture
of turbine outlet water and makeup water (151,500 lbs/hr) goes to the deaerator where it is treated
using steam from the boiler. 1,500 lbs/hr steam that contains impurities and dissolved oxygen is
vented out of the deaerator. The water, then, passes through an economizer where it gains sensible
heat, after which, it is sent to the boiler to repeat the process. A tremendous amount of energy is
wasted through stack gas (166.25 MMBtu/hr). It is suggested to use the stack gas to preheat the
combustion air and implement burner controls to reduce losses in the stack gases.
5.1.3 Results
Figure 5-3 shows the results obtained from this CHP cycle. The payback on investment comes out
to be a negative value. It means that the annual savings after implementing the CHP cycle are
lesser than the annual expenditure. Thus, the CHP cycle at this facility with its respective energy,
fuel, and water cost will not result in savings. COGENTEC shows negative payback as infinite,
and the sensitivity analysis graphs show the negative, infeasible payback as “0” months. Similarly,
the size of the boiler is also an important factor. However, the most important factor for this
calculation is the energy and fuel cost. With a lower fuel cost, the project could have had desirable
payback on investment. Moreover, the combustion efficiency of the boiler furnace is around 50%
only. It means that half of the fuel is wasted in stack gases. The facility can implement automatic
burner controls and pre-heat combustion air to ultimately increase the combustion efficiency and
produce a desirable payback on investment.
Figure 5-3: Results for the boiler-based CHP cycle

71
Figure 5-4: Boiler diagram using a condensing turbine

72
5.1.4 Sensitivity Analysis
The sensitivity analysis is integrated into COGENTEC, thereby making it easier for the user to
change the input values to produce as many graphs as they require. Figure 5-5 shows the
relationship between the changes in the input variables to the power generation in (kW) and the
payback on investment period on investment (months).
Figure 5-5: Pinch analysis between input and output parameters – Part 1
0
5,000
10,000
15,000
20,000
25,000
30,000
35,000
40,000
0 200,000 400,000 600,000 800,000
Po
wer
Gen
erat
ed (
kW
)
Steam Massflow Rate (lbs/hr)
Steam Flowrate vs. kW generation
0
2,000
4,000
6,000
8,000
10,000
0 200 400 600 800
Po
wer
Gen
erat
ed (
kW
)
Steam Pressure (psig)
Steam Pressure vs. kW generation
0
1,000
2,000
3,000
4,000
5,000
6,000
7,000
8,000
0 200 400 600 800 1,000
Po
wer
Gen
erat
ed (
kW
)
Steam Temperature (°F)
Steam Temperature vs. kW generation
0
2,000
4,000
6,000
8,000
10,000
-20 0 20 40
Po
wer
Gen
erat
ed (
kW
)
Turbine Outlet Pressure (psig)
Turbine Outlet Pressure vs. kW generation

73
Figure 5-6: Pinch analysis between input and output parameters – Part 21
1 Zero months payback in the graphs suggest infinite and infeasible payback on the investment
0%
10%
20%
30%
40%
50%
60%
0 200 400 600 800 1,000
Co
mb
ust
ion
Eff
icie
ncy
Steam Temperature (°F)
Steam Temperature vs. Combustion Efficiency
0
0
0
1
1
1
0 200,000 400,000 600,000 800,000
Pay
bac
k (
Mo
nth
s)
Steam Massflow Rate (lbs/hr)
Steam Massflow rate vs. Payback (months)
0
0.2
0.4
0.6
0.8
1
0 200 400 600 800
Pay
bac
k (
Mo
nth
s)
Steam Pressure (psig)
Steam Pressure vs. Payback (months)
0
0.2
0.4
0.6
0.8
1
0 200 400 600 800 1,000
Pay
bac
k (
Mo
nth
s)
Steam Temperature (°F)
Steam Temperature vs. Payback (months)
0
0.2
0.4
0.6
0.8
1
0.00 10.00 20.00 30.00
Pay
bac
k (
Mo
nth
s)
Demand Cost ($/kW-Month)
Electricity Demand cost vs. Payback

74
The relationship between the steam flow rate and power generation is linear. Despite generating
more power at a higher steam flow rate, the payback on investment will not be feasible unless there
is some serious revamp in the cost of natural gas and electricity usage. Steam pressure had a
minimal impact on power generation; it also had the same impact in case of payback on investment
period on investment. Steam temperature and turbine outlet pressure had an important relationship
on power generation and payback on the investment period. However, for this facility, the
minimum turbine outlet pressure (maximum energy transfer) is not enough for higher annual cost
savings than that of the cost incurred.
Figure 5-7 shows the impact of natural gas and electricity usage cost in the payback on investment
period on investment. These two parameters are by far the biggest influencers on the payback on
investment period on investment. If the cost of natural gas is less than $2.00/MMBtu, then the
project will have a positive and desirable payback on investment. Similarly, when the cost of
electricity usage is more than $0.14/kWh, then the facility will exhibit desirable payback on
investment. The payback on investment would be desirable as the annual cost savings will exceed
the annual cost incurred in the facility.
0
50
100
150
200
250
300
0.00 0.05 0.10 0.15 0.20 0.25
Pay
bac
k (
Mo
nth
s)
Electricity usage cost ($/kWh)
Electricity usage cost vs. Payback

75
Figure 5-7: Sensitivity analysis on payback on investment period to NG and electricity
usage cost2
Figure 5-8 shows the relationship between the payback on investment period, natural gas cost, and
electricity usage cost. It can be inferred from the figure that a lower natural gas cost and a higher
electricity usage cost is vital to achieving better savings and payback on investment. For the
facility, the most optimal natural gas and electricity usage cost are $2.75/MMBtu and $0.14/kWh
for a 4 years payback on investment. There is a better payback on investment outcomes at various
energy and fuel costs; however, those costs are not in the control of the facility, therefore, the
analysis is only carried out for information on the range of costs.
Figure 5-8: Pinch analysis between the payback on investment period, natural gas cost and
electricity usage cost
2 Zero months payback in the graphs suggest infinite and infeasible payback on the investment
0
50
100
150
200
250
300
0.00 0.50 1.00 1.50 2.00 2.50 3.00 3.50 4.00 4.50
Pay
bac
k (
Mo
nth
s)
NG cost ($/MMBtu)
Natural gas cost vs. Payback
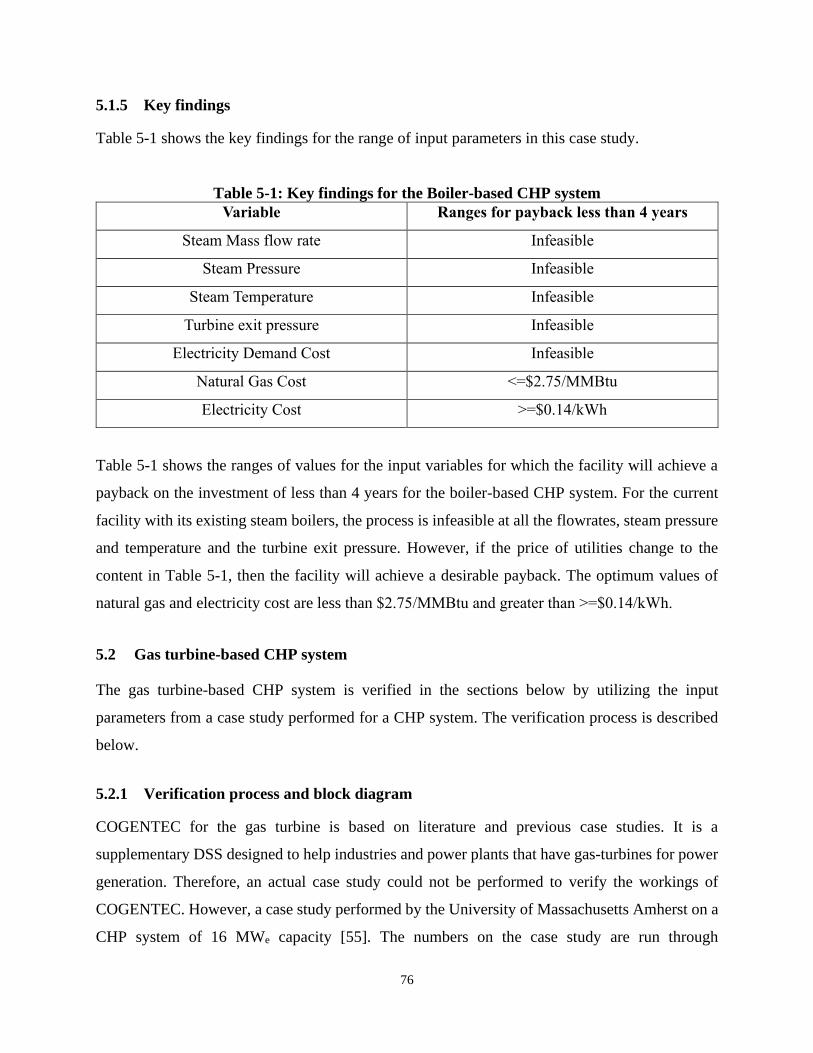
76
5.1.5 Key findings
Table 5-1 shows the key findings for the range of input parameters in this case study.
Table 5-1: Key findings for the Boiler-based CHP system
Variable Ranges for payback less than 4 years
Steam Mass flow rate Infeasible
Steam Pressure Infeasible
Steam Temperature Infeasible
Turbine exit pressure Infeasible
Electricity Demand Cost Infeasible
Natural Gas Cost <=$2.75/MMBtu
Electricity Cost >=$0.14/kWh
Table 5-1 shows the ranges of values for the input variables for which the facility will achieve a
payback on the investment of less than 4 years for the boiler-based CHP system. For the current
facility with its existing steam boilers, the process is infeasible at all the flowrates, steam pressure
and temperature and the turbine exit pressure. However, if the price of utilities change to the
content in Table 5-1, then the facility will achieve a desirable payback. The optimum values of
natural gas and electricity cost are less than $2.75/MMBtu and greater than >=$0.14/kWh.
5.2 Gas turbine-based CHP system
The gas turbine-based CHP system is verified in the sections below by utilizing the input
parameters from a case study performed for a CHP system. The verification process is described
below.
5.2.1 Verification process and block diagram
COGENTEC for the gas turbine is based on literature and previous case studies. It is a
supplementary DSS designed to help industries and power plants that have gas-turbines for power
generation. Therefore, an actual case study could not be performed to verify the workings of
COGENTEC. However, a case study performed by the University of Massachusetts Amherst on a
CHP system of 16 MWe capacity [55]. The numbers on the case study are run through

77
COGENTEC to verify the capability and accuracy of COGENTEC. The gas turbine used in the
case study is a packaged unit comprised of an inlet air compressor, a combustion chamber, and a
gas turbine. The hot turbine outlet temperature is utilized by a waste heat recovery boiler to
generate steam at a rate of 100,000 lbs/hr. The operating pressure and temperature of the steam is
600 psig and 7500F. Figure 5-9 shows the input parameters entered in COGENTEC by referring
to the case study.
Figure 5-9: Input values with the UMass Amherst Case study [55]
The case study did not showcase a few important parameters such as excess air %, compressor
efficiency, and turbine efficiency. The excess air percentage of the gas turbine package is estimated
as per the typical gas turbine excess air %. Similarly, the turbine isentropic efficiency and the

78
compressor efficiency has also been entered as per other cases with typical gas turbines systems.
The output from COGENTEC and the case study are shown in Figures 5-10 and 5-11.
It can be seen from the two figures that the total power output is within the range of 176 kW. Based
on the unavailability of all the data, the closeness of the net output power generation makes
COGENTEC substantially adequate. Similarly, the turbine outlet temperature of COGENTEC and
the case study is 9870F and 9070F. The case study used all its steam for several steam headers that
have their respective backpressure steam turbines of 3.5 MWe and 2 MWe capacity.
Unsurprisingly, when a backpressure turbine (600/15 psig) is introduced in COGENTEC, the
power generation (5.8 MWe) is closely equivalent to that of the case study (5.5 MWe). There is a
discrepancy in the power generation which is due to losses prevalent by using two steam turbines.
In COGENTEC, the outlet steam from the backpressure turbine is used for an absorption chilling
system, comfort heating, and an Organic Kalina cycle (ORC). Studies have been carried out by
utilizing geothermal water with a temperature range of 100-3000F to operate an ORC. The
utilization of a new cycle increases the overall efficiency of the CHP system.
Figure 5-10: Case study input and output parameters [55]

79
Figure 5-11: Gas-turbine based CHP system output

80
5.2.2 Results
The implementation of a gas turbine-based CHP system is lucrative in terms of economics. Since
the gas turbine systems are highly efficient and they use a significantly lower amount of fuel while
compared to combustion-air, the total fuel cost is overshadowed by the respective energy cost
savings. Natural gas cost savings for comfort heating can be higher if the facility is operating an
HVAC system of higher capacity. The total electricity savings from the gas turbine is astronomical
when compared with the natural gas cost incurred to operate the turbine. Due to this fact, a gas
turbine-based CHP system is economically beneficial. The total payback on investment period on
investment is less than 2 years for the case study.
Figure 5-12: Results
5.2.3 Sensitivity analysis
As performed with the boiler-based CHP, pinch analysis is carried out in the gas turbine-based
CHP system as well. The graphs are readily available in the results spreadsheet, and they are
modified every time the user enters/modifies the values of the input parameters. The input
parameters chosen for the analysis are inlet air mass flow rate, inlet air temperature, compressor
efficiency, the pressure ratio of the compressor, excess air percentage, waste heat boiler steam
quantity, waste heat boiler steam pressure and temperature. Similarly, the output parameters that

81
are considered for the analysis are total power generation by the system and payback on investment
period on investment. These two parameters are considered as they are at the forefront of the
technical and economical capability of the system. Therefore, they have been chosen for the
analysis. Figures 5-13, 5-14, and 5-15 show the graphs for the analysis carried out.

82
Figure 5-13: Gas Turbine Pinch analysis graphs - 1
0
10,000
20,000
30,000
40,000
50,000
0 500,000 1,000,000 1,500,000
Po
wer
Gen
erat
ion
(k
W)
Inlet air flow rate (lbs/hr)
Inlet air vs Total power generated
18,000
18,500
19,000
19,500
20,000
20,500
21,000
0 50 100 150
Po
wer
Gen
erat
ion
(k
W)
Inlet air temperature (0F)
Inlet air temperature vs. Total power generated
18,500
19,000
19,500
20,000
20,500
21,000
21,500
50% 60% 70% 80% 90% 100%
Po
wer
Gen
erat
ion
(k
W)
Compressor Efficiency (%)
Compressor Eff vs. Total power generated
(10,000)
(5,000)
0
5,000
10,000
15,000
20,000
25,000
0 5 10 15 20 25
Po
wer
Gen
erat
ion
(k
W)
Pressure ratio
Pressure Ratio vs. Total power generated
0
5,000
10,000
15,000
20,000
25,000
30,000
35,000
40,000
0% 200% 400% 600%
Po
wer
Gen
erat
ion
(k
W)
Excess air percentage
Excess Air % vs. Total power generated
0
10,000
20,000
30,000
40,000
50,000
0 200,000 400,000 600,000
Po
wer
Gen
erat
ion
(k
W)
Steam Mass flow rate (lbs/hr)
Waste heat boiler steam quantitiy vs. Total power
generated

83
Figure 5-14: Gas Turbine Pinch analysis graphs - 2
17,00017,50018,00018,50019,00019,50020,00020,50021,000
0 500 1,000 1,500
Po
wer
Gen
erat
ion
(k
W)
Steam Pressure (psig)
Waste heat boiler steam pressure vs. Total Power
Generated
0
5,000
10,000
15,000
20,000
25,000
0 500 1,000 1,500
Po
wer
Gen
erat
ion
(k
W)
Steam temperature (0F)
Waste heat boiler steam temperature vs. Total Power
Generated
0
5
10
15
20
25
0 500,000 1,000,000 1,500,000
Pay
bac
k o
n i
nv
estm
ent
(mo
nth
s)
Air flow rate (lbs/hr)
Inlet air flow rate vs Payback on investment
21
21
21
21
22
22
22
22
0 50 100 150
Pay
bac
k o
n i
nv
estm
ent
(mo
nth
s)
Inlet air temperature (0F)
Inlet air temperature vs. Payback on investment
20
20
21
21
22
22
23
0% 50% 100% 150%
Pay
bac
k o
n i
nv
estm
ent
(mo
nth
s)
Compressor efficiency (%)
Compressor Eff vs. Payback on investment
0
5
10
15
20
25
30
35
40
0 5 10 15 20 25
Pay
bac
k o
n i
nv
estm
ent
(mo
nth
s)
Pressure ratio
Compressor Pressure Ratio vs. Payback on investment

84
Figure 5-15: Gas turbine Pinch analysis graph - 3
19
19
20
20
21
21
22
22
23
0% 200% 400% 600%
Pay
bac
k o
n i
nv
estm
ent
(mo
nth
s)
Excess air %
Excess Air % vs. Payback on investment
0
5
10
15
20
25
30
0 200,000 400,000 600,000
Pay
bac
k o
n i
nv
estm
ent
(mo
nth
s)
Steam quantity (lbs/hr)
Waste heat boiler steam quantity vs. Payback on
investment
19
20
21
22
23
24
25
0 500 1,000 1,500
Pay
bac
k o
n i
nv
estm
ent
(mo
nth
s)
Steam Pressure (psig)
Waste heat boiler steam pressure vs. Payback on
investment
0
5
10
15
20
25
30
35
0 500 1,000 1,500
Pay
bac
k o
n i
nv
estm
ent
(mo
nth
s)
Steam Temperature (0F)
Waste heat boiler steam temperature vs. Payback on
investment
0
5
10
15
20
25
0 10 20 30
Pay
bac
k (
mo
nth
s)
Demand Cost ($/kW-month)
Demand Cost vs. Payback
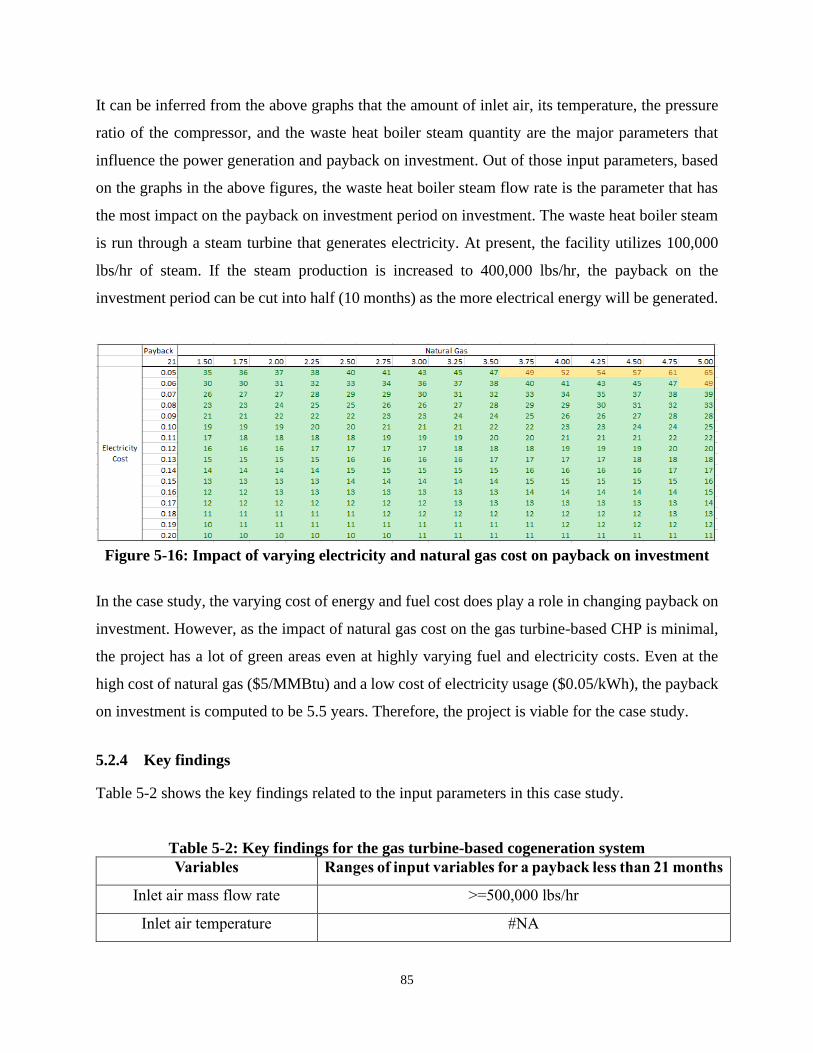
85
It can be inferred from the above graphs that the amount of inlet air, its temperature, the pressure
ratio of the compressor, and the waste heat boiler steam quantity are the major parameters that
influence the power generation and payback on investment. Out of those input parameters, based
on the graphs in the above figures, the waste heat boiler steam flow rate is the parameter that has
the most impact on the payback on investment period on investment. The waste heat boiler steam
is run through a steam turbine that generates electricity. At present, the facility utilizes 100,000
lbs/hr of steam. If the steam production is increased to 400,000 lbs/hr, the payback on the
investment period can be cut into half (10 months) as the more electrical energy will be generated.
Figure 5-16: Impact of varying electricity and natural gas cost on payback on investment
In the case study, the varying cost of energy and fuel cost does play a role in changing payback on
investment. However, as the impact of natural gas cost on the gas turbine-based CHP is minimal,
the project has a lot of green areas even at highly varying fuel and electricity costs. Even at the
high cost of natural gas ($5/MMBtu) and a low cost of electricity usage ($0.05/kWh), the payback
on investment is computed to be 5.5 years. Therefore, the project is viable for the case study.
5.2.4 Key findings
Table 5-2 shows the key findings related to the input parameters in this case study.
Table 5-2: Key findings for the gas turbine-based cogeneration system
Variables Ranges of input variables for a payback less than 21 months
Inlet air mass flow rate >=500,000 lbs/hr
Inlet air temperature #NA
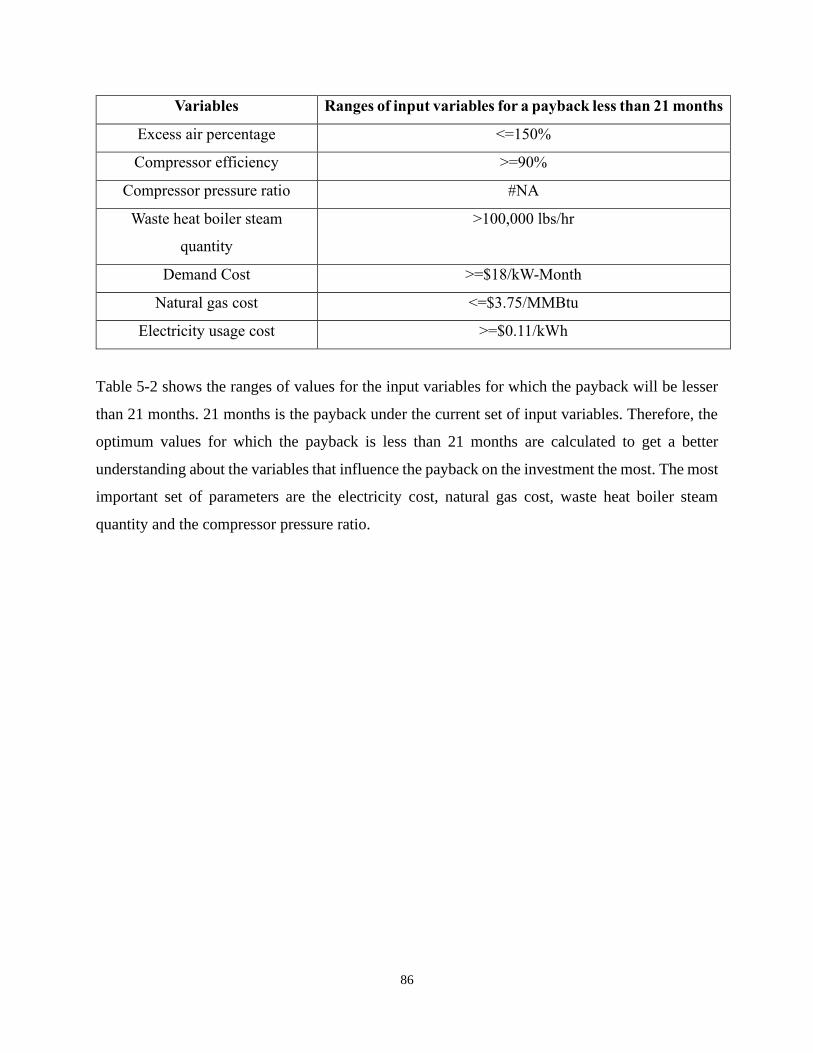
86
Variables Ranges of input variables for a payback less than 21 months
Excess air percentage <=150%
Compressor efficiency >=90%
Compressor pressure ratio #NA
Waste heat boiler steam
quantity
>100,000 lbs/hr
Demand Cost >=$18/kW-Month
Natural gas cost <=$3.75/MMBtu
Electricity usage cost >=$0.11/kWh
Table 5-2 shows the ranges of values for the input variables for which the payback will be lesser
than 21 months. 21 months is the payback under the current set of input variables. Therefore, the
optimum values for which the payback is less than 21 months are calculated to get a better
understanding about the variables that influence the payback on the investment the most. The most
important set of parameters are the electricity cost, natural gas cost, waste heat boiler steam
quantity and the compressor pressure ratio.

87
6 Conclusion and Future Work
In this study, the effect of the operational parameters of a steam boiler and a gas turbine on the
economic and technical aspects in implementing a topping cycle CHP system is studied and
verified. The study was carried out by developing an MS ExcelR-based decision support system
called “COGENTEC” in which a user can enter the input parameters related to the operations of a
steam turbine or a gas turbine. The variables have been decided as per the CHP system’s operations
and literature survey carried out in previous studies. The study computes the results based on the
input parameters and displays the results, based on savings, expenditure, and the payback on
investment. Moreover, a block diagram associated with the CHP system is also computed by
COGENTEC that makes it easier for the user to grasp the flow of steam/water and the energy in
the system. If the payback on investment is feasible, the result tab will show the payback in months;
however, if the payback is infeasible, then the result tab would display infeasible as the payback.
COGENTEC lets the user select two different primary equipment. The first option is that of a
boiler where the excess steam of the boiler is used to generate steam through a steam turbine. The
second option is that of a gas turbine that generates electricity and the turbine exhaust is utilized
for heat in the form of comfort heating, district heating, or a waste heat recovery boiler for power
generation.
COGENTEC has been verified by utilizing the steam boiler operational and input parameters from
a pulp and paper industry. Similarly, the gas turbine-based CHP system was verified by using the
data from a case study related to a CHP system with a gas turbine and a waste heat recovery boiler
for their operation. The summary of the key findings of the analysis are listed below:
1. The most important parameters for obtaining a feasible payback on investment are
electricity usage and natural gas usage cost in a gas turbine and boiler-based CHP system.
2. Power generation from a steam turbine is linearly proportional to the steam generation in
a steam boiler or a waste heat recovery boiler.
3. Steam pressure and temperature are directly proportional to the power generation;
however, their impact is not as important as that of the steam quantity.

88
4. The steam turbine outlet pressure is inversely proportional to the power generation and the
payback on investment. Lower outlet pressure generates more power and lowers the
payback on investment.
5. To achieve a feasible payback in the paper industry, the cost of electricity must be more
than $0.14/kWh. Similarly, the cost of natural gas must be less than $2.00/MMBtu for a
feasible payback. For the facility under consideration in the case study, the demand cost
did not influence the payback on the investment.
6. The most optimal combined cost of electricity and natural gas for a feasible payback on
investment is $0.12/kWh and $2.5/MMBtu. These costs would result in an eight-year
payback.
7. Similarly, for a gas-turbine based CHP system case study, the optimal cost of the natural
gas and electricity should be $3.00/MMBtu ad $0.09/kWh for a 2 years payback.
8. Inlet air temperature and quantity of the gas turbine are linearly dependent on the total
power generation. Inlet air temperature is directly proportional to the power generation
whereas the inlet air temperature is inversely proportional to the power generation.
9. The compressor pressure ratio and the waste heat boiler steam quantity are the most
important parameters after the natural gas and electricity usage for a lower payback in a
gas turbine-based CHP.
Future work on this research study involves the formulation of a dynamic DSS by increasing the
number of parameters for the boilers and the steam turbine, and analyzing their continuous effects,
if any, for the economic and technical benefits of a topping cycle CHP system. A summary of
possible forthcoming work relating to this study are listed below:
1. Develop a dynamic DSS procure results of a topping cycle CHP system over time. Usage
of dynamic data collection and sensors to get data over time is another step for this study.
2. COGENTEC deals in brief on the end-use and their characteristics. It can be developed to
include an enumeration of different detailed end uses.
3. Usage of multiple boilers, steam turbines, and dual burners was not a part of this study.
Integrating multiple equipment would result in a better embodiment of a real-life process.

89
4. Time of day rates of natural gas and electricity based on the principle of distributed
generation should be explored in order to provide a realistic cogeneration analysis.
5. Finally, the model can be modified to create a system based on target power required, and
subsequent derivation for the energy system attributes such as boilers and steam turbines.

90
7 Bibliography
[1] "AMO Industrial Distributed Energy: Combine Heat and Power: A Clean Energy Solution,"
U.S. Department of Energy, U.S. Environmental Protection Agency, August 2012.
[2] A. Abuelnuor, K. M. Saqr, S. A. Mohieldein, K. A. Dafallah, M. M. Abdullah and Y. A.
Nogoud, "Exergy Analysis of Garri “2” 180 MW Combined Cycle Power Plant," Renewable
and Sustainable Energy Reviews, vol. 79, no. C, pp. 960-969, 2017.
[3] B. Hedman, A. Hampson and K. Darrow, "The Opportunity for CHP in the United States,"
ICF International, 2013.
[4] M. Gambini, M. Vellini, T. Stilo, M. Manno and S. Bellocchi, "High-Efficiency
Cogeneration Systems: The Case of the Paper Industry in Italy," Energies, vol. 12, no. 3, pp.
335-335, 2019.
[5] L. Stone, A Small Country Goes Big with Renewables: Denmark’s goal to be fossil fuel free,
Rocky Mountian Institute, March, 2016.
[6] S. Shafiee and E. Topal, "When will Fossil Fuel Reserves be Diminished?," Energy Policy,
vol. 37, no. 1, pp. 181-189, 2009.
[7] A. Berman, Shale Gas Is Not A Revolution, Forbes, 2017.
[8] J. Wang, Y. Dai and L. Gao, "Exergy Analyses and Parametric Optimizations for Different
Cogeneration Power Plants in Cement Industry," Applied Energy, vol. 86, no. 6, pp. 941-
948, 2009.
[9] P. Otis, "CHP Industrial Bottoming and Topping Cycle with Energy Information
Administration Survey Data," U.S. Energy Information Administration, 14 August 2015.
[Online]. Available: https://www.eia.gov/workingpapers/pdf/chp-Industrial_81415.pdf.
[10] M. Korobitsyn, New and Advanced Energy Conversion Technologies. Analysis of
Cogeneration, Combined and Integrated Cycles, Amsterdam: Febodruk BV, Enschede, 1998.
[11] A. Poullikkas, "An Overview of Current and Future Sustainable Gas Turbine Technologies,"
Renewable and Sustainable Energy Reviews, vol. 9, no. 5, pp. 409-443, 2005.
91
[12] G. Holdmann, "The Chena Hot Springs 400kW Geothermal Power Plant: Experience Gained
During the First Year of Operation," Chena Geothermal Power Plant Report, Chena Power
Plant, Alaska, pp. 1-9, 2007.
[13] A. Kalina, "Combined Cycle System with Novel Bottoming Cycle," Journal of Engineering
for Gas Turbines and Power, vol. 106, pp. 737-742, 1984.
[14] J. Bujak, "Optimal Control of Energy Losses in Multi-Boiler Steam Systems," Energy, vol.
34, pp. 1260-1270, 2009.
[15] G. Harell, "Steam System Survey Guide," Oakridge National Laboratory, Oakridge,
Tennessee, 2002.
[16] G. Harrel and P. Harrel, "Boiler Blowdown Energy Recovery," Energy Engineering, vol.
101, no. 5, pp. 32-42, 2004.
[17] "Combined Heat and Power Technology Fact Sheet Series - Steam Turbines," U.S. DOE's
Office of Energy Efficiency and Renewable Energy (EERE), July 2016.
[18] U. S. Environmental Protection Agency, "Catalog of CHP Technologies," 2015.
[19] "Combined Heat and Power Technology Fact Sheet Series - Gas Turbines," U.S. DOE's
Office of Energy Efficiency and Renewable Energy (EERE), July 2016.
[20] "Combined Heat and Power Technology - Absorption Chillers for CHP," U.S. DOE's Office
of Energy Efficiency and Renewable Energy (EERE), May 2017.
[21] "Energy Tips – Steam - Steam Tip Sheet #14," U.S. DOE's Office of Energy Efficiency and
Renewable Energy (EERE), January 2006.
[22] L. Bird, F. Flores, C. Volpi, K. Ardani, D. Manning and R. McAllister, "Review of
Interconnection Practices and Cost in the Western States," National Renewable Energy
Laboratory. NREL /TP-6A20-71232, Golden, CO, 2018.
[23] "Database of State Incentives for Renewables & Efficiency (DSIRE)," N.C. State University.
[Online].
[24] "Monthly Energy Review," U.S. Energy Information Administration , Washington, DC,
2019.
[25] V. Singh and R. Radermacher, "Boost Efficiency and Reliability via Cogeneration,"
Buildings, vol. 103, no. 6, pp. 78-81, 2009.

92
[26] M. Khan and I. Tlili, "Innovative Thermodynamic Parametric Investigation of Gas and
Steam Bottoming Cycles with Heat Exchanger and Heat Recovery Steam Generator: Energy
and Exergy Analysis," Energy Reports, vol. 4, pp. 497-506, 2018.
[27] C. Butcher and B. Reddy, "Second Law Analysis of a Waste Heat Recovery Based Power
Generation System," International Journal of Heat and Mass Transfer, vol. 50, pp. 2355-
2363, 2007.
[28] S. Frigo, R. Gabbrielli and L. Linari, "Feasibility Study of a CHP Plant with Steam Turbine
and Biomass Gasification for Tissue Paper Production," Energy Procedia, vol. 148, pp. 751-
757, 2018.
[29] M. H. Ahmadi, M. A. Nazari, M. Sadeghzadeh, F. Pourfayaz, M. Ghazvini, T. Ming, J. P.
Meyer and M. Sharifpur, "Thermodynamic and Economic Analysis of Performance
Evaluation of all the Thermal Power Plants: A Review," Energy Science & Engineering, vol.
7, no. 1, pp. 30-65, 2019.
[30] E. Bilgen, "Exergetic and Engineering Analyses of Gas Turbine Based Cogeneration
Systems," Energy, vol. 25, pp. 1215-1229, 2000.
[31] H. Holmberg, M. Tuomaala, T. Haikonen and P. Ahtila, "Allocation of Fuel Costs and CO2-
Emissions to Heat and Power in an Industrial CHP Plant: Case Integrated Pulp and Paper
Mill," Applied Energy, vol. 93, pp. 614-623, 2012.
[32] D. B. Ozkan, O. Kiziler and D. Bilge, "Exergy Analysis of a Cogeneration Plant,"
International Journal of Mechanical and Aerospace Engineering, vol. 6, no. 1, pp. 235-239,
2012.
[33] A. Beyene, "Combined Heat and Power as a Feature of Energypark," Journal of Energy
Engineering, vol. 131, no. 3, pp. 173-188, 2005.
[34] R. Murugan and P. Subbarao, "Efficiency Enhancement in a Rankine Cycle Power Plant:
Combined Cycle Approach," Proceedings of the Institution of Mechanical Engineers, Part
a: Journal of Power and Energy, vol. 222, no. 8, pp. 753-60, 2008.
[35] V. R. Ferreira, C. M. Augusto, J. B. Ribeiro, A. R. Gaspar and J. J. Costa, "Increasing the
Efficiency of High Temperature Furnaces through a Topping Cycle Cogeneration—A Case
Study," Energy Efficiency, vol. 8, pp. 85-95, 2015.

93
[36] M. Maheshwari and O. Singh, "Comparative Evaluation of Different Cycle Configurations
having Simple Gas Turbine, Steam Turbine and Ammonia Water Turbine," Energy, vol. 168,
pp. 1217-1236, 2019.
[37] K. Carpenter and J. K. Kissock, "Quantifying Savings From Improved Boiler Operation," in
Mechanical and Aerospace Engineering Faculty Publications, Paper 147, 2005.
[38] P. Nag and S. De, "Design and Operation of a Heat Recovery Steam Generator with
Minimum Irreversibility," Applied Thermal Engineering, vol. 17, no. 4, pp. 385-391, 1997.
[39] W. Somcharoenwattana, C. Menke, D. Kamolpus and D. Gvozdenac, "Study of Operational
Parameters Improvement of Natural-Gas Cogeneration," Energy and Buildings, vol. 43, no.
4, pp. 925-934, 2011.
[40] M. Valdes, A. Rovira and M. D. Duran, "Influence of the Heat Recovery Steam Generator
Design Parameters on the Thermoeconomic Performances of Combined Cycle Gas Turbine
Power Plants," International Journal of Energy Research, vol. 28, pp. 1243-1254, 2004.
[41] A. Franco and N. Giannini, "A General Method for the Optimum Design of Heat Recovery
Steam Generators," Energy, vol. 31, no. 15, pp. 3342-3361, 2006.
[42] F. R. P. Arrieta and E. E. S. Lora, "Influence of Ambient Temperature on Combined-Cycle
Power-Plant Performance," Applied Energy, vol. 80, pp. 261-272, 2005.
[43] G. Şen, M. Nil, H. Mamur, H. Doğan, M. Karamolla, M. Karaçor, F. Kuyucuoğlu, N.
Yörükeren, M. Ruhul and A. Bhuiyan, "The Effect of Ambient Temperature on Electric
Power Generation in Natural Gas Combined Cycle Power Plant—A Case Study," Energy
Reports, vol. 4, pp. 682-690, 2018.
[44] S.-D. Oh, H.-S. Oh and H.-Y. Kwak, "Economic Evaluation for Adoption of Cogeneration
System," Applied Energy, vol. 84, pp. 266-278, 2007.
[45] A. Hampson, R. Tidball, M. Fucci and R. Weston, "Combined Heat and Power (CHP)
Technical Potential in the United States," U.S. Department of Energy (U.S. DOE), Office of
Energy Efficiency and Renewable Energy (EERE), Advanced Manufacturing Office, March
2016.
[46] "U.S. DOE Combined Heat and Power Installation Database," U.S. DOE's Office of Energy
Efficiency and Renewable Energy (EERE), December, 2014.
94
[47] C. Arzbaecher, E. Fouche, K. Parmenter and Global Energy Partners, "Industrial Waste-Heat
Recovery: Benefits and Recent Advancements in Technology and Applications," ACEEE
Summer Study on Energy Efficiency in Industry, 2007.
[48] M. McBrien, A. C. Serrenho and J. M. Allwood, "Potential for Energy Savings by Heat
Recovery in an Integrated Steel Supply Chain," Applied Thermal Engineering, vol. 103, pp.
592-606, 2016.
[49] "Steam System Modeler Tool (SSMT)," U.S. DOE's office of Energy Efficiency and
Renewable Energy (EERE), 17 March 2015. [Online].
[50] J. A. Asmar, C. Lahoud and M. Brouche, "Decision-Making Strategy for Cogeneration
Power Systems Integration in the Lebanese Electricity Grid," Energy Procedia, vol. 119, pp.
801-805, 2017.
[51] W. T. Parry, J. C. Bellows, J. S. Gallagher, A. H. Harvey and R. D. Harwood, ASME
International Steam Tables for Industrial Use, New York: ASME Press Books, 2014.
[52] M. P. Boyce, Gas Turbine Engineering Handbook, Fourth edition, Elsevier, 2012.
[53] S. Ogriseck, "Integration of Kalina Cycle in a Combined Heat and Power Plant, A Case
Study," Applied Thermal Engineering, vol. 29, p. 2843–2848, 2009.
[54] L. Bai, "Life Cycle Assessment of Electricity Generation from Low Temperature Waste
Heat: The Influence of Working Fluid," Norwegian University of Science and Technology,
Trondheim, 2012.
[55] J. Burbank, "Case Study: 16 MW Combined Cycle Cogeneration Plant for a University
Campus," Massachusetts Energy Efficiency Partnership, 2013.