Embed Size (px)
Citation preview

Final Report
Evaluation of Pretreatment Technologies For Converting Washington Biomass to Bioethanol
Submitted by Washington State University
August, 2009
Xiaochen Yu and Shulin Chen Bioprocessing and Bioproduct Engineering Laboratory
Department of Biological Systems Engineering Washington State University Pullman, WA 99164-6120
This project was completed under interagency agreement C0800273 with the Department of Biological Systems Engineering, Washington
State University

Evaluation of Pretreatment Technologies For Converting Washington Biomass to Bioethanol
Ecology Publication Number 09-07-063 To ask about the availability of this document in a format for the visually impaired, call the Solid Waste and Financial Assistance Program at 360-407-6900. Persons with hearing loss can call 711 for Washington Relay Service. Persons with a speech disability can call 877-833-6341.

1
ACKNOWLEDGEMENTS The Washington State Department of Ecology provided funding for this project through the Beyond Waste Organics Waste to Resources (OWR) project. These funds were provided in the 2007-2009 Washington State budgets from the Waste Reduction Recycling and Litter Control Account. OWR project goals and objectives were developed by the Beyond Waste Organics team, and were approved by the Solid Waste and Financial Assistance Program. We also thank Forest Concepts, LLC of Auburn, WA for providing the hard wood and soft wood samples. This report is available on the Department of Ecology’s website at www.ecy.wa.gov/beyondwaste/organics. The reader may be interested in the other project reports supported by Organic Waste to Resources and Waste to Fuel Technology funding sponsored by Ecology. These are also available on the “organics” link. The Washington State University Extension Energy Program will make this report accessible in its broader library of bioenergy information at www.pacificbiomass.org.

2
EXECUTIVE SUMMARY Significance In this project we optimized parameters of pretreatment for four different lignocellulosic feedstocks that are prevalent in Washington State. Barley and wheat straw were two feedstocks studied as they account for 80% of the 1.9 million dry tons/year of crop residue biomass produced in the state. Since forestry residue accounts for 48% of the 16.4 million dry tons/year of total biomass available in Washington State, hard and soft wood were also tested as feedstocks. The results of this project can be used as reference in the development of a commercially available cellulosic ethanol industry in the state. Major contributions Ø Characterized four Washington State specific feedstocks
Compositions of wheat straw, barley straw, hard wood, and soft wood were characterized for their cellulose, hemicellulose, and lignin contents. Wheat and barley straw are approximately one third cellulose and one quarter hemicelluloses while hard and soft wood are approximately one third lignin and one quarter to one third cellulose. All four feedstocks had high cellulose or hemicellulose contents, which can be converted into sugars that can be fermented into ethanol using the technologies studied in this project. Preliminary data in this report suggest that roughly 230 million gallons per year of ethanol could be produced in Washington State from primarily lignocellulosic biomass sources. This is based on an average ethanol yield and using all woody residues including wheat and barley straw, forestry, and municipal waste woody residues. Ø Optimized parameters for three pretreatment technologies
Dilute acid pretreatment: For straw samples, temperatures around 175°C were optimal for dilute acid pretreatment. For woody samples, temperatures around 175°C were also optimal, though not as drastically as for straw. In the case of both groups of biomass, temperature was the most influential factor in ethanol yield. Woody samples gave the highest ethanol yields at 10% biomass solid loading, while wheat straw was optimal at 5% and barley straw at 10%. Wheat straw and soft wood gave the highest ethanol yields with 30 minutes, while barley straw and hard wood gave the highest yields with 45 minutes of treatment. Lime pretreatment: For both straw and woody samples, 120°C was optimal for the production of ethanol. In the case of both groups of biomass, temperature was the most influential factor in ethanol yield. Straw samples gave the highest yields at a Ca(OH)2 loading of 0.05 g/g dry biomass, and woody samples varied, at 0.05 g/g dry biomass for hard wood and 0.1 g/g dry biomass for soft wood. For reaction time, woody materials gave the highest yields with 1 hour, whereas straws varied slightly with wheat straw at 1 hour and barley straw at 1 – 2 hours. Soaking in aqueous ammonia: For both straw and woody samples 9% biomass solid loading were optimal in terms of ethanol yield. Both straw samples gave the highest ethanol yields with 15% ammonia (wt%), while woody samples differed slightly, with optimal for hard wood at 19% ammonia and soft wood at 15%. Optimal reaction time for wheat straw was 36 hours while barley straw required 39 hours. Both woody samples had the highest ethanol yields at 36 hours. Ø Comparison of three optimized pretreatment processes against feedstocks
In the table below, of the three pretreatment processes tested (dilute acid, lime and soaking in aqueous ammonia (SAA)), SAA pretreatment was found to yield the highest amounts of ethanol for wheat straw, barley straw and hard wood at 149.0, 147.1 and 75.4 mg/g dry biomass, respectively. Soft wood samples reached its highest ethanol yield (29.1 mg/g dry biomass) when subjected to lime pretreatment. However, based on the reaction time of each pretreatment

3
technology, the ethanol yield rates (mg/g dry biomass/hour) of samples pretreated by dilute acid were much higher than those by alkaline. Thus, in this project, it could be concluded that the dilute acid pretreatment was recommended because of its comparatively high efficiency. Certainly a more detailed cost estimate on energy consumption, equipment investment and maintenance, etc. should also be conducted as a comprehensive evaluation on each pretreatment technology.
Ethanol produced yield rate after SSF under optimal pretreatment conditions Feedstock Dilute Acid Pretreatment Lime Pretreatment SAA Pretreatment
Ethanol (mg/g
dry biomass)
Reaction time (min)
Ethanol yield rate (mg/g dry biomass/h)
Ethanol (mg/g
dry biomass)
Reaction time
(hour)
Ethanol yield rate (mg/g dry biomass/h)
Ethanol (mg/g
dry biomass)
Reaction time
(hour)
Ethanol yield rate (mg/g dry biomass/h)
Wheat Straw
147.8 30 295.6 131.5 1 131.5 149.0 36 4.1
Barley Straw
141.5 30 283.0 128.1 2 64.0 147.1 39 3.8
Hard Wood
42.4 45 56.5 66.0 1 66.0 75.4 36 2.1
Soft Wood
22.4 45 29.9 29.1 1 29.1 25.6 36 0.7
Biomass Mixture
90.2 30 180.4 85.6 1 85.6 100.6 36 2.8
Ø Mixed-biomass against three pretreatment technologies
A mixed biomass sample was tested against the three pretreatment technologies being optimized. The mixed biomass sample was composed of equal parts wheat straw, barley straw, hard wood, and soft wood. The ethanol yield of the mixed biomass sample was within 5% of the average of all four individual biomass samples for all three of the pretreatment technologies optimized in this project. This performance has especially important ramifications for Washington State as given the mass and location of available biomass it is likely that any future biomass to ethanol facility of appreciable size will require use of mixed feedstocks and therefore require the use of pretreatments and technologies capable of working with mixed feeds. Ø Limitations of the results
The tests performed in the project were conducted at laboratory scale. Therefore, the results can be used only as baseline data and as reference for comparing different pretreatment technologies. The data obtained are not recommended for use directly for biorefinery design without verification through pilot testing.

4
TABLE OF CONTENTS
ACKNOWLEDGEMENTS ............................................................................................................ 1
EXECUTIVE SUMMARY ............................................................................................................ 2
TABLE OF CONTENTS ................................................................................................................ 4
LIST OF FIGURES ........................................................................................................................ 6
LIST OF TABLES .......................................................................................................................... 7
BACKGROUND ............................................................................................................................ 8
METHODS ..................................................................................................................................... 9
Feedstock preparation ................................................................................................................. 9
Feedstock characterization .......................................................................................................... 9
Optimization of pretreatment conditions..................................................................................... 9
Hydrolysis performance ............................................................................................................ 10
Fermentation evaluation ............................................................................................................ 10
RESULTS ..................................................................................................................................... 10
Feedstock characterization ........................................................................................................ 10
Optimization of pretreatment conditions................................................................................... 11
Dilute acid pretreatment ............................................................................................................ 11
Lime pretreatment ..................................................................................................................... 13
SAA pretreatment ...................................................................................................................... 17
Fermentation evaluation ............................................................................................................ 17
IMPLICATIONS AND IMPACT ................................................................................................ 19
Environmental benefits ............................................................................................................. 20
Local economic benefits............................................................................................................ 20
APPENDIX A – SAA pretreatment experimental design and raw sugar data ............................. 22

5
APPENDIX B – Dilute acid pretreatment raw sugar data ............................................................ 25
APPENDIX C – Lime pretreatment raw sugar data ..................................................................... 28
APPENDIX D – Abbreviations .................................................................................................... 31
REFERENCES ............................................................................................................................. 32

6
LIST OF FIGURES
Figure 1. C5 sugar yield after enzymatic hydrolysis of dilute acid pretreated biomass. ....... Error! Bookmark not defined. Figure 2. C6 sugar yield after enzymatic hydrolysis of dilute acid pretreated biomass. ....... Error! Bookmark not defined. Figure 3. Sugars released after enzymatic hydrolysis of lime pretreated wheat straw. ......... Error! Bookmark not defined. Figure 4. Sugars released after enzymatic hydrolysis of lime pretreated barley straw. ......... Error! Bookmark not defined. Figure 5. Sugars released after enzymatic hydrolysis of lime pretreated hard wood. .................. 15 Figure 6. Sugars released after enzymatic hydrolysis of lime pretreated soft wood. ............ Error! Bookmark not defined. Figure 7. Sugars released after enzymatic hydrolysis of lime pretreated biomass mixture. ......... 16 Figure 8. Ethanol yield by feedstock. ............................................ Error! Bookmark not defined.

7
LIST OF TABLES
Table 1. Sources and quantities of raw materials in Washington State……………………….. ..8 Table 2 . Number of treatments for each feedstock……………………………………………. ..9 Table 3. Compositions of the four types of feedstocks……………………………………….. 11 Table 4. Optimal dilute acid pretreatment conditions and enzymatic hydrolysis results……... 12 Table 5. Optimal lime pretreatment conditions and enzymatic hydrolysis results……………. 13 Table 6. Optimal SAA pretreatment conditions and enzymatic hydrolysis results…………… 17 Table 7. C6 sugar and ethanol released after enzymatic hydrolysis and ethanol produced after SSF under optimal conditions ………………………………………….............18 Table 8. Ethanol produced yield rate after SSF under optimal pretreatment conditions………20 Table 9. Wheat straw SAA experimental design and sugar data……………………………... 22 Table 10. Barley straw SAA experimental design and sugar data……………………………... 23 Table 11. Hard wood SAA experimental design and sugar data…………………………….… 23 Table 12. Soft wood SAA experimental design and sugar data………………………………... 24 Table 13. Mixed biomass SAA experimental design and sugar data…………………………... 24 Table 14. Enzymatic hydrolysis results of dilute acid pretreated wheat straw………………… 25 Table 15. Enzymatic hydrolysis results of dilute acid pretreated barley straw………………… 25 Table 16. Enzymatic hydrolysis results of dilute acid pretreated hard wood………………….. 26 Table 17. Enzymatic hydrolysis results of dilute acid pretreated soft wood…………………... 26 Table 18. Enzymatic hydrolysis results of dilute acid pretreated biomass mixture……………. 27 Table 19. Enzymatic hydrolysis results of lime pretreated wheat straw……………………….. 28 Table 20. Enzymatic hydrolysis results of lime pretreated barley straw……………………….. 28 Table 21. Enzymatic hydrolysis results of lime pretreated hard wood……………………….... 28 Table 22. Enzymatic hydrolysis results of lime pretreated soft wood…………………………. 29 Table 23. Enzymatic hydrolysis results of lime pretreated biomass mixture…………………... 30

8
BACKGROUND Green waste, field residues, and forest residues make up 11.4 tons of the 16.4 tons of organic materials available per year in Washington State (Frear, Zhao et al. 2005). These organic residues contain cellulose and hemicellulose, whose basic units are sugars that can be fermented into ethanol and many other useful chemicals. Before they can be converted to ethanol, however, the protective cell walls of the plant residues needs to be broken down so that cellulose and hemicellulose can be accessed for hydrolysis and fermentation. The cell walls of plants consist mainly of polysaccharides, protein and lignin. These biopolymers are organized, together with small amounts of other components such as acetyl groups and phenolic substituents, in complex with three dimensional structures that are neither uniform nor completely described in different plants or plant fractions (Aman and Westerlund 1996) Thus pretreating the biomass in some manner is necessary to modify the plant cell wall structures to some extent to facilitate the access of enzymes to the cellulose. Technologies that have been used to pretreat lignocellulosic biomass include physical methods such as grinding, and chemical methods such as dilute acid pretreatment, lime (basic) pretreatment, and soaking in aqueous ammonia (SAA), which gives similar yields as ammonia recycle percolation while being a simpler process (Hamelinck et al. 2005; Wyman et al. 2005). Dilute acid at moderate temperatures effectively removes and recovers most of the hemicellulose as dissolved sugars. Although little lignin is dissolved, data suggest that lignin is disrupted, increasing cellulose susceptibility to enzymes. Pretreatment with lime increases pH and provides a low-cost alternative for lignin removal to increase the cellulose digestibility (Chang, Nagwan et al. 1998). Another process using alkaline chemicals to remove lignin termed soaking in aqueous ammonia (SAA) treats biomass with aqueous ammonia in a batch reactor at moderate temperatures (25–60°C) under atmospheric pressure. SAA retains most of the hemicellulose in the solid, eliminating the need to process hemicellulose and cellulose sugars separately. To ascertain the capabilities and potential of each of the above mentioned pretreatment technologies for application to Washington State specific feedstocks, a comparative study was completed for each of the three pretreatment against four separate feedstocks (wheat straw, barley straw, soft wood and hard wood), each in collected and studied after milling. Specific objectives included: (1) feedstock characterization, (2) optimization of pretreatment conditions, (3) hydrolysis performance, and (4) fermentation evaluation. Table 1. Sources and quantities of raw materials in Washington State
Feedstock Biomass Production (tons/year)
Wheat Straw 1,614,234
Barley Straw 318,522
Field Residue (without wheat & barley straw) 496,594
Forest Residue 8,103,686
Wood Residues-MSW 834,057
(Frear, Zhao et al. 2005)

9
METHODS Feedstock preparation Two types of green wastes (hard wood and soft wood) and two types of straws (wheat straw, Triticum sativum, and barley straw, Hordeum vulgare) were chosen as the feedstocks for the study. The green wastes were obtained from Forest Concepts, LLC, Auburn, WA, and the straws were obtained from the University of Idaho, Moscow, ID. After collection, the materials were washed, air-dried, and milled to pass through a one quarter inch screen. The processed materials were then sealed in plastic bags and stored in cool storage for further use. A fifth set of biomass samples was prepared for analysis. This biomass sample was a mixture of all four types of feedstock. The mixed biomass feedstock was prepared by adding equal amounts by weight of hard wood, soft wood, wheat straw, and barely straw. As the mixed biomass was being weighed out for various experiments, the bag was mixed before each weighing and visually inspected to ensure there was an even distribution of feedstocks. The experimental design required numerous treatments for each feedstock as described in Table 2. Table 2. Number of treatments for each feedstock
Feedstock Dilute Acid Pretreatment Lime Pretreatment SAA Pretreatment Wheat straw 12 12 15 Barley straw 12 12 15 Hard wood 12 12 15 Soft wood 12 12 15
Biomass mixture 12 12 15 Feedstock characterization Initial compositions of hard wood, soft wood, wheat straw, and barley straw were characterized for cellulose, hemicellulose, and lignin contents using a FibertecTM 2010 by measuring neutral detergent fiber (NDF), acid detergent lignin (ADL), and acid detergent fiber (ADF). Optimization of pretreatment conditions
· Dilute acid pretreatment. Tests were conducted in a 1 liter Parr reactor (Parr Instruments, Moline, IL). Prior to treatment in the Parr reactor, the samples were each mixed with a 1% (w/w) dilute acid solution at room temperature. The solid loading, temperature, and reaction time of the pre-mixed slurry in the reactor were controlled. The solid loadings tested were 5% (w/v) and 10% (w/v). The temperature range tested was 175oC – 225oC at 25oC increments. The reaction times tested were 30 and 45 minutes.
· Lime pretreatment. During this process, samples were pretreated with lime (calcium hydroxide) with a 20% (w/v) water loading. Reaction temperatures tested were 100oC and 120oC. The lime loadings tested were 0.05 g Ca(OH)2/g dry biomass and 0.1 g Ca(OH)2/g dry biomass.
· Soaking in aqueous ammonia (SAA) pretreatment. In this process, samples were soaked with an aqueous ammonia solution at 60oC. The solid-to-liquid ratio range tested was 9% – 16% (w/v). The reaction time range tested was 31 – 65 hours. The aqueous ammonia concentration range tested was 13 – 27wt%. Due to the large number of treatments for each feedstock, this experiment designed using the surface respond method calculated by the software Design-Expert (Stat-Ease Inc. Minneapolis, MN). This reduced the number

10
of treatments from 45 to 15 per feedstock. See Appendix A for the list of experiments generated by Design-Expert.
· Pretreatment controls using water. After the pretreatment methods described above were optimized, samples of each feedstock were pretreated with water under the optimized conditions and used as controls.
Hydrolysis performance As mentioned before, the purpose of pretreatment is to increase the accessibility of enzymes to cellulose in lignocellulosic materials, which is quantified by the yield of sugars released during enzymatic hydrolysis. Thus in order to determine the best conditions for each of the pretreatment methods being tested, pretreated samples were subjected to enzymatic hydrolysis. Celluclast 1.5L from Trichoderma. reesei and Novozyme 188 purchased from Sigma Company were enzymes used, with cellulase activity measured based on the filter paper unit (FPU) as described in National Renewable Energy Laboratory procedure (NREL LAP-006; Adney and Baker 1996). Enzymatic hydrolysis experiments of pretreated samples were carried out using a cellulase loading of 10 FPU/g dry biomass (1:1 mixture of Celluclast 1.5 L and Novozyme 188) and at 50°C and 150 rpm for 48 hours, as described in the National Renewable Energy Laboratory procedure (NREL LAP-009; Brown and Torget 1996). The glucose, arabinose, and xylose (and galactose) concentrations in the enzymatic hydrolysate were analyzed by a Dionex ICS-3000 ion chromatography system (Dionex Corporation) equipped with a CarboPac TM PA 20 (4×50mm) analytical column, CarboPac TM PA 20 (3×30mm) guard column. Samples were 0.2μm filtered before injection and eluted isocratically with 0.01 M NaOH at a flow rate of 0.500 ml/min and analytes were detected and quantified against standard curves by electrochemical detection in a pulsed amperiometric detector. Fermentation evaluation The purpose of Simultaneous Saccharification and Fermentation (SSF) is to evaluate the fermentability of the hydrolyzates from the optimal pretreatment conditions for each pretreatment technology. SSF experiments were carried out with Saccharomyces cerevisiae D5A (ATCC 200062) using the same enzyme loadings as the enzymatic hydrolysis as described in the National Renewable Energy Laboratory procedure (NREL LAP-008; Dowe and McMillan 2001). Ethanol concentrations in the broth were analyzed via static headspace chromatographic (HS-GC) analysis. A GC (Shimadzu Corporation, Japan) equipped with a flame ionization detector and a HP-INNOWax Polyethylene glycol (PEG) capillary column (Agilent Technologies, Santa Clara, CA) was used in this analysis. An AOC-5000 auto injector (Shimadzu GC-2014, Japan) was used for vial incubation and automatic sampling, and 500 µL samples were injected. The PEG capillary column was first heated from 70°C to 180ºC and then held at 180ºC for 1 min. The temperatures of the injector and detector were 180°C and 200ºC, respectively. Helium was used as the carrier gas at the column flow rate of 1.08 ml/min RESULTS Feedstock characterization After preparing the hard wood, soft wood, wheat straw, and barley straw, various properties of these feedstocks were investigated. Cellulose, hemicellulose, and lignin contents were measured because of their abilities to be broken down into compounds that can be used to produce ethanol. The contents of cellulose, hemicellulose, and lignin for each of the feedstocks are shown in

11
Table 3. The results obtained were compared with data reported in literature (Zhu, Wu et al. 2005), with similarities and differences found in all four of the feedstocks being investigated, leading to the conclusion that the composition of lignocellulosic materials in feedstocks may vary depending on species, location, and environmental conditions. Table 3. Compositions of the four types of feedstocks
Feedstock Cellulose (%, dry basis)
Hemicellulose (%, dry basis)
Lignin (%, dry basis)
Wheat straw 36.95 ± 3.33 24.46 ± 2.04 6.61 ± 1.06
Barley straw 37.37 ± 3.68 26.00 ± 2.05 6.95 ± 1.47
Hard wood 34.95±0.69 5.82±1.35 35.29±1.17
Soft wood 23.49±2.07 2.88±0.68 37.12±2.36
The wheat straw was composed of a significantly different level of lignin than reported in literature, though the levels of cellulose and hemicellulose were similar while in barley straw, the cellulose levels were different while hemicellulose and lignin were similar to reported values. The compositions of the other two types of green wastes (hard wood and soft wood) showed that cellulose and hemicellulose levels were lower and lignin levels were higher than those reported in literature. Comparisons between hard wood and soft wood showed that hard wood had more cellulose and hemicellulose and less lignin than soft wood, which was consistent with the information found in literature. These phenomena may also be due to the limitations of the Acid Detergent Lignin (ADL) determination method on different types of feedstocks. There is no single method reported to accurately determine the original lignin content in biomass samples. Due to certain chemical reactions between lignin and reactants during various tests, analysis results are affected. Lignin amounts will be biased due to the solubility of acid soluble lignin or proteins bound to lignin. Results may also be affected by contaminants, particularly cutin, present in the acid insoluble residues or other condensation products from cell contents such as polyphenolic compounds. Thus, a more accurate and standardized method of lignin determination is needed. Optimization of pretreatment conditions Dilute acid pretreatment The biomass samples were subjected to dilute acid pretreatment, as described in the Methods section. The optimal dilute acid pretreatment parameters and enzymatic hydrolysis results for all of the feedstocks are shown in Table 4. As shown in Figure 1, there were few C5 sugars released after the enzymatic hydrolysis of biomass pretreated by dilute acid. This may be because C5 sugars that originated from hemicellulose were easily degraded at certain temperatures. As the reaction temperature increased, both the amount of C5 and C6 sugars released after the enzymatic hydrolysis decreased dramatically (see Figures 1 and 2). This was especially true for the reaction temperature of 225ºC, where there was a very limited amount of sugars detected.

12
Table 4. Optimal dilute acid pretreatment conditions and enzymatic hydrolysis results
Feedstock Pretreatment Conditions C6 Sugar Yield (mg/g dry biomass) Solid
Loading (w/v)
Temperature (°C)
Reaction Time (min)
Wheat Straw 5% 175 30 179.2 Barley Straw 10% 175 45 175.7 Hard Wood 10% 175 45 53.8 Soft Wood 10% 175 30 29.2
Mixture 5% 175 30 80.5
Thus, it was demonstrated that the reaction temperature increase leads to an increased number of sugars degraded into other chemicals, and these chemicals may be inhibitors during the following simultaneous saccharification fermentation (SSF). For raw data associated with these figures, see Appendix B. Additionally, at the 30 minute reaction time, C6 sugar yields of enzymatically hydrolyzed barley straw were higher with 5% (w/v) solid loading than that with 10% (w/v) solid loading, as shown in the Figure 2. The results were reversed under the reaction time of 45 minutes. This demonstrates that the effects of reaction time had an interaction with those of solid loadings in dilute acid pretreatment of barley straw. Figure 1. C5 sugar yield after enzymatic hydrolysis of dilute acid pretreated biomass
Note: as an example, 5-175-30 refers to conditions at 5% solid loading, 175°C, and a 30 minute reaction time.

13
Figure 2. C6 sugar yield after enzymatic hydrolysis of dilute acid pretreated biomass
Note: as an example, 5-175-30 refers to conditions at 5% solid loading, 175°C, and a 30 minute reaction time.
Lime pretreatment The biomass samples were subjected to lime pretreatment, as described in the Methods section. The optimal lime pretreatment parameters and enzymatic hydrolysis results for all of the feedstocks are shown in the Table 5. Table 5 Optimal lime pretreatment conditions and enzymatic hydrolysis results
Feedstock Pretreatment Conditions C6 Sugars Yield (mg/g dry biomass) Temperature
(°C) Reaction
Time (hours)
Ca(OH)2 Loading (g/g dry biomass)
wheat straw 120 1 0.05 176.8 barley straw 120 2 0.05 242.9 hard wood 120 1 0.05 93.6 soft wood 120 1 0.1 73.9 mixture 120 1 0.05 152.1
Results show that when compared to wheat straw and soft wood, barley straw and hard wood could be hydrolyzed to generate more sugars in the enzymatic hydrolysis after lime pretreatment. In general, the amounts of both C5 and C6 sugars released by each kind of lime pretreated feedstock at 120°C were higher than at 100°C. This indicates that temperature had a great impact on lime pretreatment effectiveness. In Figures 3 through 7, it is shown that the C6 sugar yield at 120°C was lower at a reaction time of 3 hours than at 1 or 2 hours. This suggests a number of possibilities. One is that a majority of the cellulose has been converted to C6 sugars after two

14
hours, while another possibility is that certain byproducts of the conversion are inhibiting the formation of additional C6 sugars. At reaction times longer than 1 hour and a temperature of 120°C in lime pretreated wheat straw and hard wood, a larger amount of calcium hydroxide in the reaction had a positive influence on the amount of sugars released in the enzymatic hydrolysis (Figures 3 and 5). This can be seen in the sugar samples where 0.1 g Ca(OH)2/g dry biomass yielded more C6 sugar than 0.05 g Ca(OH)2/g dry biomass. However, for barley straw, the results were reversed (Figure 4). This indicates that the effects of calcium hydroxide depended on both reaction time and characteristics of the feedstock. For raw data associated with Figures 3 through 7, see Appendix C. Figure3. Sugars released after enzymatic hydrolysis of lime pretreated wheat straw
Note: as an example, 100-1-0.1 refers to conditions at 100°C, 1 hr reaction time, and a loading of 0.1 g Ca(OH)2/g
dry biomass.

15
Figure 4. Sugars released after enzymatic hydrolysis of lime pretreated barley straw
Note: as an example, 100-1-0.1 refers to conditions at 100°C, 1 hr reaction time, and a loading of 0.1 g Ca(OH)2/g
dry biomass. Figure 5. Sugars released after enzymatic hydrolysis of lime pretreated hard wood
Note: as an example, 100-1-0.1 refers to conditions at 100°C, 1 hr reaction time, and a loading of 0.1 g Ca(OH)2/g
dry biomass.

16
Figure 6. Sugars released after enzymatic hydrolysis of lime pretreated soft wood
Note: as an example, 100-1-0.1 refers to conditions at 100°C, 1 hr reaction time, and a loading of 0.1 g Ca(OH)2/g
dry biomass.
Figure 7. Sugars released after enzymatic hydrolysis of lime pretreated biomass mixture
Note: as an example, 100-1-0.1 refers to conditions at 100°C, 1 hr reaction time, and a loading of 0.1 g Ca(OH)2/g
dry biomass.

17
SAA pretreatment Experiment design tables (see Appendix A) were generated by the software Design-Expert (Stat-Ease Inc., Minneapolis, MN). The software-estimated optimal pretreatment conditions and responses are listed in Table 6. Following the experimental design, the estimated optimal pretreatment conditions were validated, and the actual values of C6 sugars obtained were very close to the values estimated by the software. For raw data associated with SAA pretreatment, see Appendix A. Table 6. Optimal SAA pretreatment conditions and enzymatic hydrolysis results
Feedstock Pretreatment Conditions C6 Sugars Yield (mg/g dry biomass)
Solid Loading
(w/v)
Reaction Time
(hours)
Ammonia Concentration (wt%)
Estimated Values
Actual Values
wheat straw 9% 36 15 178.7 179.1 barley straw 9% 39 15 318.7 330.0 hard wood 9% 36 19 123.4 119.3 soft wood 9% 36 15 36.2 36.3 mixture 9% 36 15 168.6 157.6
Project results were reviewed against existing literature data for comparison. In summary, results were similar to reported values for similar feedstocks and higher or lower in correlation with harsher or less harsh conditions (Sun and Cheng 2004) (Chang, Nagwani et al. 1998); (KIM and LEE 2007). Based on the enzymatic digestibility of each kind of feedstock pretreated by different pretreatment methods, it was indicated that the dilute acid pretreatment contributed least to the C6 sugars yield of barley straw, hard wood and softwood, and the alkaline pretreatments (SAA and lime) were more beneficial to the C6 sugars release during enzymatic hydrolysis. Straw samples could generate more sugars than woody biomass, especially soft wood, under identical pretreatment conditions. This is likely due to the differences in the physical morphology and chemical compositions between straws and woody biomass. In addition, the sugar yields of the pretreated biomass mixture in each of the different scenarios were close to the averages of those of all of the feedstocks in each scenario, which was the expected result. Fermentation evaluation Based on the results of enzymatic hydrolysis, the optimal conditions of each pretreatment technology for each kind of feedstock were determined and are shown in Tables 4-6. In the fermentation step, samples pretreated under optimal conditions were subjected to simultaneous saccharification and fermentation (SSF) to determine ethanol yield resulting from the optimized pretreatments. The resulting ethanol yields are shown in Table 7. C6 sugar yields from the hydrolysis step are also shown, and can be a rough indicator of how much ethanol may be produced, though the ratios between C6 sugars and ethanol vary based on sample type and pretreatment technology used.

18
Table 7. C6 sugar and ethanol released after enzymatic hydrolysis and ethanol produced after SSF under optimal pretreatment conditions
Feedstock Dilute Acid Pretreatment
Lime Pretreatment SAA Pretreatment
C6 Sugars Ethanol C6 Sugars Ethanol C6 Sugars Ethanol Wheat Straw 179.2
(94.2) 147.8 (14.6)
176.8 (123.6)
131.5 (0.8)
179.1 (57.8)
149.0 (0.5)
Barley Straw 175.7 (135.1)
141.5 (20.0)
242.9 (171.7)
128.1 (1.2)
330.0 (70.6)
147.1 (1.7)
Hard Wood 53.8 (56.9)
42.4 (4.0)
93.6 (90.8)
66.0 (0.7)
119.3 (67.7)
75.4 (0.1)
Soft Wood 29.2 (34.9)
22.4 (0.9)
73.9 (75.5)
29.1 (0.1)
36.3 (24.8)
25.6 (0.0)
Biomass Mixture
80.5 (105.1)
90.2 (10.1)
152.1 (137.2)
85.6 (0.4)
157.6 (61.5)
100.6 (0.2)
C6 sugar values and ethanol values are all given in mg/g dry biomass. The values in parentheses are control values for C6 sugars yield and ethanol yield, as obtained using the water pretreatment corresponding to each pretreatment
condition for each feedstock, as described in the Methods section. The values in bold in Table 7 indicate the highest ethanol production from each of the four individual feedstock types. These values were converted to gallons of ethanol per ton of dry biomass, and are shown in Figure 8. According to our results, wheat straw could yield 45.3 gal/ton, barley straw 44.7 gal/ton, hard wood 22.9 gal/ton, and soft wood 8.8 gal/ton dry biomass. Figure 8. Ethanol yield by feedstock
The values in this table are based off of the optimal pretreatment technology for each feedstock type. Wheat straw, barley straw, and hard wood values were determined via SAA pretreatment while the soft wood value was determined via lime pretreatment. The results of ethanol yields obtained for straw feedstocks under dilute acid pretreatment are consistent with those reported in
19
literature. While rye straw has been tested, and found to yield 135 – 146 mg/g dry biomass under similar conditions (Chang, Kaar et al. 2001), the specific straw and woody feedstocks evaluated in this study have not been reported. The values obtained for wheat and barley straws fall within this range. The ethanol yields obtained for straw feedstocks under lime pretreatment are not as high as values reported in literature for switch grass. Switch grass samples under similar conditions yielded 178 mg/g dry biomass (Chang, Kaar et al. 2001), where wheat straw and barley straw yielded 131.5 mg/g dry biomass and 128.1 mg/g dry biomass, respectively. This is to be expected, and may be due to the differences in feedstock composition, as well as times of reaction. For hard wood samples, 196 mg/g dry biomass has been reported (Chang, Kaar et al. 2001), as opposed to our 66.0 mg/g dry biomass, though the reaction conditions were harsher (150°C, 6 hour reaction time, and 14 bar pure oxygen) in the previous report. The ethanol yields obtained under SAA pretreatment in literature are predominantly for corn stover. SAA is a derivative of previously reported technologies using ammonia, which include steam pressure and high temperatures. In this project, we obtained 147 – 149 mg/g dry biomass in straw samples, which compares to 231 mg/g dry biomass in corn stover ((Kim, Taylor et al. 2008). The ethanol yield results of soft wood obtained in the project were low for all three pretreatment technologies. These mainly resulted from the chemical compositions of the specific soft wood samples, of which cellulose and lignin accounted for 23.49% and 37.12%, respectively. While high lignin content would lead to high biomass recalcitrance to heat, pressure and chemicals during the pretreatment process as well as the enzymes during the enzymatic hydrolysis step. Optimal parameters developed in this study were slightly different than those reported in literature, predominantly in reaction time, and the large difference in values is likely due to the different biomass used and a different organism being used in the SSF. In this project, we used Saccharomyces cerevisiae D5A, whereas Kim et al. (2007) used Escherichia coli. According to this study’s results, SAA pretreatment is recommended for wheat straw, barley straw, and hard wood, while lime pretreatment is recommended for soft wood. These recommended methods yielded the highest amounts of ethanol for the feedstocks (see values in bold in Table 6). Although the ethanol yields of dilute acid pretreated samples are lower, for the most part, than those of lime and SAA pretreated samples, the reaction time of dilute acid pretreatment was shorter than those of lime or SAA pretreatment. Thus, an economic assessment of energy consumption and environmental impact, along with the ethanol yield, would be helpful as additional parameters for deciding optimal pretreatment methods. IMPLICATIONS AND IMPACT The results of this project may benefit the development of biofuel industry in the state in several ways. First, the results demonstrated the effectiveness of the three common technologies for treating local feedstocks. According to ethanol yield rates calculated in Table 8, it can be concluded that the dilute acid pretreatment was more efficient than alkaline pretreatment because dilute acid pretreatment requires shorter time, although using alkaline pretreatment can reach a little higher ethanol yield. However, in the alkaline pretreatment, more C5 sugars are retained, which is an additional source of sugars for ethanol production. In order to consider increasing ethanol yield, an enzyme cocktail may also be utilized in fermentation that includes more than simply cellulase and cellobiase. Additionally, a multi-stage pretreatment technology combining acid and alkaline pretreatment could be studied and applied in the future to meet the needs of utilizing diverse feedstocks

20
Table 8. Ethanol produced yield rate after SSF under optimal pretreatment conditions Feedstock Dilute Acid Pretreatment Lime Pretreatment SAA Pretreatment
Ethanol (mg/g
dry biomass)
Reaction time (min)
Ethanol yield rate (mg/g dry biomass/h)
Ethanol (mg/g
dry biomass)
Reaction time
(hour)
Ethanol yield rate (mg/g dry biomass/h)
Ethanol (mg/g
dry biomass)
Reaction time
(hour)
Ethanol yield rate (mg/g dry biomass/h)
Wheat Straw
147.8 30 295.6 131.5 1 131.5 149.0 36 4.1
Barley Straw
141.5 30 283.0 128.1 2 64.0 147.1 39 3.8
Hard Wood
42.4 45 56.5 66.0 1 66.0 75.4 36 2.1
Soft Wood
22.4 45 29.9 29.1 1 29.1 25.6 36 0.7
Biomass Mixture
90.2 30 180.4 85.6 1 85.6 100.6 36 2.8
Second, the results provide more concrete data for estimating biofuel potentials of the state. Based on the results in this project, and by averaging the ethanol yield potential for hard wood and soft wood, roughly 230 million gallons of ethanol could potentially be produced per year in Washington State if the tested pretreatment methods are used. This estimate encompasses amounts of wheat straw, barley straw, forestry, and municipal waste woody residues available per year in the state. Additional fuel production is possible with the additional field residues from crops listed in the Washington Biomass Inventory and Bioenergy Assessment. It needs to be pointed out, however, producing cellulosic ethanol involves many processes and factors, the results obtained from this project can be used as preliminary laboratory data. Third, the results underscore the importance of more efficient yet feedstock specific pretreatment methods. There is a great need to develop and demonstrate technologies that can enhance the ultimate yield from unit weight of biomass. Last, the results of the project, when used in connection with the techno-economic models for conversion technologies and cost-curve of feedstock collection and transportation, can provide industries and agencies with more specific cost estimation for cellulosic bioethanol production in the state.
Environmental benefits In the endeavor of producing a renewable fuel from sources already prevalent in Washington State, this project shows great potential benefits to the environment. In accordance with the amount of ethanol that could be produced, the need for fossil fuels and associated CO2 emission would be reduced. Local economic benefits As the purpose of this project is to contribute to the development of sustainable biofuels within the state of Washington, it will greatly add to the economic development in the state. With the increase in technology to produce biofuels from this project and others, the market will be developed to produce such technologies on a commercial scale. This process has already begun with investment into research and development, and will continue in the creation of more jobs in the form of marketing, education, and design, building, and operation of the plants. Rural communities where these plants are to be built will greatly benefit from the additional income in

21
their local vicinities. On the whole, this process will result in dollars staying inside Washington State, as well as energy security based on local resources.

22
APPENDIX A – SAA pretreatment experimental design and raw sugar data Tables 8 through 12 show the experimental design for the optimization of the SAA pretreatment conditions. The numbers in the columns for Factor 1, Factor 2, and Factor 3 were generated by Design-Expert software. According to the variations in the three factors, the numbers in the response column were obtained in the experiments. Table 9. Wheat straw SAA experimental design and sugar data Std Run Factor 1 Factor 2 Factor 3 Response 1
A:solid-to-liquid ratio
(ml/g)
B:reaction time
(hours)
C:ammonia concentration
(wt %)
sugars released (mg/g dry biomass)
1 14 15 60 15 221.224 2 1 15 36 25 223.114 3 3 9 60 25 180.795 4 8 9 36 15 179.079 5 7 7.76 48 20 159.454 6 12 16.24 48 20 155.656 7 9 12 31.03 20 189.202 8 4 12 64.97 20 254.710 9 11 12 48 12.93 190.076 10 10 12 48 27.07 209.863 11 2 12 48 20 189.798 12 13 12 48 20 160.837 13 5 12 48 20 180.370 14 6 12 48 20 182.294 15 15 12 48 20 183.088

23
Table 10. Barley straw SAA experimental design and sugar data Std Run Factor 1 Factor 2 Factor 3 Response 1
A:solid-to-liquid ratio
(ml/g)
B:reaction time
(hours)
C:ammonia concentration
(wt %)
sugars released (mg/g dry biomass)
1 14 15 60 15 153.137 2 1 15 36 25 227.432 3 3 9 60 25 181.039 4 8 9 36 15 329.996 5 7 7.76 48 20 202.123 6 12 16.24 48 20 180.979 7 9 12 31.03 20 193.091 8 4 12 64.97 20 213.324 9 11 12 48 12.93 181.148 10 10 12 48 27.07 349.576 11 2 12 48 20 279.848 12 13 12 48 20 271.163 13 5 12 48 20 272.791 14 6 12 48 20 273.903 15 15 12 48 20 278.492
Table 11. Hard wood SAA experimental design and sugar data Std Run Factor 1 Factor 2 Factor 3 Response 1
A:solid-to-liquid ratio
(ml/g)
B:reaction time
(hours)
C:ammonia concentration
(wt %)
sugars released (mg/g dry biomass)
1 14 15 60 15 115.504 2 1 15 36 25 111.932 3 3 9 60 25 131.959 4 8 9 36 15 106.569 5 7 7.76 48 20 117.059 6 12 16.24 48 20 108.178 7 9 12 31.03 20 115.586 8 4 12 64.97 20 106.274 9 11 12 48 12.93 93.585 10 10 12 48 27.07 132.302 11 2 12 48 20 112.048 12 13 12 48 20 112.339 13 5 12 48 20 114.4 14 6 12 48 20 116.803

24
15 15 12 48 20 117.05
Table 12. Soft wood SAA experimental design and sugar data
Std Run Factor 1 Factor 2 Factor 3 Response 1 A:solid-to-liquid
ratio (ml/g)
B:reaction time
(hours)
C:ammonia concentration
(wt %)
sugars released (mg/g dry biomass)
1 14 15 60 15 32.599 2 1 15 36 25 30.003 3 3 9 60 25 34.79 4 8 9 36 15 36.344 5 7 7.76 48 20 32.122 6 12 16.24 48 20 34.909 7 9 12 31.03 20 30.79 8 4 12 64.97 20 30.185 9 11 12 48 12.93 30.216 10 10 12 48 27.07 36.734 11 2 12 48 20 31.818 12 13 12 48 20 31.276 13 5 12 48 20 31.37 14 6 12 48 20 30.727 15 15 12 48 20 30.604
Table 13. Mixed biomass SAA experimental design and sugar data Std Run Factor 1 Factor 2 Factor 3 Response 1
A:solid-to-liquid ratio
(ml/g)
B:reaction time
(hours)
C:ammonia concentration
(wt %)
sugars released (mg/g dry biomass)
1 14 15 60 15 165.993 2 1 15 36 25 93.381 3 3 9 60 25 110.774 4 8 9 36 15 157.638 5 7 7.76 48 20 151.106 6 12 16.24 48 20 129.348 7 9 12 31.03 20 92.867 8 4 12 64.97 20 213.604 9 11 12 48 12.93 102.944 10 10 12 48 27.07 121.96 11 2 12 48 20 81.096
25
12 13 12 48 20 83.803 13 5 12 48 20 82.007 14 6 12 48 20 82.751 15 15 12 48 20 83.998
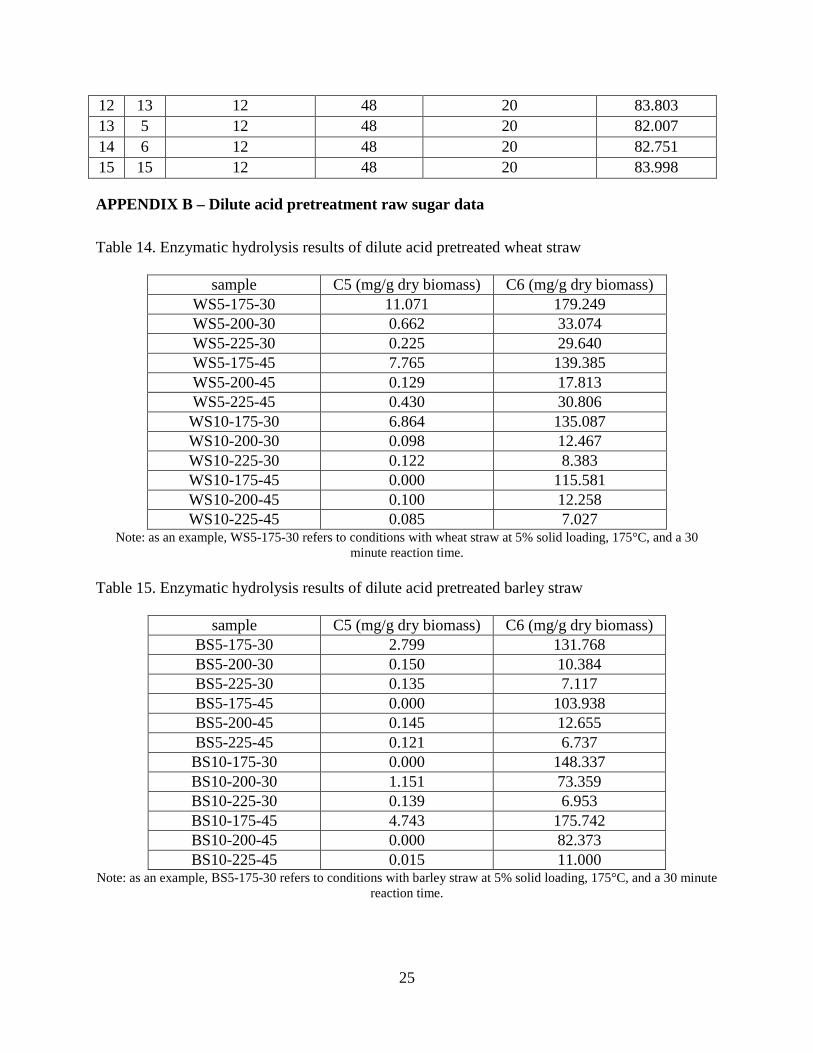
APPENDIX B – Dilute acid pretreatment raw sugar data
Table 14. Enzymatic hydrolysis results of dilute acid pretreated wheat straw
sample C5 (mg/g dry biomass) C6 (mg/g dry biomass) WS5-175-30 11.071 179.249 WS5-200-30 0.662 33.074 WS5-225-30 0.225 29.640 WS5-175-45 7.765 139.385 WS5-200-45 0.129 17.813 WS5-225-45 0.430 30.806 WS10-175-30 6.864 135.087 WS10-200-30 0.098 12.467 WS10-225-30 0.122 8.383 WS10-175-45 0.000 115.581 WS10-200-45 0.100 12.258 WS10-225-45 0.085 7.027
Note: as an example, WS5-175-30 refers to conditions with wheat straw at 5% solid loading, 175°C, and a 30 minute reaction time.
Table 15. Enzymatic hydrolysis results of dilute acid pretreated barley straw
sample C5 (mg/g dry biomass) C6 (mg/g dry biomass) BS5-175-30 2.799 131.768 BS5-200-30 0.150 10.384 BS5-225-30 0.135 7.117 BS5-175-45 0.000 103.938 BS5-200-45 0.145 12.655 BS5-225-45 0.121 6.737 BS10-175-30 0.000 148.337 BS10-200-30 1.151 73.359 BS10-225-30 0.139 6.953 BS10-175-45 4.743 175.742 BS10-200-45 0.000 82.373 BS10-225-45 0.015 11.000
Note: as an example, BS5-175-30 refers to conditions with barley straw at 5% solid loading, 175°C, and a 30 minute reaction time.

26
Table 16. Enzymatic hydrolysis results of dilute acid pretreated hard wood
sample C5 (mg/g dry biomass) C6 (mg/g dry biomass) HW5-175-30 0.409 35.329 HW5-200-30 0.150 11.223 HW5-225-30 0.190 11.063 HW5-175-45 0.351 33.917 HW5-200-45 0.156 11.386 HW5-225-45 0.163 10.202 HW10-175-30 0.728 43.616 HW10-200-30 0.237 19.291 HW10-225-30 0.195 11.896 HW10-175-45 0.645 53.852 HW10-200-45 0.196 15.180 HW10-225-45 0.201 11.690
Note: as an example, HW5-175-30 refers to conditions with hard wood at 5% solid loading, 175°C, and a 30 minute reaction time.
Table 17. Enzymatic hydrolysis results of dilute acid pretreated soft wood
sample C5 (mg/g dry biomass) C6 (mg/g dry biomass) SW5-175-30 0.192 22.818 SW5-200-30 0.133 10.270 SW5-225-30 0.162 7.805 SW5-175-45 0.304 29.250 SW5-200-45 0.154 11.529 SW5-225-45 0.149 7.440 SW10-175-30 0.426 29.235 SW10-200-30 0.203 16.788 SW10-225-30 0.181 8.387 SW10-175-45 0.231 20.742 SW10-200-45 0.146 11.162 SW10-225-45 0.157 7.695
Note: as an example, SW5-175-30 refers to conditions with soft wood at 5% solid loading, 175°C, and a 30 minute reaction time.
27
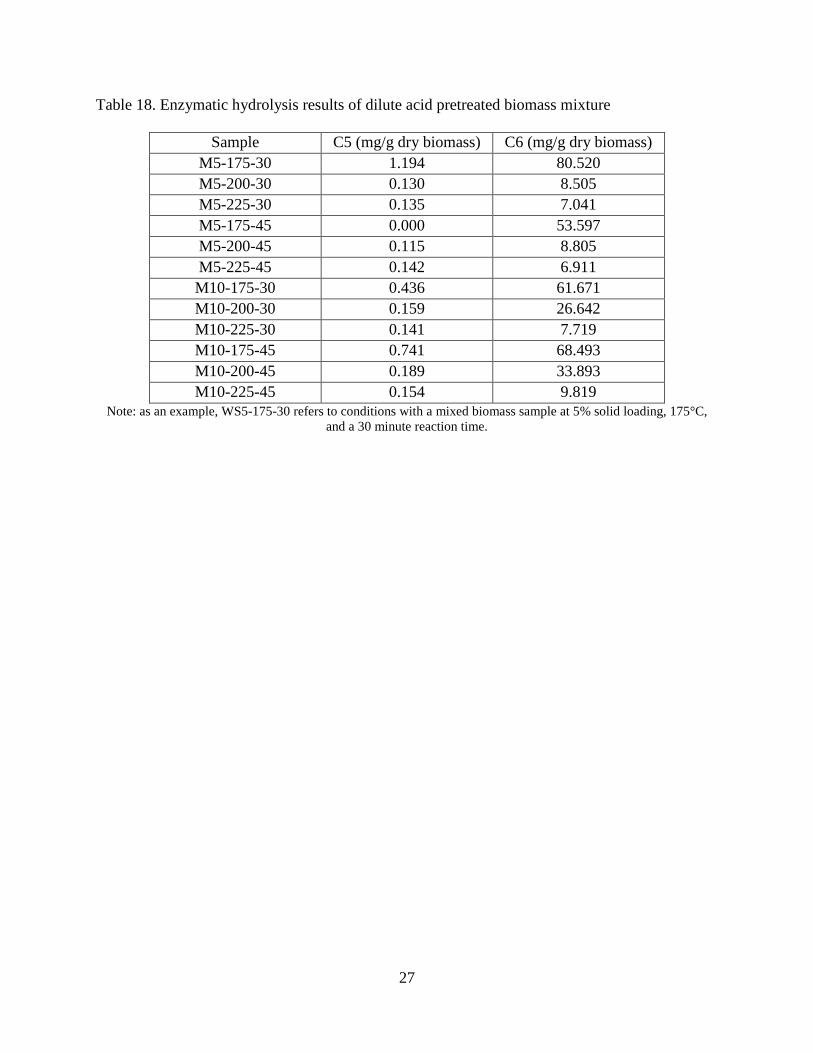
Table 18. Enzymatic hydrolysis results of dilute acid pretreated biomass mixture
Sample C5 (mg/g dry biomass) C6 (mg/g dry biomass) M5-175-30 1.194 80.520 M5-200-30 0.130 8.505 M5-225-30 0.135 7.041 M5-175-45 0.000 53.597 M5-200-45 0.115 8.805 M5-225-45 0.142 6.911 M10-175-30 0.436 61.671 M10-200-30 0.159 26.642 M10-225-30 0.141 7.719 M10-175-45 0.741 68.493 M10-200-45 0.189 33.893 M10-225-45 0.154 9.819
Note: as an example, WS5-175-30 refers to conditions with a mixed biomass sample at 5% solid loading, 175°C, and a 30 minute reaction time.
28
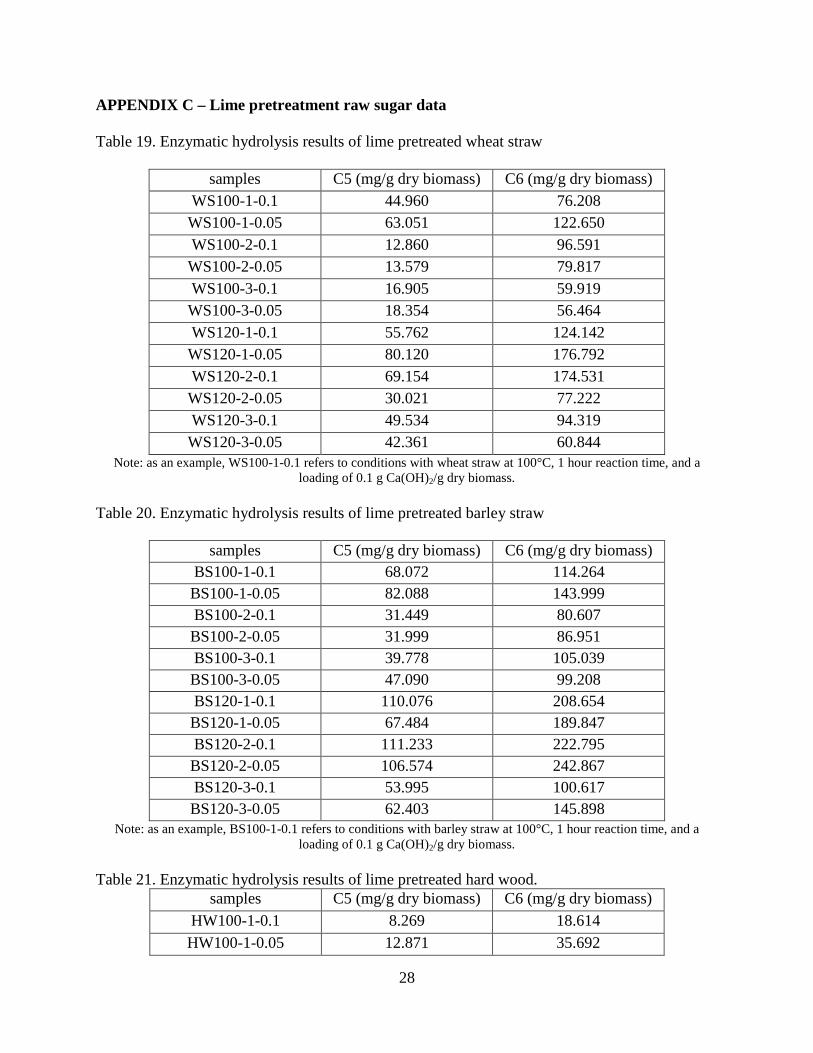
APPENDIX C – Lime pretreatment raw sugar data Table 19. Enzymatic hydrolysis results of lime pretreated wheat straw
samples C5 (mg/g dry biomass) C6 (mg/g dry biomass) WS100-1-0.1 44.960 76.208 WS100-1-0.05 63.051 122.650 WS100-2-0.1 12.860 96.591 WS100-2-0.05 13.579 79.817 WS100-3-0.1 16.905 59.919 WS100-3-0.05 18.354 56.464 WS120-1-0.1 55.762 124.142 WS120-1-0.05 80.120 176.792 WS120-2-0.1 69.154 174.531 WS120-2-0.05 30.021 77.222 WS120-3-0.1 49.534 94.319 WS120-3-0.05 42.361 60.844
Note: as an example, WS100-1-0.1 refers to conditions with wheat straw at 100°C, 1 hour reaction time, and a loading of 0.1 g Ca(OH)2/g dry biomass.
Table 20. Enzymatic hydrolysis results of lime pretreated barley straw
samples C5 (mg/g dry biomass) C6 (mg/g dry biomass) BS100-1-0.1 68.072 114.264 BS100-1-0.05 82.088 143.999 BS100-2-0.1 31.449 80.607 BS100-2-0.05 31.999 86.951 BS100-3-0.1 39.778 105.039 BS100-3-0.05 47.090 99.208 BS120-1-0.1 110.076 208.654 BS120-1-0.05 67.484 189.847 BS120-2-0.1 111.233 222.795 BS120-2-0.05 106.574 242.867 BS120-3-0.1 53.995 100.617 BS120-3-0.05 62.403 145.898
Note: as an example, BS100-1-0.1 refers to conditions with barley straw at 100°C, 1 hour reaction time, and a loading of 0.1 g Ca(OH)2/g dry biomass.
Table 21. Enzymatic hydrolysis results of lime pretreated hard wood.
samples C5 (mg/g dry biomass) C6 (mg/g dry biomass) HW100-1-0.1 8.269 18.614 HW100-1-0.05 12.871 35.692

29
HW100-2-0.1 19.029 24.776 HW100-2-0.05 12.203 34.400 HW100-3-0.1 13.125 29.949 HW100-3-0.05 10.225 30.958 HW120-1-0.1 29.480 65.271 HW120-1-0.05 37.569 93.592 HW120-2-0.1 38.669 79.504 HW120-2-0.05 12.687 75.658 HW120-3-0.1 18.794 34.337 HW120-3-0.05 14.011 22.492
HW100-1-0.1 refers to conditions with hard wood at 100°C, 1 hour reaction time, and a loading of 0.1 g Ca(OH)2/g dry biomass. Table 22. Enzymatic hydrolysis results of lime pretreated soft wood
samples C5 (mg/g dry biomass) C6 (mg/g dry biomass) SW100-1-0.1 2.220 26.019 SW100-1-0.05 3.639 30.084 SW100-2-0.1 4.736 22.063 SW100-2-0.05 7.924 35.218 SW100-3-0.1 6.430 22.424 SW100-3-0.05 7.427 33.065 SW120-1-0.1 7.207 73.884 SW120-1-0.05 6.063 56.000 SW120-2-0.1 4.780 52.389 SW120-2-0.05 6.337 60.505 SW120-3-0.1 11.231 32.093 SW120-3-0.05 10.255 16.634
Note: as an example, SW100-1-0.1 refers to conditions with soft wood at 100°C, 1 hour reaction time, and a loading of 0.1 g Ca(OH)2/g dry biomass.

30
Table 23. Enzymatic hydrolysis results of lime pretreated biomass mixture
samples C5 (mg/g dry biomass) C6 (mg/g dry biomass) M100-1-0.1 30.880 58.776 M100-1-0.05 40.412 83.106 M100-2-0.1 17.018 56.009 M100-2-0.05 16.426 59.097 M100-3-0.1 19.059 54.333 M100-3-0.05 20.774 54.924 M120-1-0.1 38.631 138.000 M120-1-0.05 35.815 152.100 M120-2-0.1 43.934 132.305 M120-2-0.05 38.905 114.063 M120-3-0.1 33.389 65.341 M120-3-0.05 32.257 61.467
Note: as an example, M100-1-0.1 refers to conditions with a mixed biomass sample at 100°C, 1 hour reaction time, and a loading of 0.1 g Ca(OH)2/g dry biomass.

31
APPENDIX D – Abbreviations
ADF: Acid detergent fiber
ADL: Acid detergent lignin
NDF: Neutral detergent fiber
SAA: Soaking in aqueous ammonia
SSF: Simultaneous saccharification and fermentation
32
REFERENCES
Adney, B. and J. Baker (1996). "Measurement of cellulase activities." Laboratory Analytical Procedure (LAP), National Renewable Energy Laboratory (NREL).
Aman, P. and E. Westerlund (1996). "Cellwall polysaccharides: structural, chemical and analytical aspects." Carbohydrates in food 159(Carbohydrates).
Brown, L. and R. Torget (1996). Enzymatic saccharification of lignocellulosic biomass. Laboratory Analytical Procedure (LAP), National Renewable Energy Laboratory (NREL).
Chang, V. S., W. E. Kaar, et al. (2001). "Simultaneous saccharification and fermentation of lime-treated biomass." Biotechnology Letters 23(16): 1327-1333.
Chang, V. S., M. Nagwan, et al. (1998). Lime Pretreatment of Crop Residues Bagasse and Wheat Straw.
Chang, V. S., M. Nagwani, et al. (1998). "Lime pretreatment of crop residues bagasse and wheat straw." Applied Biochemistry and Biotechnology 74(3): 135-159.
Dowe, N. and J. McMillan (2001). SSF Experimental Protocols — Lignocellulosic biomass hydrolysis and fermentation. Laboratory Analytical Procedure (LAP), National Renewable Energy Laboratory (NREL).
Frear, C. Z., Bingcheng; Fu, Guobin; Richardson, Michael; Chen, Shulin (2005). Biomass Inventory and Bioenergy Assessment.
KIM, T. H. and Y. Y. LEE (2007). "Pretreatment of Corn Stover by Soaking in Aqueous Ammonia at Moderate Temperatures."
Kim, T. H., F. Taylor, et al. (2008). "Bioethanol production from barley hull using SAA (soaking in aqueous ammonia) pretreatment." Bioresource Technology 99(13).
Sun, Y. and J. J. Cheng (2004). "Dilute acid pretreatment of rye straw and bermudagrass for ethanol production."
Yang, B. and C. E. Wyman (2004). "Effect of xylan and lignin removal by batch and flowthrough pretreatment on the enzymatic digestibility of corn stover cellulose." Biotechnology and Bioengineering 86(1): 88-95.
Zhu, S., Y. Wu, et al. (2005). "Pretreatment by microwave/alkali of rice straw and its enzymic hydrolysis." Process Biochemistry (Oxford, United Kingdom) 40(9): 3082-3086.