Embed Size (px)
Citation preview
Evaluation of potential for chitosan to enhance plant defence
A report for the Rural Industries Research and Development Corporation by Rachel Walker, Suzanne Morris, Phil Brown and Alistair Gracie

August 2004 RIRDC Publication No 04/… RIRDC Project No RSAG-4A
© 2004 Rural Industries Research and Development Corporation. All rights reserved. ISBN 0 642 (…RIRDC to assign) ISSN 1440-6845 Evaluation of potential of chitosan to enhance plant defence Publication No. 04/ Project No. RS The views expressed and the conclusions reached in this publication are those of the author and not necessarily those of persons consulted. RIRDC shall not be responsible in any way whatsoever to any person who relies in whole or in part on the contents of this report. This publication is copyright. However, RIRDC encourages wide dissemination of its research, providing the Corporation is clearly acknowledged. For any other enquiries concerning reproduction, contact the Publications Manager on phone 02 6272 3186. Researcher Contact Details Rachel Walker 16 Hillcrest Rd, Devonport, TAS 7310 Phone: (03) 6423 2044 Fax: (03) 6423 4876 Email: [email protected]
In submitting this report, the researcher has agreed to RIRDC publishing this material in its edited form. RIRDC Contact Details Rural Industries Research and Development Corporation Level 1, AMA House 42 Macquarie Street BARTON ACT 2600 PO Box 4776 KINGSTON ACT 2604 Phone: 02 6272 4819 Fax: 02 6272 5877 Email: [email protected]. Website: http://www.rirdc.gov.au Published in August 2004 Printed on environmentally friendly paper by Canprint

Foreword This publication details trials conducted to evaluate chitosan in Australian field cropping situations. Chitosan is a plant defence booster derived from deactylation of chitin. Chitin is readily available from shellfish waste from food processing. Agricultural applications of chitosan are for stimulation of plant defence. Trials were conducted in organic and conventional crops. This project was funded from RIRDC Organic Program Funds, which are provided by the Australian Government. This report also contains information from trials funded by Horticulture Australia Limited Project VG02087 (Australian Government and vegetable grower levy funds). This report, an addition to RIRDC’s diverse range of over 1000 research publications, forms part of our Organic R&D program, which aims to facilitate the development of a viable organic industry through increasing adoption of sustainable organic farming systems. Most of our publications are available for viewing, downloading or purchasing online through our website: • downloads at www.rirdc.gov.au/fullreports/index.html • purchases at www.rirdc.gov.au/eshop Simon Hearn Managing Director Rural Industries Research and Development Corporation
i
Acknowledgments Contributions from the following people are gratefully acknowledged. Technical assistance: Rachel Walker, Suzanne Morris, Alistair Gracie, Simon Yang, Sarah Lamprey, Tim Hingston, Erin Jackson, Heather Tyson, Pam Cox, Craig Morris, Lyndon Head, Eve Wresell, Pip Sadler and Kate Smith. Trial work on lettuce was conducted as part of Pip Sadler’s Honours Thesis project. Growers: Bruce and Clare Jackson, Anthony, Marcus and John Brandsema, Darren Wigg, Mike and Tim Walker and Richard Bovill. Administrative support: Mary Trebilco, Karon Faulkner and Jane Floyed. Product supplies: Organic Crop Protectants (Australia) and Leili Agrochemicals (China).
ii
Media Summary The term ‘plant defence booster’ applies to a group of compounds, which act by triggering various physiological and morphological responses within the plant that help to stimulate natural defence mechanisms. The practical significance of plant defence boosters is that they can help to reduce the amount of crop protection chemicals applied to crops. Chitosan is a plant defence booster derived from deactylation of chitin. Chitin is readily available from shellfish waste from food processing. Agricultural applications of chitosan are for stimulation of plant defence. The chitosan molecule triggers a defence response within the plant, leading to the formation of physical and chemical barriers against invading pathogens. While some chitosan efficacy studies have been completed overseas, most have investigated the biochemical and physiological plant responses to chitosan. There have been few field studies, and very limited replicated trial work conducted in Australia. The aim of this project was to screen chitosan in a number of crops to determine the potential of chitosan as a plant defence booster in Australian agriculture. Agricultural chitosan formulations are not readily available in Australia for trial evaluation purposes, although there are numerous Asian companies willing to ship bulk supplies to Australia. A quarantine biological import permit is required to bring chitosan into Australia. One chitosan was sourced from China for trial work. Generally, chitosan products are not well described and most manufacturers were unable to state exact concentration of chitosan in the product. A formulation of chitosan called Aminogro® was used in most trials. Aminogro® is the only formulation of chitosan that is produced in Australia and which is certified as an allowable organic input. Screening trials were conducted in tomatoes, peas, carrots, beetroot, lettuce, snow peas, cucumber and capsicums. No phytotoxicity was observed in any of the trials. In this project, trial results were most promising in tomatoes. Aminogro® chitosan resulted in yield increases of nearly 20% in two out of three tomato trials. In all tomato trials, chitosan applications resulted in a significant improvement in powdery mildew disease control. Trial results and recent publications in international literature indicate Solanaceae plants may respond well to plant defence booster products. Screening of plant defence booster products in potatoes is recommended for future trial work. Solanaceae crops are significant vegetable crops in Australia, and there is a potentially large target market. Growers would have considerably more confidence in chitosan as a crop protection input if it was registered with the Australia Pesticides and Veterinary Medicines Authority (APVMA). A checklist of requirements for registration of chitosan with APVMA is included in the report. Plant physiological studies were limited because of difficulties with enzyme activity methods. No relationships between chitosan application and stimulation of chitinase enzyme activity was identified. Results from the literature indicate variability in detection of plant defence responses following application of plant defence boosters. It is recommended that the most conclusive results about plant defence activation would be achieved with molecular studies, although this would be very expensive.
iii
Contents Foreword .................................................................................................................................................. i Acknowledgments ................................................................................................................................... ii Media Summary ..................................................................................................................................... iii Introduction ............................................................................................................................................. 2 Objectives................................................................................................................................................ 2 Chapter 1 - Chitosan Literature Review.................................................................................................. 3 Chapter 2 - General Trial Methods.......................................................................................................... 7 Chapter 3 - Analytical Methods .............................................................................................................. 8
Chitinase activity assay ....................................................................................................................8 Chapter 4 – Tomatoes ............................................................................................................................. 9
Foliar application to conventional tomatoes ........................................................................................9 Methods............................................................................................................................................9 Results and Discussion...................................................................................................................11
Hydroponic dosing to conventional tomatoes ....................................................................................16 Methods..........................................................................................................................................16 Results and Discussion...................................................................................................................16
Foliar application to organic tomatoes ...............................................................................................19 Methods..........................................................................................................................................19 Results and Discussion...................................................................................................................20
Chapter 5 – Carrots ............................................................................................................................... 21 Methods..............................................................................................................................................21 Results and Discussion.......................................................................................................................22
Chapter 6 – Cucumbers ......................................................................................................................... 23 Methods..............................................................................................................................................23 Results and Discussion.......................................................................................................................24
Chapter 7 – Peas.................................................................................................................................... 25 Methods..............................................................................................................................................25 Results and Discussion.......................................................................................................................26
Chapter 8 – Snow peas .......................................................................................................................... 27 Methods..............................................................................................................................................27 Results and Discussion.......................................................................................................................28
Chapter 9 – Capsicums.......................................................................................................................... 29 Methods..............................................................................................................................................29 Results and Discussion.......................................................................................................................29
Chapter 10 – Beetroot ........................................................................................................................... 31 Methods..............................................................................................................................................31 Results and Discussion.......................................................................................................................31
Chapter 11 – Lettuce ............................................................................................................................. 32 Methods..............................................................................................................................................32 Results and Discussion.......................................................................................................................33
Chapter 12 – Conclusions and Recommendations ................................................................................ 37 Technology Transfer ............................................................................................................................. 38 References ............................................................................................................................................. 39 Appendix i – Aminogro® analysis........................................................................................................ 42 Appendix ii – Chitosan APVMA registration checklist ........................................................................ 43 Plain English Compendium Summary .................................................................................................. 48
Introduction Plant defence boosters are currently receiving considerable research interest. The term ‘plant defence booster’ applies to a group of compounds, which act by triggering various physiological and morphological responses within the plant that help to stimulate natural defence mechanisms. The practical significance of plant defence boosters is that they can help to reduce the amount of crop protection chemicals applied to crops. Chitosan is a plant defence booster that is yet to receive scientific evaluation in Australia. Chitosan is a natural polymer derived from deactylation of chitin. Chitin is readily available from shellfish waste from food processing. Agricultural applications of chitosan are for stimulation of plant defence. The chitosan molecule triggers a defence response within the plant, leading to the formation of physical and chemical barriers against invading pathogens. While some chitosan efficacy studies have been completed overseas, most have investigated the biochemical and physiological plant responses to chitosan. There have been few field studies, and the scientific validity of some of these studies is questionable. A number of field studies from overseas have reported crop yield and quality increases. If proven effective, chitosan has the potential to be used as a plant defence booster in both organic and conventional systems.
Objectives
• Recommendations on whether chitosan should be further developed as an organic plant defence booster product in Australia. Recommendations on whether chitosan should be used alone, or in combination with reduced applications of copper and conventional pesticides
• RIRDC report on efficacy of chitosan against specific vegetable diseases, and information about compatibility with organic and IPM/conversion practices
• Inititation of product development work for a natural polymer that has potential for use in organic agriculture. This will be valuable if product registration (and organic certification) proceeds
• A better understanding of plant morphological and physiological responses to chitosan.
2
Chapter 1 - Chitosan Literature Review Agricultural applications of chitosan Internet searches for the word “chitosan” instantly hit on the product as a weight loss supplement. Chitosan became widely accepted as a diet aid following the 1997 publication of The Fat Blocker Diet by Arnold Fox and Brenda Adderly. Aside from weight loss supplements, chitosan has industrial, pharmaceutical and cosmetic applications. The focus of this product review was agricultural applications of chitosan. A summary of scientific papers on chitosan as a plant defence booster is given in Table 1.1. The literature review of papers published on agricultural applications of chitosan indicated that most promising results had been obtained with tomatoes as the target crop. Product description and mode of action The BioPesticides Manual (2002) describes chitosan as a ‘crustacean-derived plant defence booster’. It is a polysaccharide called 2-Amino-2-deoxy-beta-D-glucosasmine. Chitosan is a modified natural carbohydrate polymer derived from chitin, which occurs principally in animals of the phylum Arthropoda. The primary unit in the chitin polymer is 2-deoxy-2-(acetylamino) glucose. The units are combined by 1,4 glycosidic linkages, forming a long chain linear polymer. Removal of most of the acetyl groups of chitin by treatment with strong alkalis yields chitosan (Peniston & Johnson, 1980). The mode of action of chitosan is to stimulate natural defence response systems in treated plants. Poly-D-glucosamine binds to fungal receptor sites, mimicking an attack by fungal spores. This in turn results in signals being sent to the nuclei of the plant and triggering signals which elicit multiple genetic and biological responses, including the production of phytoalexins (anti-microbial compounds produced in plants), aimed at inhibiting infections (BioPesticides Manual, 2002). Allocation of plant resources and phytotoxic effects It has been suggested that when plants are induced to become resistant, in particular in the absence of pest pressure, there is often a plant fitness cost associated with the response. When plants are induced to become resistant, many physiological, biochemical and ultra-structural changes take place, suggesting possible alterations in the allocation of plant resources (Louws et al., 2001). In particular, plants appear to favour induced host resistance above constitutive processes under low nitrogen levels. It has been proposed that the use of plant activators under crop stress conditions may induce plants to divert energy and plant resources to mount defence responses at the expense of constitutive growth requirements resulting in phytotoxicity (Louws et al., 2001). In support of this hypothesis, phytotoxicity in flue cured tobacco seedlings was evidenced as scattered necrotic spots and slight chlorosis, but was overcome by top dressing with calcium nitrate, suggesting a possible diversion of nitrogen into systemic acquired resistance (SAR) initiated metabolism (Cole, 1999). In bell peppers, there was a reduction or delay in fruit set and maturity when resistance was induced (Romero et al., 2001). The energy cost associated with inducing defence responses may not be the sole or primary mechanisms by which phytotoxicity occurs. Phytotoxicity is more likely to occur in a majority of plant systems when plants are under stress, however it can occur due to the misuse or misapplication of chemicals. Environmental conditions, such as high temperatures, have also been observed to increase the likelihood of injury from pesticides. One of the aims of this project was to investigate whether chitosan application resulted in any phytotoxic responses in target crops.
3
Product sourcing The main industrial sources of chitin are the shell wastes of shrimp, lobster and crab. Chitosan is also prepared from squid pens. The largest manufacturers of chitosan are based in countries with large shellfish processing industries. Agricultural chitosan is largely supplied by companies in Korea, China, India and Norway. Because chitosan is derived from biological material, a biological import permit is required to bring samples into Australia. This permit requires the manufacturer to provide extensive information including the process of manufacture. Agricultural chitosan formulations were identified from other countries, but most manufacturers were only prepared to ship commercial volumes of product. A Chinese chitosan formulation was imported for this project, but the paperwork involved was considerable. There is a very limited supply of agricultural chitosan products in Australia. The only product containing chitosan that is produced in Australia is Aminogro®, manufactured by Organic Crop Protectants.
4
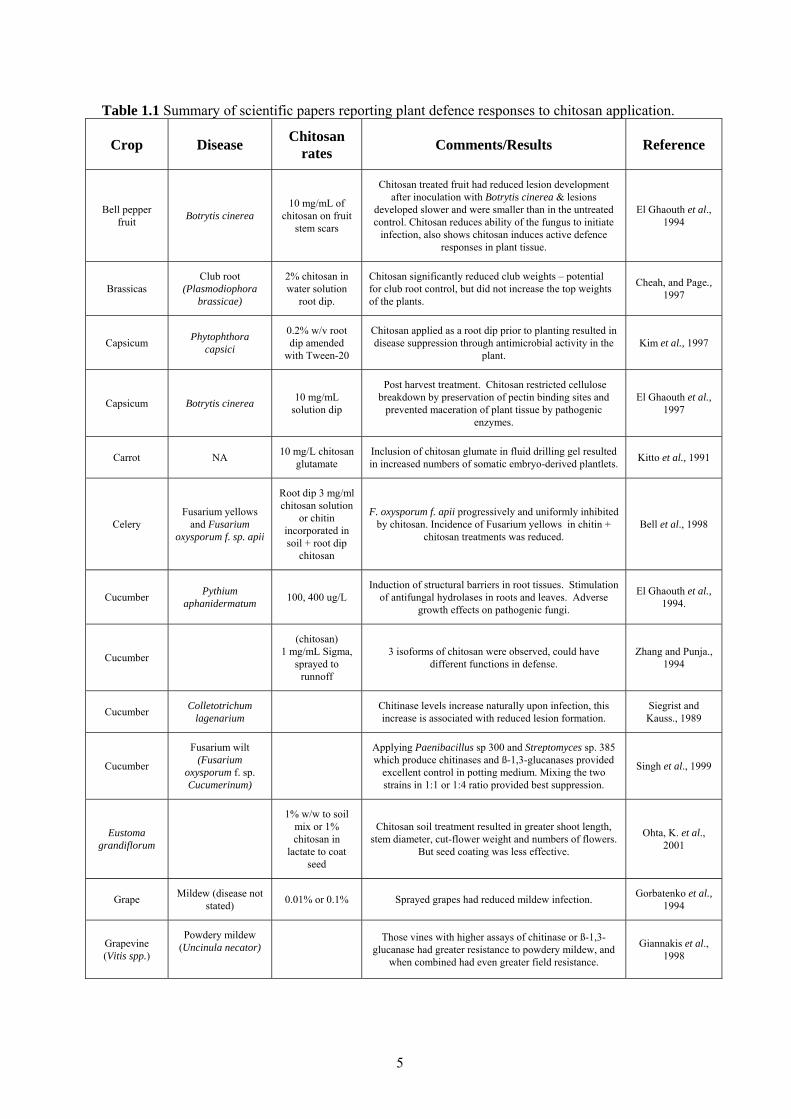
Table 1.1 Summary of scientific papers reporting plant defence responses to chitosan application.
Crop Disease Chitosan rates Comments/Results Reference
Bell pepper fruit Botrytis cinerea
10 mg/mL of chitosan on fruit
stem scars
Chitosan treated fruit had reduced lesion development after inoculation with Botrytis cinerea & lesions
developed slower and were smaller than in the untreated control. Chitosan reduces ability of the fungus to initiate
infection, also shows chitosan induces active defence responses in plant tissue.
El Ghaouth et al., 1994
Brassicas Club root
(Plasmodiophora brassicae)
2% chitosan in water solution
root dip.
Chitosan significantly reduced club weights – potential for club root control, but did not increase the top weights of the plants.
Cheah, and Page., 1997
Capsicum Phytophthora capsici
0.2% w/v root dip amended
with Tween-20
Chitosan applied as a root dip prior to planting resulted in disease suppression through antimicrobial activity in the
plant. Kim et al., 1997
Capsicum Botrytis cinerea 10 mg/mL solution dip
Post harvest treatment. Chitosan restricted cellulose breakdown by preservation of pectin binding sites and
prevented maceration of plant tissue by pathogenic enzymes.
El Ghaouth et al., 1997
Carrot NA 10 mg/L chitosan glutamate
Inclusion of chitosan glumate in fluid drilling gel resulted in increased numbers of somatic embryo-derived plantlets. Kitto et al., 1991
Celery Fusarium yellows
and Fusarium oxysporum f. sp. apii
Root dip 3 mg/ml chitosan solution
or chitin incorporated in soil + root dip
chitosan
F. oxysporum f. apii progressively and uniformly inhibited by chitosan. Incidence of Fusarium yellows in chitin +
chitosan treatments was reduced. Bell et al., 1998
Cucumber Pythium aphanidermatum 100, 400 ug/L
Induction of structural barriers in root tissues. Stimulation of antifungal hydrolases in roots and leaves. Adverse
growth effects on pathogenic fungi.
El Ghaouth et al., 1994.
Cucumber
(chitosan) 1 mg/mL Sigma,
sprayed to runnoff
3 isoforms of chitosan were observed, could have different functions in defense.
Zhang and Punja., 1994
Cucumber Colletotrichum lagenarium Chitinase levels increase naturally upon infection, this
increase is associated with reduced lesion formation. Siegrist and Kauss., 1989
Cucumber
Fusarium wilt (Fusarium
oxysporum f. sp. Cucumerinum)
Applying Paenibacillus sp 300 and Streptomyces sp. 385 which produce chitinases and ß-1,3-glucanases provided
excellent control in potting medium. Mixing the two strains in 1:1 or 1:4 ratio provided best suppression.
Singh et al., 1999
Eustoma grandiflorum
1% w/w to soil mix or 1% chitosan in
lactate to coat seed
Chitosan soil treatment resulted in greater shoot length, stem diameter, cut-flower weight and numbers of flowers.
But seed coating was less effective.
Ohta, K. et al., 2001
Grape Mildew (disease not stated) 0.01% or 0.1% Sprayed grapes had reduced mildew infection. Gorbatenko et al.,
1994
Grapevine (Vitis spp.)
Powdery mildew (Uncinula necator)
Those vines with higher assays of chitinase or ß-1,3-glucanase had greater resistance to powdery mildew, and
when combined had even greater field resistance.
Giannakis et al., 1998
5
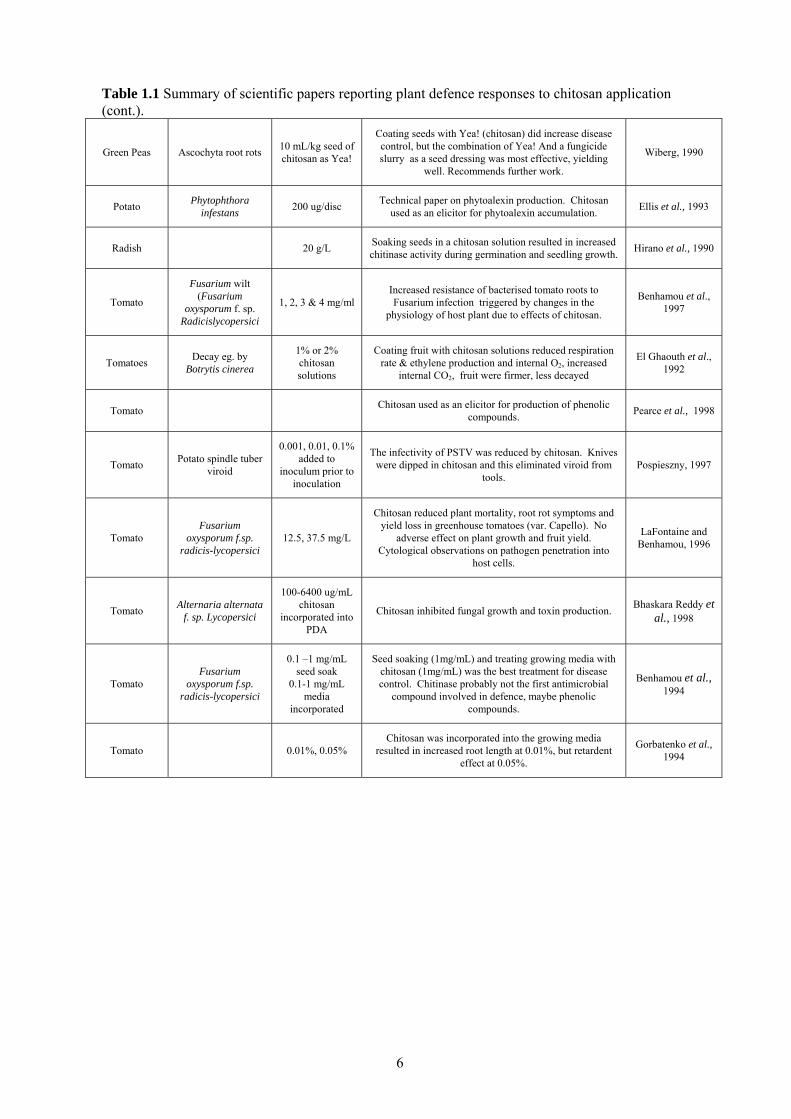
Table 1.1 Summary of scientific papers reporting plant defence responses to chitosan application (cont.).
Green Peas Ascochyta root rots 10 mL/kg seed of chitosan as Yea!
Coating seeds with Yea! (chitosan) did increase disease control, but the combination of Yea! And a fungicide slurry as a seed dressing was most effective, yielding
well. Recommends further work.
Wiberg, 1990
Potato Phytophthora infestans 200 ug/disc Technical paper on phytoalexin production. Chitosan
used as an elicitor for phytoalexin accumulation. Ellis et al., 1993
Radish 20 g/L Soaking seeds in a chitosan solution resulted in increased chitinase activity during germination and seedling growth. Hirano et al., 1990
Tomato
Fusarium wilt (Fusarium
oxysporum f. sp. Radicislycopersici
1, 2, 3 & 4 mg/ml Increased resistance of bacterised tomato roots to Fusarium infection triggered by changes in the
physiology of host plant due to effects of chitosan.
Benhamou et al., 1997
Tomatoes Decay eg. by Botrytis cinerea
1% or 2% chitosan solutions
Coating fruit with chitosan solutions reduced respiration rate & ethylene production and internal O2, increased
internal CO2, fruit were firmer, less decayed
El Ghaouth et al., 1992
Tomato Chitosan used as an elicitor for production of phenolic compounds. Pearce et al., 1998
Tomato Potato spindle tuber viroid
0.001, 0.01, 0.1% added to
inoculum prior to inoculation
The infectivity of PSTV was reduced by chitosan. Knives were dipped in chitosan and this eliminated viroid from
tools. Pospieszny, 1997
Tomato Fusarium
oxysporum f.sp. radicis-lycopersici
12.5, 37.5 mg/L
Chitosan reduced plant mortality, root rot symptoms and yield loss in greenhouse tomatoes (var. Capello). No
adverse effect on plant growth and fruit yield. Cytological observations on pathogen penetration into
host cells.
LaFontaine and Benhamou, 1996
Tomato Alternaria alternata f. sp. Lycopersici
100-6400 ug/mL chitosan
incorporated into PDA
Chitosan inhibited fungal growth and toxin production. Bhaskara Reddy et al., 1998
Tomato Fusarium
oxysporum f.sp. radicis-lycopersici
0.1 –1 mg/mL seed soak
0.1-1 mg/mL media
incorporated
Seed soaking (1mg/mL) and treating growing media with chitosan (1mg/mL) was the best treatment for disease control. Chitinase probably not the first antimicrobial
compound involved in defence, maybe phenolic compounds.
Benhamou et al., 1994
Tomato 0.01%, 0.05% Chitosan was incorporated into the growing media
resulted in increased root length at 0.01%, but retardent effect at 0.05%.
Gorbatenko et al., 1994
6
Chapter 2 - General Trial Methods Two formulations of agricultural chitosan were sourced. A chitosan formulation manufactured by Leili Agrochemicals was imported from China. Obtaining the quarantine biological import permit for this product took several months. Some communication was had with Safe Science in United States of America, the company which distributes Elexa. Elexa has been widely promoted as an effective chitosan formulation for use in agriculture, however, at the time of contact, Safe Science communicated that they were not in a position to supply product for Australian trials. Efforts were made to source water soluble chitosans from health food outlets. However, no water soluble chitosan was available. Due to the Pan Pharmaceuticals collapse, a lot of chitosan products had been taken off the market. A chitosan formulation marketed by Organic Crop Protectants was sourced from Australia. This product was readily available and Organic Crop Protectants were most helpful in all aspects of the project. Aminogro® is also the only organically certified product in Australia; it is certified as an allowable organic input by Biological Farmers of Australia (BFA). Appendix i gives details of Aminogro® product composition. An untreated control was included in all trials. For trials in certified organic crops, the untreated control was also the commercial control. For trials in conventional crops, a commercial standard was included that comprised standard product applications as per grower practice. Treatment applications were made in a variety of ways:
• seed drench at sowing • foliar application using CO2 pressurised sprayer fitted with hand lance (TeeJet nozzle) • foliar application using manual pump sprayer • foliar application using CO2 pressurised sprayer fitted with boom (TeeJet nozzles) • drip application through greenhouse hydroponics system
Treatment applications were generally on a 10-14 day schedule, unless otherwise stated. All trials were replicated in randomised complete block designs or completely randomised designs. There was a minimum of four replicates per treatment in each trial. Trials were assessed for yield and quantifiable quality variables used by industry. Trials were conducted in tomatoes, carrots, cucumbers, peas, snow peas, capsicums, beetroot and lettuce. The following chapters give trial details and results for these crops. A trial was also commenced to evaluate chitosan for yield and quality improvements in spring onions and to compare chitosan with a commercial Tasmanian kelp extract. Applications commenced one day after sowing and continued on a fortnightly schedule for 6 weeks. No differences between treatments were observed during crop establishment, and there were no phytotoxic effects. Despite repeated reports to the grower that pinkweed was taking over the crop, no weed management was employed in the crop. Consequently, the trial had to been abandoned due to severe weed pressure. Heavy downpours occurred in January and there was substantial washout across the whole of the spring onion paddock. This was another factor that would have influenced yield results significantly.
7
Chapter 3 - Analytical Methods The role of chitinase in induced resistance has been previously demonstrated in a number of plant species (Roby et al., 1987; Lawton et al., 1996; Siegrist et al., 1997; Ohta et al., 2001; Yu and Meuhlbauer, 2001). Chitinases demonstrate anti-fungal activity by catalyzing the hydrolysis of β-1,4-N-acetylglucosamine linkages of chitin polymers, chitin constituting a significant fraction of fungal cell walls (Bowles, 1990). Chitinase activity assay Sampling for Chitinase Enzyme Assays Leaf samples collected from field trials were returned to the laboratory on ice and stored at -80oC and then freeze dried. The freeze dried samples were labelled appropriately and stored in a freezer (-18oC) until needed for chitinase activity analysis.
Enzyme Extraction For all samples, approximately 1 g of freeze dried leaf tissue was homogenized for 4 minutes in 5ml of chilled 50 mM sodium acetate extraction buffer, pH 5.0, containing 1 mM dithiothreitol and 0.02% phenylmethylsulfonyl fluoride. The extract was centrifuged for 10 minutes at 10,000 g, removing all insoluble material from homogenates and leaving supernatants to be used as chitinase activity assays (method extracted from Derckel et al., 1996; Wirth & Wolf, 1990).
Protein Content Determination Total protein concentration of the samples was measured using the method described by Bradford, (1976). Bovine serum albumin (BSA) (Boehringer Fraction IV) was used as a standard. The method involved preparing a protein reagent to later use in the protein assay and this consisted of dissolving 100 mg of Coomassie Brilliant Blue G-259 in 50ml of 95% ethanol. To this solution 100 ml of 85% (w/v) phosphoric acid was added, with the resulting solution diluted to a final volume of 1 litre. For the protein assay, protein solution (BSA) containing 10 to 100 µg of protein in a volume up to 0.1 ml was pipetted into test tubes (12 x 100 mm). The volume in each test tube was adjusted to 0.1 ml with the sodium acetate extraction buffer. Five millilitres of protein reagent was added to the test tube and the contents were mixed by vortexing. The absorbance at 595 nm was measured between 5 and 20 minutes in 3 ml curvettes against a reagent blank prepared from 0.1 ml of the appropriate buffer and 5 ml of protein reagent. The weight of protein was plotted against the corresponding absorbance resulting in a standard curve from which the protein content in unknown samples was determined. Chitinase Activity Measurement Chitinase activity was determined by mixing well (in 1 ml eppendorf tubes) 100 µl of supernatant from the extraction procedure in 100 µl water, 100 µl chitin azure (2 mg ml-1 stock) and 100 µl of a 200 mM sodium acetate buffer (pH 5). Tubes were incubated at 30°C for 1 hour before being stopped by the addition of 0.4 mL of 0.3M HCL and placed immediately on ice for 10 minutes. Tubes were centrifuged at 5,000 g for 10 minutes to pellet any unused substrate. Absorbance of the supernatant was read at 550 nm using a Lamba 20 UV/VIS spectrometer. Chitinase activity was calculated from a standard curve derived using purified chitinase (Sigma, Aust). For all samples chitinase activity was expressed on both a per unit dry weight basis and a per unit protein basis.
8
Chapter 4 – Tomatoes Four trials were conducted in commercial greenhouse tomato crops. The trials were as follows:
• Foliar application to conventionally grown tomatoes • Hydroponic dosing to conventionally grown tomatoes • Foliar application to organically grown tomatoes (2 trials)
The conventional crops were grown at J Brandsema and Sons, Turners Beach, NW Tasmania. The organic crops were grown at Yorktown Organics, Yorktown, northern Tasmania. The treatment protocol for each trial was quite different so the trials are described separately below. Foliar application to conventional tomatoes Methods Greenhouse tomatoes (var. Cindel) were grown as per commercial practice in a drain to waste hydroponics system in summer 2002/3. Chitosan formulations were applied as plug drenches at seeding, during transplant growth and as foliar applications using a hand held pump sprayer (Table 4.1). Trial design was a replicated completely randomised design with four replicates per treatment. Each replicate consisted of one planting basket which contained two plants. Table 4.1 Treatment list for trial in commercial conventional tomato crop (var. Cindel).
No. Treatment Product rate (sprayed to runoff) Application schedule
1 Untreated control Water Foliar sprays at 10-14 day intervals. 2 Aminogro® foliar 10 mL/L Foliar sprays at 10-14 day intervals.
3 Aminogro® program
5 mL/L at seeding and transplanting,
10 mL/L for foliar sprays.
Soil drench at seeding and transplanting. Foliar sprays at 10-14
day intervals.
4 Chinese chitosan foliar 5 mL/L Foliar sprays at 10-14 day intervals.
5 Chinese chitosan program
2.5 mL/L at seeding, 2 mL/L at transplanting, 5 mL/L for foliar sprays.
Soil drench at seeding and transplanting. Foliar sprays at 10-14
day intervals.
6
Commercial standard program with Aminogro® foliar
Commercial products applied as per below rates.
10 mL/L Aminogro® foliar.
Commercial products applied as per below. Foliar sprays of Aminogro®
at 10-14 day intervals.
7 Commercial standard program
Skim milk 50 mL/L applied to transplants.
Eco-carb 3 g/L and Synertrol 200 mL/100 L applied as
foliar sprays.
Skim milk at fortnightly intervals until planting out. Eco-carb/Synertrol
applied fortnightly until 24/02/03, after which sprays were applied twice
weekly until harvest.
9
a b
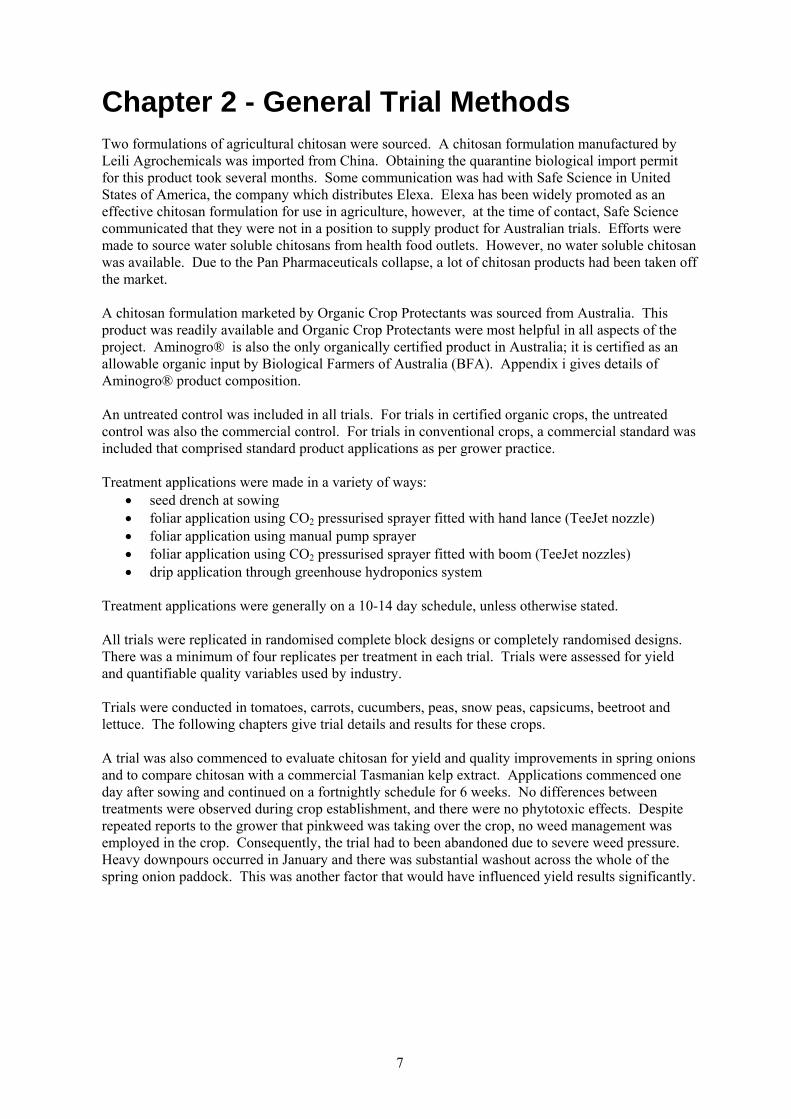
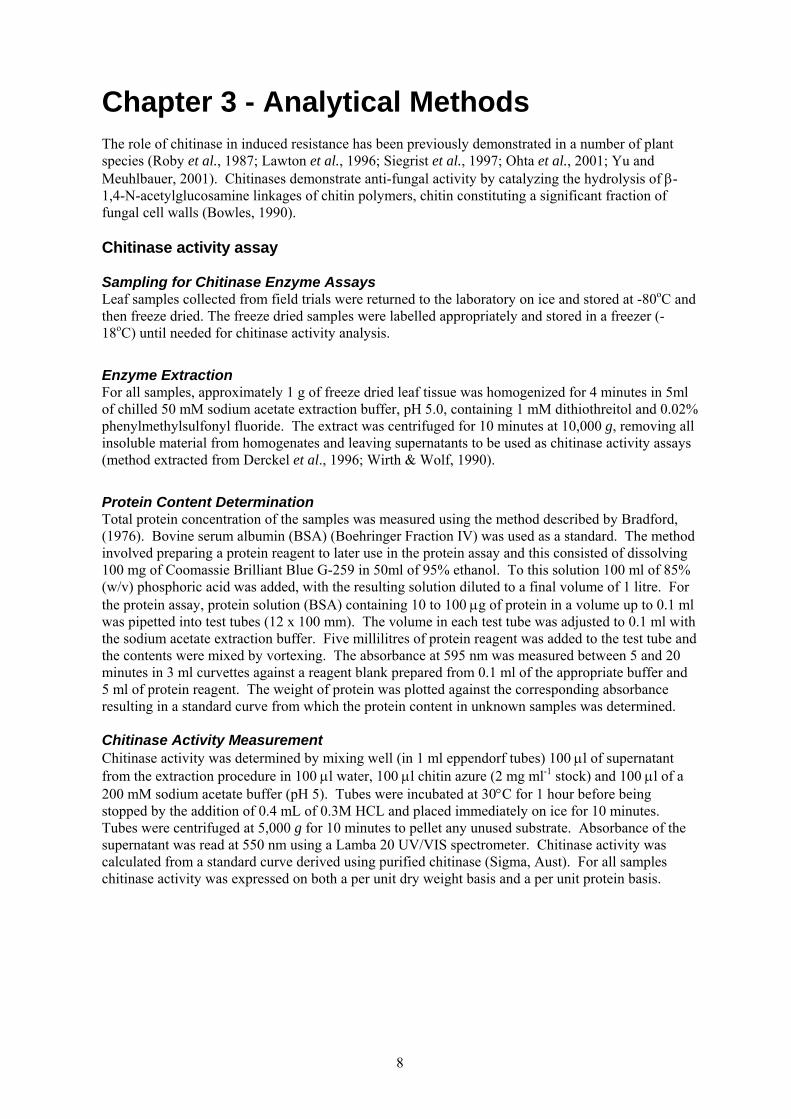
Figure 4.1 Views of tomato transplants. Trial transplants immediately after drenching with chitosan (a). Planting transplants out in the main greenhouse into growing bags (b). The growers, J Brandsema and Sons, use Integrated Pest Management in their greenhouse, and they deliberately adopt a ‘soft option’ spray program for powdery mildew if possible. Table 4.1 shows the commercial program that they adopted for this crop. Tomatoes were harvested twice weekly from 6/02/03 until 24/04/03. The entire crop from every tagged trial vine was picked, and the weight of fruit recorded. Brix readings were taken twice throughout the harvest period. At each pick, ripeness of tomatoes was scored using colour ratings (Figure 4.2). Ripeness rating was calculated as below: 3 = bright red, very ripe 2 = pale red, nearly ripe 1 = tinge of green, only just ready for picking Ripeness rating = ∑((no. of picked x3) + (no. picked x 2) + (no. picked x 1))/total pick
a b
Figure 4.2 Bright red tomatoes immediately after harvest (a). Truss with ripe tomatoes and developing fruit. Pale red tomato would be ripe for harvest in about 2 days (b).
10

At each pick, the number of fruit with powdery mildew on the calyx was also recorded (Figure 4.3). Powdery mildew foliar disease assessments were made at regular intervals throughout crop growth. The percentage of total leaf surface covered with powdery mildew lesions was estimated (Figure 4.3) and a rating category assigned using the powdery mildew rating scale below. 0 = no disease present 1 = 1-5% of leaf surface infected 2 = 6-20% of leaf surface infected 3 = 21-50% of leaf surface infected 4 = 51-80% of leaf surface infected, some leaf necrosis 5 = 81-100% of leaf surface infected, marked leaf necrosis
ba
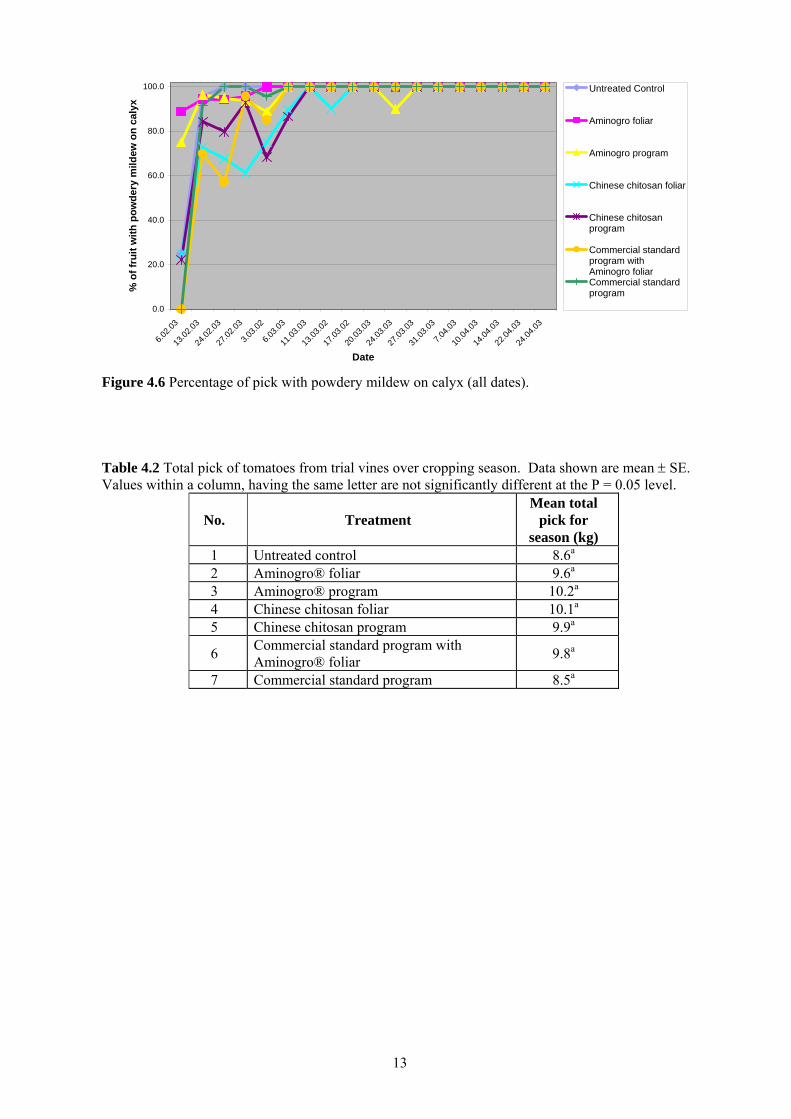
Figure 4.3 Views of powdery mildew on greenhouse tomatoes. Lesions on calyx (a) and lesions and necrosis on leaves (b). Results and Discussion By the time of first pick, all leaves in the untreated control plants were showing signs of powdery mildew disease. By the second pick, all leaves in the Aminogro® foliar plot were also showing signs of disease (Figure 4.4). The disease incidence increased in all other plots so that by two weeks after first pick, all assessed leaves in the trial had signs of powdery mildew disease. Disease severity increased most rapidly in the untreated control plots, followed by Aminogro® treated plots (Figure 4.5). By 13/03/03, all assessed leaves in the untreated control were showing signs of necrosis, and extensive infection. Disease severity increased most slowly in the plants treated with Chinese chitosan. The incidence of powdery mildew on the fruit calyx followed similar trends. By 11/03/03, all picked fruit had powdery mildew on the calyx except for fruit picked from the Chinese chitosan plots (Figure 4.6). Disease spread was delayed in the Chinese chitosan plots, but by 20/03/03 all fruit harvested from the trial area had powdery mildew on the calyx. Table 4.2 shows the total crop harvested from the trial vines during the season. When yields were calculated as a percentage increase over the commercial program, there was a 20% increase in yields from the Aminogro® program vines, and a 19% increase in yields from the Chinese chitosan foliar program vines (Figure 4.7). Analysis of variance did not show a significant difference in yields (Table 4.2) but statistical analysis of the trial is limited by the small sample size (one plant per replicate). The differences in yield results suggest a commercially significant difference, if the same results were achieved across a larger growing area.
11

The average weight of tomatoes harvested from all vines decreased over the season, with the size decrease most notable in the untreated control vines (Figure 4.8). Towards the end of the crop, fruit were generally larger on vines treated with Chinese chitosan. Fruit ripeness varied from week to week, depending on the pick of the previous week. There were no obvious trends in ripeness between the different treatments (Figure 4.9). Brix measurements were performed for all treatments for the first pick, and for selected treatments from the second pick (Table 4.3). It was decided not to continue with brix assessments (destructive assessment), because the results reflected the colour ripeness assessment. Brix levels were highest when there was a large portion of bright red ripe tomatoes in the sample, and lowest when there was a large portion of green tomatoes in the sample. There were no trends in chitinase activity related to treatments (Table 4.4). No phytotoxic effects were observed. Disease Incidence
0.0
10.0
20.0
30.0
40.0
50.0
60.0
70.0
80.0
90.0
100.0
21.01.03 28.01.03 4.02.03 12.02.03 24.02.03 13.03.03 31.03.03 10.04.03 24.04.03
Date
% o
f lea
flets
infe
cted
(15
leaf
lets
ass
esse
d)
Untreated Control
Aminogro foliar
Aminogro program
Chinese chitosan foliar
Chinese chitosan program
Commercial standardprogram with Aminogro foliar
Commercial standardprogram
Figure 4.4 Mean disease incidence (all dates).
Disease Severity
0.0
0.5
1.0
1.5
2.0
2.5
3.0
3.5
4.0
4.5
5.0
21.01.03 28.01.03 4.02.03 12.02.03 24.02.03 13.03.03 31.03.03 10.04.03 24.04.03
Date
Mea
n D
isea
se S
ever
ity(1
-5 s
cale
)
Untreated Control
Aminogro foliar
Aminogro program
Chinese chitosan foliar
Chinese chitosan program
Commercial standardprogram with Aminogro foliar
Commercial standardprogram
Figure 4.5 Mean disease severity (all dates).
12
0.0
20.0
40.0
60.0
80.0
100.0
6.02.0
3
13.02
.03
24.02
.03
27.02
.03
3.03.0
2
6.03.0
3
11.03
.03
13.03
.02
17.03
.02
20.03
.03
24.03
.03
27.03
.03
31.03
.03
7.04.0
3
10.04
.03
14.04
.03
22.04
.03
24.04
.03
Date
% o
f fru
it w
ith p
owde
ry m
ildew
on
caly
x
Untreated Control
Aminogro foliar
Aminogro program
Chinese chitosan foliar
Chinese chitosanprogram
Commercial standardprogram withAminogro foliarCommercial standardprogram
Figure 4.6 Percentage of pick with powdery mildew on calyx (all dates). Table 4.2 Total pick of tomatoes from trial vines over cropping season. Data shown are mean ± SE. Values within a column, having the same letter are not significantly different at the P = 0.05 level.
No. Treatment Mean total
pick for season (kg)
1 Untreated control 8.6a
2 Aminogro® foliar 9.6a
3 Aminogro® program 10.2a
4 Chinese chitosan foliar 10.1a
5 Chinese chitosan program 9.9a
6 Commercial standard program with Aminogro® foliar 9.8a
7 Commercial standard program 8.5a
13
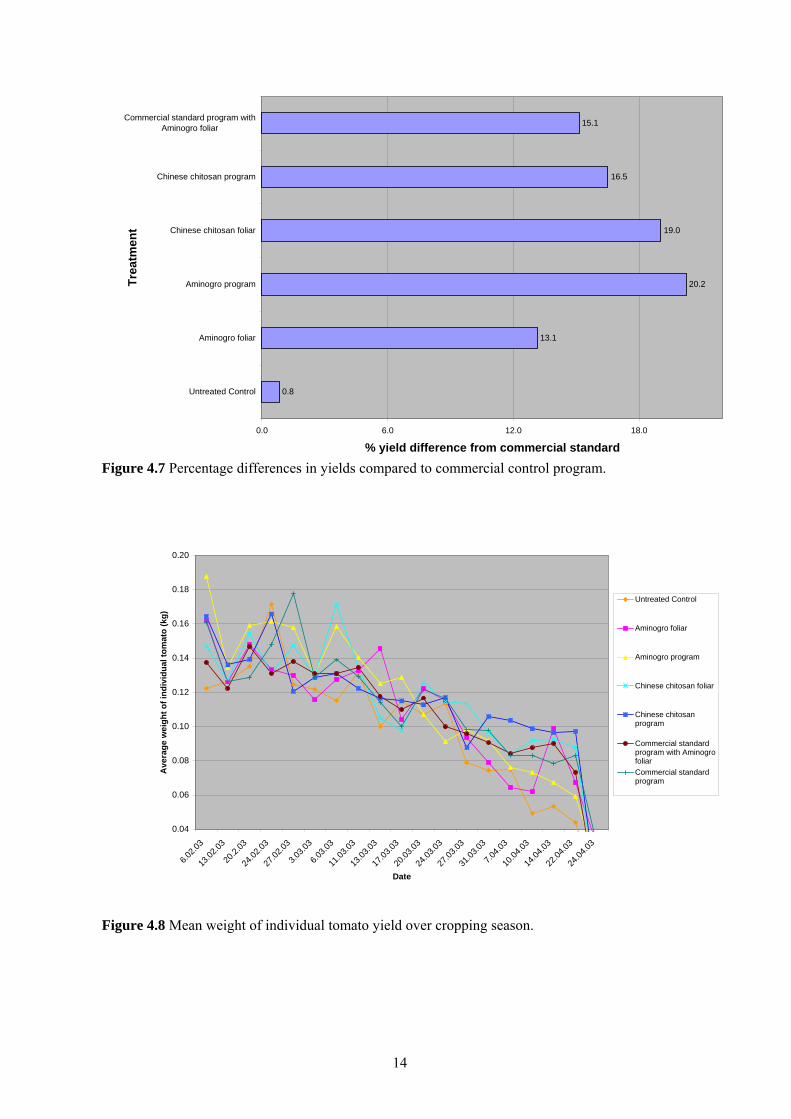
0.8
13.1
20.2
19.0
16.5
15.1
0.0 6.0 12.0 18.0
Untreated Control
Aminogro foliar
Aminogro program
Chinese chitosan foliar
Chinese chitosan program
Commercial standard program withAminogro foliar
Trea
tmen
t
% yield difference from commercial standard
Figure 4.7 Percentage differences in yields compared to commercial control program.
0.04
0.06
0.08
0.10
0.12
0.14
0.16
0.18
0.20
6.02.0
3
13.02
.03
20.2.
03
24.02
.03
27.02
.03
3.03.0
3
6.03.0
3
11.03
.03
13.03
.03
17.03
.03
20.03
.03
24.03
.03
27.03
.03
31.03
.03
7.04.0
3
10.04
.03
14.04
.03
22.04
.03
24.04
.03
Date
Ave
rage
wei
ght o
f ind
ivid
ual t
omat
o (k
g)
Untreated Control
Aminogro foliar
Aminogro program
Chinese chitosan foliar
Chinese chitosanprogram
Commercial standardprogram with AminogrofoliarCommercial standardprogram
Figure 4.8 Mean weight of individual tomato yield over cropping season.
14
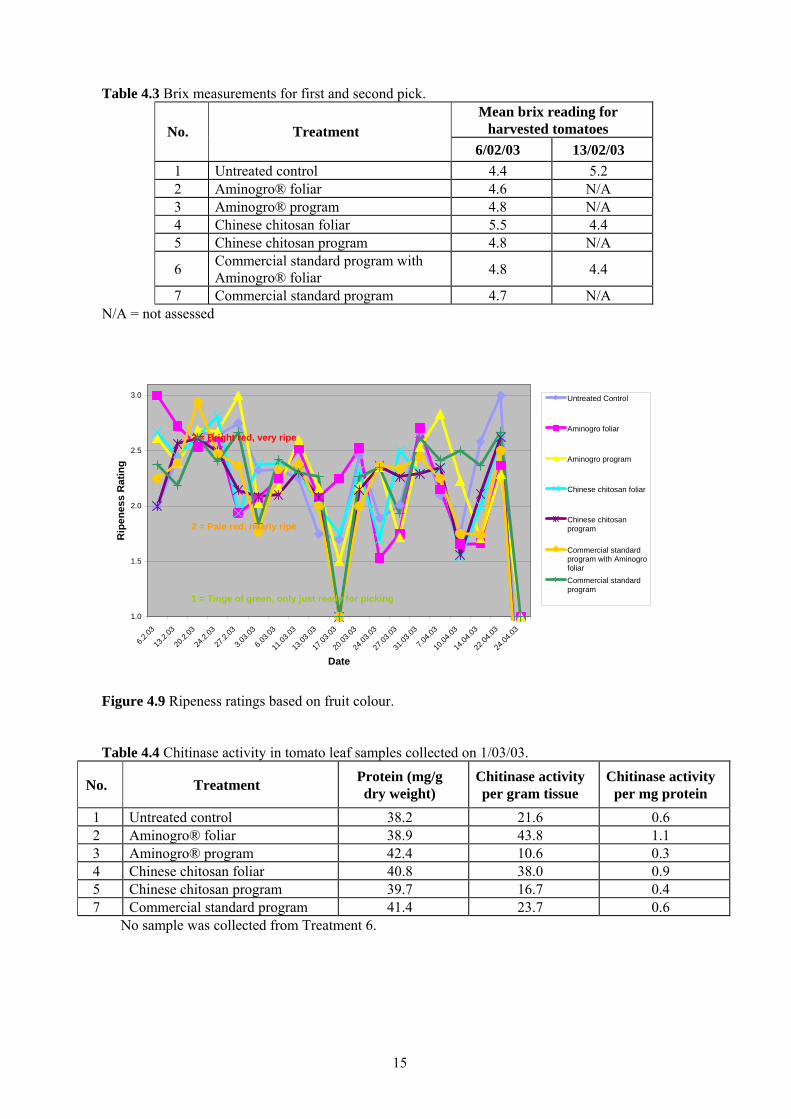
Table 4.3 Brix measurements for first and second pick.
Mean brix reading for harvested tomatoes No. Treatment
6/02/03 13/02/03 1 Untreated control 4.4 5.2 2 Aminogro® foliar 4.6 N/A 3 Aminogro® program 4.8 N/A 4 Chinese chitosan foliar 5.5 4.4 5 Chinese chitosan program 4.8 N/A
6 Commercial standard program with Aminogro® foliar 4.8 4.4
7 Commercial standard program 4.7 N/A N/A = not assessed
Figure 4.9 Ripeness ratings based on fruit colour.
1.0
1.5
2.0
2.5
3.0
6.2.03
13.2.
03
20.2.
03
24.2.
03
27.2.
03
3.03.0
3
6.03.0
3
11.03
.03
13.03
.03
17.03
.03
20.03
.03
24.03
.03
27.03
.03
31.03
.03
7.04.0
3
10.04
.03
14.04
.03
22.04
.03
24.04
.03
Date
Rip
enes
s R
atin
g
Untreated Control
Aminogro foliar
Aminogro program
Chinese chitosan foliar
Chinese chitosanprogram
Commercial standardprogram with AminogrofoliarCommercial standardprogram
3 = Bright red, very ripe
2 = Pale red, nearly ripe
1 = Tinge of green, only just ready for picking
Table 4.4 Chitinase activity in tomato leaf samples collected on 1/03/03.
No. Treatment Protein (mg/g dry weight)
Chitinase activity per gram tissue
Chitinase activity per mg protein
1 Untreated control 38.2 21.6 0.6 2 Aminogro® foliar 38.9 43.8 1.1 3 Aminogro® program 42.4 10.6 0.3 4 Chinese chitosan foliar 40.8 38.0 0.9 5 Chinese chitosan program 39.7 16.7 0.4 7 Commercial standard program 41.4 23.7 0.6
No sample was collected from Treatment 6.
15

Hydroponic dosing to conventional tomatoes Methods Following the promising results from the first trial, the growers were keen to trial chitosan as a drip treatment. Weekly dosing through the hydoponics system was an effective way of applying chitosan. Labour for weekly spraying in the greenhouse was a significant cost and drip application was a far more cost effective means of disease management. The trial area was one dosing section (750 m2, 1650 plants) which was equivalent to a quarter of the green house. The dosing section included mostly var. Cindel but also 10 rows of var. LaBelle. Aminogro® was applied to the dosing mix at 1 L/week starting immediately after transplanting and throughout crop growth. The Aminogro® manufacturer also recommended that Acadian (sea weed extract) be added to mix at 100 g/week. Trial design was a replicated completely randomised design with 30 replicates per treatment. Each replicate consisted of one planting basket which contained two plants. Baskets were selected randomly from trial area, and individual plants were tagged with plastic ribbon (Figure 4.10). As the vines grew, the plants had to be retagged several times through the cropping season. Picking commenced on 1/9/03 and plants were picked twice weekly until the final harvest on 19/01/04. At each harvest, the weight and number of fruit harvested from each basket was recorded. The number of fruit with powdery mildew on the calyx was recorded. Intensive assessments were only conducted for Cindel vines. Some disease assessments were done in LaBelle vines and samples were collected for chitinase analysis.
cba
Figure 4.10 Views of hydroponics dosing trial. Assessing yield from treated plants (a). Tagging of assessment plants (b). Severe powdery mildew infection during the final weeks of harvest (c). Results and Discussion There was no significant difference in yields from the chitosan treated and untreated sections of the greenhouse (Table 4.5). The pattern in yield fluctuations was generally the same for both treatments (Figure 4.11). A light pick generally alternated with a heavy pick, and the yield per pick decreased dramatically towards the end of the crop. The number of fruit with end rot was also recorded (data not presented). There was a clear difference between treatments, with the chitosan treated section of greenhouse having more end rot. End rot is a nutrient disorder related to calcium deficiency. The research team felt that the two dosing sections were not receiving equal nutrients, although the grower was confident they were. Nutrient uptake testing indicated lower calcium levels in the chitosan dosing section (data not shown). However, the petiole samples for nutrient testing were not collected until end rot was clearly visible in the crop and the grower had already increased the Ca levels to both dosing sections. In such a large scale trial it was hard to have control over all
16
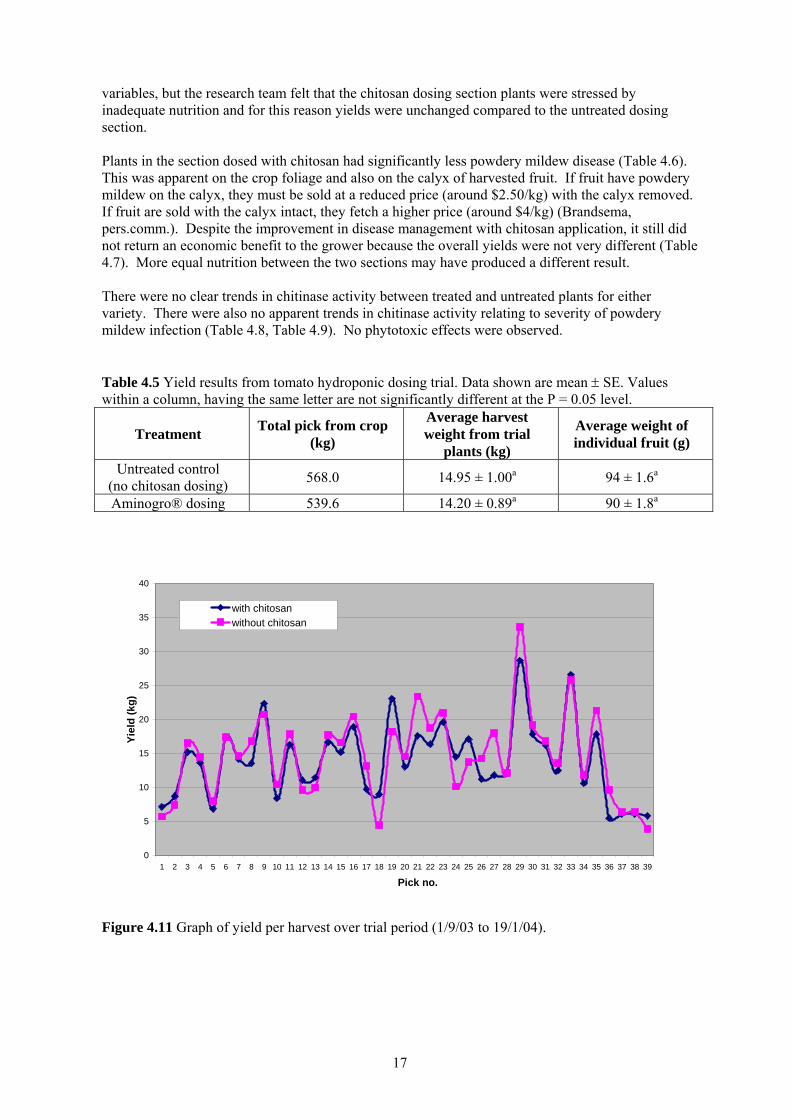
variables, but the research team felt that the chitosan dosing section plants were stressed by inadequate nutrition and for this reason yields were unchanged compared to the untreated dosing section. Plants in the section dosed with chitosan had significantly less powdery mildew disease (Table 4.6). This was apparent on the crop foliage and also on the calyx of harvested fruit. If fruit have powdery mildew on the calyx, they must be sold at a reduced price (around $2.50/kg) with the calyx removed. If fruit are sold with the calyx intact, they fetch a higher price (around $4/kg) (Brandsema, pers.comm.). Despite the improvement in disease management with chitosan application, it still did not return an economic benefit to the grower because the overall yields were not very different (Table 4.7). More equal nutrition between the two sections may have produced a different result. There were no clear trends in chitinase activity between treated and untreated plants for either variety. There were also no apparent trends in chitinase activity relating to severity of powdery mildew infection (Table 4.8, Table 4.9). No phytotoxic effects were observed. Table 4.5 Yield results from tomato hydroponic dosing trial. Data shown are mean ± SE. Values within a column, having the same letter are not significantly different at the P = 0.05 level.
Treatment Total pick from crop (kg)
Average harvest weight from trial
plants (kg)
Average weight of individual fruit (g)
Untreated control (no chitosan dosing) 568.0 14.95 ± 1.00a 94 ± 1.6a
Aminogro® dosing 539.6 14.20 ± 0.89a 90 ± 1.8a
0
5
10
15
20
25
30
35
40
1 2 3 4 5 6 7 8 9 10 11 12 13 14 15 16 17 18 19 20 21 22 23 24 25 26 27 28 29 30 31 32 33 34 35 36 37 38 39
Pick no.
Yiel
d (k
g)
with chitosanwithout chitosan
Figure 4.11 Graph of yield per harvest over trial period (1/9/03 to 19/1/04).
17
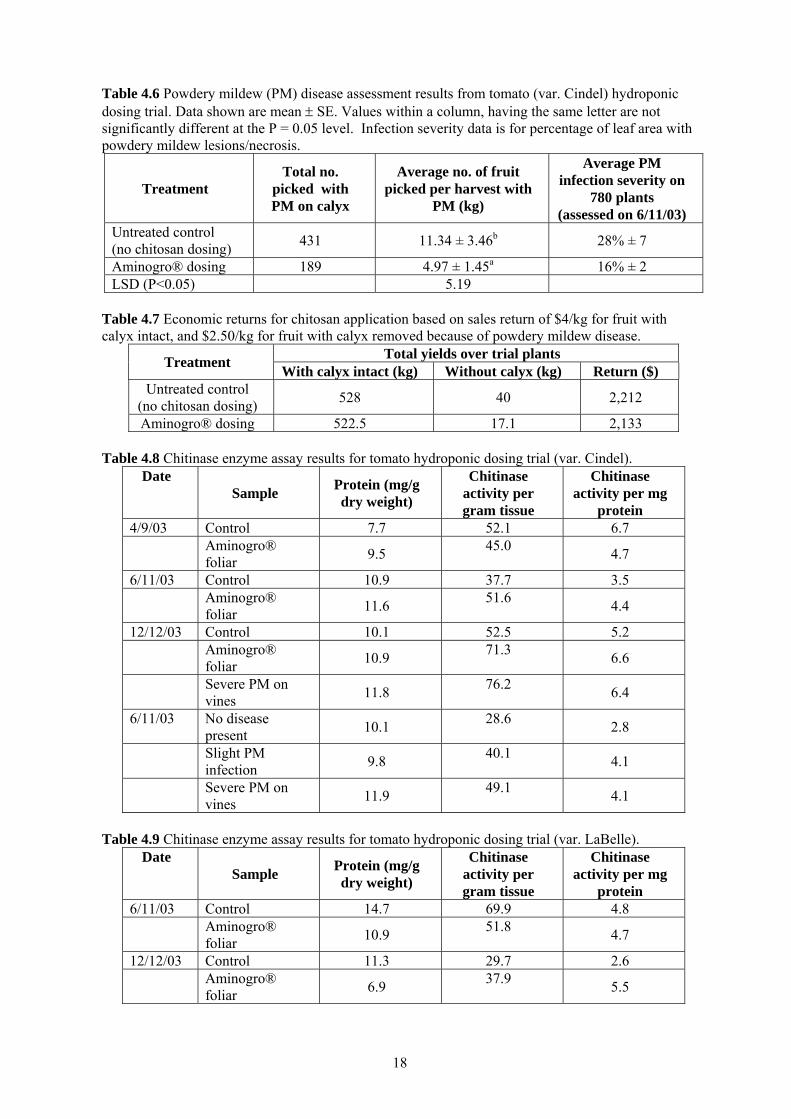
Table 4.6 Powdery mildew (PM) disease assessment results from tomato (var. Cindel) hydroponic dosing trial. Data shown are mean ± SE. Values within a column, having the same letter are not significantly different at the P = 0.05 level. Infection severity data is for percentage of leaf area with powdery mildew lesions/necrosis.
Treatment Total no.
picked with PM on calyx
Average no. of fruit picked per harvest with
PM (kg)
Average PM infection severity on
780 plants (assessed on 6/11/03)
Untreated control (no chitosan dosing) 431 11.34 ± 3.46b 28% ± 7
Aminogro® dosing 189 4.97 ± 1.45a 16% ± 2 LSD (P<0.05) 5.19
Table 4.7 Economic returns for chitosan application based on sales return of $4/kg for fruit with calyx intact, and $2.50/kg for fruit with calyx removed because of powdery mildew disease.
Total yields over trial plants Treatment With calyx intact (kg) Without calyx (kg) Return ($) Untreated control
(no chitosan dosing) 528 40 2,212
Aminogro® dosing 522.5 17.1 2,133 Table 4.8 Chitinase enzyme assay results for tomato hydroponic dosing trial (var. Cindel).
Date Sample Protein (mg/g
dry weight)
Chitinase activity per gram tissue
Chitinase activity per mg
protein 4/9/03 Control 7.7 52.1 6.7 Aminogro®
foliar 9.5 45.0 4.7
6/11/03 Control 10.9 37.7 3.5 Aminogro®
foliar 11.6 51.6 4.4
12/12/03 Control 10.1 52.5 5.2 Aminogro®
foliar 10.9 71.3 6.6
Severe PM on vines 11.8 76.2 6.4
6/11/03 No disease present 10.1 28.6 2.8
Slight PM infection 9.8 40.1 4.1
Severe PM on vines 11.9 49.1 4.1
Table 4.9 Chitinase enzyme assay results for tomato hydroponic dosing trial (var. LaBelle).
Date Sample Protein (mg/g
dry weight)
Chitinase activity per gram tissue
Chitinase activity per mg
protein 6/11/03 Control 14.7 69.9 4.8 Aminogro®
foliar 10.9 51.8 4.7
12/12/03 Control 11.3 29.7 2.6 Aminogro®
foliar 6.9 37.9 5.5
18

Foliar application to organic tomatoes Methods Two greenhouse tomato (var. Tommy Toe) trials were commenced at Yorktown Organics, a certified organic farm at Yorktown, northern Tasmania. Tomatoes were grown as per National Association of Sustainable Agricutlure Australia Limited (NASAA) certification standards in raised beds, enriched with compost, kelp and blood and bone. Both trials were sprayed on a 10-14 day schedule, starting one day after transplanting to the main growing house. Plants were sprayed to run-off using a manually pressurised sprayer fitted with a hand lance. Aminogro® chitosan was applied at 10 mL/L and Synertrol Horti Oil at 2.5 mL/L. Trial design was a replicated complete block design with 4 replicates and 4 plants per replicate. Harvest of tomatoes for Trial 1 (Figure 4.12) commenced on 27/05/03 and continued weekly until 8/07/03. At each harvest, the weight and number of fruit harvested from each vine was recorded. The number of fruit with powdery mildew on the calyx was recorded. Trial 2 commenced in October 2003, but had to be abandoned prior to the start of harvest because of multiple confounding factors. The establishment of the transplants was very uneven, and almost 50% of plants in the trial had signs of physiological disorders including aerial roots, stem splits and growth distortions (Figure 4.13). These factors would have determined yield results to a far greater degree than chitosan application. There was severe powdery mildew infection in the trial plants, but there was no difference in the severity of plants between those treated with chitosan and untreated plants.
ba
Figure 4.12 Views of organic greenhouse tomato trial (Trial 1). Flowering plants (a) and mature vines at harvest (b).
19
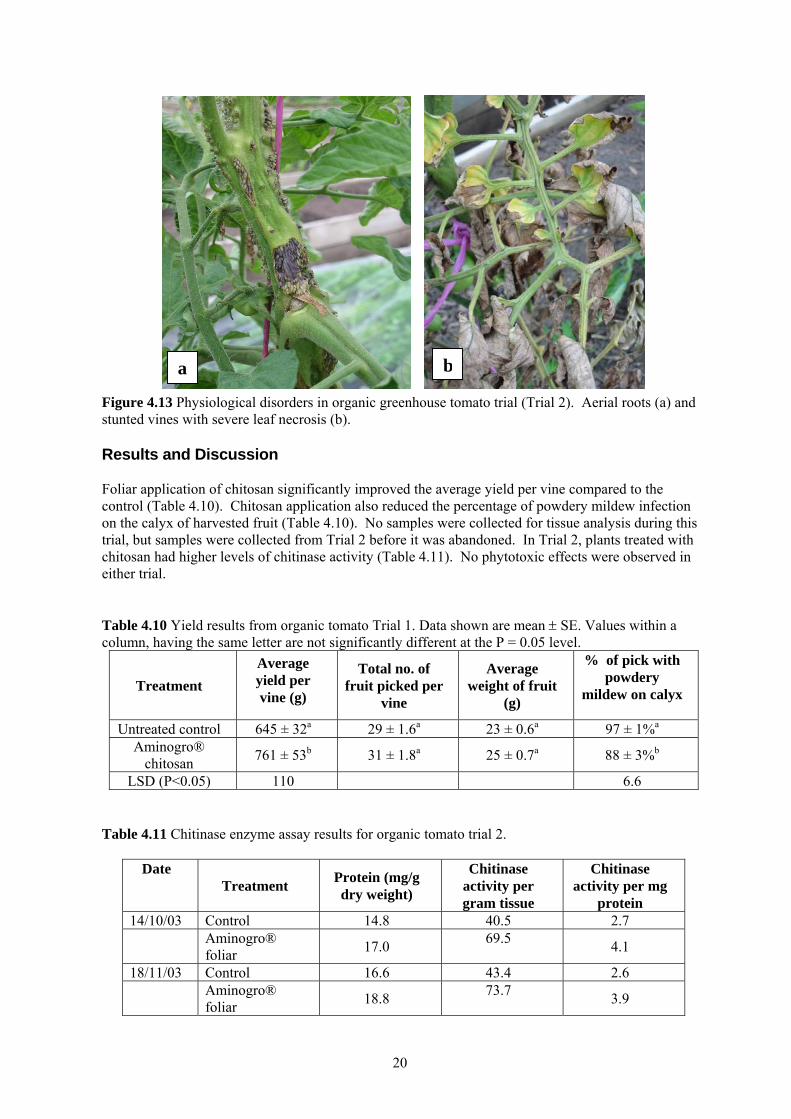
Figure 4 3 Physiological disorders in organic greenhouse tomato trial (Trial 2). Aerial roots (a) and stunted v
a b
Results Foliar apcontrol (Ton the catrial, but chitosan heither tria Table 4.1column, h
Tre
UntreaAm
chLSD
Table 4.1
Da
14/1
18/1
.1
ines with severe leaf necrosis (b).
and Discussion
plication of chitosan significantly improved the average yield per vine compared to the able 4.10). Chitosan application also reduced the percentage of powdery mildew infection
lyx of harvested fruit (Table 4.10). No samples were collected for tissue analysis during this samples were collected from Trial 2 before it was abandoned. In Trial 2, plants treated with ad higher levels of chitinase activity (Table 4.11). No phytotoxic effects were observed in l.
0 Yield results from organic tomato Trial 1. Data shown are mean ± SE. Values within a aving the same letter are not significantly different at the P = 0.05 level.
atment Average yield per vine (g)
Total no. of fruit picked per
vine
Average weight of fruit
(g)
% of pick with powdery
mildew on calyx
ted control 645 ± 32a 29 ± 1.6a 23 ± 0.6a 97 ± 1%a
inogro® itosan 761 ± 53b 31 ± 1.8a 25 ± 0.7a 88 ± 3%b
(P<0.05) 110 6.6
1 Chitinase enzyme assay results for organic tomato trial 2.
te Treatment Protein (mg/g
dry weight)
Chitinase activity per gram tissue
Chitinase activity per mg
protein 0/03 Control 14.8 40.5 2.7
Aminogro® foliar 17.0 69.5 4.1
1/03 Control 16.6 43.4 2.6 Aminogro® foliar 18.8 73.7 3.9
20
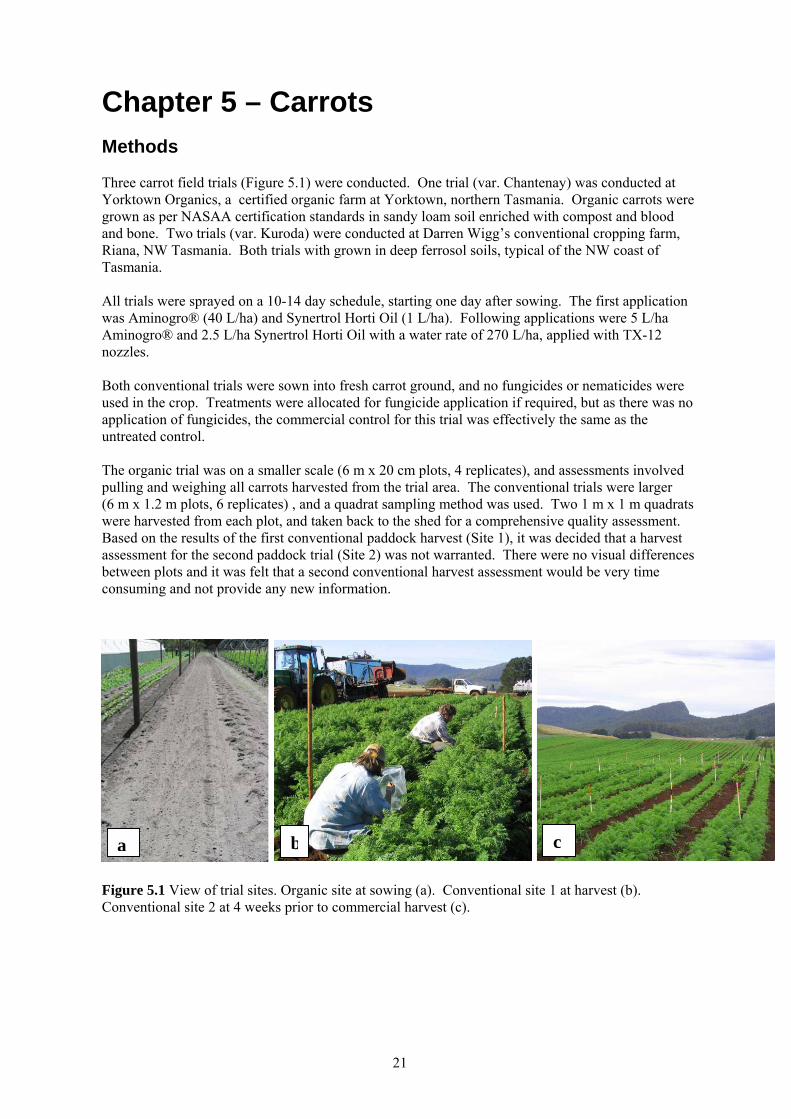
Chapter 5 – Carrots Methods Three carrot field trials (Figure 5.1) were conducted. One trial (var. Chantenay) was conducted at Yorktown Organics, a certified organic farm at Yorktown, northern Tasmania. Organic carrots were grown as per NASAA certification standards in sandy loam soil enriched with compost and blood and bone. Two trials (var. Kuroda) were conducted at Darren Wigg’s conventional cropping farm, Riana, NW Tasmania. Both trials with grown in deep ferrosol soils, typical of the NW coast of Tasmania. All trials were sprayed on a 10-14 day schedule, starting one day after sowing. The first application was Aminogro® (40 L/ha) and Synertrol Horti Oil (1 L/ha). Following applications were 5 L/ha Aminogro® and 2.5 L/ha Synertrol Horti Oil with a water rate of 270 L/ha, applied with TX-12 nozzles. Both conventional trials were sown into fresh carrot ground, and no fungicides or nematicides were used in the crop. Treatments were allocated for fungicide application if required, but as there was no application of fungicides, the commercial control for this trial was effectively the same as the untreated control. The organic trial was on a smaller scale (6 m x 20 cm plots, 4 replicates), and assessments involved pulling and weighing all carrots harvested from the trial area. The conventional trials were larger (6 m x 1.2 m plots, 6 replicates) , and a quadrat sampling method was used. Two 1 m x 1 m quadrats were harvested from each plot, and taken back to the shed for a comprehensive quality assessment. Based on the results of the first conventional paddock harvest (Site 1), it was decided that a harvest assessment for the second paddock trial (Site 2) was not warranted. There were no visual differences between plots and it was felt that a second conventional harvest assessment would be very time consuming and not provide any new information.
c ba Figure 5.1 View of trial sites. Organic site at sowing (a). Conventional site 1 at harvest (b). Conventional site 2 at 4 weeks prior to commercial harvest (c).
21

Results and Discussion No differences in crop establishment or growth of tops were observed in any of the trials. No phytotoxicity was observed in any of the trials. There was no significant difference between treatments in the organic carrot trial. For both treatments, there was no difference in total yield harvested or in average weight of individual carrots (Table 5.1). Quality assessments for the conventional trial showed no difference between treatments (Table 5.2). Chitosan applications did not improve yield of carrots (Table 5.3). Table 5.1 Yield data from organic carrot trial. Data shown are mean ± SE. Values within a column, having the same letter are not significantly different at the P = 0.05 level.
Treatment Total weight of harvested carrots (g)
Total no. of carrots harvested
Average weight of carrots harvested (g)
Commercial control 10432 (± 791)a 258 (± 15)a 41 (± 2)a
Chitosan treated 10700 (± 2007)a 256 (± 53)a 43 (± 3)a
Table 5.2 Quality assessment data from conventional carrot trial (Site 1).
Treatment
Cra
cks
Mis
shap
en
Fork
ed
Cav
ity S
pot
Nod
ules
Cro
wn
Rot
Split
ting
Und
ersi
zed
Bac
teri
al R
ot
Bol
ters
Scab
Inse
ct D
amag
e
Untreated control 0.1
0.2
0.0
0.1
0.0
0.3
0.2 0.0 0.0 0.2 0.2 0.
0
Chitosan treated 0.2
0.4
0.3
0.1
0.0
0.5
0.1 0.1 0.0 0.4 0.1 0.
0
Commercial standard 0.1
0.5
0.2
0.3
0.0
0.2
0.2 0.0 0.0 0.3 0.1 0.
2 Table 5.3 Quality assessment data from conventional carrot trial (Site 1). Data shown are mean ± SE. Values within a column, having the same letter are not significantly different at the P = 0.05 level.
Treatment
Marketable weight from
harvest quadrats (kg)
Total weight from harvest quadrats (kg)
% Marketable
Untreated control 17.9 (± 0.5)a 19.2 (± 0.5)a 93 (± 0.8)a
Chitosan treated 16.7 (± 0.3)ab 18.8 (± 0.4)a 89 (± 1.3)b
Commercial standard 15.9 (± 0.5)b 18.0 (± 0.4)a 88 (± 1.1)b
LSD (P<0.05) 1.29 4.2
22
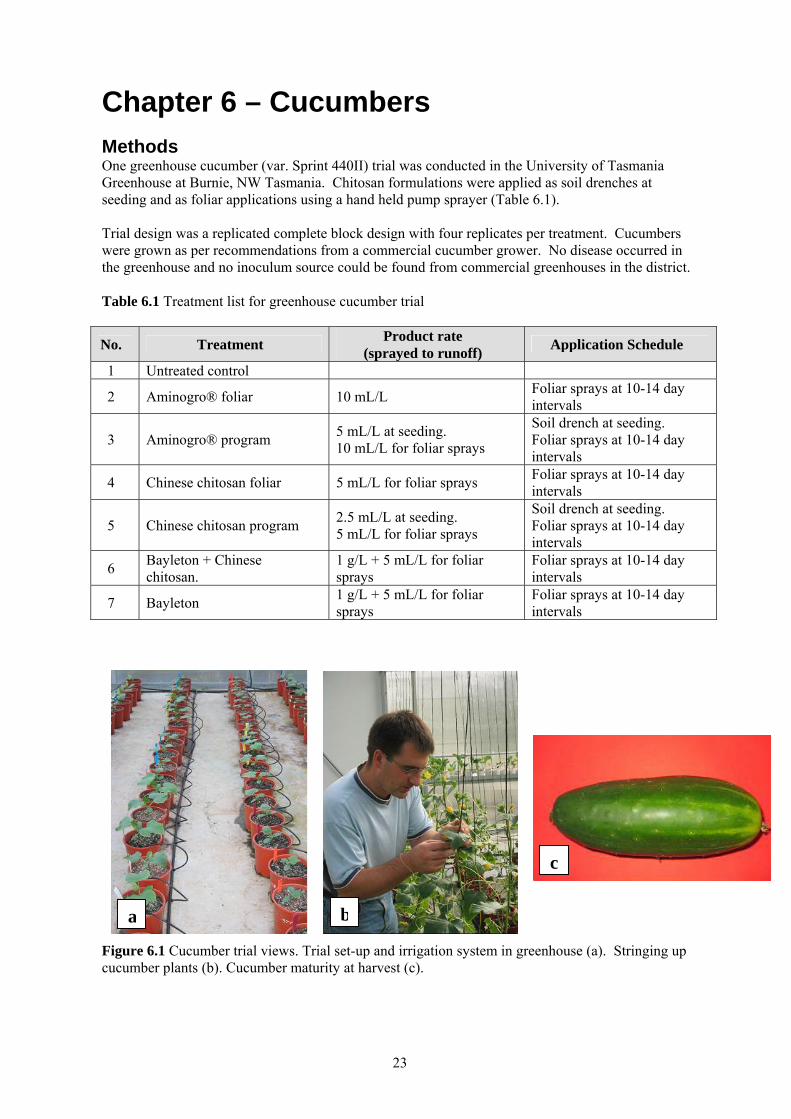
Chapter 6 – Cucumbers Methods One greenhouse cucumber (var. Sprint 440II) trial was conducted in the University of Tasmania Greenhouse at Burnie, NW Tasmania. Chitosan formulations were applied as soil drenches at seeding and as foliar applications using a hand held pump sprayer (Table 6.1). Trial design was a replicated complete block design with four replicates per treatment. Cucumbers were grown as per recommendations from a commercial cucumber grower. No disease occurred in the greenhouse and no inoculum source could be found from commercial greenhouses in the district. Table 6.1 Treatment list for greenhouse cucumber trial
No. Treatment Product rate (sprayed to runoff) Application Schedule
1 Untreated control
2 Aminogro® foliar 10 mL/L Foliar sprays at 10-14 day intervals
3 Aminogro® program 5 mL/L at seeding. 10 mL/L for foliar sprays
Soil drench at seeding. Foliar sprays at 10-14 day intervals
4 Chinese chitosan foliar 5 mL/L for foliar sprays Foliar sprays at 10-14 day intervals
5 Chinese chitosan program 2.5 mL/L at seeding. 5 mL/L for foliar sprays
Soil drench at seeding. Foliar sprays at 10-14 day intervals
6 Bayleton + Chinese chitosan.
1 g/L + 5 mL/L for foliar sprays
Foliar sprays at 10-14 day intervals
7 Bayleton 1 g/L + 5 mL/L for foliar sprays
Foliar sprays at 10-14 day intervals
a b
c
Figure 6.1 Cucumber trial views. Trial set-up and irrigation system in greenhouse (a). Stringing up cucumber plants (b). Cucumber maturity at harvest (c).
23
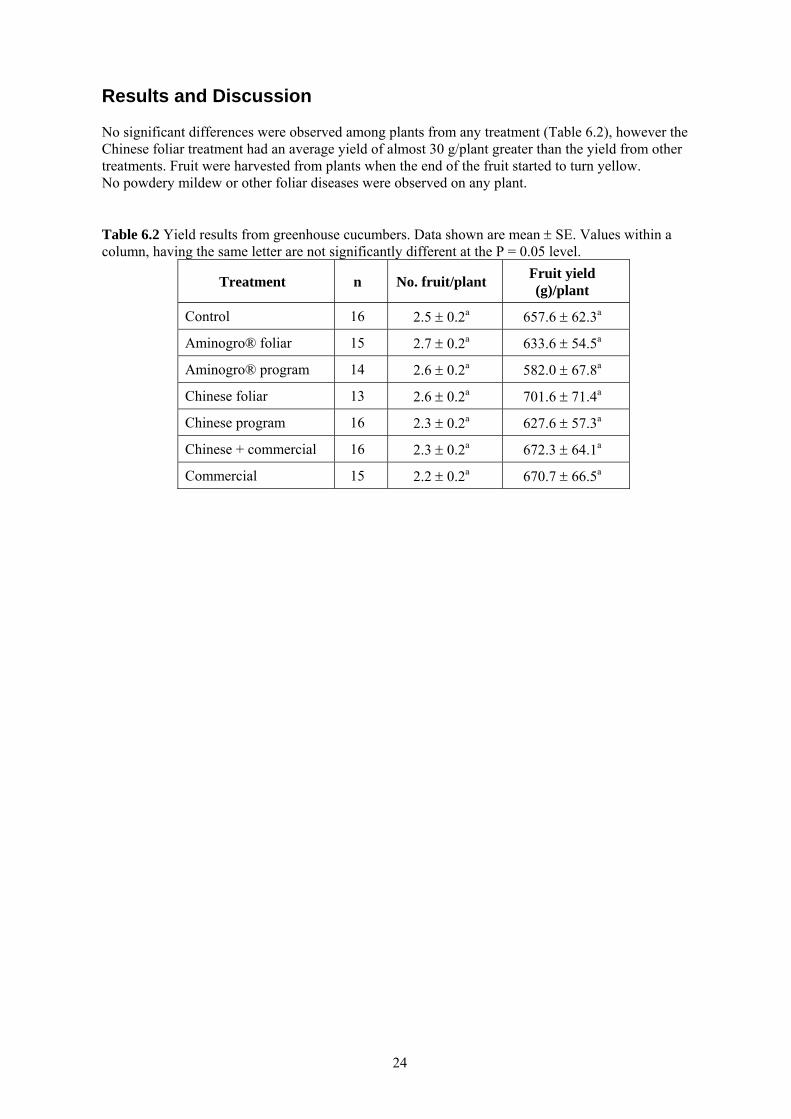
Results and Discussion No significant differences were observed among plants from any treatment (Table 6.2), however the Chinese foliar treatment had an average yield of almost 30 g/plant greater than the yield from other treatments. Fruit were harvested from plants when the end of the fruit started to turn yellow. No powdery mildew or other foliar diseases were observed on any plant. Table 6.2 Yield results from greenhouse cucumbers. Data shown are mean ± SE. Values within a column, having the same letter are not significantly different at the P = 0.05 level.
Treatment n No. fruit/plant Fruit yield (g)/plant
Control 16 2.5 ± 0.2a 657.6 ± 62.3a
Aminogro® foliar 15 2.7 ± 0.2a 633.6 ± 54.5a
Aminogro® program 14 2.6 ± 0.2a 582.0 ± 67.8a
Chinese foliar 13 2.6 ± 0.2a 701.6 ± 71.4a
Chinese program 16 2.3 ± 0.2a 627.6 ± 57.3a
Chinese + commercial 16 2.3 ± 0.2a 672.3 ± 64.1a
Commercial 15 2.2 ± 0.2a 670.7 ± 66.5a
24
Chapter 7 – Peas Methods One pea (var. Resal) trial was conducted in the University of Tasmania Greenhouse at Burnie, NW Tasmania. Chitosan formulations were applied as soil drenches at seeding and as foliar applications using a hand held pump sprayer (Table 7.1). Trial design was a replicated complete block design with four replicates per treatment, and 16 plants per plot. Table 7.1 Treatment list for greenhouse pea trial
No. Treatment Product rate (sprayed to runoff) Application Schedule
1 Untreated control
2 Aminogro® foliar 10 mL/L Foliar sprays at 10-14 day intervals
3 Aminogro® program 5 mL/L at seeding. 10 mL/L for foliar sprays
Soil drench at seeding. Foliar sprays at 10-14 day intervals
4 Chinese chitosan foliar 5 mL/L for foliar sprays Foliar sprays at 10-14 day intervals
5 Chinese chitosan program 2.5 mL/L at seeding. 5 mL/L for foliar sprays
Soil drench at seeding. Foliar sprays at 10-14 day intervals
6 Bayleton + Chinese chitosan.
1 g/L + 5 mL/L for foliar sprays
Foliar sprays at 10-14 day intervals
7 Bayleton 1 g/L + 5 mL/L for foliar sprays
Foliar sprays at 10-14 day intervals
a
b
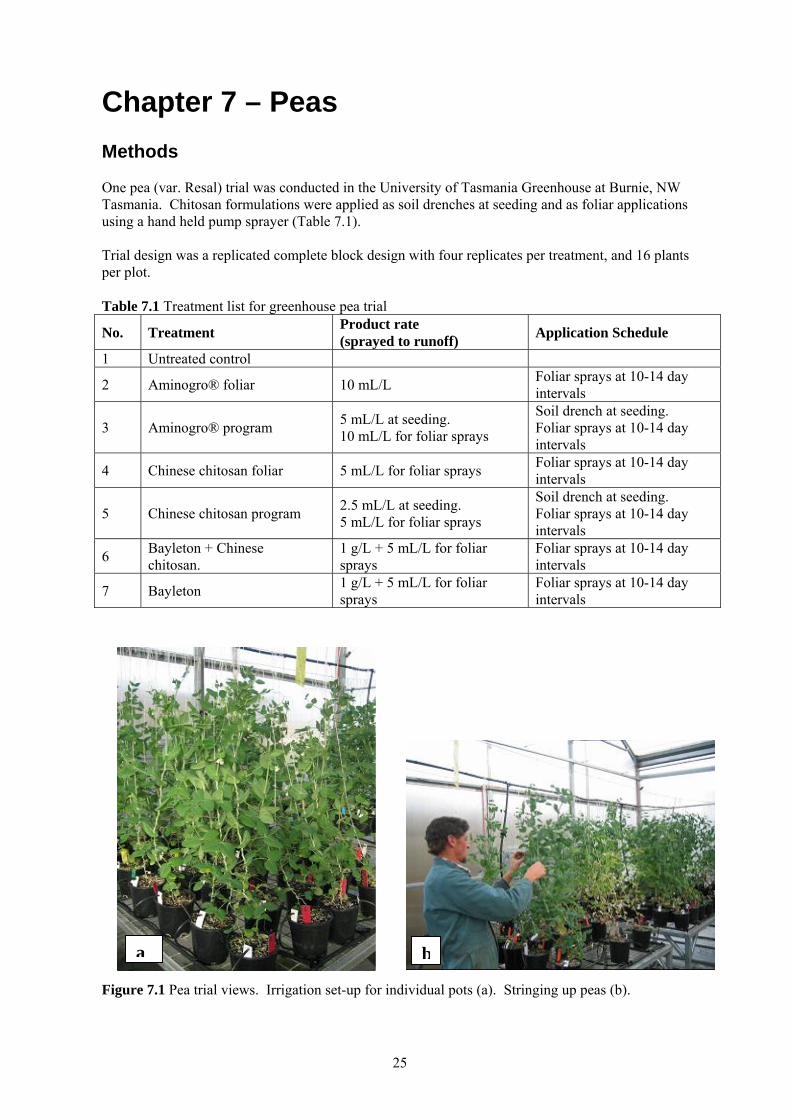
Figure 7.1 Pea trial views. Irrigation set-up for individual pots (a). Stringing up peas (b).
25

Results and Discussion No significant differences were observed among plants from any treatment (Table 7.2), although plants from the Aminogro® program, Chinese + commercial and Commercial treatments had slightly higher yields than plants from other treatments. No powdery mildew or other foliar diseases were observed on any plant during Autumn 2003 in the University of Tasmania (Burnie) greenhouse. Table 7.2 Yield results from greenhouse peas. Data shown are mean ± SE. Values within a column, having the same letter are not significantly different at the P = 0.05 level.
Treatment n No. pods/plant Pea yield (g)/plant
Control 15 4.4 ± 0.6 a 13.2 ± 1.7 a
Aminogro® foliar 16 4.3 ± 0.5 a 13.6 ± 1.6 a
Aminogro® program 9 5.8 ± 1.0 a 17.9 ± 3.2 a
Chinese foliar 13 4.5 ± 0.6 a 13.7 ± 2.4 a
Chinese program 15 4.6 ± 0.7 a 14.4 ± 2.2 a
Chinese + commercial 13 5.8 ± 0.7 a 18.2 ± 2.3 a
Commercial 12 5.2 ± 0.6 a 16.8 ± 1.8 a
26
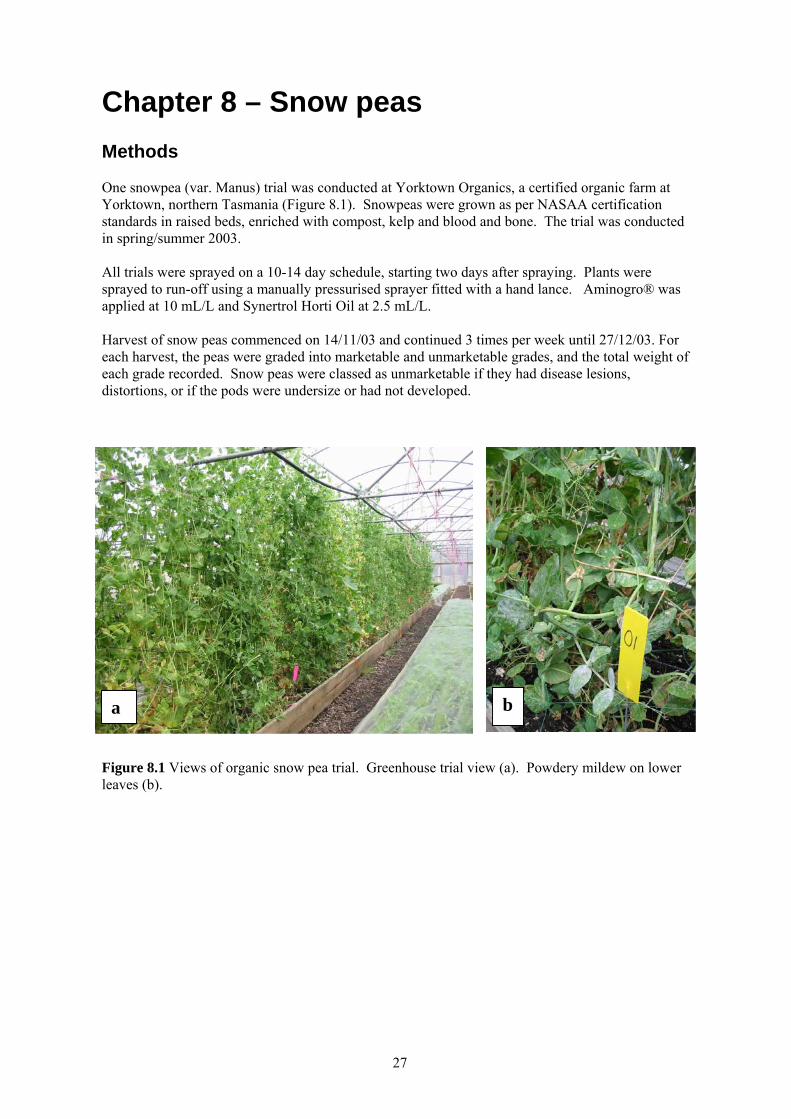
Chapter 8 – Snow peas Methods One snowpea (var. Manus) trial was conducted at Yorktown Organics, a certified organic farm at Yorktown, northern Tasmania (Figure 8.1). Snowpeas were grown as per NASAA certification standards in raised beds, enriched with compost, kelp and blood and bone. The trial was conducted in spring/summer 2003. All trials were sprayed on a 10-14 day schedule, starting two days after spraying. Plants were sprayed to run-off using a manually pressurised sprayer fitted with a hand lance. Aminogro® was applied at 10 mL/L and Synertrol Horti Oil at 2.5 mL/L. Harvest of snow peas commenced on 14/11/03 and continued 3 times per week until 27/12/03. For each harvest, the peas were graded into marketable and unmarketable grades, and the total weight of each grade recorded. Snow peas were classed as unmarketable if they had disease lesions, distortions, or if the pods were undersize or had not developed.
a b
Figure 8.1 Views of organic snow pea trial. Greenhouse trial view (a). Powdery mildew on lower leaves (b).
27
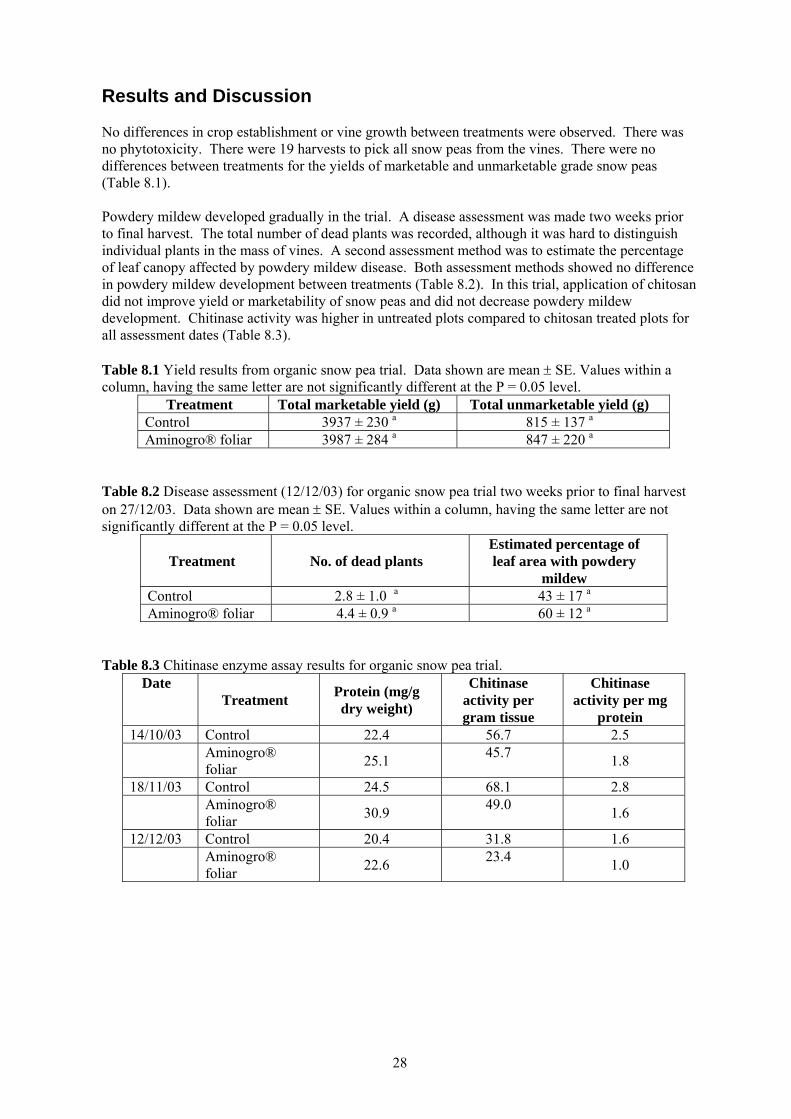
Results and Discussion No differences in crop establishment or vine growth between treatments were observed. There was no phytotoxicity. There were 19 harvests to pick all snow peas from the vines. There were no differences between treatments for the yields of marketable and unmarketable grade snow peas (Table 8.1). Powdery mildew developed gradually in the trial. A disease assessment was made two weeks prior to final harvest. The total number of dead plants was recorded, although it was hard to distinguish individual plants in the mass of vines. A second assessment method was to estimate the percentage of leaf canopy affected by powdery mildew disease. Both assessment methods showed no difference in powdery mildew development between treatments (Table 8.2). In this trial, application of chitosan did not improve yield or marketability of snow peas and did not decrease powdery mildew development. Chitinase activity was higher in untreated plots compared to chitosan treated plots for all assessment dates (Table 8.3). Table 8.1 Yield results from organic snow pea trial. Data shown are mean ± SE. Values within a column, having the same letter are not significantly different at the P = 0.05 level.
Treatment Total marketable yield (g) Total unmarketable yield (g) Control 3937 ± 230 a 815 ± 137 a
Aminogro® foliar 3987 ± 284 a 847 ± 220 a
Table 8.2 Disease assessment (12/12/03) for organic snow pea trial two weeks prior to final harvest on 27/12/03. Data shown are mean ± SE. Values within a column, having the same letter are not significantly different at the P = 0.05 level.
Treatment No. of dead plants Estimated percentage of leaf area with powdery
mildew Control 2.8 ± 1.0 a 43 ± 17 a
Aminogro® foliar 4.4 ± 0.9 a 60 ± 12 a
Table 8.3 Chitinase enzyme assay results for organic snow pea trial.
Date Treatment Protein (mg/g
dry weight)
Chitinase activity per gram tissue
Chitinase activity per mg
protein 14/10/03 Control 22.4 56.7 2.5 Aminogro®
foliar 25.1 45.7 1.8
18/11/03 Control 24.5 68.1 2.8 Aminogro®
foliar 30.9 49.0 1.6
12/12/03 Control 20.4 31.8 1.6 Aminogro®
foliar 22.6 23.4 1.0
28
Chapter 9 – Capsicums Methods One capsicum trial was conducted at Yorktown Organics, a certified organic farm at Yorktown, northern Tasmania (Figure 9.1). Capsicums were grown as per NASAA certification standards in sandy loam soil, enriched with compost and blood and bone. The trial was conducted in summer 2003. The trial was a completely randomised design with 14 individual plant replicates per treatment. The trial was sprayed on a 10-14 day schedule, starting five days after planting of transplants. Plants were sprayed to run-off using a manually pressurised sprayer fitted with a hand lance. Aminogro® was applied at 10 mL/L mixed with Synertrol Horti Oil at 2.5 mL/L. Harvest of capsicums commenced on 3/01/04 and continued 2 times per week until 7/03/04. For each harvest, the total weight and number of capsicums picked was recorded.
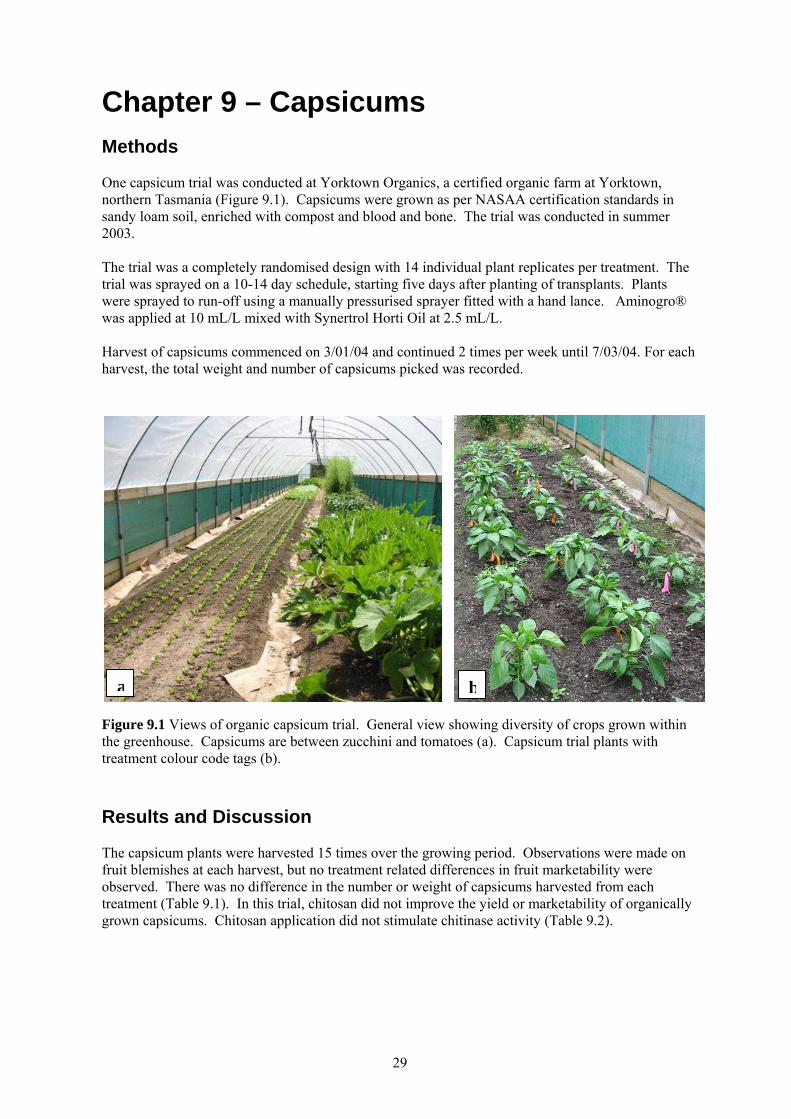
ba
Figure 9.1 Views of organic capsicum trial. General view showing diversity of crops grown within the greenhouse. Capsicums are between zucchini and tomatoes (a). Capsicum trial plants with treatment colour code tags (b). Results and Discussion The capsicum plants were harvested 15 times over the growing period. Observations were made on fruit blemishes at each harvest, but no treatment related differences in fruit marketability were observed. There was no difference in the number or weight of capsicums harvested from each treatment (Table 9.1). In this trial, chitosan did not improve the yield or marketability of organically grown capsicums. Chitosan application did not stimulate chitinase activity (Table 9.2).
29
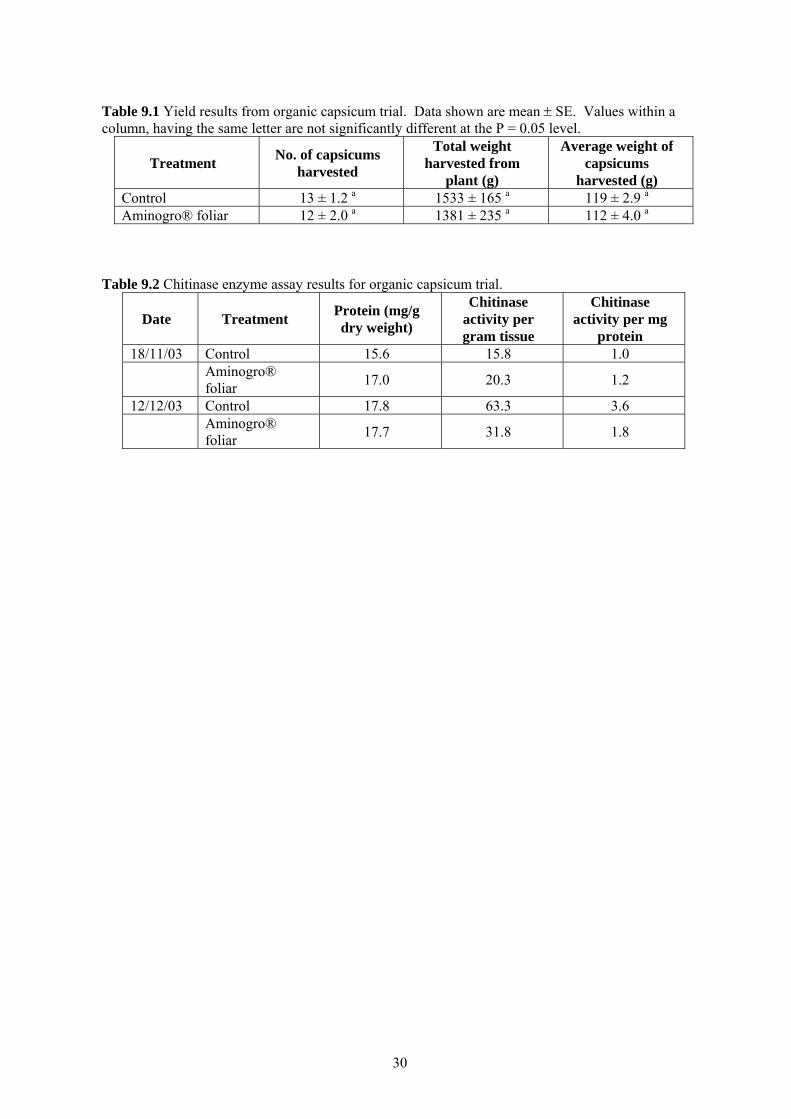
Table 9.1 Yield results from organic capsicum trial. Data shown are mean ± SE. Values within a column, having the same letter are not significantly different at the P = 0.05 level.
Treatment No. of capsicums harvested
Total weight harvested from
plant (g)
Average weight of capsicums
harvested (g) Control 13 ± 1.2 a 1533 ± 165 a 119 ± 2.9 a
Aminogro® foliar 12 ± 2.0 a 1381 ± 235 a 112 ± 4.0 a
Table 9.2 Chitinase enzyme assay results for organic capsicum trial.
Date Treatment Protein (mg/g dry weight)
Chitinase activity per gram tissue
Chitinase activity per mg
protein 18/11/03 Control 15.6 15.8 1.0
Aminogro® foliar 17.0 20.3 1.2
12/12/03 Control 17.8 63.3 3.6
Aminogro® foliar 17.7 31.8 1.8
30
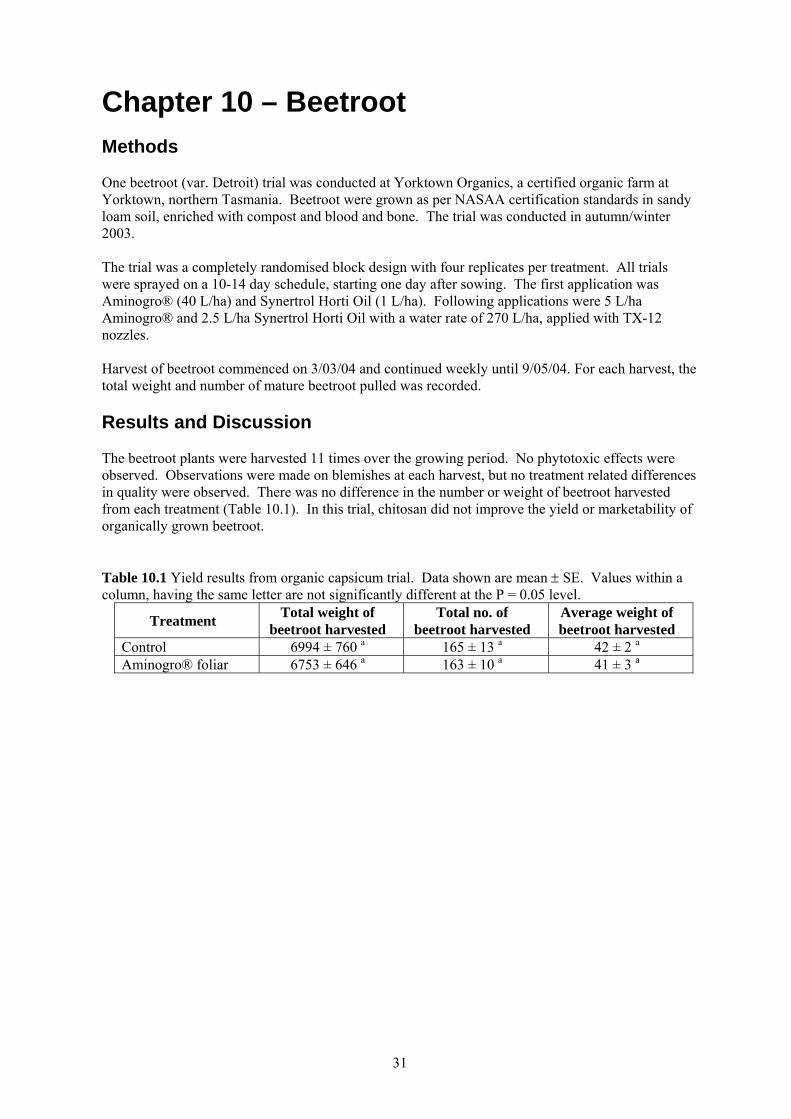
Chapter 10 – Beetroot Methods One beetroot (var. Detroit) trial was conducted at Yorktown Organics, a certified organic farm at Yorktown, northern Tasmania. Beetroot were grown as per NASAA certification standards in sandy loam soil, enriched with compost and blood and bone. The trial was conducted in autumn/winter 2003. The trial was a completely randomised block design with four replicates per treatment. All trials were sprayed on a 10-14 day schedule, starting one day after sowing. The first application was Aminogro® (40 L/ha) and Synertrol Horti Oil (1 L/ha). Following applications were 5 L/ha Aminogro® and 2.5 L/ha Synertrol Horti Oil with a water rate of 270 L/ha, applied with TX-12 nozzles. Harvest of beetroot commenced on 3/03/04 and continued weekly until 9/05/04. For each harvest, the total weight and number of mature beetroot pulled was recorded. Results and Discussion The beetroot plants were harvested 11 times over the growing period. No phytotoxic effects were observed. Observations were made on blemishes at each harvest, but no treatment related differences in quality were observed. There was no difference in the number or weight of beetroot harvested from each treatment (Table 10.1). In this trial, chitosan did not improve the yield or marketability of organically grown beetroot. Table 10.1 Yield results from organic capsicum trial. Data shown are mean ± SE. Values within a column, having the same letter are not significantly different at the P = 0.05 level.
Treatment Total weight of beetroot harvested
Total no. of beetroot harvested
Average weight of beetroot harvested
Control 6994 ± 760 a 165 ± 13 a 42 ± 2 a
Aminogro® foliar 6753 ± 646 a 163 ± 10 a 41 ± 3 a
31
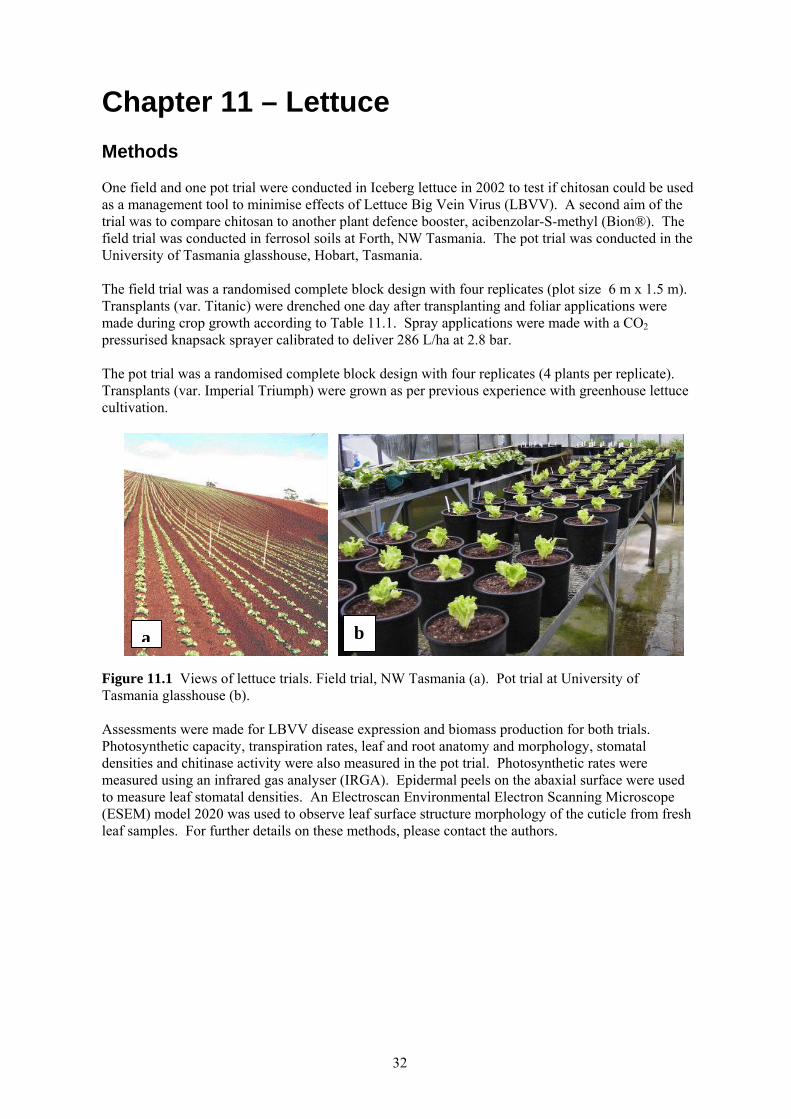
Chapter 11 – Lettuce Methods One field and one pot trial were conducted in Iceberg lettuce in 2002 to test if chitosan could be used as a management tool to minimise effects of Lettuce Big Vein Virus (LBVV). A second aim of the trial was to compare chitosan to another plant defence booster, acibenzolar-S-methyl (Bion®). The field trial was conducted in ferrosol soils at Forth, NW Tasmania. The pot trial was conducted in the University of Tasmania glasshouse, Hobart, Tasmania. The field trial was a randomised complete block design with four replicates (plot size 6 m x 1.5 m). Transplants (var. Titanic) were drenched one day after transplanting and foliar applications were made during crop growth according to Table 11.1. Spray applications were made with a CO2 pressurised knapsack sprayer calibrated to deliver 286 L/ha at 2.8 bar. The pot trial was a randomised complete block design with four replicates (4 plants per replicate). Transplants (var. Imperial Triumph) were grown as per previous experience with greenhouse lettuce cultivation.
ba
Figure 11.1 Views of lettuce trials. Field trial, NW Tasmania (a). Pot trial at University of Tasmania glasshouse (b). Assessments were made for LBVV disease expression and biomass production for both trials. Photosynthetic capacity, transpiration rates, leaf and root anatomy and morphology, stomatal densities and chitinase activity were also measured in the pot trial. Photosynthetic rates were measured using an infrared gas analyser (IRGA). Epidermal peels on the abaxial surface were used to measure leaf stomatal densities. An Electroscan Environmental Electron Scanning Microscope (ESEM) model 2020 was used to observe leaf surface structure morphology of the cuticle from fresh leaf samples. For further details on these methods, please contact the authors.
32
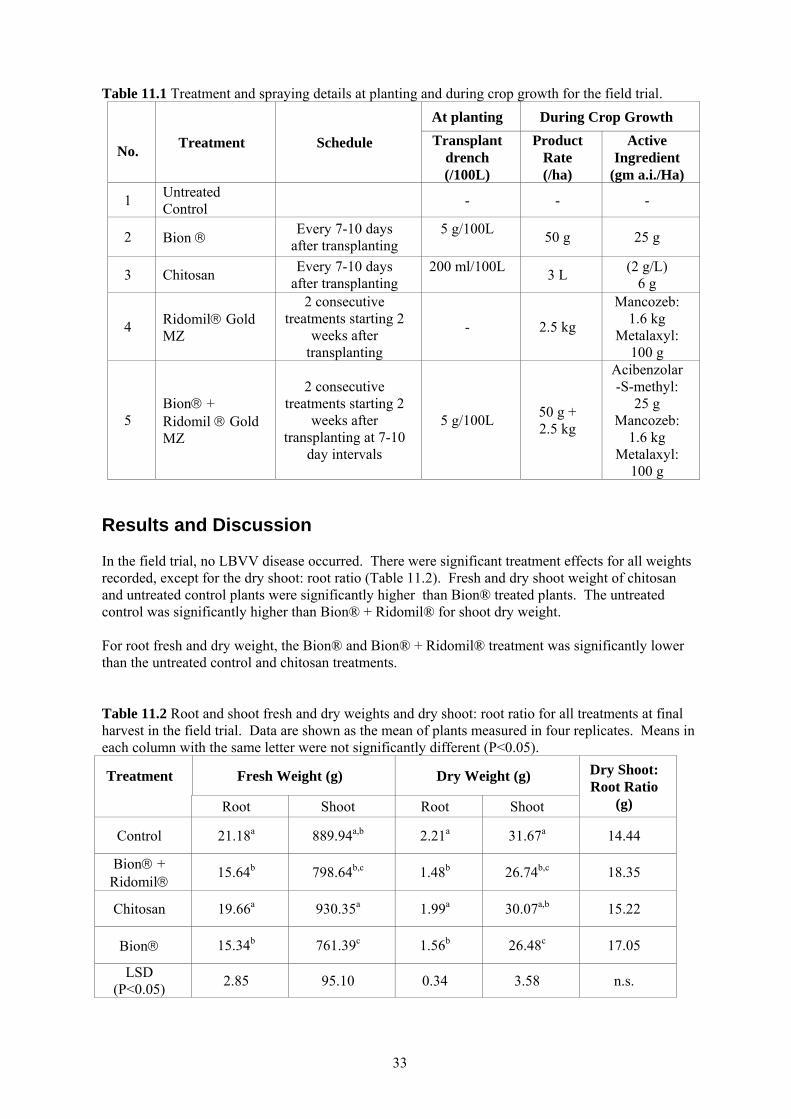
Table 11.1 Treatment and spraying details at planting and during crop growth for the field trial.
At planting During Crop Growth
No. Treatment Schedule Transplant drench (/100L)
Product Rate (/ha)
Active Ingredient
(gm a.i./Ha)
1 Untreated Control - - -
2 Bion ® Every 7-10 days after transplanting
5 g/100L 50 g 25 g
3 Chitosan Every 7-10 days after transplanting
200 ml/100L 3 L (2 g/L)
6 g
4 Ridomil® Gold MZ
2 consecutive treatments starting 2
weeks after transplanting
- 2.5 kg
Mancozeb: 1.6 kg
Metalaxyl: 100 g
5 Bion® + Ridomil ® Gold MZ
2 consecutive treatments starting 2
weeks after transplanting at 7-10
day intervals
5 g/100L 50 g + 2.5 kg
Acibenzolar-S-methyl:
25 g Mancozeb:
1.6 kg Metalaxyl:
100 g Results and Discussion In the field trial, no LBVV disease occurred. There were significant treatment effects for all weights recorded, except for the dry shoot: root ratio (Table 11.2). Fresh and dry shoot weight of chitosan and untreated control plants were significantly higher than Bion® treated plants. The untreated control was significantly higher than Bion® + Ridomil® for shoot dry weight. For root fresh and dry weight, the Bion® and Bion® + Ridomil® treatment was significantly lower than the untreated control and chitosan treatments. Table 11.2 Root and shoot fresh and dry weights and dry shoot: root ratio for all treatments at final harvest in the field trial. Data are shown as the mean of plants measured in four replicates. Means in each column with the same letter were not significantly different (P<0.05).
Treatment Fresh Weight (g) Dry Weight (g)
Root Shoot Root Shoot
Dry Shoot: Root Ratio
(g)
Control 21.18a 889.94a,b 2.21a 31.67a 14.44
Bion® + Ridomil® 15.64b 798.64b,c 1.48b 26.74b,c 18.35
Chitosan 19.66a 930.35a 1.99a 30.07a,b 15.22
Bion® 15.34b 761.39c 1.56b 26.48c 17.05
LSD (P<0.05) 2.85 95.10 0.34 3.58 n.s.
33
In the glasshouse trial, 40% of plants treated with chitosan showed signs of LBVV, while Bion® and untreated control plants showed no signs of disease expression. No treatments improved biomass production compared to the untreated control (Table 11.3). Table 11.3 Root (R) and shoot (S) dry weight and dry S: R ratios for all treatments at 3, 6 and 12 weeks after planting (wap) in glasshouse trial. Data are shown as the mean of plants measured in five replicates. Means in each column with the same letter were not significantly different (P<0.05).
Dry Weight (g)
3 wap 6 wap 12 wap Treatment Root Shoot S:R
ratio Root Shoot S:R ratio Root Shoot S:R
ratio
Untreated 0.27 2.09 7.74 0.48a 4.15a 8.64 1.15a 9.84a 8.56
Bion® 0.27 1.79 6.62 0.29b 2.36b 8.13 0.29b 3.68b 12.68
Chitosan 0.32 2.36 7.38 0.41a,b 3.24a
,b 7.90 1.18a 9.95a 8.43
LSD (P<0.05) n.s n.s. n.s. 0.17 0.94 n.s. 0.49 3.05 n.s.
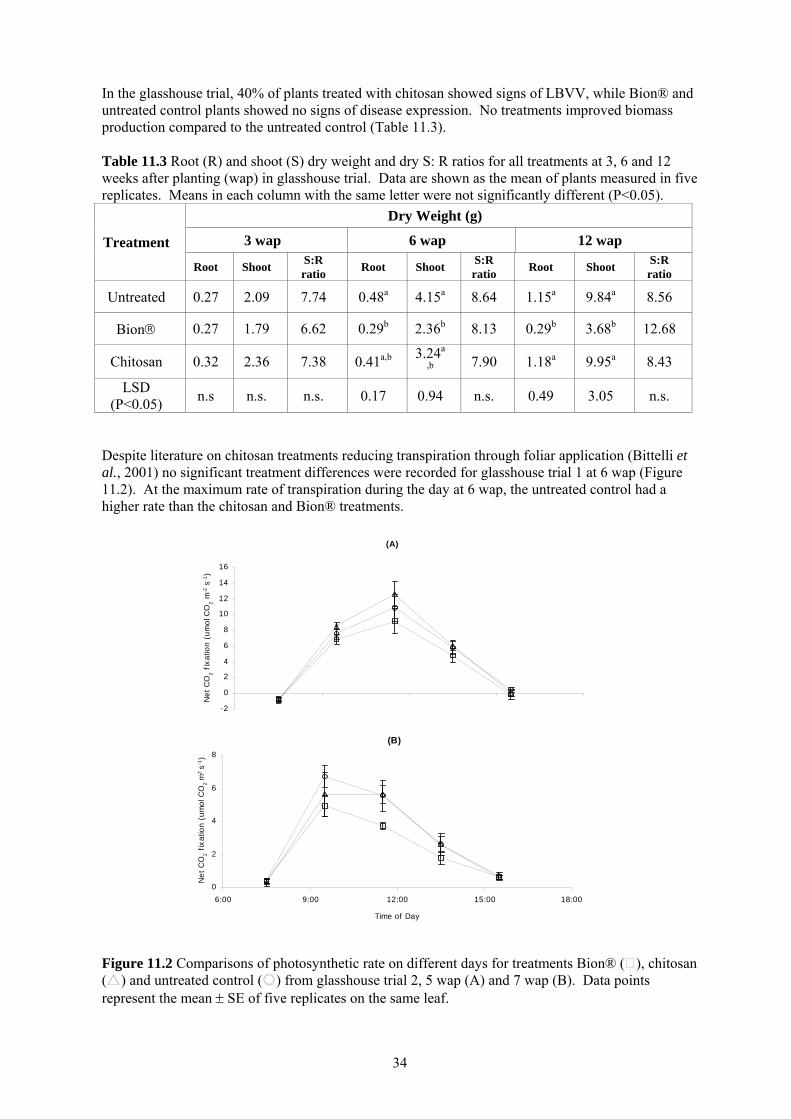
Despite literature on chitosan treatments reducing transpiration through foliar application (Bittelli et al., 2001) no significant treatment differences were recorded for glasshouse trial 1 at 6 wap (Figure 11.2). At the maximum rate of transpiration during the day at 6 wap, the untreated control had a higher rate than the chitosan and Bion® treatments. (A)
-2
0
2
4
6
8
10
12
14
16
Net
CO
2 fix
atio
n (u
mol
CO
2 m
-2 s
-1)
(B)
0
2
4
6
8
6:00 9:00 12:00 15:00 18:00
Time of Day
Net
CO
2 fix
atio
n (u
mol
CO
2 m
2 s-1
)
Figure 11.2 Comparisons of photosynthetic rate on different days for treatments Bion® ( ), chitosan ( ) and untreated control ( ) from glasshouse trial 2, 5 wap (A) and 7 wap (B). Data points represent the mean ± SE of five replicates on the same leaf.
34
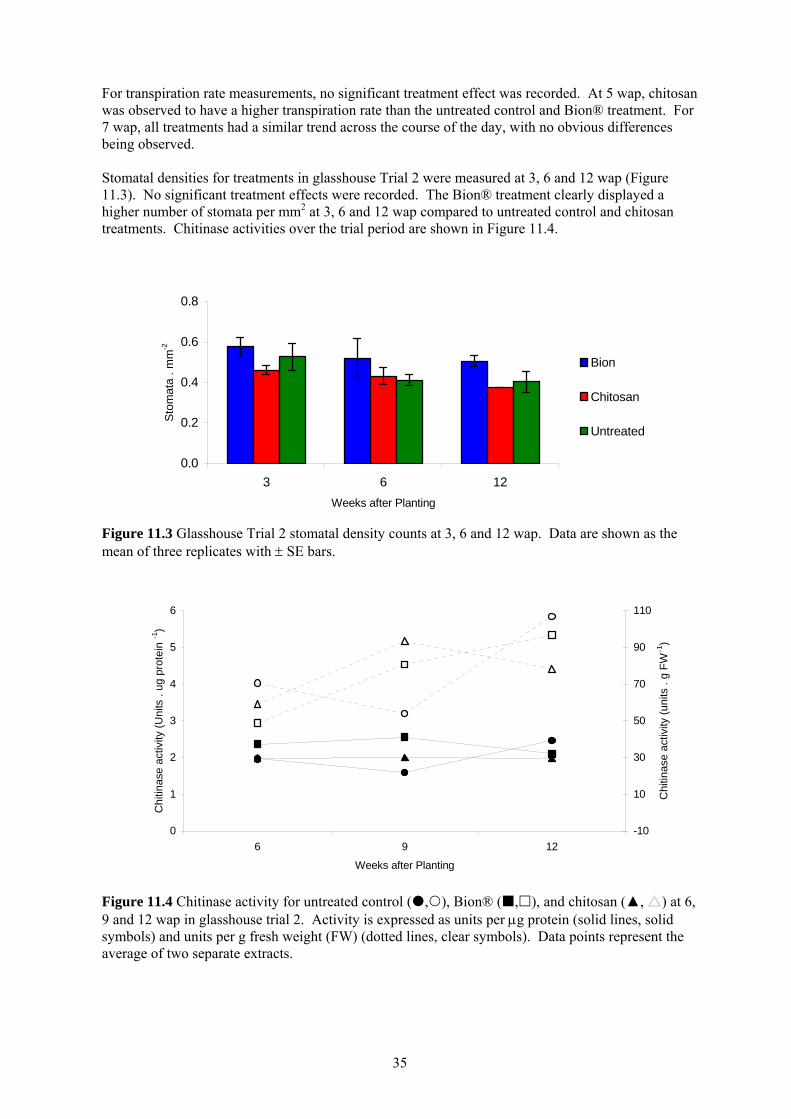
For transpiration rate measurements, no significant treatment effect was recorded. At 5 wap, chitosan was observed to have a higher transpiration rate than the untreated control and Bion® treatment. For 7 wap, all treatments had a similar trend across the course of the day, with no obvious differences being observed. Stomatal densities for treatments in glasshouse Trial 2 were measured at 3, 6 and 12 wap (Figure 11.3). No significant treatment effects were recorded. The Bion® treatment clearly displayed a higher number of stomata per mm2 at 3, 6 and 12 wap compared to untreated control and chitosan treatments. Chitinase activities over the trial period are shown in Figure 11.4.
Figure 11.3 Glasshouse Trial 2 stomatal density counts at 3, 6 and 12 wap. Data are shown as the mean of three replicates with ± SE bars.
0.0
0.2
0.4
0.6
0.8
3 6 12Weeks after Planting
Sto
mat
a . m
m-2
Bion
Chitosan
Untreated
0
1
2
3
4
5
6
6 9 12
Weeks after Planting
Chi
tinas
e ac
tivity
(Uni
ts .
ug p
rote
in -1
)
-10
10
30
50
70
90
110
Chi
tinas
e ac
tivity
(uni
ts .
g FW
-1)
Figure 11.4 Chitinase activity for untreated control ( , ), Bion® ( , ), and chitosan (▲, ) at 6, 9 and 12 wap in glasshouse trial 2. Activity is expressed as units per µg protein (solid lines, solid symbols) and units per g fresh weight (FW) (dotted lines, clear symbols). Data points represent the average of two separate extracts.
35

Surface characteristic differences between chitosan, Bion® and untreated control leaves were observed with environmental scanning electron microscope images at 125x magnification. The Bion® treated plants had a rough surface appearance with stomatal cavities being more difficult to distinguish compared to the chitosan and untreated control treatments. Although there is limited research conducted and published on lettuce, Bion® and chitosan are reported to induce rapid and coordinated expression of SAR- associated genes in many plant systems and among these genes induced are those coding chitinase activity (Buonaurio et al., 2002). In Iceberg lettuce, the trial results illustrate there to be no significant difference in chitinase activity between untreated plants and chitosan or Bion® treated plants. Following repeat applications, Bion® stimulated a small increase in chitinase activity when compared to chitosan treated plants. Increased replication in the chitinase assay would be desirable in future experimentation to detect any small differences between treatments, although chitinase activities in this study were similar to chitinase activities in untreated plants in other studies (Dann et al., 1996; Derckel et al., 1996). This suggests that the plant defence boosters did not induce a significant chitinase response, even with the low level of replication. Plants treated with chitosan in this study had a significantly higher growth rate than Bion® treated plants and a higher, although not statistically different, growth rate than the untreated control plants. These findings are in support of literature on chitosan increasing aspects of plant growth and development (Table 1.1).
36
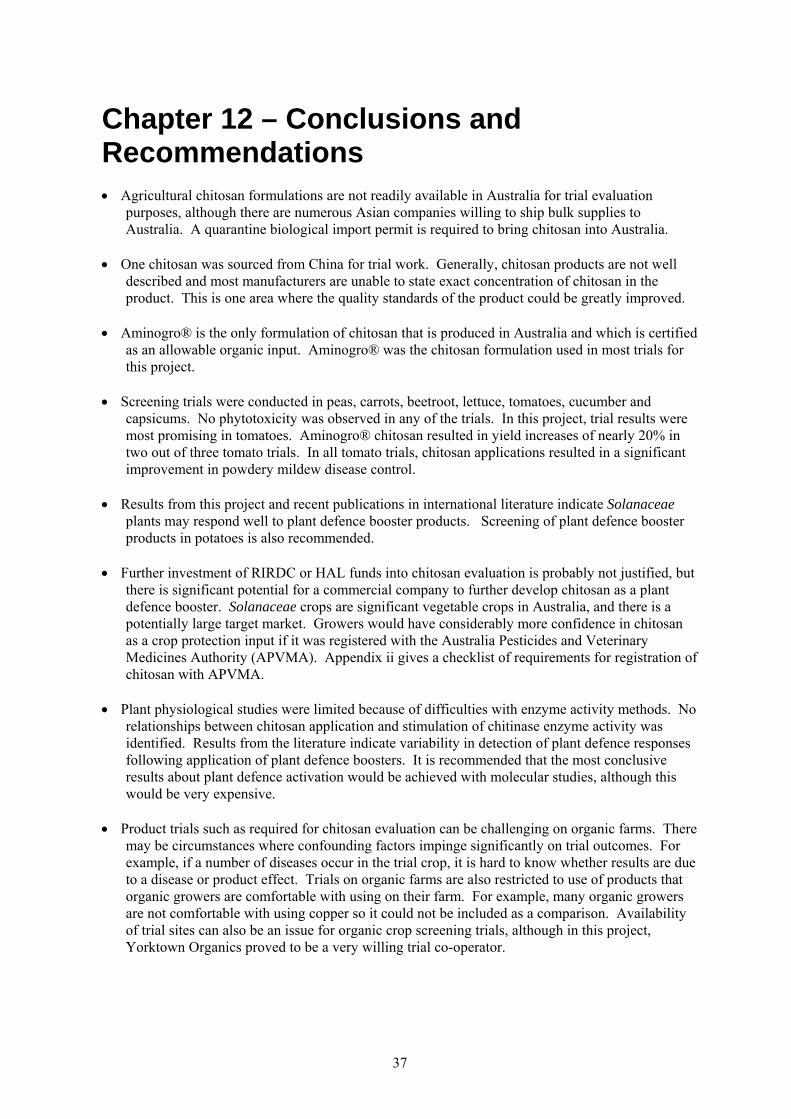
Chapter 12 – Conclusions and Recommendations • Agricultural chitosan formulations are not readily available in Australia for trial evaluation
purposes, although there are numerous Asian companies willing to ship bulk supplies to Australia. A quarantine biological import permit is required to bring chitosan into Australia.
• One chitosan was sourced from China for trial work. Generally, chitosan products are not well described and most manufacturers are unable to state exact concentration of chitosan in the product. This is one area where the quality standards of the product could be greatly improved.
• Aminogro® is the only formulation of chitosan that is produced in Australia and which is certified as an allowable organic input. Aminogro® was the chitosan formulation used in most trials for this project.
• Screening trials were conducted in peas, carrots, beetroot, lettuce, tomatoes, cucumber and capsicums. No phytotoxicity was observed in any of the trials. In this project, trial results were most promising in tomatoes. Aminogro® chitosan resulted in yield increases of nearly 20% in two out of three tomato trials. In all tomato trials, chitosan applications resulted in a significant improvement in powdery mildew disease control.
• Results from this project and recent publications in international literature indicate Solanaceae
plants may respond well to plant defence booster products. Screening of plant defence booster products in potatoes is also recommended.
• Further investment of RIRDC or HAL funds into chitosan evaluation is probably not justified, but
there is significant potential for a commercial company to further develop chitosan as a plant defence booster. Solanaceae crops are significant vegetable crops in Australia, and there is a potentially large target market. Growers would have considerably more confidence in chitosan as a crop protection input if it was registered with the Australia Pesticides and Veterinary Medicines Authority (APVMA). Appendix ii gives a checklist of requirements for registration of chitosan with APVMA.
• Plant physiological studies were limited because of difficulties with enzyme activity methods. No
relationships between chitosan application and stimulation of chitinase enzyme activity was identified. Results from the literature indicate variability in detection of plant defence responses following application of plant defence boosters. It is recommended that the most conclusive results about plant defence activation would be achieved with molecular studies, although this would be very expensive.
• Product trials such as required for chitosan evaluation can be challenging on organic farms. There
may be circumstances where confounding factors impinge significantly on trial outcomes. For example, if a number of diseases occur in the trial crop, it is hard to know whether results are due to a disease or product effect. Trials on organic farms are also restricted to use of products that organic growers are comfortable with using on their farm. For example, many organic growers are not comfortable with using copper so it could not be included as a comparison. Availability of trial sites can also be an issue for organic crop screening trials, although in this project, Yorktown Organics proved to be a very willing trial co-operator.
37
Technology Transfer
Agriculture Research and Advisory Committee Forum presentation, August 2003 Presentation to Greenhouse Growers of Tasmania, August 2003
Presentation to Organic Research Seminar, Burnie, November 2003
Tas Regions article, DPIWE Bi-monthly industry magazine. March, 2003.
Article in Soilless – Journal of Australian Hydroponics and Greenhouse Association, July
2003 Grower reports and regular verbal updates provided to growers and regional agronomists
Article in Research for organic growers - update from Serve-Ag Research, October 2003.
38
References Bell AA, Hubbard JC, Liu L. 1998. Effects of Chitin and Chitosan on the incidence and severity of Fusarium yellows of celery. Plant Diseases. 82(3): 322-328. Benhamou N, Kloepper JW, Tuzun S. 1998. Induction of resistance against Fusarium wilt of tomato by combination of chitosan with endophytic bacterial strain: ultrastructure and cytochemistry of the host response. Planta 204: 153-168. Benhamou N, Lafontaine PJ. 1994. Ultrastructural and cytochemical characterization of elicitor-induced structural responses in tomato root tissues infected by Fusarium oxysporum f.Sp. radicis-lycopersici. Planta 197: 89-102 Bhaskara Reddy MV, Angers P, Castaigne F, Arul J.2000. Chitosan effects on blackmold rot and pathogenic factors produced by Alternaria alternata in postharvest tomatoes. J. Amer. Soc. Hort. Sci. 125(6): 742-747. Bitteli M, Flury M, Campbell GS, Nichaols EJ. 2001. Reduction in transpiration through foliar application of chitosan. Agricultural and Forest Meteorology, 107:167-175. Bowles DJ. 1990. Defence-related proteins in higher plants. Annual Review of Biochemistry, 59:873-907. Bradford, M.M. (1976). A rapid and sensitive method for the quantitation of microgram quantities of protein utilizing the principle of protein-dye binding. Analytical Biochemistry, 72:248-254. Cheah L-H, Page BBC. 1997. Trichoderma spp for potential biocontrol of clubroot of vegetable brassicas. Crop and Food Research. Cole DL. 1999. The efficacy of acibenzolar-S-methyl, an inducer of systemic acquired resistance, against bacterial and fungal diseases of tobacco. Crop Protection, 18:267-273. Control of powdery mildew in greenhouse grown tomato. Mudford, R. Hay, F. date not stated. Literature review for the Tasmanian Greenhouse Tomato and Vegetable Growers Association. TIAR. Dann EK, Meuwly P, Metraux JP, Deverall BJ. 1996. The effect of pathogen inoculation or chemical treatment on activities of chitinase and beta-1,3-glucanase and accumulation of salicylic acid in leaves of green bean, Phaseolus vulgaris L. Physiological and Molecular Plant Pathology, 49:307-319. Derckel, J.-P., Legendre, L., Audran, J.-C., Haye, B., and Lambert., B. (1996). Chitinases of the grapevine (Vitis vinifera L.): Five isoforms induced in leaves by salicylic acid are constitutively expressed in other tissues. Plant Science, 119:31-37. Derkel JP, Legendre L, Audran JC, Haye B, Lambert B. 1996. Chitinases of the grapevine (Vitis vinifera L.): Five isoforms induced in leaves by salicylic acid are constitutively expressed in other tissues. Plant Science, 119:31-37. El Ghaouth A, Arul J, Wilson C, Benhamou N. 1994. Ultrastructural and cytochemical aspects of the effect of chitosan on decay of bell pepper fruit. Physiological and Molecular Plant Pathology. 44: 417-432. El Ghaouth A, Arul J, Wilson C, Benhamou N. 1997. Biochemical and cytochemical aspects of the interactions of chitosan and Botrytis cinerea in bell pepper fruit.
39
El Ghaouth A, Ponnampalam R, Castaigne F, Arul J. 1992. Chitosan coating to extend the storage life of tomatoes. HortScience. 27(9): 1016-1018. Giannakis C, Bucheli C.S, Skene K.G.M, Robinson S.P, Steele Scott N. 1998. Chitinase and ß-1,3-glucanase in grapevine leaves: a possible defence against powdery mildew infection. Australian Journal of Grape and Wine Research. 4: 14-22. Kim KD, Nemec S, Musson G. 1997. Effects of composts and soil amendments on soil microflora and Phytopthora root and crown rot of bell pepper. Crop Protection. 16(2): 165-172. Lawton K, Friedrich L, Hunt MD, Weymann K, Delaney TP, Kessman H, Staub T, Ryals J. 1996. Benzothiadiazole induces disease resistance in Arabidopsis by activation of the systemic required resistance signal transduction pathway. The Plant Journal, 19:71-82. Louws FJ Wilson M Campbell HL, Cuppels DA, Jones JB, Shoemaker PB, Miller SA. 2001. Field control of bacterial spot and bacterial speck of tomato using a plant activator. Plant Disease, 85:785-790. National Toxicology Program Database Information (1999) http://ntp-server.niehs.nih.gov/htdocs/Chem_Background/ExecSumm/Chitosan.html. Viewed 24 June, 2004. Ohta K, Asao T, Hosoki T. 2001. Effects of chitosan treatments on seedling growth, chitinase activity and flower quality in Eustoma grandiflorum (Raf.) Shinn. ‘Kairyou Wakamurasaki’. Journal of Horticultural Science and Biotechnology, 76:612-614. Peniston QP & Johnson E (1980) Process for the manufacture of chitosan. US Patent No. 4, 195, 175, 5 pp. Roby D, Gadelle A, Toppan A. 1987. Chitin oligosaccharides as elicitors of chitinase activity in melon plants. Biochemical and Biophysical Research Communications, 143:885-892. Romero AM, Kousik CS, Ritchie DF. 2001. Resistance to bacterial spot in bell pepper induced by acibenzolar-S-methyl. Plant Disease, 85:189-194. Siegrist B, Glenewinkel D, Kiolle C and Schmidtke. 1997. Chemically induced resistance in green bean against bacterial and fungal pathogens. Journal of Plant Diseases and Protection, 104:599-610. Siegrist J, Kauss H. 1989. Chitin deacetylase in cucumber leaves infected by Colletotrichum lagenarium. Physiological and Molecular Plant Pathology 36: 267-275. Singh P.P, Shin Y.C, Park C.S, Chung Y.R. 1998. Biological control of Fusarium wilt of cucumber by Chitinolytic bacteria. Phytopathology 89(1): 92-99. The BioPesticide Manual. Second Edition. Copping L. G. (ed.). 2001. British Crop Protection Council. Surrey, United Kingdom. Wiberg L.M. 1990. Efficacy of Chitinase (as YEA! ®) for control of root rots in green peas. VACB Wirth, S.J., and Wolf, G.A. (1990). Dye-labeled substrates for the assay and detection of chitinase and lysozyme activity. Journal of Microbiological Methods, 12:197-205. Yoo S, Lee S. 1999. Effect of various films on shelf life of sliced strawberry fruit. Proc. Int. Symp. on quality of fresh and fermented vegetables. Acta Hort. 483:283-289. Yu G and Meuhlbauer G. 2001. Benzothiadiazole-induced gene expression in wheat spikes does not provide resistance to Fusarium head blight. Physiological and Molecular Plant Pathology, 59:129-139.
40

Zhang Y, Punja Z.P. 1994. Induction and characterization of chitinase isoforms in cucumber (Cucumis sativus L.): effect of elicitors, wounding and pathogen inoculation. Plant Science. 99:141-150.
41
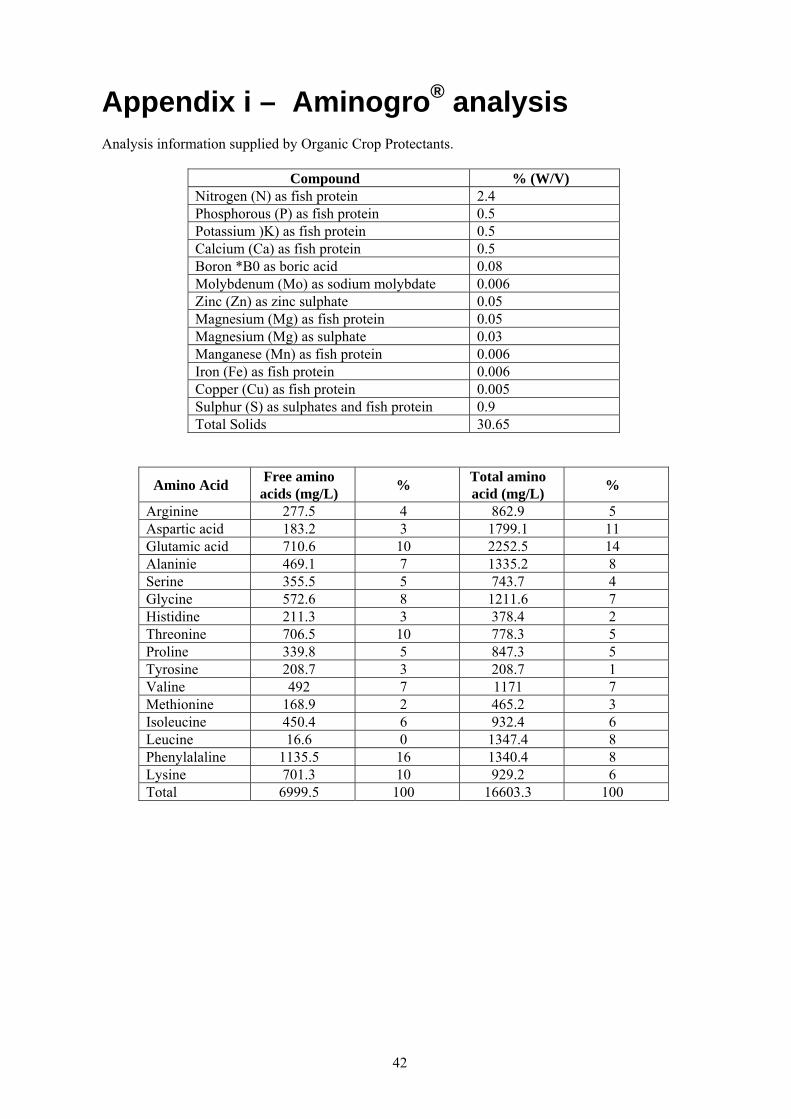
Appendix i – Aminogro® analysis Analysis information supplied by Organic Crop Protectants.
Compound % (W/V) Nitrogen (N) as fish protein 2.4 Phosphorous (P) as fish protein 0.5 Potassium )K) as fish protein 0.5 Calcium (Ca) as fish protein 0.5 Boron *B0 as boric acid 0.08 Molybdenum (Mo) as sodium molybdate 0.006 Zinc (Zn) as zinc sulphate 0.05 Magnesium (Mg) as fish protein 0.05 Magnesium (Mg) as sulphate 0.03 Manganese (Mn) as fish protein 0.006 Iron (Fe) as fish protein 0.006 Copper (Cu) as fish protein 0.005 Sulphur (S) as sulphates and fish protein 0.9 Total Solids 30.65
Amino Acid Free amino acids (mg/L) % Total amino
acid (mg/L) %
Arginine 277.5 4 862.9 5 Aspartic acid 183.2 3 1799.1 11 Glutamic acid 710.6 10 2252.5 14 Alaninie 469.1 7 1335.2 8 Serine 355.5 5 743.7 4 Glycine 572.6 8 1211.6 7 Histidine 211.3 3 378.4 2 Threonine 706.5 10 778.3 5 Proline 339.8 5 847.3 5 Tyrosine 208.7 3 208.7 1 Valine 492 7 1171 7 Methionine 168.9 2 465.2 3 Isoleucine 450.4 6 932.4 6 Leucine 16.6 0 1347.4 8 Phenylalaline 1135.5 16 1340.4 8 Lysine 701.3 10 929.2 6 Total 6999.5 100 16603.3 100
42
Appendix ii – Chitosan APVMA registration checklist Supplied by Rosemary Henderson, Protech Consulting Ph 03 9435 0129 Mobile 0418 366000 [email protected] REGISTRATION ACTIONS REQUIRED: PART TITLE ACTION
OVERVIEW:
1.1 General Information a Applicant details Name & address b Purpose of the application Prepare c Reasons for the new product/use/change “ d Text formatted draft label “ e Quantity likely to be used in first 2 years
of registration “
f Registration status overseas for this and comparable formulations
“
g Related submissions before the NRA “ 1.3 Toxicology summary Prepare
1.4 Metabolism summary Prepare
1.5 Residue summary Prepare
1.6 Occupational summary Prepare
1.7 Environmental summary Prepare
1.8 Efficacy summary Prepare
CHEMISTRY & MANUFACTURE:
2.1 ACTIVE
2.1.1 Active approval form
Compendial or manufacturer’s standard
2.1.2 Identification Common Name Chemical Name CAS Registry Number Distinguishing Name Chemical Formula Molecular Structure Molecular Weight Manufacturer's Synonyms Development Code Number(s)
2.1.3 Chemical & physical properties
43
2.1.4 Stability
2.1.5-6 Manufacturer & plant site Name & address
Letter of confirmation of source where applicant is not the manufacturer
Provide
2.1.7 Manufacturing process Quality control during manufacture Declaration of composition (DoC) of TGAC/manufacturing concentrate Process chemistry/production method If product of a GMO, description of genetic manipulation method
Details or report
2.1.8 Analytical methods Active Constituent Impurities Toxic Impurities
Provide reports
2.1.9 Batch analysis Provide
2.1.10 Packaging Specifications
2.1.11 Analytical samples Required to be submitted
2.1.12 Biological properties Natural occurrence and distribution in Australia of source organism Natural occurrence of chemical or, if synthesised, relationship to form occurring in an organism Mode of action Specificity of action Likely biological effects arising from use Effect of storage and other conditions on biological activity
Details
2.2 END-USE PRODUCT
2.2.1 Identification Distinguishing Name Formulation Type Active constituent(s) and concentration
Product name & active content
2.2.2 Formulation Composition statement
2.2.3 Chemical & physical properties Details
2.2.4-5 Formulator & plant Name & address
2.2.6 Formulation process Formulation process
2.2.7 Quality control Procedures
2.2.8 Analytical methods Active constituent in formulation (if different from in active)
Reports
2.2.9 Storage stability Storage Conditions Proposed Shelf-Life
Studies - accelerated & real time
44
Toxic Products / Degradation Products
2.2.10 Allowable variations Any ?
2.2.11 Packaging Specifications
2.2.12 Biological properties (where different from active)
Details
TOXICOLOGY:
3.1 Summary Prepare
3.2 Acute tox Details
3.2.1 Active constituent “
3.2.2 Product “
3.3 Short-term repeat dose “
3.4 Sub-chronic “
3.5 Chronic “
3.6 Reproduction “
3.7 Developmental “
3.8 Genotoxicity “
3.9 Additional studies “
3.10 Human tox “
3.11 NOEL Determine
3.12 ADI “
3.13 First aid / Safety directions Propose
3.14 Tox database Prepare
METABOLISM & KINETICS:
4.1 Target plants Require studies
4.2 Laboratory animals Any studies
4.3 Target animals Not relevant
4.4 Metabolism database Prepare
RESIDUES: not required for TGAC, required for EUP
5.1 Residue summary Prepare
5.2 Residue database form “
5.3 Crop residues Require studies
5.4 Livestock residues Require feeding studies if relevant
5.5 Analytical methods Reports
5.6 Fate in storage & processing Prepare statement
5.7 MRL’s Propose
45

5.8 Withholding periods “
OCCUPATIONAL HEALTH & SAFETY:
6.2.1 Active description Properties
6.2.2 Product description Properties & packaging
6.3.1 Toxicology relevant to occupational health/safety Human health effects, animal testing, tox end-points for risk assess, dermal absorption
Details ?
6.3.2 Hazard classification Determine for TGAC & EUP
6.4 Occupational exposure General & extrapolated or measured exposure
Details ?
6.5 Risk assessment Margin b/n exposure & tox end-point
Determine
Further requirements if inadequate safety margin
Details ?
Proposed control of occupational exposure Propose
6.6 Label Prepare
MSDS “
6.7 Miscellaneous Special training
Details ?
Occupational exposure monitoring - atmospheric & health
“
Tank mixes “
Contraindications Any ?
ENVIRONMENTAL STUDIES:
CHEMISTRY & FATE
7.1.1 Summary Prepare
7.1.2 Potential exposure:
a Amount of product to be used in first 2 years
Calculate
b TGAC plant - hazard potential Assess, if in Aust
c EUP plant - hazard potential Assess, if in Aust
d Product disposal Assess
e Accidental release Assess
7.1.3 Hydrolysis / photodegradation
7.1.4 Biodegradation - soil / water “
7.1.5 Mobility “
a Volatility Data
46
b Adsorption/desorption “
c Leaching potential “
7.1.6 Field dissipation - soil/water/air/plants “
7.1.7 Accumulation/metabolism “
a Bioaccumulation “
b Accumulation potential in soils “
c Metabolism-target animal “
d Other (eg birds, worms) “
7.1.8 Modelling studies “
7.1.9 Storage & disposal “
ENVIRONMENTAL TOXICOLOGY:
7.2.1 Summary Prepare statement
7.2.2 Birds & animals (acute, short-term, chronic, etc)
Data
7.2.3 Aquatic (acute, short-term, chronic, etc) “
7.2.4 Non-target invertebrates e.g. Bees, Worms, Soil Microbes
7.2.5 Non-target vegetation Data
7.2.6 Assess environ hazard Prepare
7.2.7 Environ protection statement “
EFFICACY AND CROP SAFETY:
8.1 Overall summary Prepare statement
8.2 Intro & use justification Prepare statement
8.3 Efficacy studies Design, data, validation, resistance, farming systems
8.4 Phytotoxicity studies - target, non-target & following crop
8.5 Other studies
b Organoleptic
c Residues on processing
d Animal welfare
e Safety non-target animal
f Other industry effects
g Other relevant issues
47
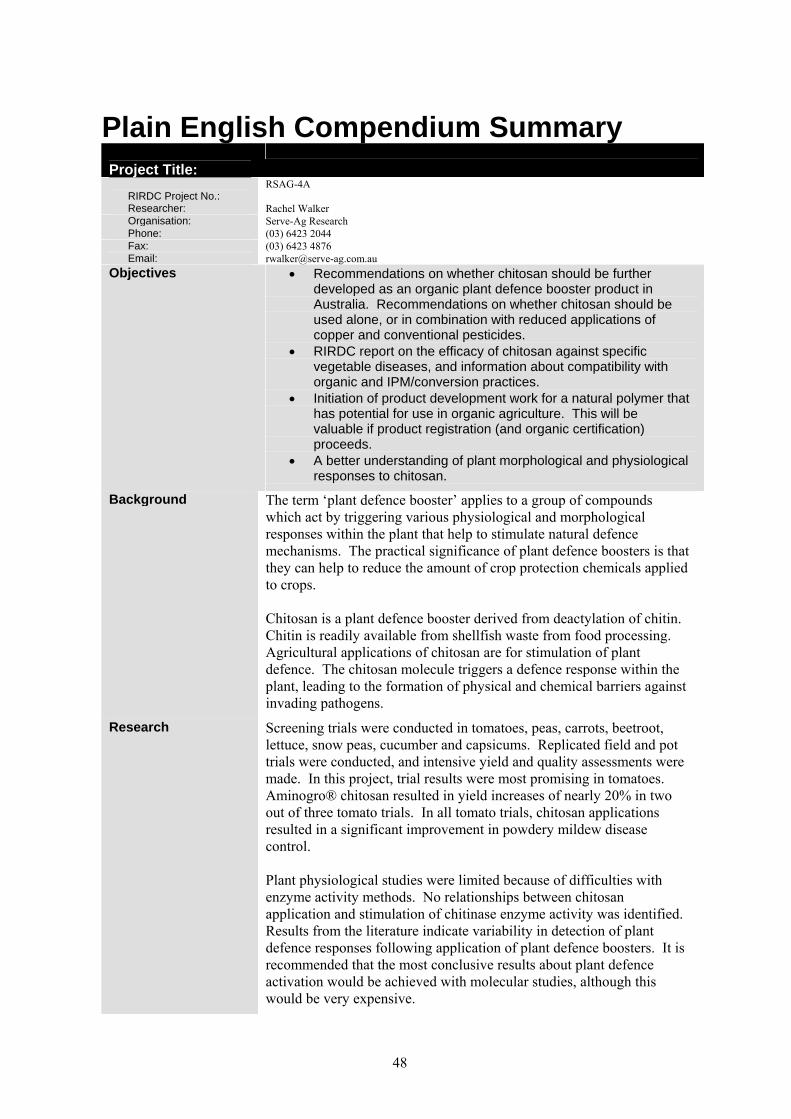
Plain English Compendium Summary Project Title:
RIRDC Project No.:
RSAG-4A
Researcher: Rachel Walker Organisation: Serve-Ag Research Phone: (03) 6423 2044 Fax: (03) 6423 4876 Email: [email protected] Objectives • Recommendations on whether chitosan should be further
developed as an organic plant defence booster product in Australia. Recommendations on whether chitosan should be used alone, or in combination with reduced applications of copper and conventional pesticides.
• RIRDC report on the efficacy of chitosan against specific vegetable diseases, and information about compatibility with organic and IPM/conversion practices.
• Initiation of product development work for a natural polymer that has potential for use in organic agriculture. This will be valuable if product registration (and organic certification) proceeds.
• A better understanding of plant morphological and physiological responses to chitosan.
Background The term ‘plant defence booster’ applies to a group of compounds which act by triggering various physiological and morphological responses within the plant that help to stimulate natural defence mechanisms. The practical significance of plant defence boosters is that they can help to reduce the amount of crop protection chemicals applied to crops. Chitosan is a plant defence booster derived from deactylation of chitin. Chitin is readily available from shellfish waste from food processing. Agricultural applications of chitosan are for stimulation of plant defence. The chitosan molecule triggers a defence response within the plant, leading to the formation of physical and chemical barriers against invading pathogens.
Research Screening trials were conducted in tomatoes, peas, carrots, beetroot, lettuce, snow peas, cucumber and capsicums. Replicated field and pot trials were conducted, and intensive yield and quality assessments were made. In this project, trial results were most promising in tomatoes. Aminogro® chitosan resulted in yield increases of nearly 20% in two out of three tomato trials. In all tomato trials, chitosan applications resulted in a significant improvement in powdery mildew disease control. Plant physiological studies were limited because of difficulties with enzyme activity methods. No relationships between chitosan application and stimulation of chitinase enzyme activity was identified. Results from the literature indicate variability in detection of plant defence responses following application of plant defence boosters. It is recommended that the most conclusive results about plant defence activation would be achieved with molecular studies, although this would be very expensive.
48
Outcomes Implications
Trial results and recent publications in international literature indicate Solanaceae plants may respond well to plant defence booster products. Screening of plant defence booster products in potatoes is recommended for future trial work. Solanaceae crops are significant vegetable crops in Australia, and there is a potentially large target market. Growers would have considerably more confidence in chitosan as a crop protection input if it was registered with the Australia Pesticides and Veterinary Medicines Authority (APVMA). A checklist of requirements for registration of chitosan with APVMA is included in the report.
Publications and Communications
• Agriculture Research and Advisory Committee Forum presentation, August 2003
• Presentation to Greenhouse Growers of Tasmania, August 2003 • Presentation to Organic Research Seminar, Burnie, November
2003 Tas Regions article, DPIWE Bi-monthly industry magazine.
March, 2003. • Article in Soilless – Journal of Australian Hydroponics and
Greenhouse Association, July 2003 • Grower reports and regular verbal updates provided to growers
and regional agronomists • Article in Research for organic growers - update from Serve-Ag
Research, October 2003.
49