Embed Size (px)
Citation preview

1
Evaluation of Nitrogen Use Efficiency
(NUE) in Wheat
By
Bahaddin Abdullah Faraj
A thesis submitted for the degree of Masters in
Agricultural Science
The University of Adelaide, Faculty of Science
School of Agriculture Food & Wine
Waite Campus
2009 - 2011

2
CONTENTS
Evaluation of Nitrogen Use Efficiency (NUE) in Wheat 1
Table of contents 2
Declaration 4
Acknowledgments 5
List of Abbreviations 6
Abstract 7
CHAPTER 1
Introductory Background 8
CHAPTER 2
2. Review of Literature 10
2.1. Introduction 10
2.2. Wheat is a global agriculture crop 10
2.3. Role of N in plant growth 11
2.4. What is Nitrogen Use Efficiency? 17
2.5. Strategies to Improve NUE 19
2.6. Plant and soil factors influencing NUE 20
2.7. Managing N use 22
2.8. N and wheat production 25
2.9. NUE and wheat production 27
2.10. Evidence of NUE productivity 28
2.11. Aims/Objectives of the project 29

3
CHAPTER 3
Influence of N fertilizer on growth and seed yield of field-grown wheat varieties 30
3.1. Introduction 30
3.2. Materials and methods 30
3.3. Results 34
3.4. Summary 36
3.5. Figures 37
CHAPTER 4
Analysis of N-dependent growth responses of wheat cultivars cultivated under controlled
Glasshouse conditions 47
4.1. Introduction 47
4.2. Materials and Methods 47
4.3. Results 49
4.4. Summary 51
4.5. Figures 52
CHAPTER 5
5.1 General Discussion 62
5.2. Figures 67
REFERENCES 71
APPENDIXES 84

4
DECLARATION
This work contains no material which has been accepted for the award of any other degree or
diploma in any university or other tertiary institution to Bahaddin Abdullah Faraj and, to the
best of my knowledge and belief, contains no material previously published or written by
another person, except where due reference has been made in the text.
I give consent to this copy of my thesis, when deposited in the University Library, being
made available for loan and photocopying, subject to the provisions of the Copyright Act
1968.
I also give permission for the digital version of my thesis to be made available on the web,
via the University‘s digital research repository, the Library catalogue and also through web
search engines, unless permission has been granted by the University to restrict access for a
period of time.
Bahaddin Abdullah Faraj

5
ACKNOWLEDGMENTS
I appreciate very much my principal supervisor Dr. Brent Kaiser for his help and opportunity
in securing a scholarship for this study and for supporting me with advice and information I
needed during my study.
I would like to thank Dr. Mamoru Okamoto for supporting and providing advice I needed
during my study.
I would like to thank Dr. Trevor Garnett and Dr. Daren Pallet for supporting and providing
advices related to this research.
I thank Neenah Mackenzie for her support and for her work on plant tissue sample analysis
and measuring N and C by running the Isotope Ratio Mass Spectrometer.
I thank Dr. Haydn Kuchel for providing advice and information on the field trials (2010).
I thank Australian Grain Technology (AGT) for conducting field trials in 2010 and providing
materials.
I thank Prof. Peter Langridge, Chief Executive Officer, and Australian Plant Functional
Genomic Centre (ACPFG) for his support.
I thank Adelaide University and (ACPFG) for funding this project.
Finally, I thank my family for their support, their encouragement and their patience to get
here where I am now.

6
List of Abbreviations
ADP Di-ammonium phosphate
AGT Australian Grain Technology
ANOVA Analysis of variance
GH Glasshouse
GY Grain Yield
HI Harvest Index
LSD Least significant difference
N Nitrogen
NH4+
Ammonium
NOx Nitrous oxide
NO3-
Nitrate
NUE Nitrogen Use Efficiency
NupE Nitrogen uptake efficiency
NutE Nitrogen utilization efficiency
TGN Total grain nitrogen content
TGW Thousand grain weight

7
Abstract
Nitrogen fertilizers are a major input required for cereal crop production worldwide. The
management of this resource is a significant challenge to most agricultural systems as it can
have significant impacts on yield and the environment. The use of applied nitrogen fertilisers
in cereals is poor, where only 30-40% is actually used by cereals and the remainder lost to the
environment by surface runoff, soil denitrification and volatilization (Ehdaie et al., 2010;
Butterbach-Bahl and Dannenmann 2011). Improving cereal nitrogen use efficiency (NUE) is
imperative to achieve yield and quality with less direct N inputs. In this study, experiments
were conducted in 2010 to evaluate the effect of N fertilizer application (0, 50, 100, 150 kg
urea/ha) on the growth and yield of wheat varieties at specific locations across South
Australia while a small pilot glasshouse study was conducted at the Waite Campus, Adelaide
University. The field experiments were designed as a randomised split-plot with three
replications for each wheat cultivar and N treatment. Plant response to N treatment was
measured through estimates of plant height, leaf chlorophyll content (SPAD meter), plant
spike number, grain yield, 1000 grain weight, shoot biomass weight, grain N % and final
grain protein content, harvest index (HI) and NUE. Restrictions in space and large growing
pots limited the controlled glasshouse study to a technical study.
The results found little variability between the three field sites in Grain %N in response to
increasing N provision. There was a trend of increasing grain %N at both Mintaro and
Pinnaroo, which was broadly in evidence across the individual lines. Grain yield was highest
at Mintaro and was double of that achieved at both Pinnaroo and Tuckey. Whereas, in the
glasshouse experimental results show that there was a strong response in grain %N to
increasing N provision when plants were grown over the spring/summer season but not
during the autumn/winter. Nitrogen use efficiency (NUE) was found to be greater at low
nitrogen treatment (N1) in all experiments and decreased roughly with increased N
application. In general, the results indicated that wheat cultivars responded well to nitrogen
application with the medium rate of application within experiments, while beyond this rate
caused no significant improvements in plant growth and yield.
Key words: Wheat varieties, nitrogen fertiliser (varied levels), nitrogen use efficiency
(NUE), Yield, grain protein content

8
CHAPTER 1
Introductory Background
Nitrogen (N) is the most limiting nutrient required for food productivity worldwide (Giller et
al., 2004). Over the past four decades, the doubling of global agricultural food production has
been reached in part with a 7-fold increase in the use of N fertilizers, where approximately
90-100 million metric tonnes are used for agricultural production (London et al., 2005).
Global population growth has led to a significant increase in demand of cereal crops and
other agriculture products. World population growth is expected to reach 8 billion people by
2025 further increasing the demand for food and greater efficiency in productivity. However,
a great challenge will be to do this in an environmentally sustainable manner. One direction
which will have an influence is the development of novel plant genotypes which have a
greater capacity to produce harvestable yields using less external inputs such as nitrogen
fertilisers. These genotypes should have the capacity to accumulate and or assimilate N more
efficiently than that of previously selected crops while still maintaining the required
harvested production levels demanded of farmers and consumers (Hirel et al., 2007).
Nitrogen can only be used by plants in its reduced form. Unfortunately, the majority of N in
the environment is in the form of di-nitrogen (N2) which comprises ~ 72% v/v of the air on
the planet. Available forms of N (e.g. NH3 & NO3-) can occur through the activity of
lightning, biological nitrogen fixation and via the energy intensive Haber-Bosch process.
Plants such as legumes can form an effective N2-fixing symbiosis with soil bacteria, where
they obtain the necessary levels of N from the atmosphere to adequately balance the demands
required for growth and successful seed production. However in non-legume crops, N must
be acquired in a reduced form where demand can vary widely depending on the targeted yield
and final protein content of the harvested product. Furthermore, differences in plant
genotypes, environmental interactions and management systems will influence the supply and
demand by the plant for N (Angus et al., 2001).
The majority of non N2-fixing agricultural crops are dependent on introduced N-fertilizers to
grow and set seed. In developed countries, fertilizers mainly consist of N, which is often
poorly represented in agricultural soils. N-fertilisers are therefore heavily relied upon to
improve crop growth and to deliver sufficient food to supply both animal and human needs.
The extensive use of N fertiliser unfortunately has an impact on the local environment

9
through changes in soil microbe activity and non-agricultural plant and animal ecosystems. In
most situations, about 50% to 75% of nitrogen fertiliser applied to agricultural crops is not
used by the intended crop but rather is lost to the environment through leaching, volatilisation
or indirectly through the activity and competition of soil microorganisms. Moreover, the
capacity of plants to capture nitrogen from soil can be dependent on the soil type,
environmental conditions (warm versus cold) and plant species. Consequently, nitrogen
fertilizers are the largest source of N released into the atmosphere worldwide, which also
represents a significant amount of the greenhouse gas emissions (nitrous oxide (NOx) and the
emission of toxic ammonia into the atmosphere (Ramos et al., 1996; Stulen et al., 1998). N in
particular has direct effects on water quality where N fertiliser release (NO3-) from
agricultural soils is often linked to eutrophication of freshwater and/or marine ecosystems
(Beman et al., 2005). When applied in excess, high nitrate content in plant tissues can cause
toxicity problems (methemoglobinemia) in humans especially in infant children and also in
drinking water contaminated with high NO3-, and livestock from grazing on contaminated
grass (Bruning-Fan &Kaneene 1993). Preventing excessive nitrate accumulation in crop
species is important to avoid potential community health problems. With these ongoing
issues it is important that agricultural crop plants are developed with greater NUE to
effectively capture and assimilate N to maximize growth per unit of applied N fertiliser.
Improvements in NUE will not only help to minimize production costs in crops as in wheat
and corn (up to 40%) (Bock et al., 1984) through less fertiliser applications but also decrease
the environmental damages associated with N-fertiliser application (Good et al., 2007).
The objectives of this study were to provide a better understanding of wheat varieties
(genotypes) and their responses to different levels of N-fertilisation under controlled
(glasshouse) and uncontrolled (field) conditions and to identify genotypic differences in NUE
traits across an array of wheat lines. These experiments are likely to lead to improvements in
both grain yield and corresponding grain protein content and at the same time minimize
economic losses and environmental risks while maximizing grower‘s production capacity and
their income.

10
CHAPTER 2
2. Review of Literature
2.1 Introduction
This literature analysis focuses on research that has characterized the relationship between
nitrogen (N)-fertilization and the production of wheat. As part of the review, plant N use will
be discussed and the issues associated with N-fertilizer use in agriculture and the directions
for identifying and improving N use efficiency (NUE).
2.2 Wheat is a global agricultural crop
Wheat is a major world food crop grown in both developed and developing countries. It sits
in relative importance to that of maize and rice as essential crops required to meet present and
future food demands (Joshi et al., 2007a). Of these crops, wheat represents approximately
30% of current total cereal production (Fageria et al., 1997). In 2009-2010, global wheat
production was approximately 645 million tons (Quail et al., 2011). It is expected that this
value will need to increase significantly to match food demands of a growing world
population by 2050. How this will be achieved is unknown, as simple expansion of cultivated
arable land is not expected to increase but rather decrease as a result of growing urbanization,
increased soil erosion and drought and salinity affected areas (Joshi et al., 2007). Technical
advancements will thus be important to improve genetic resources that provide agronomists
and breeders the necessary tools to increase future wheat production on a predicted smaller
agricultural footprint. Improvements associated with wheat production may include: 1) the
development and selection of new genotypes that can be grown productively using lower
inputs, 2) the use of compatible modern agricultural techniques which retain soil health and
improve nutrient and water delivery and efficiencies, and 3) germplasm development which
improves resistance to biotic and abiotic stresses. One direction, which will provide
significant improvement to productivity and agricultural sustainability, is the efficient
management of applied nutrients. N in particular has been an agricultural input, which has
generated much interest due to its rising cost of production; a process that is dependent on
non-renewable resources. Furthermore, N fertilizers can have a negative impact on the
environment when application is not efficiently met by plant utilization. Improving N use
efficiency in agriculture is a global aspiration and is the basis of this work.

11
Impact of Australian dryland wheat production on N use
Overall, Australian dryland-farming systems are using farm enterprise diversity (especially
mixed crop–livestock systems) with pastures and fallow periods to maximize the efficient use
of available resources (fertilizer inputs and limited water). Moisture is usually the deciding
factor in the success of cereal cropping alongside fertilizer inputs. Moreover, weather has a
major influence on crop growth and grain yield (N demand), and on the availability of soil
and fertilizer-N (N supply). The difficulty of predicting the weather more than a few days
ahead is a major barrier to making accurate fertilizer recommendations. Plants in natural field
conditions face changing environmental conditions where N concentrations vary and
frequently are limiting for growth due to many factors including surface run-off, leaching of
rain-water, soil erosion, and gaseous losses by volatilization and consumption by soil
microorganisms. Moreover, N nutrition management is difficult because its effect on plant
growth, development and physiology is related to unpredictable soil moisture under rainfed
conditions (Basso et al., 2010). Adequate N fertilization is necessary to produce high yields
of wheat and to increase grain quality (protein content). High levels of protein are important
for superior wheat flour and baking characteristics (Feil et al., 1997). However, the
environmental and genetic interactions controlling seed protein content are extensive (Kramer
et al., 1979) and need to be defined in relation to favourable and unfavourable growing
conditions.
2.3 Role of N in plant growth
N is an important factor limiting plant growth and productivity worldwide. Plants are
provided N from both atmospheric air and soil minerals. The ability of plants to capture N
naturally or that applied as N fertilizers, is one of the critical steps limiting the efficient use of
N by plants. Despite N being one of the most abundant elements on earth, N deficiency is one
of the most common problems affecting plant growth worldwide. Plants lacking N show
stunted growth and yellowish leaves and will often fail to meet expected yields.
Plants in general contain 3-5% N in their shoot tissue biomass, which is by far the most
abundant soil derived nutrient outside of oxygen, hydrogen and carbon. Plants absorb N from
the soil in the form of NO3- and NH4
+ ions. Most N uptake is in the form of NO3
-, which
moves from the soil solution into the plant root cell with absorbed water. NO3- is then either
stored in the vacuole or reduced in the cytosol and plastids eventually to NH4+
through the

12
activity of nitrate and nitrite reductase (NR, NiR) respectively. NH4+ can then be assimilated
to produce more complex N containing compounds (Lam et al., 1996). These compounds
include chlorophyll that captures light to be used during photosynthesis. N is also an essential
component of nucleic acids (DNA and RNA), amino acids, vitamins (e.g.: biotin, thiamine,
niacin and riboflavin) and all proteins and a vast array of N containing organic molecules.
N uptake by plant roots
The uptake of N-fertilizers occurs when N is readily available in the soil solution at the root
zone and when plant demand for N exists. When these conditions are met, NO3- and NH4
+
transporter systems (see below) are expressed across various cell types across the roots for
initial uptake and redistribution across the root to the stele (Daniel-Vedele et al., 1998; Tsay
et al., 2007). The form of N ion taken up by plants depends on the plant species and soil
properties including texture and chemistry. Plants that grow in low pH anaerobic soils, NH4+
or amino acids are often the preferred N form. In contrast NO3- uptake is more prevalent in
aerobic and neutral pH soils (Maathuis et al., 2009). N uptake by wheat has shown preference
between N forms, where net uptake was increased 35% when supplying at least 25% of the N
as NH4+
compared to all of the N as NO3- (Wang and Below 1992). It is assumed this
selectivity is partly a result of the energy costs required for NO3- assimilation relative to
NH4+. Assimilation of NO3
- requires the energy equivalent of 20 ATP per mol
of NO3
-,
whereas NH4+ assimilation requires only 5 ATP mol
-1 of NH4
+ (Salsac et al., 1987). This
energy savings could lead to more efficient N and C capture when plants are supplied with
greater amounts of NH4+
(Huffman et al., 1989).
N is a mobile element in the soil where its uptake from the soil solution is best met when
plant demand exists. The quantity and rate of N uptake is very much dependent on the ion
concentration in the soil solution, the availability of water which supplies the majority of N to
the roots through mass flow and the capacity of the roots (position and density) to enable
plant interception (Russell et al., 1977). Mass flow is a process where dissolved N ions in soil
water is delivered to the root based on the hydraulic pull of water to the plant as a result of
shoot evapotranspiration (Barber et al., 1984). The concentration of N in the soil solution
close to the root may be high or low depending on the balance between the rate of supply to
the root and the rate of absorption into the root. N can also diffuse to the root following a
concentration gradient from high to low, however the rate of diffusion is governed by
distance, thus diffusion only really becomes important close to the root surface. Root

13
interception is influenced by root density and surface area, which varies due to soil structure,
plant genetics and agronomy practice. Maximum root surface area enables greater capacity
for ion absorption from the soil solution and or soil particles (Barber et al., 1984).
N has a strong influence on root development in most plants. Plants tend to develop smaller
roots when N is readily available in the soil solution. Under these conditions it is the plant‘s
physiological capacity to accumulate and assimilate N through the activity of N transport and
assimilatory proteins rather than through changes in root morphology (Glass et al., 2003). At
low levels of N in the soil solution, many plants will commit extra carbon resources to further
develop root systems to enable greater penetration of the soil (Garnett et al., 2009).
However, increased carbon delivery to the root will have consequences on shoot biomass and
potentially yield penalties. Therefore, from a NUE context, traits that enhance N acquisition
(efficiency and activity) without increased demand on plant carbon to roots will be a
favourable direction in any NUE breeding or trait selection program (Fageria &Baligar 2005;
Hirel et al., 2007, Garnett et al., 2009).
Improving the ability of root systems to recover soil NO3−
by earlier and faster uptake is an
efficient strategy to improve the synchronization between the availability of NO3− in the soil
profile and the NO3−
demand by the wheat crop (Liao et al., 2004). This strategy states that
roots grow fast in order to intercept and capture the NO3- before it moves below the rooting
profile. Genotypic differences associated early root biomass, root branching and root length
have been linked to the early uptake of N in wheat genotypes that differ in overall vigour
(Liao et al., 2004; 2006). When N uptake occurs, both the xylem and phloem is involved in
transporting N in the plant. The xylem is the principle path for long distance transport of N
solutes (NO3- and NH4
+) from the roots to organs that transpire (Pate et al., 1980). The xylem
therefore transports NO3- from the roots to shoots in addition to N reduced to NH4
+ in the
roots (Schrader et al., 1984). The phloem is the principal transport path of N stored or
assimilated in the shoot and transported to other parts of the plant (i.e. leaf to seed) (Liao et
al., 2006).
Nitrogen transport proteins
NO3- and NH4
+ are predominant forms of inorganic N, and their movement from the soil into
root cells is dependent on at least two transport systems for each ion (Forde et al., 2000;
Howitt and Udvardi 2000). In Arabidopsis, the total influx of NO3- into the root is a result of

14
a combination of four additive influxes: constitutive high-affinity influx (cHATS), inducible
high-affinity influx (iHATS), constitutive low-affinity influx (cLATS), and inducible low-
affinity influx (iLATS) (Forde et al., 2000). High-affinity activities occur at low
concentrations of ions (10-250 µM) and low affinity activities occur at high concentrations of
ions > 250 µM. The uptake of NO3- occurs across the plasma membrane of epidermal and
cortical root cells via NO3- transporters encoded by two multigene families (NRT1 and
NRT2) (Glass and Crawford 1998). The NRT1 family relates to low-affinity transporters
(LATS) and belongs to the peptide transporter family (PTR), which consists of 53 genes in
the model plant Arabidopsis thaliana, 13 of which are experimentally proven to be functional
transporters of NO3-
(Tsay et al., 2007). The NRT2 family relates to high-affinity NO3_
transporters (HATS). In Arabidopsis, seven NRT2 genes have been identified (Tsay et al.,
2007) and are preferentially expressed in roots. In tomato, no LeNRT2 expression is observed
in whole shoots or leaves (Ono et al., 2000) while in tobacco (Nicotiana plumbaginifolia),
NpNRT2 transcripts are also detected at low levels in leaves, petioles, buds, flowers, and
seeds (Quesada et al., 1997). In Arabidopsis, RT-PCR using specific primers for AtNRT2.1
and AtNRT2.2 revealed that the expression of NRT2.1 and NRT2.2 in young
seedlings
appears 10 days after sowing, but is not detectable at earlier stages (Zhuo et al., 1999). These
experiments indicate that in Arabidopsis NRT2.1, NRT2.2 and NRT2.4, although expressed
at different levels, show similar patterns of root expression. In contrast, it seems that NRT2.7
is preferentially expressed in shoots, suggesting a role in leaf NO3
- uptake.
The uptake of NH4+
involves the transporter family AMT, which belongs to a larger group of
NH4+ transporters of the ammonium/methyl ammonium/Rhesus (AMT/Mep/Rh) family (von
Wiren & Merrick 2004). Heterologous expression of selected plant AMTs in (Xenopus
oocytes) indicate that they function as NH4+ uniporters that transport NH4
+ along an
electrochemical gradient (Ludewig et al., 2003). In Arabidopsis, six ATM genes have been
identified including (AtAMT1; 1 – AtAMT1; 5) and four genes in tomato and ten genes in
rice have been identified (Loque &von Wiren, 2004). In Arabidopsis, AtAMT1; 1 and
AtAMT1; 3 have been localized to the plasma membrane of epidermal and cortical root cells
and have shown to be responsible for 30% of the NH4+
uptake capacity (Kaiser et al., 2000;
Loque et al., 2006). Recent work has shown that AtAMT1;4 is predominantly expressed in
pollen and interestingly capable of enhancing NH4+ uptake when over expressed in roots of a
AMT deficient mutant (qko) ( Yuan et al., 2007).

15
Nitrogen assimilatory enzymes
Nitrate is the predominant form of inorganic N in agricultural soils and is therefore used by
many plant species. NO3- enters root cells where it is either stored in the vacuole or reduced
and incorporated into amino acids. N assimilatory enzymes which are linked to this N uptake
process in roots include nitrate reductase (NR); nitrite reductase (NiR) and the glutamine
synthetase (GS) / glutamine-2-oxo-glutarate aminotransferase (GOGAT) pathway. NO3- that
enters the cell can be reduced by NR to NO2-. NO2
- is toxic in the cell cytosol and is rapidly
transported into the plastid for further reduction to ammonium by NiR. Generated
ammonium then enters the glutamine synthetase (GS) and glutamate synthesis (GOGAT)
cycle where it is converted into glutamine and glutamate (Oaks et al., 1994; Lam et al.,
1996). Ammonium present in the cytosol of the plant cells can also be assimilated directly to
glutamine via GS activity and then used in a series of transamination reactions to produce
amino acids. Moreover, NH4+ is constantly being produced in leaf mitochondria during the
photorespiratory N cycle. This NH4+ pool is re-assimilated by glutamine synthesis (GS) in
the chloroplast or by Glutamate Dehydrogenase (GDH - is the primary route for the
assimilation of ammonia in plants) activity in the mitochondria (Cuturier et al., 2007). These
reactions are regulated by the GS/GOGAT pathway active in the chloroplast or cytosol of
plant cells. In leaves, these interactions are at the expense of primary products of
photosynthesis and compete with the reduction of carbon. In roots, stored or translocated
carbohydrates serve as the primary substrate for carbon and energy requirement of N
assimilation. Therefore, N assimilation seems to be different in roots and shoots (Oaks &
Hirel, 1985). A hypothesis that GDH plays an important role in controlling glutamate
homeostasis has been put forward. This function, which may have a signalling role at the
interface of C and N metabolism, may be of importance under certain phases of plant growth
and development when there is an important release or accumulation of NH3 (Terce-Laforgue
et al., 2004). Moreover, the major catalytic activity for GDH in plant cells has been reported
to be glutamate de-amination (Masclaux-Daubresse et al., 2006; Purnell and Botella, 2007)
and GDH activity was shown to be essential for plant survival in dark conditions (Miyashita
and Good 2008).
Nitrogen is mostly taken up during the vegetative phase of wheat phenological development.
N applied early in the season stimulates tillering and vegetative plant growth, while N applied
late in the season has a greater influence on the final N concentration in the grain (Fajersson

16
et al., 1961; Lütke Entrup & Oemichen 2000). Higher N use efficiency can be found when N
is applied late (at flowering) than it is applied early in the season (Raun & Johnson 1999;
Cassman et al 2002). N fertilizer rates and types and application times influence N indices
such as N uptake (Iqbal et al., 2005) and its translocation within the plant (Kichey et al.,
2007). Thus fertilizer application timing has a significant role in determining the quantity of
uptake and its use by the plant (Limaux et al., 1999). N in aboveground plant parts is actively
recycled and transported to the grain as the plants mature (Simpson et al., 1983; Cooper et al.,
1986). This redistribution of N from aboveground plant parts to grain has been broadly
studied (Austin et al., 1977; Van Sanford & MacKown 1987; Feller & Fischer 1994;
Fangmeier et al., 1999; Masclaux et al., 2001). The flow and amount of N redistributed to
developing seeds will vary depending on the source-sink ratio, which is regulated by the
weather (temperature, drought) and the inherent properties of the organs (Dalling et al.,
1976). It has also been suggested, remobilisation of N from the roots may play an important
role in the final N economics of the whole plant (Dalling, Boland & Wilson 1976; Simpson,
Lambers & Dalling 1983). Roots have been suggested to play a major role in assimilating N
when the crop is suffering N deficiencies in the shoot (Vouillot & Devienne-Barret 1999) that
is followed on by remobilizing N to the grain during grain filling.
Relationship to carbon metabolism
N assimilation is closely linked to carbon metabolism through the need of carbon skeletons
required for amino acid synthesis and energy equivalents (ATP and reductant) to power many
of the N assimilatory genes (Martin et al., 2002). A plants capacity to fix CO2 is highly
dependent on its N status as all of the proteins involved in light capture and fixation of CO2
contain large amounts of N. Rubisco alone consists of approximately ~ 50% of plants total
protein content. When N is deficient, these enzymes are often the first to show the affects of
N limitation, namely increased chlorosis. Sugars produced through photosynthetic CO2
assimilation are either stored (starch and or sugar) or respired. The breakdown of these sugar
molecules is important as they provide the building blocks for amino acid biosynthesis. Thus
all developmental processes from germination through flowering and seed development will
be strongly influenced by the balance between available C and N and how these two elements
can work together (Rolland et al., 2002). N is important for the assimilation of carbohydrates
in the plant and plays an important role in root growth for the absorption of other essential
minerals including K and P.

17
Other uses of N (i.e. NO3-)
Nitrate also has an important role as a signaling molecule in plant cells where its presence can
initiate the synthesis of both nitrate transport and assimilating enzymes (Crawford et al,
1995). Moreover, NO3- has an effect on carbohydrate metabolism where it influences the
relationship between both starch and sucrose synthesis and NO3- can also act as a counter ion
in the uptake and reduction of malate (Samuelson et al., 1995).
2.4 What is N Use Efficiency?
N use efficiency (NUE) of a crop plant refers to the relative balance between the amount of
fertilizer taken up and then used by the crop versus the amount of fertilizer supplied directly
or indirectly (Nielsen et al., 2006). In other words, NUE looks at fertilizer input recovery in a
production system to classify which plants do this better or worse when compared equally
based on production (yield). NUE is defined by many authors in the context of crop
production and the literature contains a number of different definitions depending on whether
authors are dealing with agronomic, genetic, or physiological studies (Good et al., 2004;
Fageria et al., 2008). Moll et al., 1982, first defined NUE as grain production per unit of
available N in the soil. This definition included two components; 1) N uptake efficiency (N in
the plant per unit of N fertilizer applied), and 2) N utilization efficiency (grain yield per unit
of N in the plant). A similar measurement was developed by (Semenov et al., 2007) who
defined NUE as the ratio between yield and the input of N minerals regardless of source
(NUE = Y/Ns), where Ns (kg/ha) is available N for the plant during the growth period,
including initial inorganic N in the soil, applied N fertilizer, and mineralized N from organic
N uptake during the growth period, and Y is grain yield (kg/ha). There are also alternative
definitions of NUE in the literature (Cassman et al., 1998; Tilman et al., 2002; Raun et al.,
2002) which along with the previous mentioned definitions are accompanied by considerable
disagreement of which NUE definition is best used and / or which is appropriate.
Moll et al., (1982) considered that N uptake efficiency (NupE) is the primary component
determining NUE when soil N supply increases. This is explained by N uptake exceeding the
critical value of N content in crop dry matter (Lawlor et al., 2001, Lemaire and Millard
1999). On the other hand, Ortiz-Monasterio et al., (1997) reported that N uptake is also an
important component of NUE under low N conditions. Both (Ortiz-Monasterio et al., 1997;
and Le Gouis et al., 2000) stated that NupE in wheat accounts for most of the variation in

18
NUE at low N availability. Ortiz-Monasterio et al., (1997) further defined NupE to include
harvest index (HI) and biomass production efficiency (BPE) affirming that HI is best
associated with NupE. Reductions in NUE as N supply increases could result from reductions
in any of the components, including NupE, NutE and N retention efficiency (NRE). Studies
on wheat and perennial grasses have shown various limitations in each of these components
(Cox et al., 1985; Dhugga and Waines 1989; Huggins and Pan 2003; Jiang et al., 2000;
Morris and Paulsen 1985; Oritz-Monasterio et al., 1997). For example, Oritz-Monasterio et
al., (1997) found that in all wheat varieties evaluated, both NupE and NutE were reduced at
higher N supplies, causing an overall reduction in NUE. Morris and Paulsen (1985) and Cox
et al., (1985) showed a reduction in N-translocation efficiency at high versus low N supply
(Dhugga and Waines 1989).
NUE can be partitioned into the individual components of NupE and NutE (Moll et al., 1982;
Oritz-Monasterio et al., 1997). NupE can be calculated as the total above-ground N per unit
of N supplied, including available N from soil or not. Therefore, organic matter N
mineralization plays an important role in the calculation of N uptake from the soil (Le Gouis
et al., 2000). However, Youngquist et al., (1992) suggested that when initial soil N contents
are equal, genotypic differences in NupE can be determined by measuring only plant N.
(Feil et al., 1992) indicated that cultivars producing large amounts of biomass seemed to have
a more efficient nutrient uptake, which could decrease the total NUE of modern cultivars.
Since N concentration is higher in leaves than in stems and sheaths, N uptake may be more
closely related to leafiness than to total shoot biomass (Feil et al., 1997). Moreover, genetic
differences in N recovery in the grain were mostly attributed to the net N uptake after
anthesis rather than of remobilized N (Suprayogi et al., 2011). Post anthesis N uptake was
found to be exponentially related to grain mass (Pan et al., 2006) but may vary with
environmental conditions, such as N and water availability (Baresel et al, 2008).
For this work we have used the definition of NUE proposed by (Moll et. al., 1982). We have
found this definition, which includes NupE and NutE, particularly useful in looking at genetic
differences in NUE among wheat cultivars grown at both low and high input N regimes. This
provides a framework for evaluating variation in N use among genotypes as related to major
physiological processes.

19
2.5 Strategies to Improve NUE
Cereals require N-fertilizers to produce maximum yields and high protein content (Ortiz -
Monasterio et al., 1997; Barraclough et al., 2010). However, NUE in cereals is generally
poor, where it is estimated 30-40% of the total of N-fertilizers applied is actually harvested in
the grain. The reminder of the applied N is lost to the soil, where often-excessive application
can affect natural ecosystems through N pollution. Loss of N also contributes to significant
direct economic losses to the grower particularly when N fertilizer costs are high (Raun and
Johanson 1999; Glass et al., 2003; Gruber and Gilloway 2008). It has been estimated that an
increase in NUE by one percent is worth as much as USD $234 million (Magen and Nosov
2008). Therefore, initiatives to improve NUE will be important in order to minimize both N-
fertilizer losses and the direct production costs of the crop. On the basis of field experiments,
(Cassman et al., 2002) reported N recovery in wheat varied from as low as 18 percent under
unfavourable weather to 49 percent under favourable weather conditions. One of the main
causes of low NUE in actual N management practices is the limited synchrony between N
soil availability and crop demand (Raun and Johnson 1999; Cassmann et al., 2002; Fageria
and Baligar 2005). Consequently, many different agronomic avenues are pursued to improve
NUE in cereal crops which includes: 1) Application of the correct dose of N-fertilizer and/or
application during growth stages when N is required; 2) Directed delivery of N to minimize
losses or maximize utilization, for example, banding or point placement close to the root; 3)
Use of cover crops, to retain organic matter and soil N in the soil; 4) Increased use of crop
rotations (shallow and deep rooted crops), such as wheat following legumes, and avoiding
wheat- fallow or wheat-wheat scenarios; 5) Use of modern farming techniques such as
conservation tillage to control weed, soil moisture, erosion, operation costs and environment;
6) Identifying the best sowing rate, spacing and depth for best use of soil water and fertilizers
and 7) The selection of wheat germplasm that produce larger seeds to ensure quick plant
establishment and access to available N at the young seedling stage. Alongside any
improvement in NUE related agronomy comparable improvements to plant germplasm must
also occur. NUE traditionally hasn‘t been a central driver in genetic improvement programs
that are driven by traditional breeding programs or marker based approaches including the
use of quantitative trait loci (QTL) analysis (Quarrie et al., 2005). Furthermore there is a
need to better understand N use in wheat, particularly the plant‘s capacity for mining N from
the soil and its efficient use once within the plant.

20
2.6 Plant and soil factors influencing NUE
As mentioned previously, cereal NUE can be as low as 30-40% due to a range of biotic and
agronomic-based factors. These include the primary growing conditions that influence overall
photosynthesis and plant respiration such as day/night temperatures (Yoshida et al., 1982)
and the amount and timing of precipitation (Kravcheckov et al., 2003). High-yielding
varieties will often demand larger amounts of N fertilizer to meet expected yields or to
improve grain quality (higher protein content). While pest and disease pressure will often
affect demand for N, this can consequently reduce yield and NUE. Furthermore, the type of
plant also has a dramatic impact on NUE. In general, cereal crops have higher N recovery
efficiency (REN) than root crops, which in turn have a higher REN than leafy vegetables
(Balasubramanian et al., 2004).
The impact of N fertilization on crop plants is very much influenced by the cycling of N
between inorganic and organic forms and the relationship between the N present in the air,
water and soil fractions. This transition of N activity is referred to as the N cycle, which
describes the different forms and stages that N exists in the air, soil, water and the biological
continuum. N is never lost completely in the cycle, but merely changes its form and
availability (Mosier et al., 2004 and Smil et al., 1999) (Figure 2.1). The predominant changes
include: (1) Ammonification which is the process where organic forms of N are converted to
ammonium (NH4+). Soil organisms (bacteria and fungi) carry out the majority of
ammonification. The organisms receive carbon, N and energy from the breakdown of organic
matter, while excess N is released; (2) Nitrification is the process involving the conversion of
NH4+ to nitrite (NO2
-) and then to nitrate (NO3
-). Soil organisms involved in nitrification
processes get energy from the chemical transformation of NH4+ to NO2
-; (3) Denitrification is
the process where NO3- and NO2
- are converted into gaseous N (NO2, N2) by microorganisms.
Denitrification occurs mainly when there is little or no oxygen in the soil (e.g: soil is
waterlogged). However, denitrification process stops when soil dries; (4) N2 fixation is the
conversion of N gas (N2) to NH4+, either by free living bacteria in soil or water, or by bacteria
in symbiotic association with plants (e.g: legume symbiosis); (5) N immobilization is the
process whereby N is incorporated into microbial cells and effectively ‗tied-up‘ in the
'microbial pool' of N. Immobilisation occurs in parallel with ammonification.

21
Figure 2.1: The global N balance in crop production (adapted from Mosier et al., (2004), and
Smil et al., (1999). The figures are in Tg (1012
g) per year. Leaching (37 Tg) includes runoff
and erosion losses; ammonia volatilization (21 Tg) includes volatilization from soil and
vegetation.
Thus N cycling has a significant impact on the quantity and supply of N to the plant. A
significant component of the N cycle involves soil-based microbial activity. This process is
strongly influenced by the availability of organic C in the soil, which is used as a primary
microbial energy source (Stevenson et al., 1994). Application of organic material or crop
residues with high C: N ratios to the soil can stimulate microbial N immobilization, a process
where available NH4+ and NO3
- is competitively used by microbes. This process can reduce
crop yield unless N is supplemented with applied fertilizers (Van Lauwe et al., 2002). Soil
based constraints can also promote or decrease microbial based N cycling activities including
denitrification, ammonia volatilization (Mosier et al., 2001a; Schlesinger et al., 1997). Excess
water in poorly drained soils results in anaerobic conditions, which directly affects the rate of
denitrification by nitrifying bacteria. This promotes an accumulation of NH4+ in the soil
solution (van Kessel et al., 1993). The rate of volatilization of fertilizer N is then largely
controlled by the pH and NH4+ content of the soil (Vlek and Craswell 1981).
22
2.7 Managing N use
Nitrogen is a dynamic and highly mobile element in agricultural soils causing environmental
problems through increased N pollution that acts both locally and globally (Glass et al., 2003;
Gruber and Galloway 2008). The extensive use of N-fertilizers in agriculture has created
major problems worldwide through N based pollution of surface and underground water
supplies. Therefore, concentrations of NO3- in agricultural products and drinking water
should be minimized. Although the fact that the main source of NO3- intake is food, not
water, the World Health Organization (WHO, 1970, modified in 1993) set a recommended
limit for drinking water of 50 mg NO3- per litre. The main issue was the microbial
conversion of NO3- to nitrite (NO2
-), which was associated with problems involving
nitrosamines and methaemoglobin. The so-called ―blue-baby syndrome‖
(methaemoglobinaemia), for example, arises from bacteria-contamination and not from
ingesting too much NO3- as originally supposed. Recent work even suggests that ingested
NO3- provides gastro-intestinal protection against food-borne pathogens and ―epidemiological
studies show a reduced rate of gastric and intestinal cancer in groups with a high vegetable
based nitrate intake‖ (Leifert and Golden 1997). Elevated concentrations of nitrate in streams
or aquifers are mostly due to excessive or poorly used N applications in agriculture. High
NO3- concentrations in water also occurs in years following drought. High NO3
-
concentrations in forage can cause sickness and death in livestock when grazing due to NO3-
accumulation in plant tissue. The accumulation occurs due to high temperature, drought,
other nutrients deficiency and plant disease (IFA, 2007).
Urea is a common N fertilizer used in agriculture systems worldwide. It is estimated that
more than half of all fertilizer used globally is in the form of urea (Gilbert et al., 2006). The
benefit of using urea as a fertilizer is due to its high N content (≈ 46% N), high solubility, and
low expense to manufacture, store, and transport (Prasad et al., 1998). However, urea is
susceptible to hydrolysis followed by ammonia volatilization (Fenn and Hossner 1985).
During hydrolysis, urea N is converted into NH3, which subsequently reacts with a proton to
produce NH4+. Under alkaline conditions, the equilibrium of NH3 + H2O ← → NH4
+ + OH
-
shifts more to the NH3 ion, increasing volatilization losses that leads to lower the efficiencies
of fertilizer N used by plants. Soil texture and organic C content can also play an indirect role
in N gaseous loss. For example, soils with high sand content generally have lower rates of
N2O production than do clay soils (Corre et al., 1996). Leaching intensity is controlled by

23
soil texture. Lighter sandy soils are more prone to leaching losses than are soils with greater
clay content (Hack-ten Broeke and de Groot 1998).
N sustainability
Globally farmers often apply an excess of N as insurance against low yields. This approach
can lead to increased losses of N from agriculture systems and poor NUE in plant production
systems (Dobermann and Cassman 2004; Goulding et al., 2004). One of the challenges for
plant breeders will be to increase NUE in a manner that will reduce production costs and
minimize environmental pollution while at the same time meeting both yield and quality
measures (Daberkow et al., 2000).
More sustainable agricultural practices that manage N-delivery and its use across a crop
production cycle are currently highly sought. For example, the use of split N application
procedures, where delivery occurs at a time when plants need N during their life cycle will
help to achieve improved NUE that reduces N loss while sustaining or improving yield and
quality (Matson et al., 1998). In light of the growing concern about N fertilizer use and its
direct economic costs and impacts on the environment, most nations are investigating
alternative strategies to make agriculture more sustainable. A reduction in the amount of N
fertilizers applied to the field will help to achieve this but at the same time there is a
requirement to maintain and or increase yield to meet future food demand. Sustainable
agricultural practices, such as N-fertilization based on demand, effective use of crop rotations
with N-fixing legumes and the establishment of ground covers and burial of N-rich crop
residues are encouraged (Hirel et al., 2007). Others strategies to improve N efficient use are
to use genetic modification and/or to breed for new varieties that take up more organic or
inorganic N from the soil N and utilize the absorbed or metabolized N more efficiently
without compromising yield (Hirel and Lemaire 2006).
Nitrogen and the relationship between yield and grain protein in wheat
Nitrogen is one of the most limiting elements in natural ecosystems (Vitousek et al., 2002)
and in most non-fertilised agriculture will limit potential yield. As a consequence, N
fertilizers are applied in order to increase yield and improve crop quality. Wheat plants
respond favourably to N-fertilization which commonly consists the addition of NH4+, NO3
- or
urea alone or in combination with each other. When soil N is low, N fertilizers are often
supplied to meet plant demand to maintain yields in most crops. However, when N is applied

24
in excess, it can often have a detrimental effect on yield due to increased vegetative growth
relative to seed production, increased lodging and increased susceptibility to disease and
haying-off (van Herwaarden et al., 1998). Although N can be detrimental when used in
excess, the proper timing of N fertilizer application and its utilization is important in the
context of maximizing growth, yield and quality. Wheat N requirements are greatest during
the rapid vegetative growth stages and will most likely benefit from N application/availability
during this period.
Grain yield and grain protein content are ultimately determined by the amount of N fertilizer
application and its effective uptake from the soil solution. When N becomes available to the
plant, primary N uptake seems to be the most promising strategy to enhance the amount of N
within the plant to increase both yield and grain protein. This is further supported by the fact
growers traditionally benefit from higher returns when grain protein content is high. For
wheat, maximum N uptake occurs after tillering and before flowering. N accumulated during
these growth stages is used primarily to establish yield potential. N accumulated after
flowering has little effect on yield but can increase grain protein content under favourable
conditions (Flowers et al., 2007).
Variety selection that takes into accounts both quantity and quality must be adhered to when
considering sustainable N management systems. The N harvest index (NHI) is the ratio of
seed N to total shoot N and is considered to be a good measure of how efficiently the plant
utilizes acquired N for the production of grain protein. However, the total shoot N stored in
the grain can vary widely (from 40 to 90%) due to the variation of seasonal precipitation,
temperature, wheat species and the type of farming practice. Drought in particular is a
significant problem to rain-fed production systems when fertilizer enhanced canopy size
becomes a detriment during final seed growth and filling. This response suggests grain
protein content has limited genetic heritability that can be actively selected for across a range
of growing conditions (Feil et al., 1997). This makes increasing protein concentration a
difficult breeding goal (Blackman and Payne 1987). Seed protein cannot adequately form
without available N; therefore, a supply of N is a prerequisite for high protein yield. I would
assume the best strategy forward is to deal with multiple abiotic stress-related traits together
where drought tolerance for example is selected alongside N reallocation to developing seeds.

25
2.8. N and wheat production
Like most cereal crops, wheat is very sensitive to poor N nutrition but very responsive to N
fertilization. Wheat is a fast growing crop where high levels of available N in the soil are
often required to meet plant demand. When soil N is low, yield is often reduced due to a
reduction in plant vegetative growth (tillering). N deficiency symptoms in wheat are typical
of most plants where older leaves yellow (due to less chlorophyll content). Plant demand for
N is often met using crop rotations with N2-fixing legume crops where legume/wheat
rotations depend on less N-fertilizer than wheat/wheat or wheat/rice (cereals) rotations.
Increased crop productivity has been associated with a 20-fold increase in the global use of N
fertilizer over the past five decades (Glass et al., 2003). N-fertilizer use is expected to
increase by at least 3-fold by 2050 (Good et al., 2004). In Australia, total N-fertilizer use was
approximately 723,000 tons in 1997 (Jenkinson et al., 2001) and increased in use close to
793,888 tons in 2007 (FAO, 2010). N-fertilizer consumption in Australian agriculture system
increased steadily during 1990 and in many cases replaced biological N fixation by pasture
legumes as a source of N (Angus et al., 2001). Most wheat production involves N fertilizer
application before or at sowing or 6 to 8 weeks after sowing (McDonald et al., 1992). N is
available in most soils in the inorganic forms as NO3-, NH4
+ and N2 and in the organic form
as amino acids and urea (Crawford and Glass 1988). The dominant form of N used by higher
plants is often NO3- which is common in warm, aerated and pH balanced agricultural soils
and natural ecosystems (Crawford and Glass 1998). NH4+ on the other hand is found in cool
soils with low pH and or under anaerobic conditions (i.e. irrigated rice fields (Kronzucker et
al., 1999). Thus depending on the soil conditions plant access to N will vary as will
selectivity among different plant species (Marschner et al., 2002).
The most common fertilizer used in Australian is urea as it is a cheap form of dry fertilizer
and is effective when broadcast, followed by rain after application. N fertilizer application
often develops initial root systems that lead to the growth of vigorous root systems that
recover N fertilizer and N from the soil than can the root system of an unfertilized crop
(McDonald et al., 1989). N uptake depends on root architecture and available soil moisture,
so topdressing of N-fertilizer (e.g. urea as used in this project) depends on soil moisture
(rainfall) to be present soon after N application. The demand of N-fertilizer by plant at early
growth stage is small because plants are young and rely on residual N in the soil. N demand
will increase when plants develop into their later stages of development and maturity, this

26
demand will be met with additional applications. The plants reach peak demand at tillering,
heading and grain filling stages. When there is insufficient N at the seedling stage there is a
reduction in tillering (increased tiller mortality) and loss of soil water from evaporation, while
excessive seedling N causes lodging, foliar diseases and haying-off (van Herwarden et al.,
1998). I believe, the use of split application methods that correspond to plant demand at
different growth stages is an important strategy that improves N use (NUE) by plant and
reduces N loss as a result of volatilization, denitrification or leaching (Kichey et al., 2007;
Ehdaie et al., 2010).
Evidence for genotypic or environmental variation in N use in wheat
Many studies have compared crop performance (e.g. yield, quality, NUE) under various
fertilizer and management regimes across different environments and growing locations.
Unfortunately significant genotype X environment (G X E) interactions exist across the
majority of these data sets which are often compounded by differing research methods,
management practices, and calculations of NUE (Huggins and Pan 2003; Van Sanford and
MucKow 1988). This complicates the development of a general interpretation of how wheat
responds to N and the traits, which need to be improved upon to enhance NUE with yield and
quality components intact. However, a number of studies have indicated there is genetic
diversity amongst wheat lines in their response to low or high levels of N fertilization. For
example, Presterl et al., (2003) examined the genotypic variability related to NUE in wheat
and showed that some genotypes grew well under low N supply while others didn‘t. Oritz-
Monasterio et al., (1997) found that in all wheat varieties evaluated, both NupE and NutE
were reduced at higher N supply, causing an overall reduction in NUE. Le Gouis et al.,
(2000) found that the genetic variability in grain yield of wheat grown varieties at low N was
significant. A recent report by (Quarrie et al., 2007) indicates strong QTLs for yield under
low N fertilization conditions exist in hexaploid wheat, and suggests the possibility to
improve yield stability by combining QTLs related to yield that are expressed in low N
environments. Genetic differences in N uptake and/or grain yield per unit of N applied has
also been reported in different crops including wheat, rice, maize, sorghum, and barley
(OrtizMonasterio et al., 1997; Muchow et al., 1998; Le Gouis et al., 2000; Presterl et al.,
2003; Anbessa et al., 2009; Namai et al., 2009). Under low N supply, a number of studies
have indicated modern cultivars had higher yields than old cultivars (Ortiz-Monasterio et al.,
1997; Muurinen et al., 2006; Brancourt-Hulmel et al., 2003; Foulkes et al., 1998).

27
2.9 NUE and Wheat production
The improvement of NUE in wheat is a major challenge necessary to ensure sustainable
yields and food security worldwide (Raun et al., 2002). Various alternative production
practices have increased NUE relative to more standard high-input cropping practices. For
example with crop rotations, the NUE of wheat following a legume is significantly improved
than wheat-fallow or wheat-wheat cycles (Badaruddin and Meyer 1994). Similarly, in dry
land systems, growing spring barley, corn, and winter wheat in rotation with adequate N-
fertilization instead of continuous wheat-fallow improves overall NUE. This suggests that
improvements in NUE from crop rotations are due partially to the presence of excess mineral-
N in the soil, which minimizes the requirement for N-fertilizer inputs and their associated
losses (Halvorson and Reule 1994). It has also been shown that changes to the availability of
N to the plant at critical developmental stages can improve NUE. Low rates of N application
at tillering followed by higher rates during later stages of shoot development will improve
NUE in wheat (Blankenau et al., 2002). Studies have also shown that NUE is higher in tall
wheat varieties for dry matter production and in dwarf-wheat varieties for grain production
(Singh and Arora 2001). NUE with a high harvest index (dry biomass) and low forage yield
were observed in winter wheat varieties (Kanampiu et al., 1997). It was confirmed that
adaptation of subsurface placement of N-fertilizer with no-till for winter wheat improved
NUE (Rao and Dao 1996). Recently, studies on NUE improvement have been done in
modern wheat varieties and have shown an increase in NUE of 14% to 18% in modern UK
varieties in response to N supply (Sylvester-Bradley et al., 2009) while other studies showed
24% to 29% increase in NUE in Spanish modern wheat (Acreche et al., 2009). It is important
to note though, the differences in NUE reported above were mostly determined by yield
responses and not with increased concentrations of N in the plant. Sylvester-Bradley &
Kindred (2009) reported that yields of winter wheat in England increased strongly, but NUE
only increased slightly from 20 to 24 kg DM. kg-1
N over the last three decades. They
concluded that NUE improved more through better resource capture than physiological
conversion. Moreover, improvements in NUE can also be due to a reduction in cereal
diseases that leads to a more vigorous and healthy root system (WWW.hgca.com). Thus,
improvements were more dependent on agronomic measures than breeding for enhanced
NUE.

28
2.10. Evidence of NUE productivity
Identifying productivity and quality traits ultimately requires genetic variability to be present
amongst parental lines and selections. Evidence of directed genetic improvement of NUE is
limited (Kamprath et al., 1982). However, several co-localizations between physiological
traits, agronomic traits, and candidate genes were identified in maize, rice and wheat, all
related directly or indirectly to the capacity of the plant to take-up or utilize N at a particular
stage of its developmental cycle. QTLs from each of these cereals have linked yield and the
genes encoding cytosolic GS or leaf GS activity. In maize, Hirel et al., (2001) found that one
QTL for thousand kernel weight was coincident with GS1.4 (Gln1-4 locus) and two QTLs for
thousand kernel weight and grain yield were coincident with GS1.3 (Gln1-3 locus). Such
strong coincidences are consistent with the positive correlation observed between kernel yield
and GS activity (Gallais and Hirel 2004). In rice, a co-localization of a QTL for GS activity
and a QTL for one-spikelet weight was identified (Obara et al., 2001). In wheat, QTLs for GS
activity were co-localized with those for grain N content (Habash et al., 2007). These three
studies confirmed previous hypotheses on the key role of the enzyme GS in plant productivity
that arose from either whole plant physiological studies, or genetic manipulations (Andrews
et al., 2004; Good et al., 2004). In addition, there is evidence of genetic intra-specific
variability for NUE in many annual species, including rice (Broadbent et al., 1987), wheat
(Le Gouis et al., 2000), and maize (Bertin and Gallais 2001). Previous studies have shown
significant differences in NUE improvement among rice genotypes grown in tropical (Tirol et
al., 1996), subtropical (Ying et al., 1998), and Mediterranean environments (Koutroubas and
Ntanos 2003). NUE improvements have also been observed in dry land systems including
spring barley (Hordeum vulgare L.) corn (Zea mays L.) and winter wheat (Triticum aestivum
L.) when grown in rotation with adequate N fertilization instead of continuous winter wheat-
fallow (Halvorson and Reule 1994). Modern barley genotypes have recently showed
improved NUE with increased yields without the need for elevated N application rates
(Sylvester-Bradley et al., 2008). In this study it was confirmed that NupE and NutE play a
role in improving NUE in the barley. This result is similar to that in maize, where at low N,
the genetic variation in NUE for maize related to NutE while at high N, genetic variation in
NUE was related to a mix of N uptake and N utilization efficiencies. (Moll et al., 1982).

29
2.11. Aims/Objectives of the project
This project aim was to:
Examine the growth response of wheat varieties to low and high N application rates
Identify genotypic differences in NUE across wheat lines
Provide information for future research.

30
CHAPTER 3
Influence of N fertiliser on growth and seed yield of field-grown wheat varieties
3.1. Introduction
Numerous studies have investigated the growth response of wheat lines to different N levels
with an aim to show if genetic variation exists in NUE traits including N uptake, N
redistribution and N utilisation. A study by (Austin et al., 1977) reported large differences in
total N uptake across 43 genotypes of T. aestivum. In contrast, (Norman et al., 1992) reported
that wheat lines differing in height and canopy architecture (aerial growth) displayed similar
total N uptake capacity. While (Guindo et al., 1994) reported that the response to different N
application rates was only associated with excessive plant growth at high N rather than with
improved plant uptake and/or retranslocation within the plant at lower N supply rates.
This study was conducted to investigate if genotypic differences in NUE exist amongst
common wheat cultivars grown in South Australia. Three independent field trials were
conducted in 2010 at Mintaro, Pinnaroo and Tuckey, South Australia. The trials involved the
use of 6 wheat cultivars (Excalibur, Frame, Gladius, Kukri, Mace and RAC0875). Excalibur,
Gladius, Kukri and RAC0875 were chosen as they are four parents of a mapping population
that are extensively studied in South Australia for N-related traits, and Frame and Mace have
previously been shown to have contrasting N responses in the field (M. Okamoto, personal
communication). The selected varieties were cultivated under four levels of increasing
exogenous N fertilizer supply (0, 50, 100, and 150 kg Urea / ha). The effect of N fertiliser
application was measured based on various plant growth measurements including final grain
yield.
3.2. Materials and Methods
Field Site and Environmental Conditions
Field experiments were conducted by Australian Grain Technology (AGT) in South Australia
at three locations Mintaro, Pinnaroo and Tuckey in South Australia during the 2010 cropping
season. During the trial, South Australia recorded its 3rd wettest year on record, with the
state-wide area average precipitation totalling just over one and a half times the long-term
annual average. Almost every month had average to above average rainfall across South
Australia. For the growing season (May to November) rainfall was above average of 500.8
mm and the mean temperature was 19.5°C; this being equal to the average temperature for the

31
standard climatological base period of 1961 to 1990 (South Australian Climatic service
Centre Bureau of Meteorology). Where rainfall at Pinnaroo (Murray region) was 280 mm, at
Mintaro (Clare valley) it was 402 mm, at Tuckey (Eyre peninsula) it was 278 mm from 1st
Jun – 30th
November 2010 (www.bom.gov.au) ( Appendixes 1, 2, and 3). Six spring wheat
(Triticum aestivum) cultivars were used (Excalibur, Frame, Gladius, Kukri, Mace and
RAC0875) across the three sites. Planting occurred on the 27th
of May, 4th
of June and 15th
of
June at Tuckey, Pinnaroo and Mintaro, respectively.
Experimental data was collected separately for each of the three sites through the 2010
growing season. Unfortunately heavy rain disrupted continual access to field sites in Pinnaroo
and Tuckey, while Mintaro remained mostly accessible. We collected data to compare plant
height (cm), grain yield (g/m2), 1000 grain weight (g), spike number/(m
2), grain %N and
%grain protein, total biomass (g), harvest index (HI), and nitrogen use efficiency (NUE).
Individual data sets were analysed using two-way analysis of variance (ANOVA). When
significance was evident in the data, least significant differences (LSD) was applied at 5%
probability level to evaluate differences between N treatment means within cultivars.
Field Trial Design
The field trials were designed by Australian Grain Technology (AGT) with 24 wheat
varieties including the six cultivars of our interests as mentioned above (Appendix 8). A split-
plot, randomised complete-block-design (RCBD) was applied, consisting of 12 ranges and 24
rows with four N fertilizer rates. Wheat genotypes were in sub-plots to minimize border
effects from the different N fertilizer rates with three replicates for each cultivar and N
treatment (Figure 3.1). Thus, we focused on 72 plots each site (6 wheat cultivars and 4 N
treatments with 3 replicates) (see Figure 3.1 for field trial design). The net size of a split-plot
was 1.2 m wide x 3.2 m long consisting of 5 X 20 cm seeding lines. Seeding rate was 150
seeds /m2 and planting depth was 2 cm.

32
Ranges
Rows 1 2 3 4 5 6 7 8 9 10 11 12 Nitrogen
treatments
1 M K F N1
2 E G R N1
3 K G F R N4
4 M E N4
5 K E N3
6 F R M G N3
7 N2
8 E M K R F G N2
9 G M E R N3
10 K F N3
11 F M K N2
12 G R E N2
13 E K M N4
14 G F R N4
15 G E N1
16 M R K F N1
17 F N4
18 E R K M G N4
19 F R M K N3
20 G E N3
21 E N1
22 K G M R F N1
23 G E F K R N2
24 M N2
Figure 3.1: Field trial design.Trial includes 12 ranges and 24 rows, selected six wheat
varieties from 24 varieties, using three replicates for each of the cultivars and for the four
rates of N-treatments, cultivars are: (E) Excalibur, (F) Frame, (G) Gladius, (K) kukri, (M)
Mace, (R) RAC0875. The N-treatments are: (N1=0, N2=50, N3=100, N4=150 kg urea / ha).
Nutrient Fertiliser Remediation
An initial soil test was conducted by AGT across each site to calculate the level of available
nitrogen (NH4+-N and NO3
- -N) and other chemical and physical characteristics of each of the
three sites in(Appendix: 5). With this information, a basal fertilizer 90 kg/ha of (di-
ammonium phosphate (DAP) consisting of nitrogen 16% N) was applied at Mintaro,
Pinnaroo and Tuckey. For each site the plants were provided four levels of N-fertiliser above
the basal fertiliser amount (0, 50, 100 and 150 kg urea/ha) at sowing. Urea (46% N) was used
as a source of N at the three sites.

33
Plant Growth, Harvest and Processing of Tissues for total N analysis
Plant growth measurements were taken at harvest and tissues collected. Plant analysis
included:
1. Plant height (cm) at maturity, ten plants was selected randomly in each split-plot for
height measurement and means were taken for statistical analysis.
2. Total biomass at harvest were taken for each split-plot at 0.6 m2, bagged and weighed
after being air-dried.
3. Yield components recorded for each split-plot included, grain yields per 0.6 m2 -
converted to g/m2, 1000-grain weight (g), head numbers.
4. Grain nitrogen content was measured by gas chromatograph connected to an isotope
ratio mass-spectrometer.
5. Estimates of grain protein content based on %N measurements.
The crop was harvested individually per 0.6 m2
plot by hand in December 2010 and the
samples were bagged and air-dried. Grain and dry matter were prepared by threshing spikes
and shredding aerial foliage. Sub-samples (5 g) of each were dried in an oven (40°C) for 48
hours. Tissues were ground to a fine powder using a grinder machine (Labtech Essa –
LABTECH ESSA LM1- PTY. LTD), grain N% was determined from a 3-4 mg subsample of
each replicate. Tissues were transferred into tin capsules and processed through an Isotope
Ratio Mass-spectrometer (SerCon Hydra 20-20) operated by the analytical service laboratory
at the Plant Research Centre, Waite Campus, University of Adelaide. Grain protein content
was estimated by multiplying total grain %N content with the wheat global standard factor of
5.71 (Lopez-Bellido et al., 2004).
Statistical analysis
The data was analysed using a split-plot two-way general ANOVA (Genstat) to test for
significant differences between cultivars and nitrogen treatments across the three sites.
Nitrogen treatment, cultivar and nitrogen x cultivar effects were tested for significance
(p<0.05). Multiple comparisons (least significant difference, protected) were then tested post-
hoc across main effects or when significant interactions existed between nitrogen and cultivar
treatments.

34
3.3. Results
Plant height (cm)
At both Mintaro and Tuckey (Pinnaroo was not assessed) there was no significant interaction
between cultivar and N treatment on final plant height (P=0.977 and 0.687, respectively - see
Appendix 4). At each site, plant height did vary between cultivars but plant height only
varied with N-treatments at Tuckey (Fig 3.2 A, B).
Plant head number (spikes) (m2)
At the Mintaro and Pinnaroo sites (Tuckey was not measured) there was no interaction
between N treatments and cultivars (P=0.199 and 0.059, respectively – Figure 3.3 A, B and
see Appendix 4). At Mintaro, there was significant variability for the cultivar main effect but
not at Pinnaroo (P=0.030 and 0.059).
Grain Yield (GY) (g /m2)
At all three sites there was no significant interaction between cultivars and N treatments to
grain yield (P=0.623, 0.276 and 0.733, respectively – see Appendix 4). At Mintaro and
Tuckey, grain yield responded to N treatment as a main effect while all three sites displayed a
cultivar main effect (Figure 3.4).
Thousand Grain Weight (TGW) (g)
There were no significant interactions between cultivar and N treatments to TGW at each of
the three sites (P=0.392, 0.460, 0.071, respectively – see Appendix 4). At all three sites both
Nitrogen and Cultivar showed variability in TGW (P<0.05) (Fig 3.5).
Total Grain Nitrogen (TGN) (%) and calculated % protein
Grain quality (N and protein) is an important component of final grain yield and its final
commercial value. Across all three field sites there was no significant interaction between
cultivar and N treatment (see Appendix 4) to both TGN and the calculated %protein. Overall
main effects to N were found at Mintaro but not across Cultivars at the three sites Figures 3.
6, Figure 3. 7).
Total biomass (g / m2)
Total biomass is the total weight of the above ground parts of the plant including, grains,
stems (tillers), and leaves harvested per unit area. Across all cultivars at both Mintaro and
Pinnaroo (Fig 3.8 A, B) shoot biomass per harvested area did not vary with N treatments (P>

35
0.05, Appendix 4). Unfortunately, total biomass data was not collected at Tuckey because of
heavy rains.
Harvest Index (HI)
Harvest Index is the ratio of grain yield to above ground total biomass produced in a defined
unit of area. At both Mintaro and Pinnaroo (data not collected from Tuckey) there was no
interaction between nitrogen treatment and wheat cultivars (P>0.05) (Fig 3.9 A, B),
(Appendix 4)
Nitrogen Use Efficiency (NUE)
In this study, we adopted the NUE definition proposed by (Moll et al., 1982). Nitrogen Use
Efficiency (NUE) is referred to as grain yield produced per unit area of available N in the soil
(residual N + applied N) in the same unit of area.
NUE = GY (kg / ha) ÷ (residual N + applied N) (kg / ha)
Residual N in the field soil was calculated on the base of the equation below:
Available soil N in kg/ha = nitrate (mg/kg) × bulk density of soil (g/cm3) × test depth/10
(www.bcg.org.au) (Appendix 6).
Soil bulk density values are known for various soil types (www.bettersoils.com.au), and are
shown in (Appendix 7).
Across the three sites, the variation across both cultivars and N treatments was found to be
significant (P<0.05, Appendix 4). Like all other assays measured, there was no significant
interaction between N and Cultivar (P>0.05). With most cultivars and across each of the
sites, NUE decreased with increased N application (Figure 3.10 A, B, C). This is a common
result associated with the equation we used to calculate NUE. A comparison was made across
sites where NUE at N1 vs. N2 (N4/N1), N1 vs. N3, N1 vs. N4) was calculated for each
cultivar and averaged across the three trial sites (Figure 3.11). In theory those cultivars
where NUE remains elevated at higher external N may suggest an improved capacity to grow
and utilise N, potentially a higher NUE capacity. In the majority of cultivars we found no
significant change in NUE maintenance as external N increased, with the exception of Mace
(NUE2 vs. NUE4, P<0.05) which had a significant drop in NUE capacity at elevated N (Fig
3.12).

36
3.4 Summary
There were difficulties in identifying lines which consistently performed well across the three
field trials. In general, we found little differences between the field sites in Grain %N in
response to increasing N provision (Figure 3.6). Grain yield at both Pinnaroo and Tuckey was
vastly different from that of Mintaro achieving only ~50% of the Mintaro grain yield and
shoot biomass at Pinnaroo was approximately half that of the Mintaro site. The result further
highlighted the strong impact of the poor growing conditions at Pinnaroo and Tuckey which
overrides the potential impact of increased N provision. Although, at the Tuckey site, the
results showed that all cultivars responded more in grain yield to N treatments compared to
the other two sites (Figure 3.4C). Also noticeable N response in grain N observed in Pinnaroo
(Figure 3. 6B).
In general, NUE was at its highest level at N1 and decreased sharply as N fertiliser
application rates increased up to and including N4 (Figure 3.10). The data also suggests there
was little change in NUE capacity between varieties across the three field sites.

37
0
50
100P
lant heig
ht (c
m)
N1
N2
N3
N4 A
Ex
ca
lib
ur
Fra
me
Gla
diu
s
Ku
kri
Ma
ce
RA
C0
87
5
0
5 0
1 0 0
Pla
nt
he
igh
t (c
m)
N1
N2
N3
N4 B
Figure 3.2. Plant height (cm) of wheat varieties affected by N treatments.
(A) - Mintaro, (B) - Tuckey. Data represents mean ± SE (n=3).

38
He
ad
Nu
mb
er
(m-2
)
0
2 0 0
4 0 0
6 0 0
8 0 0
1 0 0 0N1
N2
N3
N4 A
Ex
ca
lib
ur
Fra
me
Gla
diu
s
Ku
kri
Ma
ce
RA
C0
87
5
0
1 0 0
2 0 0
3 0 0
4 0 0
5 0 0
He
ad
Nu
mb
er
(m-2
)
N1
N2
N3
N4 B
Figure 3.3. Head number (spikes) of wheat varieties affected by N treatments.
(A) - Mintaro, (B) - Pinnaroo. Data represents mean ± SE (n=3).

39
Gra
in Y
ield
(g/m
2)
0
500
1000
1500N1
N2
N3
N4 A
Gra
in Y
ield
(g/m
2)
0
200
400
600N1
N2
N3
N4 B
Ex
ca
lib
ur
Fra
me
Gla
diu
s
Ku
kri
Ma
ce
RA
C0
87
5
0
2 0 0
4 0 0
6 0 0
Gra
in Y
ield
(g
/m2)
N1
N2
N3
N4 C
Figure 3.4: Grain yield affected by different N treatments. (A) - Mintaro,
(B) - Pinnaroo, (C) - Tuckey. Data represents mean ± SE (n=3).

40
10
00
gra
in w
eig
ht
(g)
0
2 0
4 0
6 0
8 0N1
N2
N3
N4A
0
2 0
4 0
6 0
8 0
10
00
gra
in w
eig
ht
(g) N1
N2
N3
N4B
Ex
ca
lib
ur
Fra
me
Gla
diu
s
Ku
kri
Ma
ce
RA
C0
87
5
0
2 0
4 0
6 0
8 0
10
00
gra
in w
eig
ht
(g) N1
N2
N3
N4 C
Figure 3.5. Effect of N treatments on thousand grain weight (TGW) of wheat cultivars.
(A) - Mintaro, (B) - Pinnaroo, (C) - Tuckey. Data represents mean ± SE (n=3).

41
0.0
0.5
1.0
1.5
2.0
2.5
Gra
in N
(%
)
N1
N2
N3
N4 A
0
1
2
3
4
Gra
in N
(%
)
N1
N2
N3
N4 B
Ex
ca
lib
ur
Fra
me
Gla
diu
s
Ku
kri
Ma
ce
RA
C0
87
5
0 .0
0 .5
1 .0
1 .5
2 .0
2 .5
Gra
in N
(%
)
N1
N2
N3
N4 C
Figure 3.6. Effect of N treatments on Grain (N %) content. (A) - Mintaro,
(B) - Pinnaroo, (C) - Tuckey. Data represents mean ± SE (n=3).

42
Gra
in p
rote
in (
%)
0
5
10
15N1
N2
N3
N4 A
Gra
in p
rote
in (
%)
0
5
1 0
1 5
2 0N1
N2
N3
N4B
Ex
ca
lib
ur
Fra
me
Gla
diu
s
Ku
kri
Ma
ce
RA
C0
87
5
0
5
1 0
1 5
Gra
in p
rote
in (
%)
N1
N2
N3
N4 C
Figure 3.7. Effect of N treatments on Grain Protein (%) content. (A) - Mintaro,
(B) - Pinnaroo, (C) - Tuckey. Data represents mean ± SE (n=3).

43
Tota
l bio
mass(g
/m2)
0
1000
2000
3000N1
N2
N3
N4 A
Excalib
ur
Fra
me
Gla
diu
s
Kukri
Mace
RA
C0875
0
500
1000
1500
Tota
l bio
mass(g
/m2) N1
N2
N3
N4 B
Figure 3.8. Effect of N treatments on total biomass. (A) - Mintaro,
(B) - Pinnaroo. Data represents mean ± SE (n=3).

44
0.0
0.2
0.4
0.6
Harv
est
Index (
HI)
N1
N2
N3
N4 A
Excalib
ur
Fra
me
Gla
diu
s
Kukri
Mace
RA
C0875
0.0
0.1
0.2
0.3
0.4
0.5
Harv
est
Index (
HI)
N1
N2
N3
N4 B
Figure 3.9. Effect of N treatments on Harvest index (HI).
(A) - Mintaro, (B) - Pinnaroo. Data represents mean ± SE (n=3).

45
Figure 3.10. Effect of N treatments on (NUE) in wheat varieties at the three sites:
(A) - Mintaro, (B) - Pinnaroo, (C) - Tuckey. Data represents mean ± SE (n=3). NUE =
grain yield (kg/ha) / available soil N (kg/ha).
NU
E-
Min
taro
0
50
100
150
200 N1N2
N3
N4A
NU
E-P
inn
aro
o
0
20
40
60
80
100 B
NU
E-T
uc
ke
y
Excalib
ur
Fra
me
Gla
diu
s
Ku
kri
Mace
RA
C0875
0
50
100
150
C

46
N U E 2 N U E 3 N U E 4
0
2 0
4 0
6 0
8 0
1 0 0
NU
E
ma
inte
na
nc
e
E x c a lib u r
F ram e
G la d iu s
K u kri
M a ce
R A C 0 8 7 5
N1
to
N2
N1
to
N3
N1
to
N4
0
2 0
4 0
6 0
8 0
1 0 0C
ha
ng
e i
n N
UE
ac
ros
s s
ite
sM in ta ro
P in n a ro o
T u k e y
Figure 3.11. . A comparison for NUE in tested varieties with elevated N
across the three sites.
Figure 3.12. Change in NUE (maintenance) as external N increased.

47
CHAPTER 4
Analysis of N-dependent growth responses of wheat cultivars cultivated under
controlled glasshouse conditions
4.1 Introduction
This study was conducted to investigate the growth response of six wheat varieties (the same
varieties used in the field experiments as described in Chapter 3) to different nitrogen rates
supplied under controlled conditions within a glasshouse. Two separate experiments were
carried out using three large soil-based bins with nitrogen fertilizer treatment (low, medium
and high N levels of applied urea fertiliser). Unfortunately pot replications were not possible
due to space constraints and therefore statistically relevant inferences from the data is limited.
However, this study has led to a technical development tool for the cultivation of wheat lines
in large soil bins under controlled glasshouse conditions.
4.2 Materials and Methods
Plant Growth and Culture
The experiments were conducted in a glasshouse at Waite campus, Adelaide University
between July to November 2010 (Experiment 1), and from February to June 2011
(Experiment 2). Plants were cultivated in large bins (110 cm x 92 cm x 60 cm, 600 L)
containing a soil mixture (approximately 70% sandy loam, 30% organic material (coco-peat),
soil residual N (see Appendix 8). Plants were grown in a temperature controlled glasshouse
where day temperatures ranged between 25-30°C and night temperatures 15-20°C. Plants
were provided supplemented light using metal halide 1000 W bulbs. For both experiments
lights were used between 6:00-9:00 am and between 4:00 – 7:00 pm.
Experimental Design
Six wheat cultivars (Excalibur, Frame, Gladius, Kukri, Mace and RAC0875) were used
(Appendix 9). Seeds were directly sown into the soil of each bin following a grid layout,
which included rows of 40 cm long with 14 cm between rows and 5 cm between seeds in two
pseudo replicates. The seeding depth was 3 cm. Two wheat cultivars were also used as border
lines (shown below in Figure: 4.1). Measurements were taken on a per row basis.

48
RAC0875 Mace Kukri Gladius Frame Excalibur
Excalibur Frame RAC0875 Mace Kukri Gladius
Nitrogen Treatments
An initial soil test was done for the soil mixture (Soil Analytical Laboratory – CSIRO, Wait
Campus) to estimate the level of available nitrogen and the soil physical characteristics (see
Appendix 7). Three N treatments were implemented across three bins. At planting, soil of
each bin was provided with starter fertilizer of 2 g N/m2, which was the base low N
treatment. For the medium and high N treatments, a second N-fertilizer treatment was
applied. Urea (46% N) was supplied at a rate of 11.96 g urea/m2 (equivalent to a final N
addition of 75 kg N ha-1
) for the medium N treatment, and 28.26 g urea/m2 (equivalent to a
final N addition of 150 kg N ha-1
) for high N treatment. Micronutrients were also provided
seven weeks after planting to avoid nutrition deficiencies (Appendix 10). Each bin received a
supplementary fertilisation of Fe (EDTA) 60 ml per bin when iron deficiency was diagnosed.
Plants were watered by hand three times per week until maturity.
Analysis
Non-destructive plant measurements recorded during growth included plant height, head
number and chlorophyll content. Leaf chlorophyll was measured using a SPAD meter
(Konica Minolta SPAD – 502 Plus, Osaka, Japan) at Zadoks stage 31 across multiple regions
Figure 4.1. Glasshouse Experiment, pot size 600 L (110 cm x 92 cm x 60 cm)
including row of 40cm length and 14 cm between rows, and 5 cm between seeds.
Border line Border line
Replicate 1
Replicate 2

49
of the leaves. The SPAD meter measures the transmittance of infrared light at 920 nm and the
transmission of red light at 650 nm. Leaf chlorophyll absorbs light strongly at 650 nm, while
no absorption occurs at 920 nm. Prior to final harvest, plants were cut off from watering four
weeks and allowed to dry-off in the glasshouse environment. After harvest, the plants were
separated into heads and the remaining aerial biomass. Grain and its component
measurements included the number of spikes/row, grain yield (g/row), and 1000-grain weight
(g) per cultivar treatment. For total %N, a representative sample of grain per row was oven
dried at 40°C for 48 hours and ground to a fine powder. Sub-samples of 3-4 mg were placed
into tin capsules and %N determined by Mass-spectrometry in the analytical service
laboratory at the plant research centre, Waite Campus, Adelaide University. Grain protein
content was estimated by multiplying total grain %N content by the wheat global standard
factor of 5.71 (Lopez- Bellido et al., 2004). Harvest index (HI) was calculated as the ratio of
grain yield g/row to above ground biomass produced per g/row. NUE was calculated as
described in Chapter 3. As the experiment lacked technical replications and instead contained
pseudo ‗in pot‘ row replicates, the data was not analysed for statistical significance between
treatments and cultivars.
4. 3. Results
Plant growth
In both experiments 1 and 2, we observed little difference in plant height between cultivars
and nitrogen treatments (Fig 4.2 A, B).
Plant head number (spikes) per row
In experiments 1 (Fig 4.3A), plant head number was consistent across the nitrogen and
cultivar combinations while head number was more variable in the second experiment.
Although we can‘t test this statistically it would appear cultivars such as Excalibur and Frame
responded to the nitrogen treatment with increased plant head numbers (Fig 4.3B).
Plant leaf chlorophyll content
Plant leaf chlorophyll content and leaf nitrogen (N) content was measured at GS31 using a
SPAD 502 meter. In experiment #1 and #2 chlorophyll contents were comparable across the
N treatments and cultivars (Fig. 4.4A,B).

50
Grain Yield (GY)
In experiments #1 and #2 grain yields were variable between cultivars and nitrogen
treatments. There was no clear trend in response to the N treatments although it would appear
Excalibur may have responded positively to the extra N supplied (Figure 4. 5).
1000 Grain weight (TGY)
In experiment #1 and #2 there was little change in TGW between cultivars and N treatments.
In experiment #1, Excalibur displayed a strong response to N treatment (Fig 4.6a).
Total Grain Nitrogen (TGN) and Grain protein content
In experiment #1 there was clear trend with increased Grain N and Grain Protein from the N1
to N3 treatments (Fig 4.7A). In contrast, in experiment #2, there was no clear response to N
treatment. It is worth noting that for each N1 treatment there were higher levels (0.5-1%)
TGN and protein in experiment #2 than in experiment #1.
Total biomass and Harvest Index (HI)
Total biomass was measured as the total weight of above ground tissues per row. Shoot
biomass includes grain, tillers (stems) and leaves. In experiment #1 and experiment #2 there
was no clear trend between cultivars and N treatments to total plant biomass or to that of
harvest index. There would appear to be variability between cultivars but minor changes
between the three N treatments.
Nitrogen Use Efficiency (NUE)
NUE was calculated as done for the field trials (Chapter 3) (adopted by Moll et al, 1982). The
initial soil residual N was uniform across the three bins as the soil was mixed together before
distributing into the three bins. Available soil N was calculated:
Available soil N kg/ha = nitrate (mg/kg) X bulk density of soil (g/cm3) X test depth/10
(www.bcg.org.au) (Appendix 5).
In both experiments, all cultivars had the highest NUE at the low N level (N1) which
decreased as N input increased. This was similar to that observed in the field trials (Chapter
3) (Fig 4. 11A, B).

51
4.4 Summary
There was a range of phenotypical differences to N treatment in the glasshouse experiments.
In general most measurements failed to show significant relationships between N treatment
and cultivar. There was a strong response in grain %N to increasing N provision when plants
were grown in the spring/summer season (i.e. Experiment 1) but not when the plants were
grown later in the season (Experiment 2). However, grain yield and shoot biomass were
found to be roughly similar across the N treatments and the two growing periods. In general,
NUE measured in experiment #1 and #2 reduced as external N addition increased.

52
Figure 4.2. Plant height (cm) in wheat varieties affected by N treatments.
(A) - Experiment #1, (B) - Experiment #2. Data represents mean ± SE (n=2).
Pla
nt heig
ht (c
m)
0
20
40
60
80
100N1N2
N3A
Excalib
ur
Fra
me
Gla
diu
s
Kukri
Mace
RA
C0875
0
20
40
60
80
100
Pla
nt heig
ht (c
m)
N1N2
N3B

53
Figure 4.3. Plant head number (spike) of wheat varieties affected by N
treatments. (A) - Experiment #1, (B) - Experiment #2. Data represents mean ± SE
(n= 2).
0
2 0
4 0
6 0
He
ad
Nu
mb
er
row
-1
N1
N2
N3
A
Ex
ca
lib
ur
Fra
me
Gla
diu
s
Ku
kri
Ma
ce
RA
C0
87
5
0
2 0
4 0
6 0
He
ad
Nu
mb
er
row
-1
N1
N2
N3
B

54
Figure 4.4. Leaf chlorophyll content in wheat varieties affected by N treatments.
(A) - Experiment #1, (B) - Experiment #2. Data represents mean ±SE (n = 2).
0
2 0
4 0
6 0
8 0L
ea
f c
hlo
rop
hy
ll c
on
ten
tN1
N2
N3
A
Ex
ca
lib
ur
Fra
me
Gla
diu
s
Ku
kri
Ma
ce
RA
C0
87
5
0
2 0
4 0
6 0
8 0
Le
af
ch
loro
ph
yll
co
nte
nt
N1
N2
N3
B

55
Figure 4.5. Grain yield / plant of wheat varieties affected by N treatments.
(A) - Experiment #1, (B) - Experiment # 2. Data represents mean ± SE (n=2).
Gra
in Y
ield
(g/m
2)
0
200
400
600
800
1000N1N2
N3
AG
rain
Yie
ld (
g/m
2)
Excalib
ur
Fra
me
Gla
diu
s
Kukri
Mace
RA
C0875
0
200
400
600
800
1000N1N2
N3
B

56
Figure 4.6. 1000 grain weight (g) in wheat varieties affected by N treatments.
(A) - Experiment #1, (B) - Experiment #2. Data represents mean ± SE (n=2).
10
00
gra
in w
eig
ht
(g)
0
2 0
4 0
6 0
8 0N1
N2
N3
A
Ex
ca
lib
ur
Fra
me
Gla
diu
s
Ku
kri
Ma
ce
RA
C0
87
5
0
2 0
4 0
6 0
8 0
10
00
gra
in w
eig
ht
(g) N1
N2
N3
B

57
Figure 4.7. Grain N (%) in wheat varieties affected by N treatments.
(A) - Experiment #1, (B) - Experiment #2. Data represents mean ± SE (n=2).
Gra
in N
(%
)
Excalib
ur
Fra
me
Gla
diu
s
Kukri
Mace
RA
C0875
0
1
2
3
4N1N2
N3 B
Gra
in N
(%
)
0
1
2
3
4N1
N2
N3A

58
Figure 4.8. Grain protein % content in wheat varieties affected by N treatments.
(A) - Experiment #1, (B) - Experiment #2. Data represents mean ± SE (n=2).
Gra
in P
rote
in (
%)
Excalib
ur
Fra
me
Gla
diu
s
Kukri
Mace
RA
C0875
0
5
10
15
20
25N1N2
N3 B
0
5
1 0
1 5
2 0
2 5
Gra
in P
rote
in (
%)
N1
N2
N3A

59
Figure 4.9. Total biomass (g/row) of wheat varieties affected by N treatments.
(A) - Experiment #1, (B) - Experiment #2. Data represents mean ± SE (n=2).
Tota
l bio
mass(g
) ro
w-1
0
50
100
150
200
a
bb
N1 N2 N3A
Tota
l bio
mass (
g)
row
-1
Excalib
ur
Fra
me
Gla
diu
s
Kukri
Mace
RA
C0875
0
50
100
150
200B
N1 N2 N3

60
Figure 4.10. The effect of N treatments on Harvest Index (HI) in wheat varieties.
(A) - Experiment #1, (B) - Experiment #2. Data represents mean ± SE (n=2).
0.0
0.1
0.2
0.3
0.4H
arv
est
Index (
HI)
N1N2
N3 A
Excalib
ur
Fra
me
Gla
diu
s
Kukri
Mace
RA
C0875
0.0
0.1
0.2
0.3
0.4
Harv
est
Index (
HI)
N1N2
N3B

61
Figure 4. 11. (NUE) in wheat cultivars affected by N treatments. (A) - Experiment #1,
(B) - Experiment #2. Data represents mean ± SE (n=2). NUE = grain yield (g/m2) /
available soil N (g/m2).
NU
E -
Ex
per
imen
t #
1
0
50
100
150
200
N1
N2
N3A
NU
E -
Ex
per
imen
t #
2
Excalib
ur
Fra
me
Gla
diu
s
Ku
kri
Mace
RA
C0875
0
50
100
150
200B

62
CHAPTER 5
General Discussion
The selection of improved wheat germplasm is an on-going process to maintain yield and
productivity. This objective is often linked to the availability of water and nutrients in the
soil, where N is often a key macronutrient found in short supply across most agronomical
important growing areas. The rising cost of N fertilisers, and the associated negative impact
of their inefficient use on the environment, is driving future breeding programs to identify
wheat varieties with improved nitrogen use efficiencies (NUE). In wheat, improved NUE
must be accompanied with traits that maximise seed yield and if possible seed protein to
ensure future crop productivity continues to meet expected yield and quality to feed a rapidly
growing global population. To do this while utilising less N fertiliser inputs is a great
challenge facing agronomist and plant scientists worldwide.
Australia‘s dryland agricultural regions are subjected to rainfall variability typified by
extended wet and/or dry periods (Freebairn et al., 2006). Under these conditions, the ability
of soils to store water and nutrients is an underlying component that helps to mediate and
promote crop performance and yield. Farming practices, including nutrient management,
have evolved to cope with the variability of Australia‘s dryland agricultural regions. For
example, in northern cropping regions the use of fallows is common while in the southern
and western regions, in-season adjustment of fertiliser inputs are common practice. Nitrogen
management across most worldwide agricultural systems is built upon urea-based fertilizers
(Bremner et al., 1995). This is primarily due to its high nitrogen content (46% nitrogen),
solubility, inexpensive manufacturing costs, and the ability to store and transport (Gilbert et
al., 2006; Prasad et al., 1998). A consequence of its use is the potential for N volatilization
(and loss of N from the agricultural system) through soil-based hydrolytic processes that
convert urea to ammonia (NH3) and carbon dioxide (Bremner et al., 1995). Urea can also be
lost through runoff and leaching with high rainfall and through soil-based immobilization and
denitrification (Raun and Johnson 1999). The rate of NH3 volatilisation is strongly influenced
by soil moisture content when urea is surface applied. For example, rainfall (3–9 mm) within
5-9 days can result in losses of ammonium by 10 to 30%, while no rainfall within 6 days after
surface urea application results in higher losses of ammonia, above 30% (Fox and Hoffman
1981). How plants adapt and grow in soils with applied N is a key component in developing

63
strategies that maximise N use in order to minimize N loss through traditional N depletion
pressures discussed above.
In the current study, the responses of six wheat varieties to N fertilisation (Urea) were
examined at three different locations in South Australia in 2010 and in two controlled
glasshouse studies at the Waite campus at the University of Adelaide. The season was
characterised as wet with 2010 growing season being the wettest year on record since 1992
(www.bom.gov.au). Unfortunately these conditions promoted N leaching and most likely
movement of N downward from the root zone. As a result, I speculate the efficiency of N
uptake across the wheat varieties may have been compromised and reduced yield and NUE
may be evident in the data. Moreover, increased temperatures (18-24oC) experienced at the
later growing stages during grain filling may have also resulted in yield and or growth
penalties. The optimum temperature for the growth and development of spring-wheat is
around 20°C (Paulsen et al., 1994). When temperatures are high, the grain filling period often
shortens and reduces yield (Housley & Ohm 1992; Wheeler et al., 1996; Moot et al., 1996;
Altenbach et al., 2003; Gooding et al., 2003; Rahman et al., 2005). This may have been
consequences of the environmental conditions experienced in 2010 across the three sites.
Nonetheless, the data indicates that across the wheat varieties examined, location and soil
conditions were strong determinants to yield and plant productivity with very little genetic
differences evident in variety response to N supply during this trial.
Wheat N Field Trials (Mintaro, Pinnaroo and Tuckey)
Across the varieties there were a range of phenotypical differences to N treatment. From most
of the measurements taken it was difficult to identify lines which consistently performed well
across the varied field sites or equally when grown under controlled conditions in the
glasshouse. The site of growth and the season of which the plants were grown (i.e. glasshouse
experiments) were strong variables which dictated individual line performance to increasing
N provision.
To evaluate the overall response between field sites to N treatment we pooled selected data
sets across the six lines we tested. Grain yield and %N in the grain are two commercially
relevant selection parameters which can be used to compare wheat lines for their ability to
perform under varying growth conditions. In general, we found some differences between
the three field sites in Grain %N in response to increasing N provision while Pinnaroo site
showed highest response and Mintaro had moderate response but at Tuckey no response

64
(Figure 5.1, A). The grain N content was on average (1.39 %, 1.73 % and 1.54%) across each
of the three sites and N treatments respectively.
There was a slight trend of increasing grain %N at both Mintaro and Pinnaroo, which is
broadly in evidence across the individual lines. Grain yield at both Pinnaroo and Tuckey was
vastly different from that of Mintaro achieving only ~50% of the Mintaro grain yield (Figure
5.1B). Surprisingly, the reduction in grain yield did not impact upon the final %N in the grain
which was roughly equal to that of plants grown at the Mintaro site (as discussed above). The
lower grain yield at Pinnaroo and Tuckey is most likely attributed to the overall decrease in
shoot biomass and the capacity for sustained photosynthesis and grain production over the
growing season (note: no shoot biomass measurements were taken for the Tuckey site).
Although seed yield was significantly lower than Mintaro, lines grown at Tuckey did respond
to increased N provision with a small increase in yield. A similar response was not observed
at Pinnaroo, which may be related to the higher residual N content relative to that of Tuckey
(Appendix 6). This result further highlights the strong impact of the poor growing conditions
at Pinnaroo and Tuckey which overrides the potential impact of increased N provision.
In general, total biomass at Pinnaroo was approximately half that of the Mintaro trial, shoot
biomass per harvested area did not vary across cultivars and N treatments of field trials;
however there was a slight increase in total biomass with increased N levels only at Mintaro
site (Fig 5. 2, B), This increase may be associated with larger leaves that stay green longer,
tall stems and a large number of tillers surviving to maturity as was visual during the record
of plant measurements, which was differed between the sites (soil residual N and soil
texture). Moreover, HI was almost similar, ranged (0.34 – 0.39) in the field trials, no
significant differences were observed with respect to N levels and different cultivars (Fig
5.2A). The differences in plant shoot biomass may be attributed to the plant height and
greater leaf size as plants were responded to increased N levels. The finding is in agreement
with observations made by (Khan et al., 2000).
Wheat N Glasshouse experiments
In the glasshouse studies, we found a strong response in grain %N to increasing N provision
when plants were grown in the spring/summer season. However, autumn/winter grown plants
demonstrated no N response but still achieved a uniform high %N level in the grain equal to
the highest N treatment in the spring/summer grown plants (Figure 5.3A). Grain yield and

65
shoot biomass were found to be roughly similar across the N treatments and the two growing
periods (5. 3B and 5.4B).
Total biomass differed between the two experiments due to the seasonal differences; more
biomass was produced at autumn/winter than spring/summer season (Fig 5.4B). This was
obvious when plant measurements were recorded; autumn/winter plants had larger leaves but
were shorter than spring/ summer season plants which were taller with narrow leaves. This
was may be due the differences in the length of the day between the two growing periods.
However, no significant differences in HI were found between wheat cultivars and N
treatments, but HI showed a general increase with elevated N levels. HI ranged from 0.24 to
0.32 in spring/ summer season and 0.18 to 26 in autumn/winter season (Fig 5.4A). The
differences in HI of wheat varieties may be related to the differences in plant height that
influence HI and /or related to the ability of genotypic responses to different N levels and
available N in the soil for grain and shoot biomass production in which grain yield and HI is
in an inverse relationship. The finding in this study may suggest that genetic improvement in
yield was more associated with a genetic gain in biomass than in harvest index. As Shearman
et al., (2005) also attributed yield improvements in varieties introduced in the UK between
1983 and 1995 to increased biomass rather than harvest index. Unfortunately the design of
the glasshouse trials doesn‘t allow statistical testing of these observations and a note of
caution needs to be stressed the data is preliminary until further experiments can be
conducted to confirm the findings with appropriate replication and statistical anlayais.
Impact on wheat N use efficiency
In the present study we calculated NUE based on the yield response relative to applied N and
residual N in the soil. As expected NUE was at its highest level in all genotypes at N1 and
decreased sharply as N fertiliser was increased (N2-N4). As similar finding was reported by
(Ortiz-Monasterio et al., 1997), where they calculated NUE only as grain production per unit
of fertilizer N. In general, there was very little change in NUE response between varieties and
growing locations (field or glasshouse). However, in greenhouse grown plants, NUE
measured at N1 did vary in the autumn experiment where both Gladius and RAC0875 had a
lower NUE compared to the other varieties tested. This result may be related to the number
of heads per plant with these lines, which were significantly lower than most of the other
lines across all N treatments.

66
In conclusion, results indicated that in general there was little variation in N responsiveness
across the wheat lines tested with respect to NUE, grain yield, and %N in the harvested grain.
The overriding variable that influenced the growth response of the lines was the combination
of location and growing conditions. Poor growing sites including Pinnaroo and Tuckey were
limiting the plants ability to respond to N provision and reach their ultimate growth potential.
At Tuckey we observed the greatest response to N provision across the four N treatments.
However the final grain yield achieved was only 50% of the fertile Mintaro site and
approximately equal to the slightly improved Pinnaroo site. This result is not unexpected
based on the growing sites, where soil N, water availability and temperature will have varied.
The study also highlighted the significant differences in growth response between glasshouse
and field based experiments. Although we observed different responses to applied N for
grain %N across the two glasshouse experiments, the overall impact on yield and shoot
biomass was negligible. In contrast the large fluctuations in yield potential observed across
the three-field sites highlight the importance in site selection to dissect N-related growth and
yield responses with future selection trials.
The results are indicating that Mace and Excalibur are superior cultivars and to a lesser
extend Kukri due to improved higher yield and higher NUE value than the other three wheat
cultivars. The finding indicates that medium N fertilization rate (75 – 100 kg N / ha) is to be
the best recommendation in South Australian agriculture system to improve high yield and
high grain quality with efficient use of nitrogen by plant in selecting new germplasm at the
same time reducing the impact on environment and human concerns. The finding suggests
that the recommendation of N-Fertilizer management with split application matches with
plant demand during its life cycle is the best way to improve yield and enhanced NUE in
crops than one application early in the season or at sowing time due to unpredictable time of
rainfall. Moreover, heavy rainfall in winter causes to N insufficiency at tillering stage (Elliot
et al., 1985).
However, the outcomes of one year of field experiments would likely not reflect the crop
response information because of variation in growing season rainfall. Further research
involving continued examination in the field and glasshouse is an important approach to
better understand the N responsiveness of these varieties and their suitability as parental lines
to analyse genetic diversity for NUE traits.

67
Gra
in N
(%
)
0 .0
0 .5
1 .0
1 .5
2 .0
2 .5
N 1
N 2
N 3
N 4
a b
c
a
b c a
b
c
d
AG
rain
Yie
ld (
g/m
2)
M in ta r o o P in n a r o o T u c k e y
0
2 0 0
4 0 0
6 0 0
8 0 0
1 0 0 0
a
a b
a b b
ab
cc
B
N 1
N 2
N 3
N 4
Figure 5.1. Wheat cultivars response to different N treatments at the
three sites: (A) - grain N % content, (B) - grain yield. Data represents
mean ± SE (n=3).

68
Ha
rve
st
Ind
ex
(H
I)
0 .0
0 .1
0 .2
0 .3
0 .4
0 .5
N 1
N 2
N 3
N 4
N o d a ta
A
a aa b b
To
tal
bio
ma
ss
M in ta r o o P in n a r o o T u c k e y
0
5 0 0
1 0 0 0
1 5 0 0
2 0 0 0
2 5 0 0
N o d a ta
aa
a bb
B
N 1
N 2
N 3
N 4
Figure 5.2. Wheat Cultivars response to different N treatments at the
three sites: (A) - Harvest Index (HI), (B) - Total biomass. Data
represents mean ± SE (n=3).

69
Gra
in N
(%
)
0
1
2
3
4N 1
N 2
N 3A
Gra
in Y
ield
(g
/m2)
Ex p # 1 Ex p # 20
200
400
600 BN1
N2
N3
Figure 5.3. Wheat Cultivars response to different N treatments in the
glasshouse experiments: (A) - grains N % content, (B) - grain yield. Data
represents mean ± SE (n=2).

70
Exp # 1 Exp # 2
0
50
100
150
To
tal b
iom
ass (
g)
row
-1
BN1
N2
N3
Figure 5.4. Wheat Cultivars response to different N treatments in the
glasshouse experiments: (A) - Harvest Index (HI), (B) - Total biomass. Data
represents mean ± SE (n=2).
Harv
est In
dex (
HI)
0.0
0.1
0.2
0.3
0.4 N1
N2
N3 A

71
REFERENCES
Acreche MM., Slafe GA., 2009. Variation of grain nitrogen content in relation with grain
yield in old and modern Spanish wheat grown under a wide range of agronomic conditions in
a Mediterranean redion. Journal Agri. Science. 147: 657-667.
Agriculture and Horticulture Development Board (AHDB), Wheat disease management
guide (HGCA) 2012, (WWW.hgca.com).
Australian Society of Soil Science Inc. (ASSSI) (WWW.bettersoils.com.au).
Altenbac, S.B., DuPont F.M., Kothari K.M., Chan R., Johnson E.L. & Lieu D., 2003. Temperature, water and fertilizer influence the timing of key events during grain
development in a US spring wheat. Journal of Cereal Science 37, 9-20.
Anbessa Y., Juskiw P., Good A., Nyachiro J., Helm J., 2009. Genetic variability in
nitrogen use efficiency of spring barley. Crop Science; 49:1259-1269.
Andrews M., Lea PJ., Ravan JA., Lindsey K., 2004. Can genetic manipulation of plant
nitrogen assimilation enzymes result in increased crop yield and grater N-use efficiency? An
assessment. Ann. Appl. Biol. 145, 25-40.
Angus J. F. 2001. Nitrogen supply and demand in Australian agriculture. AustralianJjournal
of Experimental Agriculture. 41: 277-288.
Austin R.B., Ford M.A., Edrich J.A. & Blackwell R.D., 1977. The nitrogen economy of
winter wheat. Journal of Agricultural Science, Cambridge 88, 159-167.
Badaruddin M. and D. W. Meyer, 1994. Grain legume effects on soil nitrogen, grain yield,
and nitrogen nutrition of wheat. Crop Science 34: 1304-1309.
Balasubramanian V., Alves B., Aulakh MS., Bekunda M., Cai Zc., Drinkwater L.,
Mugendi Van Kessel D.C., and Oenema O., 2004. Crop, environmental and management
factors affecting N use efficiency. In: Mosier AR, Syres JK and Freney JR (eds) Agriculture
and the N Cycle: Assessing the Impacts of Fertilizer Use on Food Production and the
Environment, PP, 19-33 SCOPE 65, Paris, France.
Barraclough P. B., Howarth J.R., Jones J., 2010 Nitrogen efficiency of wheat: genotyic
and environmental variation and prospects for improvement. European Journal of Agronomy
33, 1-11.
Barber S.A. 1984. Soil Nutrient Bioavailability. A Mechanistic Approach. John Wiley: New
York.
Barber S.A., M. Silberbush., 1984. Plant root morphology and nutrient uptake. p. 65-87. In
S.A. Barber, and D.R. Bouldin (eds.) Roots, nutrient and water influx, and plant growth, ASA
Spec. Publ. 49. ASA, Madison, WI.
Baresel J. P., Zimmermann G., Reents H. J., 2008. Effects of genotype and environment
on N uptake and N partition in organically grown winter wheat (Triticum aestivum L.) in
Germany. Euphytica. 163, 345-347

72
Basso B., D. Carnrnarano, A. Troeeoli, D. Chen and I.T. Ritchie., 2010. Long-terni
Wheat responses to nitrogen in rainfed Mediterranean environment: Field data and simulation
analysis. Eur. J. Agron., 33: 132-138.
Beman J. M., K.R Arrigo, and P. A. Matson 2005. Agricultural runoff fuels large
phytoplankton blooms in vulnerable areas of the ocean. Nature vol 434 p. 211-214.
Bertin P. and A Gallais 200I. Genetic variation for nitrogen use efficiency in a set of
recombinant maize inbred lines. II. QTL detection and coincidences. Maydica 45:53-68.
Birchip Cropping Group, (WWW.bcg.org.au).
Blackman J.A., Payne, P.I., 1987. Grain quality (Protein content). Wheat breeding: 467-
469.
Blankenau K. Olfs HW, Kuhlmann H. 2002. Strategies to improve the use efficiency of
mineral fertilizer Nitrogen applied to winter wheat. J. Agron. Crop. Sci. 188:146-154.
Bock B.R. 1984. Efficient use of nitrogen in cropping systems. In Nitrogen In crop
production. Edited by R.D. Hauck. American Society of agronomy, Madison, Wis. Pp. 273-
294.
Brancourt-Hulmel M., G. Doussinault, C. Lecomte, P. Berard, B. Le Buanec and
M. Trottet. 2003. Genetic improvement of agronomic traits of winter wheat cultivars
released in France from 1946 to 1992. Crop Sci. 43:37–45.
Bremner J.M. and Malhi 1995. Recent research on problems in the use of urea as a nitrogen
fertilizer. Fertilizer Research 42:321-329.
Broadbent FE., S.K. DeDatta, and E.V. LaUl'e!es 1987 Measurement of nitrogen
utilization efficiency in rice genotypes. Agronomy Journal 79:786-791.
Bruning-Fan C. and Kaneene, J.B. 1993. The effects of Nitrate, Nitrate and N-Nitroso
compounds on human health: a review. Veterinary and Human Toxicology 35, 6, 521–538.
Bureau of Meteorology Australia, (WWW.bom.gov.au).
Butterbach-Bahl K, and Dannenmann M. 2011. Denitrification and associated soil N2O
emissions due to agricultural activities in a changing climate.Current Opinion in
Environmental Sustainability Volume 3, Pages 389-395.
Cassman K.G., S. Peng, D.C. Olk, J.K. Ladha, W. Reichardt, A. Dobermann, and U.
Singh. 1998. Opportunities for increased nitrogen-use efficiency from improved resource
management in irrigated rice systems. Field Crops Res. 56:7-39.
Cassman K.G. 1999. Ecological intensification of cereal production systems: yield potential,
soil quality, and precision agriculture. Proceedings of the National Academy of Sciences,
USA 96:5952–5959.
Cassman K.G., A. Dobermann, and D. Walters. 2002. Agroecosystems, Nitrogen Use
Efficiency and Nitrogen Management. Ambio 31:132-140.

73
Cooper H.D., Clarkson, D.T., Johnston, M.G., Whiteaway, J.N. & Loughman, B.C.
1986. Cycling of amino-nitrogen between shoots and roots in wheat seedlings. p. 97-100. In
H. Lambers, J.J. Neeteson and I. Stulen (ed.) Fundamental, Ecological and Agricultural
Aspects of Nitrogen Metabolism in Higher Plants. Martinus Nijhoff Publishers,Dordrecht
Corre M. D., Van Kessel C., and Pennock, D. J., 1996. Landscape and seasonal patterns of
nitrous oxide emissions in a semiarid region. Soil Sci. Soc. Am. J. 60, 1806–1815.
Cox M.C., Qualset C.O., Rains D.W., 1985. Genetic variation for nitrogen assimilation and
translocation in wheat: II. Nitrogen assimilation in relation to grain yield and protein. Crop
Science 25:435-440.
Crawford NM., Campbell W. H., and Davis R.W. 1995. Nitrate nutrient and signal for
plant growth. Plant Cell 7: 859–868
Crawford NM., Glass ADM, 1998. Molecular and physiological aspects of nitrate uptake in
plants. Trends Plant Sci 3: 389–395.
Cuturier J., Montanini B., Martin F., Brun A., Blaudez D., Chalot M., 2007. The
expanded family of ammonium transporters in the perennial poplar plant. New
Phytologist;174:137-150
Daberkow S., K.F. Isherwood, J. Poulisse, and H. Vroomen., 2000. Fertilizer
Requirements in 2015 and 2030. In Proc. IFA Agricultural Conference on Managing Plant
Nutrition, 29 June-2 July 1999. Barcelona Spain.
Dalling M.J., Boland G. & Wilson J.H., 1976. Relation between acid proteinase activity
and redistribution of nitrogen during grain development in wheat. Australian Journal of Plant
Physiology 3, 721-730.
Daniel-Vedele F., Filleur S., Caboche M., 1998. Nitrate transport: a key step in nitrate
assimilation. Current Opinion in Plant Biology 1: 235–239.
Dhugga K.S., Waines J.G., 1989. Analysis of nitrogen accumulation and use in bread and
durum wheat. Crop Science 29: 1232-1239.
Dobermann A., and Cassman, K. G., 2004. Environmental dimensions of fertilizer
nitrogen: What can be done to increase nitrogen use efficiency and ensure global food
security? In ‗‗Agriculture and the Nitrogen Cycle: Assessing the Impacts of Fertilizer Use on
Food Production and the Environment‘‘ (A. R. Mosier, J. K. Syers, and J. R. Freney, Eds.),
pp. 261–278. SCOPE 65, Paris, France.
Ehdaie B., Merhaut D. J., Ahmadian S., Hoops A.C., Khuong T., Layne A.P.and Waines
J.G., 2010. Root System Size Influences Water-Nutrient Uptake and Nitrate Leaching
Potential in Wheat. J. Agronomy and Crop Science.
Elliot D. J., B. Growden, 1985. Nitrogen deficiency in wheat: its prediction and correction.
Termination report (project 14) for the wheat industry research committee of South Australia.
Fageria N.K., V.C. Baligar and C.A. Jones, 1997. Wheat and Barley. In: Growth and
Mineral Nutrition of Field Crops. pp. 243–78. Marcel Dekker.
Fageria N.K. and V.C. Baligar, 2005. Enhancing nitrogen use efficiency in crop plants.
Advances in Agronomy 88:97-185.

74
Fageria N.K., Baligar V.C., Li, Y., 2008. The role of nutrient efficient plants in improving
crop yields in the twenty first century. Journal of Plant Nutrition 31, 1121–1151.
Fajersson F. 1961. Nitrogen fertilization and wheat quality. Agri Hortique Genetica 19.
Fangmeier A., De Temmerman L., Mortensen L., Kemp K., Burke J., Mitchell R., van
Oijen M. & Weigel H. J., 1999. Effects on nutrients and on grain quality in spring wheat
crops grown under elevated CO2 concentrations and stress conditions in the European,
multiple-site experiment ‗ESPACE-wheat‘. European Journal of Agronomy 10, 215-229.
FAO 2010. Current world fertilizer trends and outlook to 2014. Food and Agriculture
Organization of the United Nations, Rome.
Feil B., Hanson, K.A., and J.M. Martin 1992. Breeding progress in small grain cereals- a
comparison of old and modern cultivars. Plant Breed. 108: 1-11.
Feil B. 1997. The inverse yield-protein relationship in cereals: Possibilities and limitations
for genetically improving the grain protein yield. Trends in Agronomy 1, 103-119.
Feller U. & Fischer A. 1994. Nitrogen metabolism in senescing leaves. Critical Rreviews in
Plant Sciences 13, 241-273.
Fenn LB., Hossner LR., 1985. Ammonia volatilization from ammonium and ammonium-
forming nitrogen fertilizers. Adv. Soil. Sci. 1:123-169.
Flowers M.D., Lutcher L.K., Corp M.K., and Brown B., 2007. Managing Nitrogen for
Yield and in hard Wheat. Oregon State University.
Ford B .G. 2000. Nitrate transporters in plants: structure, function and regulation. Biophys.
Acta, 1465: 219-236. PMID: 10748256.
Foulkes MJ, Sylvester-Bradley R., Scott RK., 1998. Evidence for differences between
winter wheat cultivars in acquisition of soil mineral nitrogen and uptake and utilization of
applied fertilizer nitrogen. Journal of Agricultural Science 130, 29–44.
Fox R.H., and L.D. Hoffman, 1981. The effect of N fertilizer source on grain yield, N
uptake, soil pH and lime requirement in no-till corn. Agron. J. 73:891-895.
Freebairn DM., Cornish PS., Anderson WK., Walker SR., Robinson JB. and Beswick
AR., 2006. ‗Management systems in climate regions of the world—Australia‘, in Peterson,
GA, Unger PW, and Payne, WA (eds.) Dryland agriculture—Second edition, American
Society of Agronomy, Crop Science Society of America, Soil Science Society of America,
Madison, Wisconsin, pp. 837–878.
Gallais A. and B. Hirel, 2004. An approach of the genetics of nitrogen use efficiency in
maize. J. Exp. Bot. 55:295–306.
Garnett T., Conn V., Kaiser B. N., 2009. Root based approaches to improving nitrogen use
efficiency in plants. Plant Cell Environ. 32, 1272–1283
Gilbert P.M., J.Harrison, C. Heil, and S. Seitzinger, 2006. Escalating worldwide use of
urea – a global change contributing to coastal eutrophication. 77:441-463.

75
Giller K.E., P.M. Chalk, A. Dobermann, L.C. Hammond, P. Heffer, J.K. Ladha, P.
Nyamudeza, L.M. Maene, H. Ssali, and J.R. Freney, 2004. Emerging technologies to
increase the efficiency of use of fertilizer nitrogen. p. 35-52. In A.R. Mosier et al. (ed.)
Agriculture and the nitrogen cycle: assessing the impacts of fertilizer use on food production
and the environment. SCOPE 65. Island Press, Washington,D.C.
Glass ADM, Crawford N., 1998 Molecular and physiological aspects of nitrate uptake in
plants. Trends Plant Sci 3: 389–395.
Glass, Anthony 2003. Nitrogen Use Efficiency of Crop Plants: Physiological Constraints
upon Nitrogen Absorption. Critical Reviews in Plant Sciences 22, Number 5: 453.470 (18).
Good A.G., Johnson S.J., Pauw M., T. Carroll, R. Sacidoc, N. Vidmar J. Z., Taylor G. &
Stroeher V., 2007, Engineering nitrogen use efficiency with alanine aminotransferase,
Journal of NRC Research, vol. 85, pp. 252-262.
Good A.G., Shrawat A.K. & Muench D.G., 2004. Can less yield more? Is reducing
nutrient input into the environment compatible with maintaining crop production? Trends in
Plant Science 9, 597–605.
Gooding M.J., Ellis R.H., Shewry P.R. & Schofield J.D., 2003. Effects of restricted water
availability and increased temperature on the grain filling, drying and quality of winterwheat.
Journal of Cereal Science 37, 295-309.
Gruber N. and Galloway, 2008. An Earth-system perspective of the global nitrogen cycle.
Nature 451, 293-296.
Goulding K. 2004. Pathways and losses of fertilizer nitrogen at diVerent scales. In
‗‗Agriculture and the Nitrogen Cycle: Assessing the Impacts of Fertilizer Use on Food
Production and the Environment‘‘ (A. R. Mosier, J. K. Syers, and J. R. Freney, Eds.), pp.
209–219. SCOPE 65, Paris, France.
Guindo D., Norman R. J. & Wells B. R., 1994. Accumulation of fertilizer nitrogen-15 by
rice at different stages of development. Soil Science Society of America Journal 58, 410–415.
Habash DZ., Bernard S., Schondelmaier J., Weyen J., Quarrie SA., 2007. The genetics of
nitrogen use in hexaploid wheat: N utilisation, development and yield. Theoretical and
Applied Genetics ;114:403-419.
Hack-Ten Broeke M.J.D. & W.J.M. De Groot, 1998. Evaluation of nitrate leaching risk at
site and farm level. Nutient Cycling in Agroecosystems 50:271-276.
Halvorson A.D., and C.A. Reule 1994. Nitrogen fertilizer requirements in an annual dryland
cropping system. Agron. J. 86:315–318.
Hirel B. 2001. Towards a better understanding of the genetic and physiological basis for
nitrogen use efficiency in maize. Plant Physiol. 125, 1258–1270.
Hirel B., Le Guois J., Ney B. & Gallais A., 2007. The challenge of improving nitrogen use
efficiency in crop plants: towards a more central role for genetic variability and quantitative
genetics within intergrated approaches, Journal of Experimental Botany, vol. 58, no. 9, pp.
2369-2387.
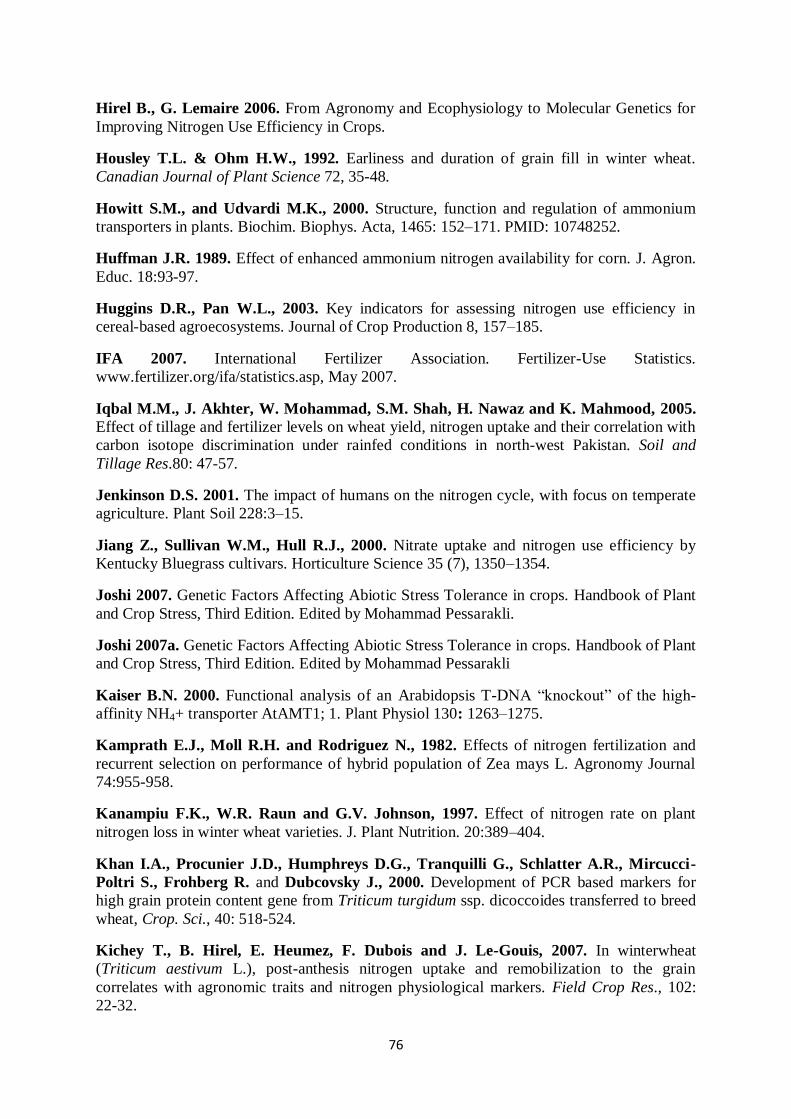
76
Hirel B., G. Lemaire 2006. From Agronomy and Ecophysiology to Molecular Genetics for
Improving Nitrogen Use Efficiency in Crops.
Housley T.L. & Ohm H.W., 1992. Earliness and duration of grain fill in winter wheat.
Canadian Journal of Plant Science 72, 35-48.
Howitt S.M., and Udvardi M.K., 2000. Structure, function and regulation of ammonium
transporters in plants. Biochim. Biophys. Acta, 1465: 152–171. PMID: 10748252.
Huffman J.R. 1989. Effect of enhanced ammonium nitrogen availability for corn. J. Agron.
Educ. 18:93-97.
Huggins D.R., Pan W.L., 2003. Key indicators for assessing nitrogen use efficiency in
cereal-based agroecosystems. Journal of Crop Production 8, 157–185.
IFA 2007. International Fertilizer Association. Fertilizer-Use Statistics.
www.fertilizer.org/ifa/statistics.asp, May 2007.
Iqbal M.M., J. Akhter, W. Mohammad, S.M. Shah, H. Nawaz and K. Mahmood, 2005.
Effect of tillage and fertilizer levels on wheat yield, nitrogen uptake and their correlation with
carbon isotope discrimination under rainfed conditions in north-west Pakistan. Soil and
Tillage Res.80: 47-57.
Jenkinson D.S. 2001. The impact of humans on the nitrogen cycle, with focus on temperate
agriculture. Plant Soil 228:3–15.
Jiang Z., Sullivan W.M., Hull R.J., 2000. Nitrate uptake and nitrogen use efficiency by
Kentucky Bluegrass cultivars. Horticulture Science 35 (7), 1350–1354.
Joshi 2007. Genetic Factors Affecting Abiotic Stress Tolerance in crops. Handbook of Plant
and Crop Stress, Third Edition. Edited by Mohammad Pessarakli.
Joshi 2007a. Genetic Factors Affecting Abiotic Stress Tolerance in crops. Handbook of Plant
and Crop Stress, Third Edition. Edited by Mohammad Pessarakli
Kaiser B.N. 2000. Functional analysis of an Arabidopsis T-DNA ―knockout‖ of the high-
affinity NH4+ transporter AtAMT1; 1. Plant Physiol 130: 1263–1275.
Kamprath E.J., Moll R.H. and Rodriguez N., 1982. Effects of nitrogen fertilization and
recurrent selection on performance of hybrid population of Zea mays L. Agronomy Journal
74:955-958.
Kanampiu F.K., W.R. Raun and G.V. Johnson, 1997. Effect of nitrogen rate on plant
nitrogen loss in winter wheat varieties. J. Plant Nutrition. 20:389–404.
Khan I.A., Procunier J.D., Humphreys D.G., Tranquilli G., Schlatter A.R., Mircucci-
Poltri S., Frohberg R. and Dubcovsky J., 2000. Development of PCR based markers for
high grain protein content gene from Triticum turgidum ssp. dicoccoides transferred to breed
wheat, Crop. Sci., 40: 518-524.
Kichey T., B. Hirel, E. Heumez, F. Dubois and J. Le-Gouis, 2007. In winterwheat
(Triticum aestivum L.), post-anthesis nitrogen uptake and remobilization to the grain
correlates with agronomic traits and nitrogen physiological markers. Field Crop Res., 102:
22-32.

77
Koutroubas S.D. and D.A. Ntanos, 2003. Genotype differences for grain yield and nitrogen
utilization in indica and japonica rice under Mediterranean conditions. Field Crops
Res. 83:251–260.
Kramer T. 1979. Environmental and genetic variation for protein content in winter wheat
(Triticum aestivum L.). Euphytica 28, 209-218.
Kravcheckov A. N., Thelen K. D., Bullock D. G., and Miller N. R., 2003. Relationship
among crop grain yield, topography, and soil electrical conductivity studied with cross
correlograms. Agron. J. 95, 1132–1139.
Kronzucker H.J., M.Y. Siddiqui, A.D.M. Glass and J.G.D. Kirk, 1999. Nitrate-
ammonium synergism in rice: A subcellular flux analysis. Plant Physiology 119, 1041-1045.
Lam H.M., Coschigono K.T., Oliveira I.C., Melo-Oliveira R. and Coruzzi G.M., 1996. The molecular-genetics of nitrogen assimilation into amino acids in higher plants. Annu. Rev.
Plant Physiol. Plant Mol. Biol. 47: 569–593.
Lawlor D.W., Lemaire G., Gastal F., 2001. Nitrogen, plant growth and crop yield. In Plant
nitrogen, P.J. Lea, J.F. Morot Gaudry, (eds.). Berlin: Springer-Verlag. p.343-367.
Le Gouis J., D. Béghin, E. Heumez and P. Pluchard., 2000. Genetic differences for
nitrogen uptake and nitrogen utilisation efficiency in winter wheat. Eur. J. Agron. 12:163–
173.
Leifert C, Golden M, Duncan C. L. H., Dykhuizen R., Frazer R., Johnston P.,
MacKnight G., Smith L., Lamza K., McKenzie H., Batt L., Kelly D., Benjamin N., 1997.
Protection against oral and gastrointestinal diseases: importance of dietary nitrate intake, oral
nitrate reduction and enterosalivary nitrate circulation. Department of Plant & Soil Science,
University of Aberdeen, Scotland, U.K.; 118(4):939-48.
Lemaire G., Millard P., 1999. An ecophysiological approach to modelling resource fluxes
in competing plants. Journal of Experimental Botany 50: 15-28.
Liao MT, Fillery IRP and Palta JA., 2004. Early vigorous growth is a major factor
influencing nitrogen uptake in wheat. Functional Plant Biology 31, 121-129.
Liao MT, Palta JA and Fillery IRP., 2006 Root characteristics of vigorous wheat improve
early nitrogen uptake. Australian Journal of Agricultural Research 00, 000-000 (in press).
Limaux F., S. Recous, J.M. Meynard and A. Guckert, 1999. Relationship between rate of
crop growth at date of fertiliser N application and fate of fertiliser N applied to winter wheat.
Plant Soil, 214: 49-59.
London J.G. 2005. Nitrogen study fertilizes fears of pollution. Nature 433:791.
Lopez-Bellido JR., Redondo R., 2004. Nitrogen efficiency in wheat under rainfed
Mediterranean conditions as affected by split nitrogen application .Field Crops Res. 94: 86-9.
Loque D., von Wiren N., 2004. Regulatory levels for the transport of ammonium in plant
roots. J Exp Bot 55: 1293–1305.
Loque D., Yuan L., Kojima S., Gojon A., Wirth J., Gazzarrini S., Ishiyama K.,
Takahashi H., von Wiren N., 2006 Additive contribution of AMT1;1 and AMT1;3 to high-

78
affinity ammonium uptake across the plasma membrane of nitrogen-deficient Arabidopsis
roots. Plant J 48: 522–534
Ludewig U., Wilken S. B., Jost W., Obrdlik P., El Bakkoury M., Marini AM., Andre B.,
Hamacher T., Boles E., 2003 Homo- and hetero-oligomerization of ammonium transporter-1
NH4+ uniporters. J Biol Chem 278: 45603–45610.
Lütke Entrup N. & Oemichen J. Eds., 2000. Lehrbuch des Pflanzenbaues, Band 1:
Grundlagen.(In German.). Gelsenkirchen: Verlag Th. Mann. ISBN 3-7862-0119-6.
Magen H., and V. Nosov, 2008. Putting Potassium in the Picture: Achieving Improved
Nitrogen Use Efficiency. In: IPI-BFA-BRRI International Workshop on Balanced
Fertilization for Increasing and Sustaining Productivity. 30 March -1 April 2008, Dhaka,
Bangladesh.
Marschner P., Neumann G., Kania A., Weiskopf L., Lieberei R., 2002. Spatial and
temporal dynamics of the microbial community structure in the rhizosphere of cluster roots of
white lupin (Lupinus albus L.). Plant Soil 246: 167–174
Martin T., Oswald O., Graham IA., 2002. Arabidopsis seedling growth, storage
mobilization, and photosynthetic gene expression are regulated by carbon: nitrogen
availability. Plant Physiology128,472–481
Masclaux C., Quillere I., Gallais A. & Hirel B., 2001. The challenge of remobilisation in
plant nitrogen economy. A survey of physio-agronomic and molecular approaches. Annals of
Applied Biology 138, 69-81.
Masclaux-Daubresse C., Reisdorf-Cren M., Pageau K., Lelandais M., Grandjean O.,
Kronenberger J., 2006. Glutamine synthetase–glutamate synthase pathway and glutamate
dehydrogenase play distinct roles in the sink-source nitrogen cycle in tobacco. Plant Physiol.
2006;140:444-456.
Maathuis F. 2009. Physiological functions of mineral nutrients. Current Opinion in Plant
Biology 12: 250–258.
Matson P. A., Naylor R.L. & Ortiz-Monasterio, 1998. Integration of Environmental,
Agronomic, and Economic Aspects of Fertilizer Management Environment. Science 280,
112–115.
McDonald G.K. 1989. The contribution of nitrogen fertiliser to the nitrogen nutrition of
rainfed wheat crops in Australia: a review. Australian Journal of Experimental Agriculture
29: 455 - 481.
Mc Donald G. K. 1992. Effects of nitrogenous fertilizer on the growth, grain yield and grain
protein concentration of wheat. Australian Journal of agricultural research 43: 949-967.
Miyashita Y., Good AG., 2008. NAD(H)-dependent glutamate dehydrogenase is essential
for the survival of Arabidopsis thaliana during dark-induced carbon starvation. Journal of
Experimental Botany.3:667-680.
Moll R.H. 1982. Analysis and interpretation of factors which contribute to efficiency of
nitrogen utilization. Agronomy Journal 74, 562–564

79
Morris C.F., Paulsen G.M., 1985. Development of hard winter wheat after anthesis as
affected by nitrogen nutrition. Crop Science 25, 1007–1010.
Mosier A.R., 2001a. Exchange of gaseous nitrogen compounds between terrestrial systems
and the atmosphere. In Nitrogen in the Environment: Sources, Problem, and Management, ed.
R.F. Follett and J.L. Hatfield, 291-309. Amsterdam: Elsevier.
Mosier A.R., Syers J.K., Freney J.R. Eds., 2004. Agriculture and the Nitrogen Cycle.
Island Press, Washington, D.C., p. 296.
Moot D.J., Henderson A.L., Porter J. & Semenov M.A., 1996. Temperature, CO2 and the
growth and development of wheat: changes in the mean and variability of growing
conditions. Climatic Change 33, 351-368.
Muchow RC. 1998. Nitrogen utilization efficiency in maize and grain sorghum. Field Crops
Research; 56:209-216.
Muurinen S., Kleemola J. & Peltonen-Sainio P., 2006, ‗Accumulation and translocation of
nitrogen in spring cereal cultivars differing in nitrogen use efficiency,‘ Argonomy Journal,
pp. 445-447.
Namai S., Toriyama K., Fukuta Y., 2009. Genetic variations in dry matter production and
physiological nitrogen use efficiency in rice (Oryza sativa L.) varieties. Breeding
Science;59:269-276.
Nielsen R. L. 2006. Nitrogen loss mechanisms and nitrogen use efficiency. Purdue Nitrogen
Management Workshops.
Norman J.M., Garcia R., Verma,S.B., 1992. Soil surface fluxes and the carbon budget of a
grasland. J. Geophys. Res. 97, 18845–18853.
Oakes A. and B. Hirel, 1985. Nitrogen metabolism in roots. Annual Review of Plant
Physiology. 36:345-360.
Oaks A. 1994. Efficiency of nitrogen utilization in C3 and C4 cereals. Plant Physiology. 106:
407-414.
Obara M., Kajiura M., Fukuta Y., Yano M., Hayashi M., Yamaya T., Sato T., 2001.
Mapping of QTLs associated with cytosolic glutamine synthetase and NADH‐glutamate
synthase in rice (Oryza sativa L.). Journal of Experimental Botany 52, 1209–1217.
Ono F., Frommer WB., von Wiren N., 2000. Coordinated diurnal regulation of low‐ and
high‐affinity nitrate transporters in tomato. Plant Biology 2, 17–23.
Ortiz-Monasterio J.I., K.D. Sayre, S. Rajaram and M. McMahon, 1997. Genetic progress
in wheat yield and nitrogen use efficiency under four nitrogen rates. Crop Sci. 37:892-904.
Pan J., Y. Zhu, D. Jiang, T. Dai, Y. Li and W. Cao, 2006. Modeling plant nitrogen uptake
and grain nitrogen accumulation in wheat. Field Crop Res., 97: 322-336.
Pate JS., Atkins CA., White ST., Rainbird RM., Woo KC., 1980. Nitrogen nutrition and
xylem transport of nitrogen in ureide-producing grain legumes. Plant Physiol. 65: 961-965

80
Paulsen G. M. 1994. High temperature responses of crop plant. In: ―Physiology and
determination of crop yield‖ (ed. by Boote, K. J.). ASA, CSSA, SSSA, Madison, WI, pp.
365-389.
Prasad R. 1998. Fertilizer urea, food security, health and the environment. Current Science
75:677-683.
Presterl T., Seitz G., Landbeck M., Thiemt W., Schmidt W., Geiger HH., 2003.
Improving nitrogen use efficiency in European maize: estimation of quantitative parameters.
Crop Sci., 43: 1259-1265.
Purnell MP., Botella JR., 2007. Tobacco isoenzyme 1 of NAD(H)-dependent glutamate
dehydrogenase catabolizes glutamate in vivo. Plant Physiol. 143:530-539.
Quail K., Southan M., MacAulay G. and Avis O., 2011, What the World Wants from
Australian Wheat: Stakeholders Report 2011, Grain Growers Limited, North Ryde.
Quarrie S., Habash D., Bernard S., Schondelmaier J., Weyen J., 2007. The genetics of
nitrogen use in hexaploid wheat: N utilisation, development and yield. Theoretical and
Applied Genetics, 114, 403–419.
Quarrie S.A., Steed A., Calestani C., Semikhodskii A., Lebreton C., 2005. A high-density
genetic map of hexaploid wheat (Triticum aestivum L.) from the cross Chinese Spring × SQ1
and its use to compare QTLs for grain yield across a range of environments. Theoretical and
Applied Genetics, 110: 865–880.
Quesada A., Krapp A., Trueman LJ., Daniel‐Vedele F., Fernandez E., Forde BG.,
Caboche M., 1997. PCR‐identification of a Nicotiana plumbaginifolia cDNA homologous to
the high‐affinity nitrate transporters of the crnA family. Plant Molecular Biology 34, 265–
274.
Rahman M. A., J. Chikushi, S. Yoshida, H. Yahata and B. Yasunsga, 2005. Effect of
high air temperature on grain growth and yields of wheat genotypes differing in heat
tolerance. J. Agric. Meteorol. 60: 605-608.
Ramos C. 1996. Effect of agricultural practices on the nitrogen losses in the environment. In:
Rodriguez-Barrueco C, editor. Fertilizers and environment. Dordrecht, The Netherlands:
Kluwer Academic Publishers; 1996. p. 355-361.
Rao S.C. and T.H. Dao, 1996. Nitrogen placement and tillage effects on dry matter and
nitrogen accumulation and redistribution in winter wheat. Agron. J. 88:365–371.
Raun W. R. and G. V. Johnson, 1999. Improving nitrogen use efficiency for cereal
production. Agronomy journal 91: 357-363.
Raun W.R., J.B. Solie, G.V. Johnson, M.L.Stone, R.W. Mullen, K.W. Freeman, W.E.
Thomason, and E.V. Lukina, 2002. Improving nitrogen use efficiency in cereal grain
production with optical sensing and variable rate application. Agron. J. 94:815-820.
Rolland F., Moore B., Sheen J., 2002 Sugar sensing and signaling in plants. Plant Cell
(Suppl) 14: S185–S205.

81
Russell R. S. 1977. Plant root systems: their function and interaction with the soil (London:
McGraw Hill) Seastedt Τ R 1985 Canopy interception of nitrogen in bulk precipitation by
annually burned and unburned tall grass prairie; Oecologia (Berlin) 66 88-92
Salsac L. S., Chaillou J.F., Morot-Gaudry C. and E. Jolivoe, 1987. Nitrate and ammonium
nutrition in plants. Plant Physiol. Biochem. 25:805-812.
Samuelson ME., Campbell WH., Larsson CM., 1995. The influence of cytokinins in
nitrate regulation of nitrate reductase-activity and expression in barley. Physiologia
Plantarum 93: 533–539.
Schlesinger W. H. 1997. ‗‗Biogeochemistry: An Analysis of Global Change‘‘, 2nd edn,
Academic Press, San Diego, CA.
Schrader L. E. 1984. Functions and transformations of nitrogen in higher plants. In R.
D.Hauck (Ed.), Nitrogen in crop production, 55 - 65. ASA, CSSA, SSSA,
Madison,Wisconsin, USA.
Semenov M.A., P.D. Jamieson, and P. Martre. 2007. Deconvoluting nitrogen use
efficiency in wheat: A simulation study. Eur. J. Agron. 26:283-294.
Shearman V., Sylvester-Bradley R., Scott RK., Foulkes J., 2005. Changes in physiological
processes associated with recent genetic increases in grain yield of winter wheat in the UK.
Crop Science 45,175–185.
Simpson R.J., Lambers H. & Dalling M.J., 1983. Nitrogen redistribution during grain
growth in wheat (Triticum aestivum L.). IV. Development of a quantitative model of the
translocation of nitrogen to the grain. Plant Physiology, 71, 7-14.
Singh V. P., Arora A., 2001. Intraspecific Variation in Nitrogen Uptake and Nitrogen
Utilization Efficiency in Wheat (Triticum aestivum L.) Journal of Agronomy and Crop
Science, Vol. 186,Issue 4, 239-244.
Smil V. 1999. Nitrogen in crop production: An account of global flows. Global Biogeochem.
Cycles 13:647-662.
Stevenson F.J. John Wiley & Sons 1994. Humus chemistry: Genesis, Composition,
Reactions. 2nd ed., New York.
Stulen I., Perez-Soba M., De Kok LJ., Van Der Eerden L., 1998. Impact of gaseous
nitrogen deposition on plant functioning. New Phytologist 1998;139:61-70.
Suprayogi Y., J. M. Clarke, R. Bueckert, F. R. Clarke, C. J. Pozniak, 2011. Nitrogen
remobilization and post-anthesis nitrogen uptake in relation to elevated grain protein
concentration in durum wheat. Canadian Journal of Plant Science, 2011, 91(2): 273-282,
10.4141/CJPS10185
Sylvester-Bradley R., Kindred DR., Blake J., Dyer CJ., Sinclair AH., 2008. Optimising
fertilizer nitrogen for modern wheat and barley crops. London: HGCA. Project report No.
438.
Sylvester- Bradley R., Kindred DR., 2009. Analysing nitrogen responses of cereals to
prioritize routes to the improvement of nitrogen use efficiency. Journal of Experimental
Botany; 60:1939-1951.

82
Terce-Laforgue T., Dubois F., Ferrario-Mery S., Pou de Crecenzo M-A., Sangwan R.,
Hirel B., 2004. Glutamate dehydrogenase of tobacco is mainly induced in the cytosol of
phloem companion cells when ammonia is provided either externally or released during
photorespiration. Plant Physiol 136 4308–4317.
Tilman D., K.G. Cassman, P.A. Matson, R. Naylor, and S. Polasky, S 2002. Agricultural
sustainability and intensive production practices. Journal of Nature Vo 1. 418:671-675.
Tirol-Padre A., J.K. Ladha, U. Singh, E. Laureles, G. Punzalan, and
S. Akita, 1996. Grain yield performance of rice genotypes at suboptimal levels of soil N as
affected by N uptake and utilization efficiency. Field Crops Res. 46:127–143.
Tsay Y.F., Chiu, C.C., Tsai C.B., Ho, C.H., and Hsu, P.K., 2007. Nitrate transporters and
peptide transporters. FEBS Letters. 581: 2290–2300.
Van Herwaarden A.F., Richards R.A., and Farquhar G.D., 1998. ―Haying-off‖, the
negative grain yield response of dryland wheat to nitrogen fertilizer II. Carbohydrate and
protein dynamics. Australian Journal of Agricultural research 49: 1083- 1093.
Van Kessel C., Pennock D. J., and Farrell R. E., 1993. Seasonal variations in
denitrification and nitrous oxide evolution at the landscape scale. Soil Sci. Soc. Am. J. 57,
988–995.
Van Lauwe B., Palm C. A., Murwira H. K., and Merckx R., 2002. Organic resource
management in sub- Saharan Africa: validation of a residue quality-driven decision support
system. Agronomy Journal Vol 22 pp839-846.
Van Sanford D.A., MacKown C.T., 1988. Variation in nitrogen use efficiency among soft
red winter wheat genotypes. Theor. Appl. Genet. 72, 158–163.
Van Sanford D.A. & MacKown C.T., 1987. Cultivar differences in nitrogen remobilization
during grain filling in soft red winter wheat. Crop Science 27, 295-300.
Vitousek P.M., Hättenscwiller S., Olander L. & Allison S. 2002. Nitrogen and nature.
Ambio 31, 97-101.
Vlek P. L.G., and E.T. Craswell, 1981. Ammonia volatilization from flooded soils, Fertil.
Res. 2:227-245.
von Wiren N., Merrick M., 2004. Regulation and function of ammonium carriers in
bacteria, fungi and plants. Top Curr Genet 9: 95–120
Vouillot M. O. & Devienne-Barret F., 1999. Accumulation and remobilisation of nitrogen
in a vegetative winter wheat crop during or following nitrogen deficiency. Annals of Botany
83, 569-575.
Wang X. & Below F.E., 1992. Root growth, nitrogen uptake, and tillering of wheat induced
by mixed-nitrogen source. Crop Science 32, 997-1002.
Wheeler T.R., Batts G.R., Morison J.I.L., Ellis R.H., Hadley P. & Morison J.I.L., 1996.
Growth and yield of winter wheat (Triticum aestivum) crops in response to CO2 and
temperature. Journal of Agricultural Science 127, 37-48.

83
World Health Organization (WHO). 1970, modified 1993). International classification of
disease for oncology (ICD-O), second ed. Geneva.
World Health Organization (WHO), 2003. Diet, Nutrition and the Prevention of Chronic
Diseases: Report of a Joint WHO/FAO Expert Consultation, WHO Technical Report Series
916, World Health Organization, Geneva.
Ying J., S. Peng, G. Yang, N. Zhou, R.M. Visperas and K.G. cassman, 1998. Comparison
of high-yield rice in tropical and subtropical environments: II. Nitrogen accumulation and
utilization efficiency. Field Crops Res. 57:85-93.
Yoshida S. 1982. ‗‗Fundamentals of Rice Crop Growth‘‘. International Rice Research
Institute, Los Ban˜os, Philippines.
Youngquist J.B., Bramel-Cox P., Maranville J.W., 1992. Evaluation of alternative criteria
for selecting nitrogen use efficient genotypes in sorghum. Crop Science 32: 130-133.
Yuan L., Loque D., Kojima S., Rauch S., Ishiyama K., Inoue E., Takahashi H., von
Wiren N., 2007. The organization of high-affinity ammonium uptake in Arabidopsis roots
depends on the spatial arrangement and biochemical properties of AMT1-type transporters.
Plant Cell 19: 2636–2652.
Zhuo D., Okamoto M., Vidmar JJ., Glass ADM., 1999. Regulation of a putative
high‐affinity nitrate transporter (NRT2; 1At) in roots of Arabidopsis thaliana. The Plant
Journal17,563–568.

84
APPENDIXES
Appendix 1: Mintaro rainfall (mm) 2010 growing season
Appendix 2: Pinnaroo rainfall (mm) 2010 growing season

85
Appendix 3: Tuckey rainfall (mm) 2010 growing season
Appendix 4: Field trials analysis using two-way general ANOVA (Genstat)
A – Mintaro
Analysis of variance
Variate: Height
Source of variation d.f. s.s. m.s. v.r. F pr.
Block stratum 2 40.33 20.17 1.14
Block.Cultivar stratum
Cultivar 5 840.67 168.13 9.47 0.001
Residual 10 177.50 17.75 0.97
Block.Cultivar.Nitrogen stratum
Nitrogen 3 13.39 4.46 0.24 0.865
Cultivar.Nitrogen 15 103.44 6.90 0.38 0.977
Residual 36 658.17 18.28
Total 71 1833.50

86
Fisher's protected least significant difference test
Cultivar
Mean
G 76.00 a
RAC0875 78.50 ab
F 79.58 ab
M 82.00 bc
E 84.75 c
K 85.67 c
B- Tuckey
Analysis of variance
Variate: Height
Source of variation d.f. s.s. m.s. v.r. F pr.
Block stratum 2 56.08 28.04 1.84
Block.Cultivar stratum
Cultivar 5 730.83 146.17 9.58 0.001
Residual 10 152.58 15.26 0.62
Block.Cultivar.Nitrogen stratum
Nitrogen 3 1429.83 476.61 19.22 <.001
Cultivar.Nitrogen 15 291.50 19.43 0.78 0.686
Residual 36 892.67 24.80
Total 71 3553.50
Fisher's protected least significant difference test
Cultivar
Mean
G 78.25 a
F 79.17 a
RAC0875 80.58 ab
K 83.58 bc
E 84.67 cd
M 87.25 d

87
Fisher's protected least significant difference test
Nitrogen
Mean
0 75.44 a
50 81.50 b
100 84.61 bc
150 87.44 c
A-Mintaro
Analysis of variance
Variate: Head
Source of variation d.f. s.s. m.s. v.r. F pr.
Block stratum 2 35355. 17677. 4.46
Block.Cultivar stratum
Cultivar 5 79389. 15878. 4.00 0.030
Residual 10 39655. 3965. 0.95
Block.Cultivar.Nitrogen stratum
Nitrogen 3 14733. 4911. 1.17 0.334
Cultivar.Nitrogen 15 88144. 5876. 1.40 0.199
Residual 36 150947. 4193.
Total 71 408223.
Fisher's protected least significant difference test
Cultivar
Mean
RAC0875 483.3 a
K 525.8 ab
E 529.0 ab
F 546.0 b
G 576.4 b
M 581.5 b

88
B- Pinnaroo
Analysis of variance
Variate: Head
Source of variation d.f. s.s. m.s. v.r. F pr.
Block stratum 2 9117. 4558. 1.47
Block.Cultivar stratum
Cultivar 5 48391. 9678. 3.12 0.059
Residual 10 31054. 3105. 2.38
Block.Cultivar.Nitrogen stratum
Nitrogen 3 1227. 409. 0.31 0.815
Cultivar.Nitrogen 15 36932. 2462. 1.89 0.059
Residual 36 46922. 1303.
Total 71 173642.
A-Mintaro
Analysis of variance
Variate: Yield
Source of variation d.f. s.s. m.s. v.r. F pr.
Block stratum 2 84660. 42330. 9.71
Block.Cultivar stratum
Cultivar 5 165984. 33197. 7.62 0.003
Residual 10 43575. 4357. 0.59
Block.Cultivar.Nitrogen stratum
Nitrogen 3 72605. 24202. 3.25 0.033
Cultivar.Nitrogen 15 94488. 6299. 0.85 0.623
Residual 36 267721. 7437.
Total 71 729033.

89
Fisher's protected least significant difference test
Cultivar
Mean
F 687.2 a
K 694.0 a
RAC0875 741.3 ab
E 762.8 b
G 777.2 bc
M 826.1 c
Fisher's protected least significant difference test
Nitrogen
Mean
0 705.7 a
50 732.9 ab
150 763.8 ab
100 790.0 b
B- Pinnaroo
Analysis of variance
Variate: Yield
Source of variation d.f. s.s. m.s. v.r. F pr.
Block stratum 2 48821. 24411. 5.36
Block.Cultivar stratum
Cultivar 5 77718. 15544. 3.41 0.047
Residual 10 45572. 4557. 1.62
Block.Cultivar.Nitrogen stratum
Nitrogen 3 5214. 1738. 0.62 0.607
Cultivar.Nitrogen 15 53060. 3537. 1.26 0.276
Residual 36 100991. 2805.
Total 71 331377.

90
Fisher's protected least significant difference test
Cultivar
Mean
F 308.8 a
K 319.4 a
G 332.3 a
RAC0875 342.8 a
E 356.1 ab
M 410.0 b
Fisher's protected least significant difference test
Nitrogen
Mean
0 1.426 a
50 1.632 b
100 1.841 c
150 2.036 d
C- Tuckey
Analysis of variance
Variate: Yield
Source of variation d.f. s.s. m.s. v.r. F pr.
Block stratum 2 14787. 7394. 4.74
Block.Cultivar stratum
Cultivar 5 43667. 8733. 5.60 0.010
Residual 10 15586. 1559. 0.98
Block.Cultivar.Nitrogen stratum
Nitrogen 3 230108. 76703. 48.00 <.001
Cultivar.Nitrogen 15 17654. 1177. 0.74 0.733
Residual 36 57523. 1598.
Total 71 379326.

91
Fisher's protected least significant difference test
Cultivar
Mean
G 282.0 a
K 290.9 ab
F 318.8 b
RAC0875 320.2 b
E 325.7 bc
M 357.7 c
Fisher's protected least significant difference test
Nitrogen
Mean
0 241.2 a
50 282.2 b
100 359.9 c
150 380.2 c
A-Mintaro
Analysis of variance
Variate: thgw
Source of variation d.f. s.s. m.s. v.r. F pr.
Block stratum 2 22.503 11.252 1.57
Block.Cultivar stratum
Cultivar 5 518.093 103.619 14.48 <.001
Residual 10 71.583 7.158 0.85
Block.Cultivar.Nitrogen stratum
Nitrogen 3 87.147 29.049 3.45 0.027
Cultivar.Nitrogen 15 138.760 9.251 1.10 0.392
Residual 36 303.353 8.426
Total 71 1141.440

92
Fisher's protected least significant difference test
Nitrogen
Mean
0 46.71 a
150 46.71 a
100 48.67 ab
50 49.11 b
Fisher's protected least significant difference test
Cultivar
Mean
M 44.62 a
E 45.18 ab
K 47.15 bc
G 47.77 c
F 49.50 c
RAC0875 52.58 d
B- Pinnaroo
Analysis of variance
Variate: thgw
Source of variation d.f. s.s. m.s. v.r. F pr.
Block stratum 2 71.929 35.964 2.50
Block.Cultivar stratum
Cultivar 5 680.119 136.024 9.45 0.002
Residual 10 143.938 14.394 1.45
Block.Cultivar.Nitrogen stratum
Nitrogen 3 240.492 80.164 8.09 <.001
Cultivar.Nitrogen 15 151.182 10.079 1.02 0.460
Residual 36 356.567 9.905
Total 71 1644.226

93
Fisher's protected least significant difference test
Cultivar
Mean
K 39.00 a
E 39.68 ab
M 39.77 ab
G 42.76 bc
RAC0875 45.49 cd
F 47.01 d
C- Tuckey
Analysis of variance
Variate: thgw
Source of variation d.f. s.s. m.s. v.r. F pr.
Block stratum 2 1.123 0.562 0.09
Block.Cultivar stratum
Cultivar 5 224.453 44.891 7.54 0.004
Residual 10 59.523 5.952 1.46
Block.Cultivar.Nitrogen stratum
Nitrogen 3 39.720 13.240 3.25 0.033
Cultivar.Nitrogen 15 111.053 7.404 1.82 0.071
Residual 36 146.527 4.070
Total 71 582.400
Fisher's protected least significant difference test
Cultivar
Mean
K 43.42 a
E 43.88 ab
F 44.85 ab
G 45.40 ab
M 46.02 b
RAC0875 48.83 c

94
Fisher's protected least significant difference test
Nitrogen
Mean
150 44.36 a
100 45.17 ab
50 45.69 ab
0 46.39 b
A-Mintaro
Analysis of variance
Variate: grain N
Source of variation d.f. s.s. m.s. v.r. F pr.
Block stratum 2 1.75859 0.87929 12.10
Block.Cultivar stratum
Cultivar 5 0.72264 0.14453 1.99 0.166
Residual 10 0.72646 0.07265 1.17
Block.Cultivar.Nitrogen stratum
Nitrogen 3 0.76046 0.25349 4.09 0.013
Cultivar.Nitrogen 15 0.74307 0.04954 0.80 0.670
Residual 36 2.22855 0.06190
Total 71 6.93977
B- Pinnaroo
Analysis of variance
Variate: grain N
Source of variation d.f. s.s. m.s. v.r. F pr.
Block stratum 2 0.52820 0.26410 3.71
Block.Cultivar stratum
Cultivar 5 3.37062 0.67412 9.48 0.001
Residual 10 0.71141 0.07114 0.90

95
Block.Cultivar.Nitrogen stratum
Nitrogen 3 3.74505 1.24835 15.76 <.001
Cultivar.Nitrogen 15 1.19894 0.07993 1.01 0.468
Residual 36 2.85146 0.07921
Total 71 12.40568
Fisher's protected least significant difference test
Cultivar
Mean
M 1.331 a
K 1.646 b
E 1.671 b
G 1.866 bc
RAC0875 1.915 c
F 1.973 c
Fisher's protected least significant difference test
Nitrogen
Mean
150 40.42 a
50 41.20 a
100 42.29 a
0 45.23 b
C- Tuckey
Analysis of variance
Variate: grainN
Source of variation d.f. s.s. m.s. v.r. F pr.
Block stratum 2 0.02183 0.01091 0.28
Block.Cultivar stratum
Cultivar 5 0.29201 0.05840 1.50 0.272
Residual 10 0.38853 0.03885 1.90
Block.Cultivar.Nitrogen stratum
Nitrogen 3 0.16761 0.05587 2.73 0.058

96
Cultivar.Nitrogen 15 0.32178 0.02145 1.05 0.433
Residual 36 0.73618 0.02045
Total 71 1.92794
A-Mintaro
Analysis of variance
Variate: Biomass
Source of variation d.f. s.s. m.s. v.r. F pr.
Block stratum 2 282036. 141018. 5.16
Block.Cultivar stratum
Cultivar 5 322354. 64471. 2.36 0.116
Residual 10 273426. 27343. 0.66
Block.Cultivar.Nitrogen stratum
Nitrogen 3 468731. 156244. 3.78 0.019
Cultivar.Nitrogen 15 349650. 23310. 0.56 0.883
Residual 36 1488346. 41343.
Total 71 3184542.
Fisher's protected least significant difference test
Nitrogen
Mean
0 1826 a
50 1893 a
150 1949 ab
100 2046 b
B- Pinnaroo
Analysis of variance
Variate: Biomass
Source of variation d.f. s.s. m.s. v.r. F pr.
Block stratum 2 88440. 44220. 2.31
Block.Cultivar stratum

97
Cultivar 5 87374. 17475. 0.91 0.511
Residual 10 191587. 19159. 1.93
Block.Cultivar.Nitrogen stratum
Nitrogen 3 22484. 7495. 0.76 0.527
Cultivar.Nitrogen 15 189400. 12627. 1.27 0.269
Residual 36 357270. 9924.
Total 71 936556.
A-Mintaro
Analysis of variance
Variate: HI
Source of variation d.f. s.s. m.s. v.r. F pr.
Block stratum 2 0.0019528 0.0009764 2.49
Block.Cultivar stratum
Cultivar 5 0.0151569 0.0030314 7.75 0.003
Residual 10 0.0039139 0.0003914 0.62
Block.Cultivar.Nitrogen stratum
Nitrogen 3 0.0003931 0.0001310 0.21 0.891
Cultivar.Nitrogen 15 0.0076153 0.0005077 0.80 0.671
Residual 36 0.0228667 0.0006352
Total 71 0.0518986
Fisher's protected least significant difference test
Cultivar
Mean
F 0.3692 a
RAC0875 0.3733 a
K 0.3792 ab
E 0.3950 bc
G 0.4017 c
M 0.4075 c

98
B- Pinnaroo
Analysis of variance
Variate: H1
Source of variation d.f. s.s. m.s. v.r. F pr.
Block stratum 2 0.0176253 0.0088126 4.99
Block.Cultivar stratum
Cultivar 5 0.0371837 0.0074367 4.21 0.025
Residual 10 0.0176648 0.0017665 2.72
Block.Cultivar.Nitrogen stratum
Nitrogen 3 0.0057291 0.0019097 2.94 0.046
Cultivar.Nitrogen 15 0.0120704 0.0008047 1.24 0.290
Residual 36 0.0233889 0.0006497
Total 71 0.1136622
Fisher's protected least significant difference test
Nitrogen
Mean
100 0.3489 a
150 0.3506 a
50 0.3574 ab
0 0.3716 b
Fisher's protected least significant difference test
Cultivar
Mean
F 0.3268 a
K 0.3352 ab
RAC0875 0.3555 ab
G 0.3617 abc
E 0.3666 bc
M 0.3969 c

99
A-Mintaro
Analysis of variance
Variate: NUE
Source of variation d.f. s.s. m.s. v.r. F pr.
Block stratum 2 1307.94 653.97 9.37
Block.Cultivar stratum
Cultivar 5 2148.86 429.77 6.16 0.007
Residual 10 698.06 69.81 0.72
Block.Cultivar.Nitrogen stratum
Nitrogen 3 33467.89 11155.96 114.27 <.001
Cultivar.Nitrogen 15 1555.96 103.73 1.06 0.421
Residual 36 3514.46 97.62
Total 71 42693.17
Fisher's protected least significant difference test
Cultivar
Mean
K 78.50 a
F 79.25 ab
RAC0875 84.08 abc
E 86.28 bc
G 87.19 c
M 94.82 d
Fisher's protected least significant difference test
Nitrogen
Mean
50 1.278 a
0 1.313 ab
100 1.457 bc
150 1.529 c
100
B- Pinnaroo
Analysis of variance
Variate: NUE
Source of variation d.f. s.s. m.s. v.r. F pr.
Block stratum 2 940.71 470.36 6.45
Block.Cultivar stratum
Cultivar 5 1182.35 236.47 3.24 0.053
Residual 10 728.87 72.89 1.35
Block.Cultivar.Nitrogen stratum
Nitrogen 3 17721.54 5907.18 109.30 <.001
Cultivar.Nitrogen 15 614.99 41.00 0.76 0.711
Residual 36 1945.64 54.05
Total 71 23134.09
Fisher's protected least significant difference test
Nitrogen
Mean
150 28.21 a
100 34.62 b
50 48.11 c
0 69.19 d
C- Tuckey
Analysis of variance
Variate: NUE
Source of variation d.f. s.s. m.s. v.r. F pr.
Block stratum 2 556.88 278.44 2.55
Block.Cultivar stratum
Cultivar 5 1463.30 292.66 2.68 0.087
Residual 10 1093.07 109.31 1.26
Block.Cultivar.Nitrogen stratum
Nitrogen 3 15284.54 5094.85 58.95 <.001
Cultivar.Nitrogen 15 1078.61 71.91 0.83 0.638
Residual 36 3111.30 86.42
Total 71 22587.69

101
Fisher's protected least significant difference test
Nitrogen
Mean
150 37.91 a
100 46.55 b
50 51.97 b
0 77.07 c

102
Appendix 5: Field trials, soil physical and chemical characteristics
The initial soil analysis report (2010)
Name Pinnaroo Mintaro Tuckey
Depth 0-10 cm 0-10 cm 0-10 cm
Colour GR BR BRGR
Gravel % 0 0 0
Texture 3.5 3.5 1.5
Ammonium Nitrogen mg/Kg 3 7 3
Nitrate Nitrogen mg/K 25 28 10
Phosphorus Colwell mg/Kg 48 67 42
Potassium Colwell mg/Kg 724 715 431
Sulphur mg/Kg 8.35 22.40 422
Organic Carbon % 1.18 1.99 0.96
Conductivity dS/m 0. 217 0.318 0.183
pH level (CaCl2) pH 7.77 6.88 7.47
pH level (H2O) pH 8.57 7.42 8.13
DTPA Copper mg/Kg 0.51 1.70 0.37
DTPA Iron mg/Kg 15.58 48.42 68.31
DTPA Manganese mg/Kg 7.50 28.85 5.70
DTPA Zinc mg/Kg 1.45 1.60 2.47
Exc. Aluminium meq/100g <0.001 <0.001 <0.0

103
Appendix 6: Soil available N at the three sites and glasshouse experiments
Sites NO3-
-N
NH4+
-N Total available N
Mintaro 36.4 9.1 45.5 kg/ha
Pinnaroo 32.5 3.9 36.4 kg/ha
Tuckey 13 3.9 16.9 kg/ha
GH-experiments 13 0.65 13.65 kg/ha
Appendix 7: Soil texture and bulk density for different soil types
Soil texture Bulk density (g/cm3)
Coarse sand 1.3 – 1.8
Fine sand 1.3
Light sandy clay loam 1.3 – 1.6
Loam 1.1 – 1.4
Sandy clay loam 1.3 – 1.6
Clay loam 1.3 – 1.6
Clay 1.3 – 1.5
Self mulching clay 1.2 – 1.3

104
Appendix 8: Glasshouse experiments, soil physical and chemical characteristics
Name Unit (mg/kg) Name Unit (mg/kg)
pH (1:5 soil:water) 8.5 Mo <10
pH (0.01M CaCl2 7.9 Na 57.9
NH4-N 0.5 Ni 7.38
NO3-N 10 P 158
Al 13500 Pb <10
As <10 S 51.3
B 10.3 Sb <10
Ca 1720 Se <10
Cd <10 Zn 10.9
Co <10
Cr 13.3
Cu <10

105
Appendix 9: List of 24 wheat cultivars used at the three sites by (AGT) in (2010), including
selected six wheat varieties used in this project
Appendix10: Micronutrient supplied in the glasshouse experiment for adjusting nutrient
deficiency
Micronutrients 1000 x Stock mg l-1
H3BO3 25 mM 1.546 g
ZnSO4 2 µM 575 mg
MnSO4 2 mM 338 mg
CuSO4 0.5 mM 125 mg
(H2MoO4) (NH4)6M07O24 0.5 mM 618 mg
Wheat cultivars Wheat cultivars
AGT-KATANA MACE
AXE RAC0875
CATALINA RAC1669R
CORRELL RAC1671R
DERRIMUT RAC1412
DRYSDALE RAC1569
ESPADA RAC1683
EXCALIBUR WESTONIA
FRAME WYALKATCHEM
GLADIUS WAGT104
JANZ YITPI
KUKRI YOUNG