Embed Size (px)
Citation preview

JRRDJRRD Volume 52, Number 2, 2015
Pages 221–234
Evaluation of motion platform embedded with force plate-instrumented treadmill
Emily H. Sinitski, BSc;1–2* Edward D. Lemaire, PhD;1,3 Natalie Baddour, PhD21The Ottawa Hospital Research Institute, Centre for Rehabilitation Research and Development, Ottawa, Canada; 2Department of Mechanical Engineering and 3Faculty of Medicine, University of Ottawa, Ottawa, Canada
Abstract—Motek Medical’s Computer Assisted Rehabilita-tion Environment (CAREN)-Extended system is a virtual envi-ronment primarily used in physical rehabilitation andbiomechanical research. This virtual environment consists of a 180 degree projection screen used to display a virtual scene, a 12-camera motion capture system, and a 6 degree of freedom actu-ated platform equipped with a dual-belt treadmill and two force plates. The goal of this article was to investigate the performance characteristics associated with a “treadmill-motion platform” con-figuration and how system operation can affect the data collected. Platform static and dynamic characteristics were evaluated by translating or rotating the platform over progressively larger dis-tances and comparing input and measured values. Treadmill belt speed was assessed with and without a person walking on the plat-form and at different orientations. Force plate measurements were examined when the treadmill was in operation, during ambulation, and over time to observe the baseline drift. Platform acceleration was dependent on the distance travelled and system settings. Treadmill speed variability was greatest at faster speeds. Force plate measurements were affected by platform and treadmill oper-ation, contralateral impact forces during gait, and baseline drift. Knowledge of performance characteristics and their effect on out-come data is crucial for effective design of CAREN research pro-tocols and rehabilitation scenarios.
Key words: 6 DOF, acceleration, biomechanics, CAREN, dual belt, force plate, gait, motion platform, treadmill, virtual reality.
INTRODUCTION
The Computer Assisted Rehabilitation Environment (CAREN) (Motek Medical; Amsterdam, the Netherlands)
is a virtual environment and a rehabilitation aid used in research and clinical settings. This system enables innova-tive rehabilitation techniques and comprehensive evalua-tion measurements that provide insights into a person’s recovery process [1]. In addition to clinical use, research-ers employ the CAREN for scientific inquiry, furthering knowledge of walking stability [2], traumatic brain injury [3], and neurorehabilitation [4].
The CAREN-Extended system configuration inte-grates a motion capture system, six degree of freedom (DOF) motion platform, instrumented treadmill, and a virtual scene. The CAREN allows researchers to address a number of research questions by enabling manipulation of the standing or walking surface and visual scene and by providing real-time biofeedback or enabling interac-tion with the virtual environment.
The CAREN system’s discrete technologies are not new, but aggregating these systems for rehabilitation or research is currently state-of-the-art. Understandingthis system’s performance characteristics and limitations is crucial for effective design of research protocols or
Abbreviations: AP = anterior-posterior, CAREN = Computer Assisted Rehabilitation Environment, DOF = degree of free-dom, GRF = ground reaction force, ML = medial-lateral, VT = vertical.*Address all correspondence to Emily H. Sinitski, MASc; The Ottawa Hospital Research Institute CRRD, 505 Smyth Rd, Ottawa, ON K1H 8M2; 613-737-8899, ext 73220.Email: [email protected]://dx.doi.org/10.1682/JRRD.2013.11.0244
221
222
JRRD, Volume 52, Number 2, 2015
formulation of clinical treatment plans. Previously, Lees et al. examined response characteristics of the CAREN’s motion platform using sine and ramp input functions, which are commonly used to expose users to balance and postural perturbations [5]. Lees et al. provided an ampli-tude-frequency analysis to understand the best opera-tional range for standing balance protocols [5].
One particular challenge with the CAREN-Extended framework is integrating force plates within the motion platform. In a typical motion analysis laboratory, force plates are secured in a level walkway, shielded from elec-tromagnetic interference, and isolated from environmental vibrations. Conventional treadmill systems instrumented with force plates introduce electrical and mechanical noise from the treadmill belt motion and electric motor [6–8]. In the CAREN-Extended system, force plates are embedded in a treadmill and six-DOF platform. Force plate data are a key component of gait analysis and are typically used as an input of the inverse dynamic model to estimate multiple biomechanical parameters such as torque at the ankle, knee, and hip. Preliminary findings demonstrated that platform and treadmill operation affected the ground reaction force (GRF) signals [9], which will affect torque derived from the inverse dynamic model.
The goal of this article is to evaluate performance char-acteristics of the motion platform and treadmill and to examine the effects of different modes of CAREN opera-tion on force measurements. We hypothesized that platform and treadmill operations are consistent with manufacturer
specifications and that platform movement and treadmill operation affect force plate measurements. Since these sys-tems are emerging as tools for research and clinical rehabil-itation decision-making, a better understanding of technical performance is needed to develop protocols for specific human movement evaluations and to guide data collection, processing, and analysis methodologies. The performance tests cover static and dynamic characteristics of the motion platform, treadmill belt speed variability, force plate signals analysis during treadmill and platform operation, ambula-tion, and baseline drift.
METHODS
Equipment DescriptionA commercially available CAREN-Extended system
(Figure 1) incorporates a 12-camera (MX T20S) motion capture system (Vicon Inc; Oxford, United Kingdom), a 3 m diameter Sarnicola hydraulic motion platform capable of six DOFs (Sarnicola Simulation Systems Inc; Conklin, New York), a Bertec 1 × 2 m dual-belt treadmill instru-mented with two force plates (Bertec Corp; Columbus, Ohio), a 180° curved projection screen, and four F10 AS3D projectors (projectiondesign; Fredrikstad, Nor-way). Six hydraulic actuators were connected in a Stewart configuration and controlled independently to enable motion in six DOFs: sway or medial-lateral (ML) transla-tion, surge or anterior-posterior (AP) translation, heave or vertical (VT) translation, pitch, yaw, and roll (Figure 1).
Figure 1.(a) Computer Assisted Rehabilitation Environment-Extended system and (b) motion platform embedded with dual-belt treadmill sys-
tem and two force plates. AP = anterior-posterior, ML = medial-lateral, VT = vertical.

223
SINITSKI et al. Evaluation of instrumented motion platform
Data CollectionThree reflective markers were secured to the platform
to track platform motion. Vicon Nexus 1.8.2 software was used to record marker positions at 100 Hz and force plate data at 1,000 Hz. Force plate baselines were reinitialized prior to each performance test or trial. This involved a hard-ware zeroing of the force plates while unloaded, stationary, and level. The D-Flow 3.10.0 Platform Module (Motek Medical) was used to control platform translation and rota-tion. The D-Flow software integrates hardware components (e.g., treadmill and motion platform) and the virtual sce-nario using a modular programming framework [10]. The D-Flow platform safety filter parameter was set to 1, which was equivalent to the inverse of the cut-off frequency for a real-time second-order Butterworth low pass filter of 1 Hz.
Visual3D 4.96.4 (C-Motion Inc; Rockville, Mary-land) and MATLAB 2010a (The MathWorks; Natick, Massachusetts) were used to analyze each performance test. Visual3D was used to model the platform as a kine-matic object (segment) and to calculate platform transla-tion and rotation.
Motion Platform TestingThe motion platform’s static and dynamic perfor-
mance characteristics were examined. For the static analy-sis, the input platform position was compared with the measured platform position while the platform was sta-tionary at specific intervals of operation listed in Table 1. The mean platform angle or position over 1 s was deter-mined for four trials.
To examine the dynamic performance, the platform was translated or rotated over progressively larger dis-tances. At the start of each trial, the platform was positioned at the origin and then translated or rotated. After a few sec-onds, the platform was translated or rotated back to the starting position. This was repeated twice for each of the conditions listed in Table 2 and for three D-Flow safety fil-ter input settings (1, 2.5, and 5), where larger safety filter values resulted in more gradual platform movement. Plat-form velocity, acceleration, and deceleration were calcu-lated for translation trials; and platform angular velocity, angular acceleration, and angular deceleration were calcu-lated for rotation trials (Figure 2). Total platform transition time was defined from the time the platform velocity was greater than 0 m/s (Figure 2; T0) to the time when the plat-form velocity was 0 m/s and thus stationary (Figure 2; T2). Peak platform transition time was defined as the time from initial to peak platform position (Figure 2; T1).
Condition RangeTranslation (cm)
–25 to 25 in 5 cm intervals–20 to 32 in 5 cm intervals
Rotation (°)–20 to 20 in 5° intervals–20 to 20 in 5° intervals
Condition RangeTranslation (cm)
5, 10, 15, 20, 255, 10, 15, 20, 25, 30
Rotation (°)5, 10, 15, 205, 10, 15
At the start
of each trial, the force plates were reinitialized while the platform was level and stationary. During the trials, the platform changed orientation and the forces from gravity and platform weight were represented in the force signal (Figure 3(a)). To correct for these orientation-based forces, an offset (Figure 3(b)) was subtracted from the original force data so that the force data were zero when the plat-form was stationary (Figure 3(c)). Mean and two standard deviations of the resulting force signal were calculated to quantify the force due to platform acceleration (Figure 2).
Force Plate TestingForce plate measurements were examined when the
treadmill was in operation, during ambulation, and over time to observe the baseline drift. Data from two force plates were recorded as each treadmill belt speed increased from 0 to 5 m/s in 0.5 m/s increments. Mean and two stan-dard deviations over 5 s of force data were calculated for each speed. The power spectral density (Welch method [11]) of the force plate signal was estimated for the ML, AP, and VT directions and each treadmill belt speed. Com-pared with the Fast Fourier Transform, the Welch method reduces variability of the power spectral density estimate but decreases the frequency resolution. However, we did not require high frequency resolution for our analysis.
Table 1.Motion platform static testing range.
ML and AP VT
Pitch and Roll Yaw
AP = anterior-posterior, ML = medial-lateral, VT = vertical.
Table 2.Motion platform dynamic testing ranges.
ML and AP VT
Pitch and Roll Yaw
AP = anterior-posterior, ML = medial-lateral, VT = vertical.

224
JRRD, Volume 52, Number 2, 2015
Force plate measurements were also examined while a person walked at a self-selected pace (1.1 m/s) on one force plate to determine the effect of foot strike impact forces on the adjacent (unloaded) force plate. Mean and two standard deviations of force data over five foot strikes were calculated to examine the effect of foot contact on the unloaded force plate. The power spectral density of the unloaded force plate signal was also examined for the ML, AP, and VT directions.
Figure 2.Illustration of parameters calculated for motion platform testing.
Acc = acceleration, Dec = deceleration, AP = anterior-posterior,
SD = standard deviation.
Finally, force plate measurement drift was examined during an unloaded condition and a walking condition. All data were collected after following the standardized power-up sequence and the force plate amplifiers reached
Figure 3.Force plate output for level platform transitioning to incline ori-
entation. (a) Raw force signal. (b) Filtered signal representing
offset (1 Hz, low pass). (c) Raw signal minus offset. Shaded
area represents period when platform was moving.
optimal operational condition. For each condition, the force plates
were reinitialized and a 5 s trial was recorded to capture the baseline signal. For the unloaded condition, a 5 s trial was recorded every 5 min for a 40 min period without a person walking on the platform. For the walking condition, a per-son walked on the treadmill for five trials of 5 min each. With the participant off the platform, 5 s of force data was recorded between each trial. The mean forces between trials were examined.
Treadmill TestingTreadmill speed was examined with and without a per-
son walking on the treadmill to determine the difference

225
SINITSKI et al. Evaluation of instrumented motion platform
between input settings and measured treadmill belt speed. Three reflective markers were attached to the spokes of a distance-measuring wheel, which consisted of a single wheel attached to a handle that can be pushed or pulled alongside a person. To examine treadmill speed without a person walking on the treadmill, a person stood on the platform next to the treadmill, holding the distance-measuring wheel on the treadmill belt. To examine speed with a person walking on the treadmill, a person walked on one belt while holding the distance wheel out in front of his or her feet on the same treadmill belt. Markers were also attached to the person’s feet to calculate treadmill speed from the foot marker trajectories during single limb stance. Treadmill belt speed was increased from 0.5 to 3.0 m/s in 0.5 m/s increments without a person on the treadmill, and from 0.5 to 2.0 m/s in 0.25 m/s increments with a person walking on the treadmill. Each increment was approximately 10 s in duration. Motion data were col-lected for left and right treadmill belts separately while the platform was level, 7° incline (pitch), and 7° decline (pitch). The distance wheel was modeled using Visual3D, with the origin at the center of the distance wheel. Angular velocity of the distance-measuring wheel was calculated and converted to linear velocity of the treadmill belt. Mean and standard deviation were calculated over 3 s for each treadmill belt and each speed increment without a person on the treadmill. Treadmill speed was also calculated from foot marker AP velocity to evaluate the use of foot marker data as a method to determine treadmill speed. Five con-
secutive frames of foot marker velocity with the smallest standard deviation were selected during single-leg stance. These data corresponded to the smoothest part of the velocity curve when the foot was flat on the treadmill. Treadmill velocity for the same period was also derived using the distance wheel. Mean velocity over 10 steps was calculated for both methods to evaluate foot marker veloc-ity as a measure of treadmill belt speed.
RESULTS
Motion Platform TestingThe static performance for platform translation and
rotation was consistent with the input specified in D-Flow. Differences between the input and measured platform ori-entations were on average less than 0.5 cm for translation trials (Figure 4(a)) and less than 1° for rotation trials (Figure 4(b)), where larger errors were observed at the end of the test range. Additionally, platform movement in the other axes (e.g., AP and VT axes for ML trials) were on average less than 0.5 cm for translation trials and less than 0.5° for rotation trials.
Maximum platform velocity, acceleration, and decel-eration increased as the distance the platform traveled increased (Figure 5). Maximum deceleration
Figure 4.Difference between D-Flow input and measured platform position for platform (a) translation and (b) rotation operational range for
one trial. (c) Difference between each platform transition, where 5 cm or 5° was desired transition. AP = anterior-posterior, ML =
medial-lateral, VT = vertical.
was smaller than maximum acceleration for the same distance trav-eled. Platform peak transition time was approximately 1 s for a default D-Flow safety filter, set to 1, and increased

226
JRRD, Volume 52, Number 2, 2015
Figure 5.Dynamic performance characteristic for platform translation and rotation including platform velocity, acceleration, deceleration, peak
transition time, total transition time, and overshoot. Acc = acceleration, AP = anterior-posterior, Decel = deceleration, ML = medial-
lateral, Vel = velocity, VT = vertical.

227
SINITSKI et al. Evaluation of instrumented motion platform
to approximately 4 s for the largest safety filter setting (Figure 5). Peak platform orientation was often greater than the specified input (overshoot) before gradually moving to the final orientation. As the D-Flow safety fil-ter increased, the platform total transition time and over-shoot increased and the platform acceleration decreased (Figure 5). When the platform was stationary, force sig-nals were less than 3 N, and force signals increased when the platform was moving. Force signals increased as plat-form acceleration increased and were largest in the direc-
tion of platform motion (Figure 6). Even the most gradual platform movement (safety filter = 5) introduced force plate noise when compared with a stationary plat-form, but the noise was less than 30 N (Figure 6). Addi-tional results tables for motion platform testing can be found in the Appendix
Figure 6.Two standard deviations of force measurements due to platform acceleration for progressively larger platform movement. AP = anterior-
posterior, ML = medial-lateral, na = not applicable, VT = vertical.
(available online only).
Force Plate TestingWhen the treadmill belts were stationary (0 m/s)
force plate noise was less than 3 N and increased with
228
JRRD, Volume 52, Number 2, 2015
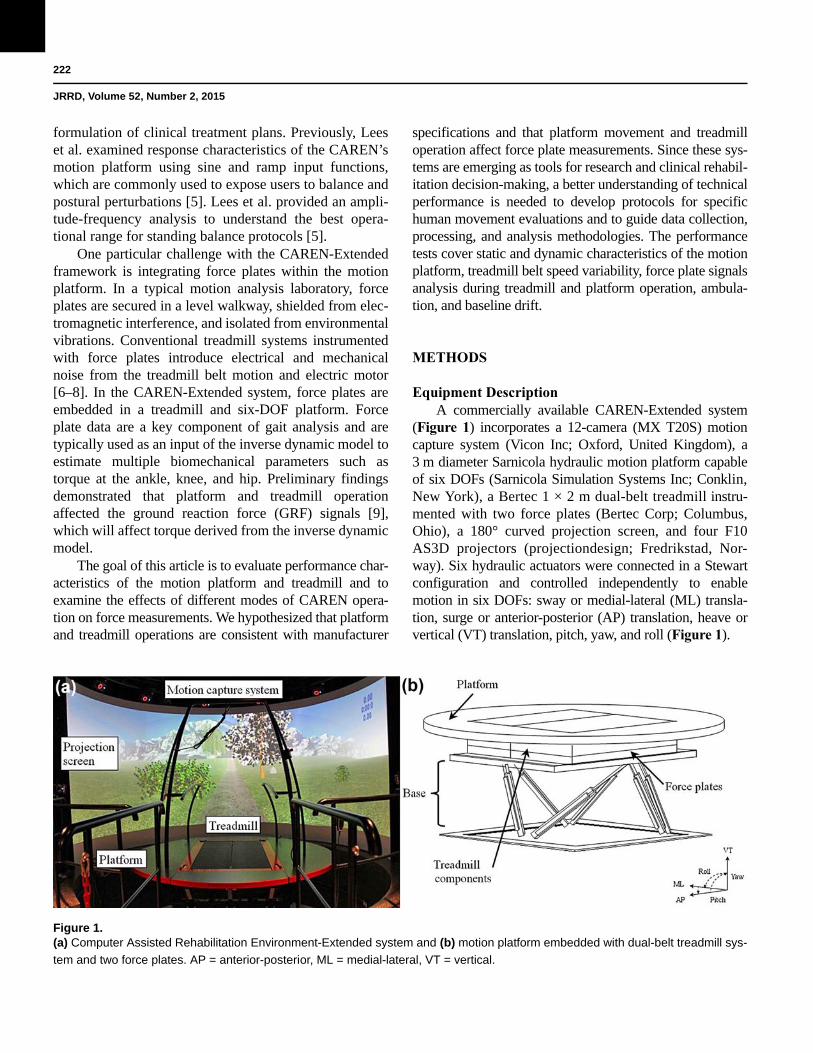
increasing treadmill belt speed. For treadmill speeds 0.5 to 2.0 m/s, force plate noise was less than 10 N, and for speeds 2.5 to 5.0 m/s, force plate noise was between 10 and 40 N. The power spectral density showed that most signal noise from the treadmill components occurred at frequencies higher than 20 Hz (Figure 7(a)) and could be effectively removed using a low-pass filter with a 20 Hz cut-off frequency (Figure 7(b)).
Figure 7.Power spectral density (PSD) of (a) unfiltered force signal and (b) filtered force signal for each axis as treadmill belt speed increased
from 0 to 5 m/s. Force data were filtered using fourth-order Butterworth low-pass filter with cut-off frequency of 20 Hz. AP = anterior-
posterior, ML = medial-lateral, VT = vertical.
The platform tracking markers exhibited more VT translation when a person walked on the platform than observed without a person walking on the platform; how-ever, this difference was less than 1 mm. With a person walking on one force plate, the adjacent or unloaded force plate measurements should be 0 N. However, a force signal artifact was observed on the unloaded force plate equivalent to ±40 N, averaged over all force chan-nels (Figure 8(a)). The power spectral density analysis
demonstrated the frequency components of this force sig-nal artifact were between 0 and 40 Hz. This overlaps the frequency components of GRFs [12] and cannot be easily removed by filtering techniques. Applying a low-pass fil-ter was only able to reduce the force signal artifact to less than 20 N (Figure 8(b)).
GRFs drifted less than 3 N over a 40 min period with-out a person walking on the platform (Figure 9(a)). When a person walked on a level platform, the VT drifted approximately 5 N every 5 min and the AP and ML GRFs drifted less than 5 N over a 25 min period (Figure 9(b)).
Treadmill TestingTreadmill speed was consistent across the platform
conditions tested (level, incline, and decline) with and without a person walking on the treadmill (Table 3).

229
SINITSKI et al. Evaluation of instrumented motion platform
Figure 8.(a) Unfiltered force signal artifact and (b) filtered force signal
artifact from unloaded force plate while person only walked on
other force plate. Force data were filtered using fourth-order
Butterworth low-pass filter with cut-off frequency of 20 Hz.
Force measurements on unloaded force plate should be 0 N;
however, force signal artifact was observed in unloaded force
plate signal. Each distinct peak in force signal (a) represented a
foot strike on other force plate. Red line at 0 N on all graphs
represents force signal without person walking on platform.
Treadmill speed variability was greater when a person walked on the treadmill and the variability was greater at faster speeds. The measured treadmill speed was approx-imately 3 percent faster than the input speed without a person walking on the treadmill and approximately 4 per-cent faster when a person walked on the treadmill.
Figure 9.Force signal baseline drift for each axis (a) without person walking
on level treadmill (unloaded condition) and (b) with person walking
on level treadmill (walking condition). AP = anterior-posterior, ML =
medial-lateral, VT = vertical.
Tread-mill speed calculated from foot marker velocity during single leg stance was consistent with a standard deviation less than 0.02 m/s across 10 steps. The difference between treadmill belt speed calculated from foot marker
velocity data and treadmill belt speed calculated from the distance wheel was less than 2 percent.
DISCUSSION
This article examined a number of operational param-eters and their effects on force plate data collected in a motion analysis system equipped with a six DOF plat-form. Understanding how modes of operation affect force plate signals and how to minimize possible interferences is important for clinicians and researchers when develop-ing rehabilitation treatment plans or research protocols.

230
JRRD, Volume 52, Number 2, 2015
Input Speed (m/s)Platform Condition % Error
MeanLevel Decline Incline
0.50 0.52 ± 0.01 0.52 ± 0.01 0.52 ± 0.01 4.71.00 1.03 ± 0.01 1.04 ± 0.01 1.04 ± 0.01 3.71.50 1.55 ± 0.01 1.55 ± 0.01 1.55 ± 0.01 3.32.00 2.06 ± 0.01 2.07 ± 0.01 2.07 ± 0.01 3.32.50 2.58 ± 0.01 2.58 ± 0.01 2.58 ± 0.01 3.23.00 3.10 ± 0.02 3.10 ± 0.01 3.10 ± 0.01 3.3Average 3.6
0.50 0.51 ± 0.06 0.53 ± 0.05 0.51 ± 0.03 3.30.75 0.75 ± 0.05 0.78 ± 0.03 0.74 ± 0.04 1.81.00 1.03 ± 0.03 1.04 ± 0.05 1.00 ± 0.04 2.31.25 1.29 ± 0.05 1.31 ± 0.05 1.27 ± 0.03 3.21.50 1.54 ± 0.07 1.58 ± 0.06 1.52 ± 0.04 3.11.75 1.80 ± 0.05 1.86 ± 0.07 1.75 ± 0.04 4.02.00 2.12 ± 0.05 2.09 ± 0.06 2.07 ± 0.06 4.7Average 3.2
0.50 0.52 ± 0.00 0.52 ± 0.01 0.52 ± 0.00 4.00.75 0.79 ± 0.00 0.76 ± 0.01 0.79 ± 0.01 4.01.00 1.05 ± 0.01 1.04 ± 0.01 1.05 ± 0.01 4.71.25 1.31 ± 0.01 1.30 ± 0.01 1.31 ± 0.00 4.51.50 1.57 ± 0.01 1.56 ± 0.02 1.58 ± 0.01 4.71.75 1.84 ± 0.01 1.81 ± 0.02 1.82 ± 0.01 4.22.00 2.11 ± 0.01 2.10 ± 0.01 2.11 ± 0.01 5.3Average 4.5
Motion platform translation and rotation were consis-tent with manufacture specifications. Although differences between input and measured platform orientation were small, the difference between each increment was consis-tently slightly smaller or larger (Figure 4(c)) instead of the intended increment of 5 cm or 5°. As a result, this error was compounded over the total platform movement and was only reset when the platform returned to a neutral or settled position. Including platform tracking markers for CAREN data collection sessions will allow the user to determine whether errors in platform motion haveoccurred and determine force plate corner locations for slope conditions.
The results from this research also showed how vari-ous equipment settings affect platform acceleration. For a
given safety filter setting, platform transition time was constant over different platform travel distances (Figure 5), and the platform acceleration varied. Increasing plat-form travel distance resulted in larger platform accelera-tions, corresponding to larger forces applied to a person (Figure 6). Both platform acceleration and safety filter settings affected the magnitude of this force. While larger forces might be useful in creating more challenging envi-ronments, when investigating postural balance or walking stability, an understanding of these effects is important when attempting to control for perturbing force. Further-more, there is currently no accepted method to account for platform acceleration effects on force data; therefore, kinetic analyses should only analyze gait cycles when the platform is stationary.
Table 3.Mean ± standard deviation of treadmill belt speed for one belt with (walking condition) and without (unloaded condition) person walking on treadmill. For walking condition, treadmill belt speed was calculated from foot marker data and distance wheel data for 10 steps. For unloaded condition, treadmill speed was calculated for 3 s of distance wheel data.
Unloaded Condition—Calculated From Distance Wheel
Walking Condition—Calculated From Distance Wheel
Walking Condition—Calculated From Foot Marker

231
SINITSKI et al. Evaluation of instrumented motion platform
Depending on the scenario, gradual platform transi-tion or smaller perturbing force may be preferable to ensure patient safety for people with mobility disabilities. The D-Flow Platform Module safety filter parameter can be used to control platform acceleration; however, this setting affects all platform movement in an application. Furthermore, an application may require varied platform travel distance during a session or less perturbing force than the Platform Module safety filter parameter allows. To address this problem, the D-Flow Filter module can be used to generate custom and activity-specific platform transitions [9]. Generally, a safety filter value of 5 (0.2 Hz low pass filter) produced a comfortable, 3 s platform peak transition time for a 7° slope. For people with mobility disabilities, slower transition speeds may be required for transitioning from a level platform to steeper slopes.
An overshoot was observed for platform conditions tested and increased as D-Flow safety filter increased or platform travel distance increased (Figure 5). As a result, larger overshoots resulted in longer total platform transi-tion times. Although the platform moved very slowly dur-ing the final transition period (approximately 5% of peak velocity), this platform motion still resulted in force plate signal noise. Depending on the research question, select-ing gait cycles after the platform reaches its final position may be important for kinematic and kinetic analyses.
Consistent with the hypothesis, treadmill operation affected force plate signals. In this study, the signal noise from the treadmill operation was small and negligible for speeds less than 2.0 m/s. Similar to data reported by Paolini et al. [6], this noise can be effectively removed by standard low-pass filtering methods for treadmill systems.
Force and moment signals did not drift appreciably when the force plates were unloaded. However, there was a consistent vertical drift of 5 N every 5 min when the force plates were in continuous use (Figure 9(b)). For a level platform, the vertical axis baseline drift will affect vertical GRF magnitudes, and in turn, automatic gait event identification, custom event triggers in D-Flow, and outcome measures from inverse dynamics (e.g., sag-ittal joint forces, moments, and powers). However, we only examined force plate baseline drift when the plat-form was level and baseline drift could occur in other force plate axes for nonlevel platform conditions (e.g., sloped). Since larger baseline drift can be expected for long data collection sessions, force plates should be zeroed frequently when force data are recorded or uti-lized in the D-Flow software. Depending on the type of
CAREN session, it may be impractical for the participant to get on and off the platform to reinitialize the force plate baseline. In this case, postprocessing techniques can be used to account for the drift by using force data during the swing phase of gait [6].
Additionally, impact forces during walking alsoaffected force plate signals on the adjacent force plate. A force signal artifact was observed on the unloaded force plate while a person only walked on the opposite force plate, and this artifact could not be easily removed with standard filtering techniques. This artifact may reflect platform vibration, slight structural deformations of the frame, or response characteristics of the hydraulics result-ing from the impact force of foot strikes. Furthermore, both force plates are secured to the same base and are not isolated from each other. Any vibrations through the structure will affect measurements on both force plates. Power spectral density analysis showed that the signal artifact frequency components overlapped with the gait frequency components. Although we examined the force signal artifact for one walking velocity, the artifact’s mag-nitude will increase when impact forces are larger because of mass, faster walking velocities, decline walking, or pathological gait (e.g., lower-limb amputation). Filtering may be inadequate to completely remove these artifacts, and larger artifacts may appear as a “transient force” in GRF signals. Examining force plate signal artifact for only one person walking at one gait speed was a limitation in this research. Future work examining multiple walking speeds and participant demographics could define the scope of signal artifacts from gait on this six DOF motion platform.
Treadmill belt speed was consistently 3 percent faster than the specified input speed for the treadmill system used in this article. Treadmill belt speed variability was larger when a person walked on the treadmill and was consistent with previous research that demonstrated tread-mill belt speed variability is also influenced by the per-son’s mass [13–14]. Using foot markers to determine treadmill speed was similar to the treadmill speed mea-sured using the distance wheel. This is a useful method for calculating temporal-spatial parameters such as stride length and step length, particularly when using a treadmill system with a self-paced (variable speed) feature.

232
JRRD, Volume 52, Number 2, 2015
CONCLUSIONS
This research highlighted a number of considerations when operating and interpreting the data collected using the CAREN-Extended system. Specifically, factors that may affect force measurements collected from force plates embedded in a motion platform were examined. These factors have to be considered to ensure data valid-ity and to avoid misinterpretation of the results. Motion and force signal artifacts were observed even when the platform was stationary. While platform acceleration affects force signals, there is no accepted method to account for these effects. Future research is necessary to account for platform acceleration and continuous plat-form movement in order to obtain accurate force data for the new generation of virtual rehabilitation systems. Fur-thermore, CAREN system hardware can vary between installations and these tests can be completed to under-stand specific system performance at individual sites.
ACKNOWLEDGMENTS
Author Contributions:Study concept and design: E. H. Sinitski, E. D. Lemaire, N. Baddour.Acquisition of data: E. H. Sinitski.Analysis and interpretation of data: E. H. Sinitski, E. D. Lemaire, N. Baddour.Drafting of manuscript: E. H. Sinitski.Critical revision of manuscript for important intellectual content: E. D. Lemaire, N. Baddour.Financial Disclosures: The authors have declared that no competing interests exist.Funding/Support: This material was based on work supported by the Canadian Forces Health Services Group and Natural Sciences and Engineering Research Council of Canada.Additional Contributions: The authors would like to thank Courtney Bridgewater, Andrew Smith, and Joao Tomas for their assistance with the data collection sessions, and Andrew Smith for the drawing in Figure 1. A portion of this research was presented at the Institute of Electrical and Electronics Engineers International Symposium on Medical Measurements and Applications, May 4–5, 2013, in Gatin-eau, Quebec, Canada. Emily H. Sinitski has earned a Master of Applied Science degree since the study was performed.
REFERENCES
1. Darter BJ, Wilken JM. Gait training with virtual reality-based real-time feedback: Improving gait performance fol-lowing transfemoral amputation. Phys Ther. 2011;91(9):
1385–94. [PMID:21757579]http://dx.doi.org/10.2522/ptj.20100360
2. McAndrew PM, Wilken JM, Dingwell JB. Dynamic stabil-ity of human walking in visually and mechanically destabi-lizing environments. J Biomech. 2011;44(4):644–49.[PMID:21094944]http://dx.doi.org/10.1016/j.jbiomech.2010.11.007
3. Rábago CA, Wilken JM. Application of a mild traumatic brain injury rehabilitation program in a virtual realty envi-ronment: A case study. J Neurol Phys Ther. 2011;35(4): 185–93. [PMID:22027473]http://dx.doi.org/10.1097/NPT.0b013e318235d7e6
4. Kizony R, Levin MF, Hughey L, Perez C, Fung J. Cogni-tive load and dual-task performance during locomotion poststroke: A feasibility study using a functional virtual environment. Phys Ther. 2010;90(2):252–60.[PMID:20023003]http://dx.doi.org/10.2522/ptj.20090061
5. Lees A, Vanrenterghem J, Barton G, Lake M. Kinematic response characteristics of the CAREN moving platform system for use in posture and balance research. Med Eng Phys. 2007;29(5):629–35. [PMID:16952478]http://dx.doi.org/10.1016/j.medengphy.2006.06.004
6. Paolini G, Della Croce U, Riley PO, Newton FK, Casey Kerrigan D. Testing of a tri-instrumented-treadmill unit for kinetic analysis of locomotion tasks in static and dynamic loading conditions. Med Eng Phys. 2007;29(3):404–11.[PMID:16759895]http://dx.doi.org/10.1016/j.medengphy.2006.04.002
7. Dierick F, Penta M, Renaut D, Detrembleur C. A force measuring treadmill in clinical gait analysis. Gait Posture. 2004;20(3):299–303. [PMID:15531177]http://dx.doi.org/10.1016/j.gaitpost.2003.11.001
8. Kram R, Griffin TM, Donelan JM, Chang YH. Force tread-mill for measuring vertical and horizontal ground reaction forces. J Appl Physiol. 1998;85(2):764–69.[PMID:9688758]
9. Sinitski EH, Lemaire ED, Baddour N. Characteristics of a dual force plate system embedded in a six degree of free-dom motion platform. Proceedings of the 2013 IEEE Inter-national Symposium on Medical Measurements and Applications; 2013 May 4–5; Gatineau, Canada.
10. Geijtenbeek T, Steenbrink F, Otten B, Even-Zohar O. D-Flow: Immersive virtual reality and real-time feedback for rehabilitation. Proceedings of the 10th International Con-ference on Virtual Reality Continuum and Its Applications in Industry; 2011; Hong Kong, China.
11. Welch PD. The use of fast Fourier transform for the estima-tion of power spectra: a method based on time averating over short, modified periodograms. IEEE Trans Audio Electroacoust. 1967;15:70–73.http://dx.doi.org/10.1109/TAU.1967.1161901

233
SINITSKI et al. Evaluation of instrumented motion platform
12. Antonsson EK, Mann RW. The frequency content of gait. J Biomech. 1985;18(1):39–47. [PMID:3980487]http://dx.doi.org/10.1016/0021-9290(85)90043-0
13. Riley PO, Paolini G, Della Croce U, Paylo KW, Kerrigan DC. A kinematic and kinetic comparison of overground and treadmill walking in healthy subjects. Gait Posture. 2007;26(1):17–24. [PMID:16905322]http://dx.doi.org/10.1016/j.gaitpost.2006.07.003
14. Savelberg HH, Vorstenbosch MA, Kamman EH, van de Weijer JG, Schambardt HC. Intra-stride belt-speed varia-tion affects treadmill locomotion. Gait Posture. 1998; 7(1):26–34. [PMID:10200372]http://dx.doi.org/10.1016/S0966-6362(97)00023-4
Submitted for publication November 12, 2013. Accepted in revised form January 23, 2015.
This article and any supplementary material should be cited as follows:Sinitski EH, Lemaire ED, Baddour N. Evaluation ofmotion platform embedded with force plate-instrumented treadmill. J Rehabil Res Dev. 2015; 52(2):221–34.http://dx.doi.org/10.1682/JRRD.2013.11.0244