Embed Size (px)
Citation preview

Evaluation of Mineralogical Composition for Reliable Petrophysical Model by Advanced Neutron Induced Gamma Ray Spectroscopy in Heavy Oil Sands, Cambay Basin – A Case Study Gaurav Kumar Sharma, ONGC Ltd., Ramesh Chander Pareek, ONGC Ltd., G. Satya Swaroop, ONGC Ltd., R L Singh, ONGC Ltd., Ajay Kumar, HLS Asia Ltd, Ravinder Kumar, HLS Asia Ltd., R. N. Chakravorty, HLS Asia Ltd. [email protected] ABSTRACT The big challenge during petrophysical analysis of any rock is to build reliable petro physical model incorporating sufficient information of the mineralogy that constitutes the formation. Cross-plots based on traditional logs do not help for mineral identification particularly when the mineralogy is complex and different minerals have similar overlapping physical properties. To overcome this problem, the neutron induced gamma ray spectroscopy measurements have been a precious input for decades. The practice continues even now, but with additional ability to measure aluminum (Al), manganese (Mn), and magnesium (Mg) elemental weight percentages besides conventional elements the industry witnesses. The advancement in technology with improved and wider measurement capabilities is leading to precise mineralogical evaluation, not previously achieved. The petrophysical models are more reliable using this minerlogical composition as input providing results closer to reality which is otherwise difficult. The study pertains to well drilled in Santhal field, southern segment of “heavy oil belt” of North Cambay basin, India. The varying mineralogy characteristically makes the petrophysical evaluation difficult by using basic conventional log suites. To validate and further improve existing petrophysical model, in Upper Suraj and Kalol pay sands, advanced neutron induced capture spectroscopy data was acquired along with conventional logging suite. The pay sands are separated from each other by shale of varying thickness. The measured spectroscopy data comprises dry weight percentages of Si, Ca, Fe, S, Ti, Mg, Gd, Al, K, and Mn. The data was analysed using various elemental cross-plots and information from cores available in offset wells. The measured spectroscopy data was used as input to multi-mineral solver software, providing mineralogy output, consequently yielding better porosity and water saturation calculation. Fe occur in high concentration in Upper Suraj pay. The ratio of Fe and Al is abnormally high more nearly typical of hydrated iron oxide. The mineralogical evaluation suggests that this pay is clayey with minerals comprising quartz, siderite, and limonite. The concentration of iron and aluminum is relatively very low in Kalol pay sands. KS-1 is essentially clean whereas KS-2 is described as argillaceous. The shales are characterized by a low K as well as high Al and Fe. The shales are seen enriched with Ti. The mineralogical analysis suggests the composition of the shales, predominated by main clay minerals as kaolinite and chlorite in addition to variable ratio of montmorillonite, while the non- clay minerals include quartz, calcite and siderite. The presence of S is seen nearly typical of pyrite in shale section overlying Kalol formation. This paper describes the application of advanced neutron induced capture spectroscopy data to petrophysical evaluation and characterization of Upper Suraj pay, Kalol pay and shale section. The results in the studied well are in agreement with core data of offset wells. There is enhancement in interpretation abilities in the formation for accurate porosity and water saturation computations, and finally accomplishing better understanding of reservoir. INTRODUCTION Santhal field is one of the heavy oil fields of Mehsana Asset in Cambay basin. The field was discovered in 1970 and put on production in 1974. This field, along with Balol and Lanwa fields, is part of a single structure spread over along south to north, Figure 1. The structure is monocline and west-east dipping, abutting at Mehsana Horst in the west and supported with active edge-water from east direction. The field is spread

over an area 6 km long and 3 km wide, possess a multi-layered reservoir of late Eocene age. The main producing sands are Upper Suraj Pay, KS-I, KS-II, KS-III and lower sand of Kalol formation. The pay sands are separated from each other by shale of varying thickness.
Figure 1: Heavy Oil Fields of Cambay Basin The Kalol sands are found at a depth of about 1000m having thick oil of gravity 17º API. Upper Suraj Pay and Kalol sands represent significant variety in reservoir characteristics (i.e. mineralogy, porosity, and permeability). In general, USP is tight in nature while other reservoirs are porous. USP comprises of quartz wacke with siderite and its alteration products like limonite. Kalol sands are argillaceous, silty and sandy shale occasionally sideritic sandstone. At places ferruginised oolites have been observed in cores. This warrants a need to apply suitable technology for quantitative estimate of formation mineralogical composition providing:
• Improved accuracy and assurance for evaluations in simple mineralogy formation • Improved volumetric petrophysical evaluations in complex mineralogy formation
This paper describes the demonstrated solution using advanced neutron induced gamma ray spectroscopy for these needs. APPROACH An accurate predictor of clay content is Al. The old geochemical tool were not able to precisely measure this element and only solution was to use the empirical relationships that provide an Al emulation based on the quantity of Si, Ca, and Fe. Nevertheless, now there is improvement in technology that directly measures some of the key, yet difficult elements to quantify:
Aluminum for shales / clays Magnesium for carbonates (Dolomite vs. Limestone) Manganese for a common constituent of carbonates and sheet silicates.
This advancement in technology with improved and wider measurement capabilities has led to precise mineralogical evaluation and grain density. The petrophysical models are more reliable using this mineralogical composition as input providing results closer to reality which is otherwise difficult.

The measured neutron-induced gamma ray spectra is processed using a weighted least-squares solver to extract relative elemental yields. Then, the relative yields are converted into dry-rock elemental weight fractions by running an oxides closure model. Oxides closure model The relative elemental yields are reflective of elemental concentrations in the formation, but they are not directly useful for petrophysical evaluation. To be used in a meaningful way, the relative yields must be converted into absolute elemental weight fractions. The relative yields can be converted to elemental concentrations by dividing each yield by a relative sensitivity factor as gamma rays produced in the formation are proportional to the neutron flux in the formation. The neutron flux in the formation depends on several environmental parameters, and therefore can vary from depth to depth in a given well, though neutron output from the americium-beryllium source is constant. The problem is overcome by accounting for variability of the neutron flux by applying a depth-varying normalization factor. In the industry, main technique used to derive the necessary depth-varying factor is the oxides closure model (Hertzog, et al., 1987), which assumes the primary formation elements measured by the tool sum to unity and exist as a single oxide or carbonate., i.e.,
1=
∑
i i
ii Sy
OF (1)
where F = the depth-varying normalization factor, Oi = ratio of the oxide or carbonate associated with element i to the weight of element i, yi = relative yield for element i, and Si= relative sensitivity factor for element i Elemental weight fractions for each element, Wi, are computed according to the relationship
Sy
Wi
ii F= (2)
After that, bulk density and neutron-density cross-plot porosity inputs are used to calculate the equivalent wet-rock elemental weight fractions. This data along with various types of log inputs, including: conventional density, neutron porosity, resistivity, natural and spectral gamma ray, is now used in fluids and minerals evaluation model that uses a probabilistic error minimization methodology to derive formation fluid and mineral volumes. In this case, the mineralogy model consists of kaolinite, chlorite, quartz, calcite, siderite, limonite and pyrite based upon local geology and core data. No dolomite of any significance occurs in any of the XRD mineralogy data; consequently, it is excluded from the log interpretation model. Fluids and Minerals Analysis (FAME) The FAME module is an advanced integrated answer product that uses a probabilistic error minimization methodology to derive formation fluid and mineral volumes from various types of log inputs, including: conventional density, neutron porosity, acoustic, resistivity, natural and spectral gamma ray, formation capture cross-section, and elemental geochemical. Performing the calculations in this technique requires theoretical log response equations for each sensor used. Response equations have been constructed in terms of formation mineral and fluid volumes and the response parameters for each constituent. Linear mixing laws were followed for most sensors but some, such as neutron, resistivity, acoustic, and dielectric involved more complicated non-linear functions. The idea is to solve the system of simultaneous theoretical tool response equations for the mineral and fluid volumes that gave the best match to the logs. Analyst

construct a log analysis model consisting of response equations, parameters and constraints. Analyst also control the weight of each tool in determining the solution and define appropriate linear inequality constraints to restrict the solution space for the selected formation volumes.
Figure 2: The FAME formation volume model. Central to the FAME model is a volumetric representation of the reservoir constituents as illustrated in Figure 2. The model supports independent volumes of free (non-clay-bound) water, gas, and oil in the invaded and undisturbed zones, a total volume of clay-bound water, and mineral volumes. Mineral volumes in this context refer to individual dry mineral volumes for clay minerals less their respective clay-bound water volumes, which are included in the total clay-bound water volume. Thus mineral volumes (VMIN) represent generic solid material; clay minerals and other sheet-silicate minerals are designated by a non-zero wet clay porosity (WCLP) response parameter corresponding to the fractional volume of clay-bound water associated with the wet clay. Thus, the total clay-bound water volume (VCBW) among the modeled minerals is given by
∑=i
ii
i VMIN-WCLPWCLP
1 WaterBoundClay
and the total volume of wet clay is the sum of VCBW and the sum of mineral volumes whose WCLP response parameters are greater than zero. It follows then, VCBW is an implicit formation volume when minerals with non-zero WCLP response parameters are solved for. Effective porosity, Øe, is defined as the sum of free water, gas, and oil volumes. Total porosity, Øt, is the sum of Øe and VCBW. FIELD EXAMPLE Santhal Well – Figure 3 shows logs obtained in the brine-filled borehole with a clastic interval near the top of the Kalol Pay (KS-1). In addition to the caliper, Track I includes gamma-ray equivalent of the radioactivity from thorium and potassium. The resistivity log are shown in Tracks II. Formation density and neutron porosity logs are displayed in Tracks III. Dry rock elemental weight fractions are shown in Track IV, as described previously. The logged interval spans a sand-shale sequence that includes Upper Suraj pay and Kalol pay sands. Various elemental cross-plots (Figure 4 and 5) were made to infer the mineralogy results. Elemental results for this example exhibit anti-correlation of iron & silicon and iron and aluminum against limonite dominated formation overlying Kalol pays. The results shows layer KS-I as clean and KS-II as argillaceous, whereas, USP is clayey with minerals comprising quartz, siderite, and limonite. The main clay minerals in shale section are kaolinite and chlorite. The presence of pyrite and calcite is noticed in the formation overlying Kalol formation.

Figure 3. GEM elemental weight fractions (dry) from the well from Santhal field.
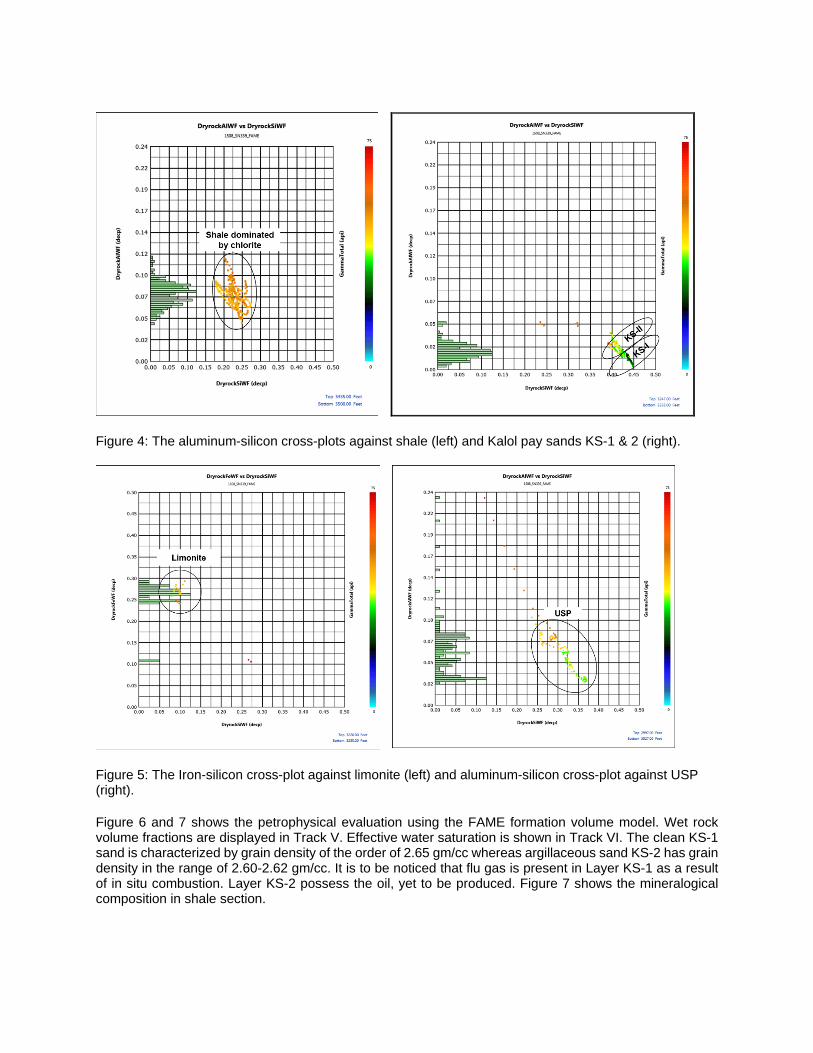
Figure 4: The aluminum-silicon cross-plots against shale (left) and Kalol pay sands KS-1 & 2 (right).
Figure 5: The Iron-silicon cross-plot against limonite (left) and aluminum-silicon cross-plot against USP (right). Figure 6 and 7 shows the petrophysical evaluation using the FAME formation volume model. Wet rock volume fractions are displayed in Track V. Effective water saturation is shown in Track VI. The clean KS-1 sand is characterized by grain density of the order of 2.65 gm/cc whereas argillaceous sand KS-2 has grain density in the range of 2.60-2.62 gm/cc. It is to be noticed that flu gas is present in Layer KS-1 as a result of in situ combustion. Layer KS-2 possess the oil, yet to be produced. Figure 7 shows the mineralogical composition in shale section.

Figure 6. Fluid and minerals analysis using GEM elemental weight fractions and conventional log data from the well from Santhal field. CONCLUSIONS The neutron induced gamma ray spectroscopy data has been demonstrated to be an effective means of establishing the mineral model for petrophysical evaluation. Encouraging results have been obtained from elemental cross-plots. Of particular interest are the results for high Fe/Al & Fe/Si ratio obtained in the limonite rich clastic. Also noteworthy are high Fe responses observed against the shale section. The mineralogical analysis suggests the composition of the shales, predominated by main clay minerals as kaolinite and chlorite in addition to variable ratio of montmorillonite, while the non- clay minerals include quartz, calcite and siderite. The presence of calcite and pyrite is seen in the formation overlying Kalol formation. Fe also occur in high concentration in USP and mineralogical evaluation suggests that this pay is clayey with minerals comprising quartz, siderite, and limonite. The concentration of iron and aluminum is relatively very low in Kalol pays. These sands are described as clean/argillaceous. The results in the studied well are found to be in agreement with core data of offset wells.

Figure 7. Fluid and minerals analysis using GEM elemental weight fractions and conventional log data from the well from Santhal field. ACKNOWLEDGEMENT The authors would like to thank ONGC Ltd. for the release of the geochemical log data, and core analyses data used in this study and for supporting the publication of this paper. In addition, the open discussions with ONGC Ltd. and their suggestions are deeply appreciated. We also thank management of HLS Asia for the facilities to undertake this work. REFERENCES 1.Galford J., Jerome Truax, Andy Hrametz, and Carlos Haramboure, Halliburton ”A New Neutron-Induced Gamma-Ray Spectroscopy Tool for Geochemical Logging” presented at SPWLA 50th Annual Logging Symposium, June 21-24, 2009.

2. Galford, J., Quirein, J., Shannon, S., Truax, J., and Witkowsky, J. “Field Test Results of a New Neutron-Induced Gamma-Ray Spectrometry Geochemical Logging Tool”. Paper SPE123992 presented at the Annual Technical Conference and Exhibition, SPE, New Orleans, Louisiana, USA, 4-7 October 2009. ABOUT THE AUTHORS Ajay Kumar
Ajay Kumar is a Petrophysicist with over 33 years of project and industry experience gained on oil & gas exploration and development. He has extensive exposure to clastic, carbonate and unconventional environments in Indian and Overseas sedimentary basins with the ability to integrate knowledge from different subsurface disciplines in formation evaluation for reservoir characterization. He has been responsible for technical evaluation and assurance of subsurface development projects, ensuring quality and functional excellence in technical studies. He has carried out several development projects including reservoir characterization work in Mumbai High, Heera, Panna, Mukta and Tapti fields that led infill drilling campaigns in these fields. He has performed due
diligence and evaluation of acreages/blocks for ONGC-OVL, BG, and Petrofac leading to successful acquisition/farm-in or collaborative work. He worked in several ONGC locations including ONGC Schlumberger Wireline Research Centre, New Delhi. He is currently AVP & Head (Formation Evaluation Center) at HLS Asia and holds M. Tech degree in Electronics & Communication Engineering from university of Roorkee (Now IIT, Roorkee). He is a member of the Society of professional Well Log Analysts and the Association of Petroleum Geologists, India and participated in several papers as author or coauthor. R N Chakravorty
R.N. Chakravorty is a Domain Consultant at HLS ASIA LTD. This gives him the opportunity to visit different E&P companies and meet professionals, understand field problems and provide solution. He played a long inning in ONGC and served in Eastern region, Western region, Mumbai offshore, KDMIPE in different capacities, and headed the team of multidisciplinary specialists at ONGC Schlumberger Joint Research Centre New Delhi till its end. He eventually retired as GGM and H GGM and Head Alliance. At Joint Research Centre, he undertook many Reservoir Characterization projects through integrated studies and provided solution to production and recovery enhancement and field rehabilitation projects. As head
alliance, he interacted with multinational companies for strategic alliance in E & P sector and led a delegation to STATOIL Norway to initiate deep water drilling. His attitude to assimilate things, and look for new possibilities has made him a trainer at young age and he continues to play that role even now. He trained many executives in India and stretched his experience to foreign executives as well— from Malaysia, Vietnam, Srilanka and Bangladesh. He also trained students from Germany under the exchange program of Delhi University. He had been an Adjunct Professor to the department of Petroleum Engineering Indian School of Mines Dhanbad. Ravinder Kumar
Ravinder Kumar is working in formation evaluation center of HLS Asia Ltd. as Senior Petrophysicist. He obtained M. Tech degree in applied Geophysics in 2002. Prior to joining in HLS Asia, he worked in DGH from 2003 to 2006 as geoscientist.