Embed Size (px)
Citation preview

Evaluation of Joint and Crack Load Transfer Final Report October 2003 FHWA-RD-02-088
Research and Development Turner-Fairbank Highway Research Center U.S. Department of Transportation 6300 Georgetown Pike Federal Highway Administration McLean, Virginia 22101-2296

FOREWORD This report documents a study conducted to evaluate load transfer efficiency of cracks and joints for rigid pavements included in the Long-Term Pavement Performance (LTPP) program. Using deflection testing data, load transfer efficiency parameters were determined and joint stiffnesses were backcalculated. Trend analysis was performed to evaluate the effect of design features and side conditions on load transfer efficiency. The analysis was conducted for all General Pavement Studies (GPS), Special Pavement Studies (SPS), and Seasonal Monitoring Program (SMP) test sections. This report will be of interest to highway agency engineers involved in the deflection data collection, processing, and analysis of data collected to improve on the design procedures, as well as future researchers who will improve structural models of rigid pavements. T. Paul Teng, P.E. Director, Office of Infrastructure Research and Development
NOTICE This document is disseminated under the sponsorship of the U.S. Department of Transportation in the interest of information exchange. The U.S. Government assumes no liability for its contents or use thereof. This report does not constitute a standard, specification, or regulation. The U.S. Government does not endorse products or manufacturers. Trade or manufacturers’ names appear herein only because they are considered essential to the objective of this document.

Technical Report Documentation Page 1. Report No. FHWA-RD-02-088
2. Government Accession No.
3. Recipient's Catalog No.
5. Report Date October 2003
4. Title and Subtitle EVALUATION OF JOINT AND CRACK LOAD TRANSFER FINAL REPORT 6. Performing Organization Code
7. Author(s) Lev Khazanovich and Alex Gotlif
8. Performing Organization Report No.
10. Work Unit No. (TRAIS) C6B
9. Performing Organization Name and Address ERES Consultants A Division of Applied Research Associates, Inc. 505 W. University Avenue Champaign, IL 61820
11. Contract or Grant No. DTFH61-96-C-00003
13. Type of Report and Period Covered Final Report March 2001 to January 2002
12. Sponsoring Agency Name and Address Office of Infrastructure R&D Federal Highway Administration 6300 Georgetown Pike McLean, VA 22101-2296
14. Sponsoring Agency Code
15. Supplementary Notes Work was conducted as part of the LTPP Data Analysis Technical Support Contract. Contracting Officer’s Technical Representative (COTR): Cheryl Allen Richter, HRDI-13 16. Abstract This report documents an evaluation of load transfer efficiency (LTE) of cracks and joints for rigid pavements included in the Long-Term Pavement Performance (LTPP) program. LTE is an important parameter affecting pavement performance. This study presents the first systematic analysis of the deflection data collected under the LTPP program related to LTE. Representative LTE indexes and joint stiffnesses were calculated for all General Pavement Studies (GPS), Special Pavement Studies (SPS), and Seasonal Monitoring Program (SMP) rigid test sections. Data tables that include computed parameters were developed for inclusion in the LTPP Information Management System (IMS). Trend analysis was performed to evaluate the effect of design features and site conditions on LTE. Key findings from this study: 1. Large amounts of high quality LTE data have been collected under the LTPP program. This data will be a valuable resource in
improving understanding of load transfer effect and improving pavement design and rehabilitation procedures. 2. LTE is a complex parameter, which depends on many factors, including falling weight deflectometer (FWD) load plate position,
testing time (FWD LTE testing must be conducted in the early morning in cool weather to provide realistic estimation of LTE), season.
3. LTE of CRCP cracks was found to be higher than LTE of joint in JCP pavements. 4. LTE of doweled joints was found to be higher than LTE of nondoweled joints. 5. Nondoweled sections with a high level of LTE are less likely to develop significant faulting than sections with low LTE. 6. LTE from leave and approach side deflection testing data was found to be statistically different for a large number of JCP
sections. 17. Key Words Load transfer efficiency, joints, cracks, PCC, rigid pavements, joint opening
18. Distribution Statement No restrictions. This document is available to the public through the National Technical Information Service, Springfield, VA 22161.
19. Security Classification (of this report) Unclassified
20. Security Classification (of this page) Unclassified
21. No. of Pages 118
22. Price
Form DOT F1700.7 (8-72) Reproduction of completed page authorized
ii
SI* (MODERN METRIC) CONVERSION FACTORS APPROXIMATE CONVERSIONS TO SI UNITS APPROXIMATE CONVERSIONS FROM SI UNITS
Symbol When You Know Multiply By To Find Symbol Symbol When You Know Multiply By To Find Symbol LENGTH LENGTHin inches 25.4 millimeters mm mm millimeters 0.039 inches inft feet 0.305 meters m m meters 3.28 feet ftyd yards 0.914 meters m m meters 1.09 yards ydmi miles 1.61 kilometers km km kilometers 0.621 miles mi AREA AREA
in2 square inches 645.2 square millimeters mm2 mm2 square millimeters 0.0016 square inches in2
ft2 square feet 0.093 square meters m2 m2 square meters 10.764 square feet ft2yd2 square yard 0.836 square meters m2 m2 square meters 1.195 square yards yd2
ac acres 0.405 hectares ha ha hectares 2.47 acres acmi2 square miles 2.59 square kilometers km2 km2 square kilometers 0.386 square miles mi2 VOLUME VOLUME fl oz fluid ounces 29.57 milliliters mL mL milliliters 0.034 fluid ounces fl oz gal gallons 3.785 liters L L liters 0.264 gallons galft3 cubic feet 0.028 cubic meters m3 m3 cubic meters 35.71 cubic feet ft3yd3 cubic yards 0.765 cubic meters m3 m3 cubic meters 1.307 cubic yards yd3
NOTE: volumes greater than 1000 shall be shown in m3 MASS MASSoz ounces 28.35 grams g g grams 0.035 ounces ozlb pounds 0.454 kilograms kg kg kilograms 2.202 pounds lbT short tons
(2000 lb) 0.907 megagrams
(or metric ton) Mg (or t)
Mg (or t)
megagrams (or metric ton)
1.103 short tons(2000 lb)
T
TEMPERATURE (exact degrees) TEMPERATURE (exact degrees) oF Fahrenheit 5 (F-32)/9 Celsius oC oC Celsius 1.8C+32 Fahrenheit oF or (F-32)/1.8 ILLUMINATION ILLUMINATION fc foot-candles 10.76 lux lx lx lux 0.0929 foot-candles fc fl foot-Lamberts 3.426 candela/m2 cd/m2 cd/m2 candela/m2 0.2919 foot-Lamberts fl FORCE and PRESSURE or STRESS FORCE and PRESSURE or STRESS lbf poundforce 4.45 newtons N N newtons 0.225 poundforce lbflbf/in2 poundforce per
square inch 6.89 kilopascals kPa kPa kilopascals 0.145 poundforce per
square inch lbf/in2
*SI is the symbol for the International System of Units. Appropriate rounding should be made to comply with Section 4 of ASTM E380. (Revised September 1993)

iii
TABLE OF CONTENTS
Section Page 1. INTRODUCTION .................................................................................................................... 1 Research Objectives............................................................................................................. 1 Scope of Work..................................................................................................................... 2 Report Organization............................................................................................................. 2 2. SELECTION OF METHODOLOGY FOR PCC JOINT/CRACK LTE AND STIFFNESS
EVALUATION......................................................................................................................... 3 Load Transfer Efficiency .................................................................................................... 3 Mechanistic Modeling of LTE............................................................................................ 4 Joint Stiffness Backcalculation ........................................................................................... 6 “True” versus “Measured” LTE.......................................................................................... 9 3. FWD DEFLECTION DATA ASSESSMENT AND LTE CALCULATION
METHODOLOGY ................................................................................................................. 15 Deflection Testing Details ................................................................................................ 15 Deflection Data Assessment ............................................................................................. 16 Load Transfer Index Calculation Procedures ................................................................... 17 Results of LTE Analysis ................................................................................................... 20 4. LTE TREND ANALYSIS ...................................................................................................... 21 LTE Data Assessment....................................................................................................... 21 Effect of FWD Load Position ........................................................................................... 23 Variability in Measured LTEs for Individual Cracks/Joints............................................. 27 Load Level Dependency ................................................................................................... 29 Effects of Design Features and Site Conditions on LTE .................................................. 35 Effects of LTE on Pavement Performance ....................................................................... 57 5. LTE ANALYSIS FOR SMP SECTIONS .............................................................................. 61 Effects of Time of Testing on Joint LTE.......................................................................... 61 Effects of Season of Testing on Joint LTE ....................................................................... 66 6. JOINT STIFFNESS BACKCALCULATION AND ANALYSIS ....................................... 73 Joint Stiffness Backcalculation Procedure........................................................................ 73 Joint Stiffness Data Assessment ....................................................................................... 75 Recommendation for Joint Stiffness Selection ................................................................. 75 7. JOINT MOVEMENTS: CALCULATION METHODOLOGY, DATA ASSESSMENT,
AND TREND ANALYSIS..................................................................................................... 79 Joint Movement Measurements ........................................................................................ 79 Assessment of Gage Measurement Data........................................................................... 79 Joint Movement Calculation Procedures .......................................................................... 80 Daily Variation in Joint Opening...................................................................................... 82 Seasonal Variation in Joint Opening................................................................................. 85 Effects of Joint Opening on LTE...................................................................................... 94

iv
8. SUMMARY AND RECOMMENDATIONS FOR CONTINUED RESEARCH................ 105 REFERENCES ........................................................................................................................... 109
v
LIST OF FIGURES
Figure Page 1. LTE versus nondimensional joint stiffness............................................................................... 5 2. Finite element model for FWD loading simulation .................................................................. 8 3. Comparison of LTE calculated from ISLAB2000 results with predictions using Crovetti’s and Zollinger’s models ....................................................................................................... 8 4. Comparison of true and measured LTEs .................................................................................. 9 5. Distribution of bending correction factors for approach slab testing based on O5 sensor configuration ..................................................................................................................... 12 6. Distribution of bending correction factors for leave slab testing based on C6 sensor configuration ..................................................................................................................... 13 7. Comparison of LTEs predicted using ISLAB2000 for the approach slab test (LTE1) and the leave slab test (LTE2) for pavements with voids.................................................. 13 8. Distribution of crack LTE mean values, CRCP sections........................................................ 23 9. Distribution of joint LTE mean values, JCP sections ............................................................. 24 10. Effect of FWD load position on mean section crack LTE for CRCP..................................... 26 11. Effect of FWD load position on mean section LTE for JCP .................................................. 26 12. Frequency distributions of standard deviations of LTEs for individual cracks/joints from different test types .................................................................................................... 27 13. Frequency distributions of standard deviations of LTEs for nondoweled and doweled joints, approach test .......................................................................................................... 28 14. Frequency distributions of standard deviations of LTEs for nondoweled and doweled joints, leave test ................................................................................................................ 28 15. LTE for section 370201 on November 27, 1995, approach (J4) test ...................................... 31 16. LTE for section 370201 on November 27, 1995, leave (J5) test ............................................ 32 17. Coefficient of variation of LTE within a section .................................................................... 33 18. Coefficient of variation versus mean LTE for approach tests ............................................... 34 19. Comparison of standard deviations of section LTE for doweled and nondoweled JCP sections (approach tests)............................................................................................ 34 20. Comparison of standard deviations of section LTE for doweled and nondoweled JCP sections (leave tests). ................................................................................................. 35 21. Distribution of section LTE mean value, nondoweled versus doweled, approach test (J4) ... 36 22. Distribution of section LTE mean value, nondoweled versus doweled, leave test (J5) ......... 37 23. Distribution of joint LTE mean value, nondoweled versus doweled, approach test (J4) ....... 37 24. Distribution of joint LTE mean value for different dowel diameters, approach test (J4)....... 38 25. Distribution of joint LTE mean value, nondoweled versus doweled, leave test (J5) ............. 38 26. Distribution of joint LTE mean value for different dowel diameter, leave test (J5) .............. 39 27. Distribution of joint LTE mean values for different base types, doweled joints, approach test (J4) .............................................................................................................. 40 28. Distribution of joint LTE mean values for different base types, doweled joints, leave test (J5) .................................................................................................................... 41 29. Distribution of joint LTE mean values for different base types, nondoweled joints, approach test (J4) .............................................................................................................. 41 30. Distribution of joint LTE mean values for different base types, nondoweled joints, leave test (J5). ................................................................................................................... 42

vi
31. Distribution of joint LTE mean values for different subgrade types, doweled joints, approach test (J4). ............................................................................................................. 44 32. Distribution of joint LTE mean values for different subgrade types, doweled joints, leave test (J5) .................................................................................................................... 44 33. Distribution of joint LTE mean values for different subgrade types, nondoweled joints, approach test (J4). ............................................................................................................. 45 34. Distribution of joint LTE mean values for different subgrade types, nondoweled joints, leave test (J5) .................................................................................................................... 45 35. PCC thickness versus LTE in CRCP sections ........................................................................ 46 36. PCC thickness versus LTE in JCP doweled sections.............................................................. 47 37. PCC thickness versus LTE in JCP nondoweled sections........................................................ 47 38. PCC compressive strength versus LTE in CRCP sections ..................................................... 48 39. PCC compressive strength versus LTE in JCP doweled sections........................................... 49 40. PCC compressive strength versus LTE in nondoweled sections ............................................ 49 41. Steel content versus LTE in CRCP sections ........................................................................... 50 42. Mean joint spacing versus LTE in nondoweled JCP sections ................................................ 51 43. Mean crack spacing versus LTE in CRCP sections................................................................ 51 44. Joint skewness versus JCP LTE.............................................................................................. 52 45. Annual precipitation versus LTE of doweled JCP.................................................................. 53 46. Freezing index versus LTE of doweled JCP........................................................................... 53 47. Annual number of freeze-thaw cycles versus LTE of nondoweled JCP ................................ 55 48. Mean annual temperature versus LTE of CRCP..................................................................... 54 49. Age versus LTE of nondoweled sections, approach test (J4) ................................................. 55 50. Age versus LTE of doweled sections, approach test (J4) ....................................................... 56 51. Age versus LTE of CRCP sections, approach test (C4) ......................................................... 56 52. Faulting versus LTE of doweled JCP ..................................................................................... 57 53. Faulting versus LTE of nondoweled JCP ............................................................................... 58 54. Effect of LTE on faulting of nondoweled pavements............................................................. 58 55. Number of punchouts (all severity levels) versus LTE .......................................................... 59 56. Daily variation in calculated approach LTE, section 163023 (September 1992) ................... 62 57. Daily variation in calculated leave LTE, section 163023 (October 1992) ............................. 62 58. Daily variation in calculated approach LTE, section 4_0215 (March 1996).......................... 63 59. Daily variation in calculated leave LTE, section 4_0215 (March 1996)................................ 63 60. Comparison of mean LTEs for doweled SMP sections from different FWD passes on the same day of testing................................................................................................. 64 61. Comparison of mean LTEs for nondoweled SMP sections from different FWD passes on the same day of testing................................................................................................. 64 62. Seasonal variation in LTE and PCC surface temperature, section 63042 .............................. 68 63. Seasonal variation in LTE and PCC surface temperature, section 163023 ............................ 69 64. Seasonal variation in LTE and PCC surface temperature, section 204054 ............................ 69 65. Seasonal variation in LTE and PCC surface temperature, section 313018 ............................ 70 66. Seasonal variation in LTE and PCC surface temperature, section 493011 ............................ 70 67. Seasonal variation in LTE and PCC surface temperature, section 533813 ............................ 71 68. Seasonal variation in LTE and PCC surface temperature, section 833802 ............................ 71 69. Predicted versus actual ISLAB2000 nondimensional joint stiffness...................................... 74 70. Frequency distribution of representative CRCP crack stiffnesses.......................................... 76 71. Frequency distributions of representative joint stiffnesses for joints of doweled and nondoweled JCP................................................................................................................ 76

vii
72. Comparison of backcalculated joint stiffnesses from two FWD passes on the same day of testing..................................................................................................................... 77 73. Flowchart of the overall process for joint movement calculation........................................... 80 74. Relative changes in joint opening for section 274040 on May 6, 1997, compared to joint opening in October 1993 .......................................................................................... 83 75. Changes in joint opening from different measurement passes on the same day of measurements.................................................................................................................... 85 76. Change in joint opening versus change in PCC temperature, section 040215 ....................... 86 77. Change in joint opening versus change in PCC temperature, section 063042 ....................... 86 78. Change in joint opening versus change in PCC temperature, section 133019 ....................... 87 79. Change in joint opening versus change in PCC temperature, section 204054 ....................... 87 80. Change in joint opening versus change in PCC temperature, section 274040 ....................... 88 81. Change in joint opening versus change in PCC temperature, section 313018. ...................... 88 82. Change in joint opening versus change in PCC temperature, section 364018 ....................... 89 83. Change in joint opening versus change in PCC temperature, section 370201 ....................... 89 84. Change in joint opening versus change in PCC temperature, section 390204 ....................... 90 85. Change in joint opening versus change in PCC temperature, section 421606 ....................... 90 86. Change in joint opening versus change in PCC temperature, section 484142 ....................... 91 87. Change in joint opening versus change in PCC temperature, section 484143 ....................... 91 88. Change in joint opening versus change in PCC temperature, section 493011 ....................... 92 89. Change in joint opening versus change in PCC temperature, section 833802 ....................... 92 90. Change in joint opening versus change in PCC temperature, section 893015 ....................... 93 91. Approach LTE versus joint opening, section 484142............................................................. 95 92. Leave LTE versus joint opening, section 484142................................................................... 95 93. Approach LTE versus joint opening, section 484143............................................................. 96 94. Leave LTE versus joint opening, section 484143................................................................... 96 95. Approach LTE versus joint opening, section 133019............................................................. 97 96. Leave LTE versus joint opening, section 133019................................................................... 97 97. Approach LTE versus joint opening, section 493011............................................................. 98 98. Leave LTE versus joint opening, section 493011................................................................... 98 99. Approach LTE versus joint opening, section 274040............................................................. 99 100. Leave LTE versus joint opening, section 274040 ................................................................ 99 101. Approach LTE versus joint opening, section 364018 ........................................................ 100 102. Leave LTE versus joint opening, section 364018 .............................................................. 100 103. Approach LTE versus joint opening, section 370201 ........................................................ 101 104. Leave LTE versus joint opening, section 370201 .............................................................. 101 105. Approach LTE versus joint opening, section 390204 ........................................................ 102 106. Leave LTE versus joint opening, section 390204 .............................................................. 102 107. Approach LTE versus joint opening, section 893015 ........................................................ 103 108. Leave LTE versus joint opening, section 893015.............................................................. 103

viii
LIST OF TABLES
Table Page 1. Regression coefficients for bending correction factors .......................................................... 11 2. Number of basins rejected because of high variability........................................................... 17 3. Availability of deflection data ................................................................................................ 17 4. Deflections from ISLAB2000 near joints ............................................................................... 22 5. Comparison of statistical significance of LTEs from approach and leave deflection
tests ................................................................................................................................... 25 6. Comparison of practical difference between LTEs from approach and leave deflection tests ................................................................................................................................... 25 7. Joint LTE load level dependence............................................................................................ 29 8. FWD pass LTE load level dependence................................................................................... 30 9. Repeatability ratios for different LTE levels .......................................................................... 31 10. Results of t-test for the effects of LCB on mean section LTE................................................ 42 11. Results of t-test for the effects of subgrade type on mean section LTE ................................. 46 12. Coefficients of variation of the section mean LTEs from the same day of testing................. 65 13. Seasonal variation of approach LTE (test J4) for doweled SMP sections.............................. 66 14. Seasonal variation of leave LTE (test J5) for doweled SMP sections .................................... 67 15. Seasonal variation of approach LTE (test J4) for nondoweled SMP sections........................ 67 16. Seasonal variation of leave LTE (test J5) for nondoweled SMP sections .............................. 67 17. Recommended joint/crack stiffnesses for different types of pavements ................................ 75 18. Changes in joint opening from different measurement passes on the same day of measurements.................................................................................................................... 84 19. PCC/Base friction factors for SMP LTPP sections................................................................. 94

CHAPTER 1. INTRODUCTION The load transfer efficiency (LTE) of cracks and joints profoundly affects the performance of concrete pavements. Poor LTE may lead to longitudinal cracking and excessive faulting of jointed concrete pavements (JCP) and could accelerate punchout development in continuously reinforced concrete pavements (CRCP). These distresses could lead to roughness and poor ride quality. Conversely, joints and tightly closed transverse cracks with high LTE do not typically cause any pavement serviceability problems. As part of the ongoing Long-Term Pavement Performance (LTPP) program, deflection measurements are being taken with the falling weight deflectometer (FWD) on all general pavement studies (GPS) and specific pavement studies (SPS) test sections. This deflection testing program is being conducted periodically to obtain the load-response characteristics of the pavement structures at critical points in time, depending on the experiment. These data are intended to provide pavement structural characteristic data that are needed to achieve the goals of LTPP program. Many State highway agencies also are collecting deflection data on their pavement systems for management, project rehabilitation, and forensic studies, and they consider deflection data to be as important as pavement condition and distress data. Deflections, temperature, and joint opening size are all measured at joints/cracks. The data collected include the following:
• FWD deflection measurements in the outer wheel path at a joint/crack approach slab (tests J4 and C4 for JCP and CRCP, respectively).
• FWD deflection measurements in the outer wheel path at a joint/crack leave slab (tests J5 and C5 for JCP and CRCP, respectively).
• Width of opening through the pavement at the joints across which load transfer deflection tests were performed.
• Subsurface portland cement concrete (PCC) temperature at different depths. Research Objectives The primary objectives of this study are to compute:
• LTE for joints and cracks from deflection measurements over time and traffic. • Joint/crack stiffness characteristics over time and traffic. • Change in joint opening for the LTPP sections over time and traffic.
The computed parameters will then become a part of the LTPP database for use in future studies. Secondary objectives of this proposed study are as follows:
• Evaluate available procedures for calculating the LTE and suggest modifications or alternatives if necessary.
• Evaluate available procedures for backcalculation of the joint stiffness.
1

• Develop guidelines for calculating the LTE using LTPP data. • Assess variability in measured LTEs within each LTPP section. • Using LTPP Seasonal Monitoring Program (SMP) data, evaluate daily and seasonal
variability in measured joint opening and LTE. • Evaluate the effect of different factors (presence of dowels, joint opening, base type,
subgrade stiffness, PCC thickness) on LTE. • Evaluate the relationship between the LTE level and amount of faulting and other
distresses observed. Scope of Work The scope of this LTE analysis study for LTPP rigid pavement sections includes the following:
• Selecting a procedure to compute joint/crack LTE, joint stiffness, and change in joint opening.
• Developing representative indices and statistics for joint/crack LTE, joint stiffness, and joint opening parameters.
• Performing LTE and joint stiffness analysis for GPS, SPS, and SMP sections. • Performing joint opening analysis for SMP test sections. • Developing drafts of data tables for possible upload of analysis results to the LTPP database. • Performing trend analysis for joint/crack opening, joint/crack LTE, and joint stiffness
parameters and conducting any other analyses of interest. Report Organization This report documents the research effort and findings of the LTPP rigid pavement joint parameters such as LTE, stiffness, and variation in opening. This chapter presents background information. Chapter 2 provides details on the selection of the methodology for calculation of LTE and stiffness of joints and cracks. Chapter 3 presents the results of the assessment of FWD deflection data used in joint LTE calculation and describes the procedure used to determine representative LTE parameters. Chapter 4 presents results of the analysis for GPS and SPS test sections. Chapter 5 presents results of the LTE analysis for SMP test sections. Chapter 6 presents the methodology and results of the analysis of joint stiffnesses. Chapter 7 presents the methodology and results of the analysis of changes in joint opening. A summary and list of recommendations are presented in chapter 8.
2

CHAPTER 2. SELECTION OF METHODOLOGY FOR PCC JOINT/CRACK LTE AND STIFFNESS EVALUATION
Load Transfer Efficiency When a traffic load is applied near a joint in a PCC pavement, both loaded and unloaded slabs deflect because a portion of the load applied to the loaded slab is transferred to the unloaded slab. As a result, deflections and stresses in the loaded slab may be significantly less than if, instead of a joint with another slab, there was a free edge. The magnitude of reduction in stresses and deflections by a joint compared to a free edge depends on the joint’s LTE. Traditionally, LTE at the joint is determined based on the ratio of the maximum deflection at the joint of the loaded slab and the deflection of the unloaded slab measured right across the joint from the maximum deflection. Two equations for the deflection LTE are used most often:
%100*l
u
ddLTE = (1)
and
%100*2*
ul
u
dddLTE+
= (2)
where:
- dl = the maximum deflection at the joint of the loaded slab. - du = the corresponding deflection at the joint of the unloaded slab. - LTE and LTE* = load transfer efficiency indexes.
If a joint exhibits a poor ability to transfer load, then the deflection of the unloaded slab is much less than the deflection at the joint of the loaded slab and both LTE indexes have values close to 0. If joint’s load transfer ability is very good, then the deflections at the both sides of the joint are equal and both indexes have values close to 100 percent. Moreover, these two indices are related by the following equation:
%100*
1001
11*2*
⎟⎟⎟⎟
⎠
⎞
⎜⎜⎜⎜
⎝
⎛
+−= LTELTE (3)
Therefore, these indexes are equivalent, and if one of them is known, the other can be determined. In this study, we will define the deflection LTE using the index from equation 1 because it is much more widely used.
3

The definitions of the LTE described above are based on deflections. A joint LTE based on stress can be defined as follows:
%100*l
uLTEσσ
σ = (4)
where:
- lσ = the maximum stress at the joint of the loaded slab. - uσ = the corresponding stress at the joint of the unloaded slab. - LTEσ = load transfer efficiency in stress.
The stress-based LTE indicates the degree of stress reduction at the joint of the loaded slab caused by the presence of the unloaded slab. Studies have indicated that there is no one-to-one relationship between stress-based and deflection-based LTE indexes. Because it is difficult to measure stresses in a concrete slab and stress-based LTE is much more affected by geometry of the applied load than deflection LTE, the deflection-based LTE is commonly used to measure load transfer in concrete pavements. If deflection LTE is known, stress reduction due to load transfer for any given load configuration may be calculated using a finite element model. Joint LTE depends on many factors, including the following:
• Joint load transfer mechanism and stiffness. • Base/subgrade support. • Temperature.
Load transfer between the slabs occurs through aggregate particles of the fractured surface below the saw cut at a joint, through steel dowels (if they exist), and through the base and subgrade. LTE may vary throughout the day and year because of variation in PCC temperature. When temperature decreases, a joint opens wider, which decreases contact between two slabs and also may decrease LTE, especially if no dowels exist. Also, PCC slab curling may change the contact between the slab and the underlying layer and affect measured load-induced deflections. Mechanistic Modeling of LTE Mechanistic modeling of the load transfer mechanism is a complex problem. Frieberg (1940) was one of the first researchers who attempted to tackle this problem. The introduction of a finite element method for analysis of JCP (Tabatabie and Barenberg [1980]) gave a significant boost to understanding load transfer mechanisms. However, although many comprehensive finite element models have been developed (Scarpas et al. [1994], Guo et al. [1995], Parson et al. [1997], Shoukry and William [1998], Davids et al. [1998], Khazanovich et al. [2001]), work on the development of a comprehensive, practical, and reliable model for joints of rigid pavements is far from complete. Ioannides and Korovesis (1990, 1992) made an important step forward in PCC joint analysis. They identified the following nondimensional parameters governing joint behavior:
4
Nondoweled pavements:
lk
AGGAGG =* (5)
Doweled pavements:
lks
DD =* (6)
where:
- AGG* and D* are nondimensional stiffnesses of nondoweled and doweled joints. - AGG = a shear stiffness of a unit length of an aggregate interlock. - D = a shear stiffness of a single dowel (including dowel-PCC interaction). - = a PCC slab radius of relative stiffness. l- k = subgrade k-value. - s = dowel spacing.
Using the finite element program ILLI-SLAB, Ioannides and Korovesis also identified a unique relationship between these parameters and LTE (see figure 1).
0
10
20
30
40
50
60
70
80
90
100
0.01 0.1 1 10 100 1000
Nondimensional joint stiffness (AGG*)
LT
E (%
)
Figure 1. LTE versus nondimensional joint stiffness.
5

The following assumptions were made in derivation of these relationships:
• Prior to loading, PCC slabs are flat and in full contact with the foundation. • A PCC joint propagates through the base layer (if present). No load transfer occurs
through the base layer. • The subgrade is modeled as a Winkler foundation, which assumes no load transfer
through the subgrade. • The PCC joint has uniform LTE across its width. The entire load transfer in nondoweled
joints occurs through aggregate interlock, whereas the entire load transfer in doweled joints occurs through dowels (no aggregate interlock).
The relationships developed by Ioannides and Korovesis form a basis for backcalculation of joint aggregate interlock stiffness of nondoweled joints or dowel shear stiffness of doweled joints if their LTEs are known. In both cases, however, the backcalculated stiffness overestimates real aggregate interlock stiffness or dowel stiffness because the entire joint stiffness is attributed to a single (although perhaps prevailing) component. The cause of this limitation is the inability of the ILLI-SLAB model to distinguish between load transfer mechanisms. This limitation does not cause a significant problem because the backcalculated joint stiffness provides sufficient information for accurate joint modeling in the forward analysis. Moreover, if the addition information is available, individual components can be determined more accurately. For example, if AGGtot is the backcalculated stiffness of a doweled joint and D is the known dowel stiffness, then the “true” aggregate interlock factor, AGG0, for this joint can be determined from the following relationship: sDAGGAGG TOT *0 −= (7) where:
- s = dowel spacing. In this study, Ioannides and Korovesis’s relationship was further investigated and an efficient backcalculation procedure for joint stiffness determination was developed. Joint Stiffness Backcalculation The relationship identified by Ioannides and Korovesis was further elaborated by Crovetti (1994), Zollinger et al. (1999), and Ioannides et al. (1996). Crovetti and Zollinger developed regression models for that relationship, whereas Ioannides and Hammons developed a neural network prediction model. Crovetti proposed the following relationship between nondimensional joint stiffness and LTE:
849.0
*2.11
%100−
⎟⎟⎠
⎞⎜⎜⎝
⎛+
=
lkAGG
LTEtot
(8)
6

where: - AGGtot = the total stiffness. - = the PCC slab radius of relative stiffness. l- k = a coefficient of subgrade reaction (k-value).
Zollinger’s model for this relationship has the following form:
⎥⎥⎥⎥
⎦
⎤
⎢⎢⎢⎢
⎣
⎡−−
+
=
18.1
)log(183.0214.0101
%100
ll kAGGa tot
LTE (9)
where
- AGGtot = the total joint stiffness. - = the PCC slab radius of relative stiffness. l- k = the subgrade k-value. - a = the equivalent radius of the applied load.
The neural network model developed by Ioannides and Hammons cannot be expressed as a simple equation, but rather takes the form of a computer program that relates LTE and joint stiffness, radius of relative stiffness, subgrade k-value, and load geometry. Although this model is more accurate than the regression models, it is not publicly available and was not evaluated in this study. To evaluate the Crovetti and Zollinger models, a factorial of 375 runs was performed to simulate FWD testing at the PCC joint. ISLAB2000 (Khazanovich et al. [2000]) is a completely rewritten version of ILLI-SLAB that retains all the positive features of ILLI-SLAB but is more convenient to use and is free from many unnecessary limitations (including limitation on the number of nodes in a finite element model). A finite element model developed in this study has four slabs in the longitudinal direction and three slabs in the transverse direction. The system was assumed to be symmetrical with respect to the longitudinal axis, so only half of the system was modeled. Because the focus of this analysis was on the deflections near the loaded joint along the centerline, a much finer finite element mesh was used along the centerline and loaded joint, as shown in figure 2. The LTE of longitudinal joints was selected to be equal to 70 percent. Also, due to symmetry, only half of an FWD load was applied. The slab radius of relative stiffness was varied from 508 to 2,032 mm (80 inches), and the nondimensional transverse joint stiffness was varied from 0.1 to 278, which resulted in LTE from 8 to 99 percent.
7
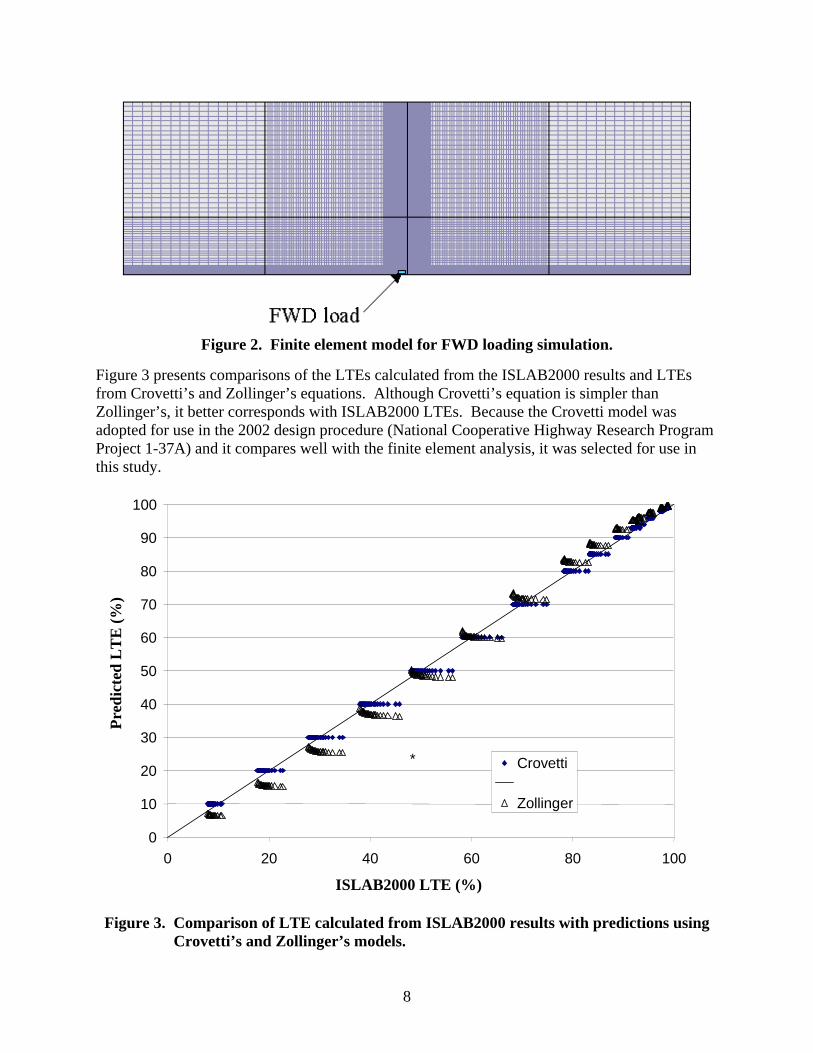
Figure 2. Finite element model for FWD loading simulation.
Figure 3 presents comparisons of the LTEs calculated from the ISLAB2000 results and LTEs from Crovetti’s and Zollinger’s equations. Although Crovetti’s equation is simpler than Zollinger’s, it better corresponds with ISLAB2000 LTEs. Because the Crovetti model was adopted for use in the 2002 design procedure (National Cooperative Highway Research Program Project 1-37A) and it compares well with the finite element analysis, it was selected for use in this study.
0
10
20
30
40
50
60
70
80
90
100
0 20 40 60 80 100
ISLAB2000 LTE (%)
Pred
icte
d L
TE
(%)
Crovetti
Zollinger
*
Figure 3. Comparison of LTE calculated from ISLAB2000 results with predictions using
Crovetti’s and Zollinger’s models.
8

“True” versus “Measured” LTE As stated above, the joint LTE is a ratio of the maximum deflection at the joint of the unloaded slab to the deflection of the loaded slab measured directly across the joint from the maximum deflection. However, measurement of such deflections in the field may be quite cumbersome. In the LTPP program, joint deflection testing is conducted by placing the load plate tangential to the edge of the joint. The loaded slab joint deflections are measured under the center of the load plate (152 mm [6 inches] away from the joint). The deflection of the unloaded slab is also measured at some distance (152 mm [6 inches]) from the joints. This raises an issue about the possibility of error as a result of differences in deflections directly at the joint and measured deflections 152 mm (6 inches) away from the joint because of slab bending. Some experts advocate the need to use a correction (“bending”) factor to adjust the measured deflections. To investigate this problem, the results of the 375 ISLAB2000 runs were analyzed. The LTEs calculated from the deflections located exactly at the joints (“true” LTEs) were compared to the ratios of the deflections located 152 mm (6 inches) away from the joint (“measured” LTEs similar to the FWD procedure). Figure 4 presents comparisons of true and measured LTEs.
0
10
20
30
40
50
60
70
80
90
100
0 10 20 30 40 50 60 70 80 90 100
True LTE (%)
Mea
sure
d L
TE
(%)
Figure 4. Comparison of true and measured LTEs. In most cases, measured LTE is close to true LTE. The exceptions are the cases with very low PCC slab stiffness (radius of relative stiffness is less than 750 mm (30 inches). For those cases,
9

measured LTE overestimates true LTE. To address this discrepancy, the research team attempted to develop bending correction factors. PCC slab bending depends primarily on the radius of relative stiffness. Since stiffer slabs require less bending correction than slabs with low radii of relative stiffness, the following functional form was proposed for the correction factor:
221.1ll
aa
mes
true
LTELTEB ++== (10)
where:
- B = the bending correction factor. - LTEtrue = the true LTE. - LTEmes = the measured LTE. - = the radius of relative stiffness. l- a1 and a2 = model parameters.
A regression analysis was performed to determine coefficients a1 and a2 and the following expression for the bending factor was obtained:
2
36661285.61ll
+−=B (11)
R2 = 0.9998 SEE = 0.000495 where:
- = a radius of relative stiffness in mm. l Although the correction factor has excellent statistics, its practical applicability is quite limited because the radius of relative stiffness may be unknown. To avoid this limitation, a correction factor based on sensor deflections located on the leave slab was used to correct measured LTE. The AREA parameter was used for this purpose. This parameter combines the effect of several measured deflections in the basin and is defined as follows:
( )[ ]) - ( + ) - ( rrWrrW +r W W21 = AREA 1-nnni1+ii
1-n
1i=10
0∑ (12)
where:
- Wi = measured deflections (i = 0, n). - n = number of FWD sensors minus 1. - ri = distances between the center of the load plate and sensors in mm.
The AREA parameter has been used extensively to analyze concrete pavement deflection basins since 1980. Ioannides et al. (1989) identified the unique relationship between AREA and the radius of relative stiffness. The AREA parameter is not truly an area, but rather has dimensions
10
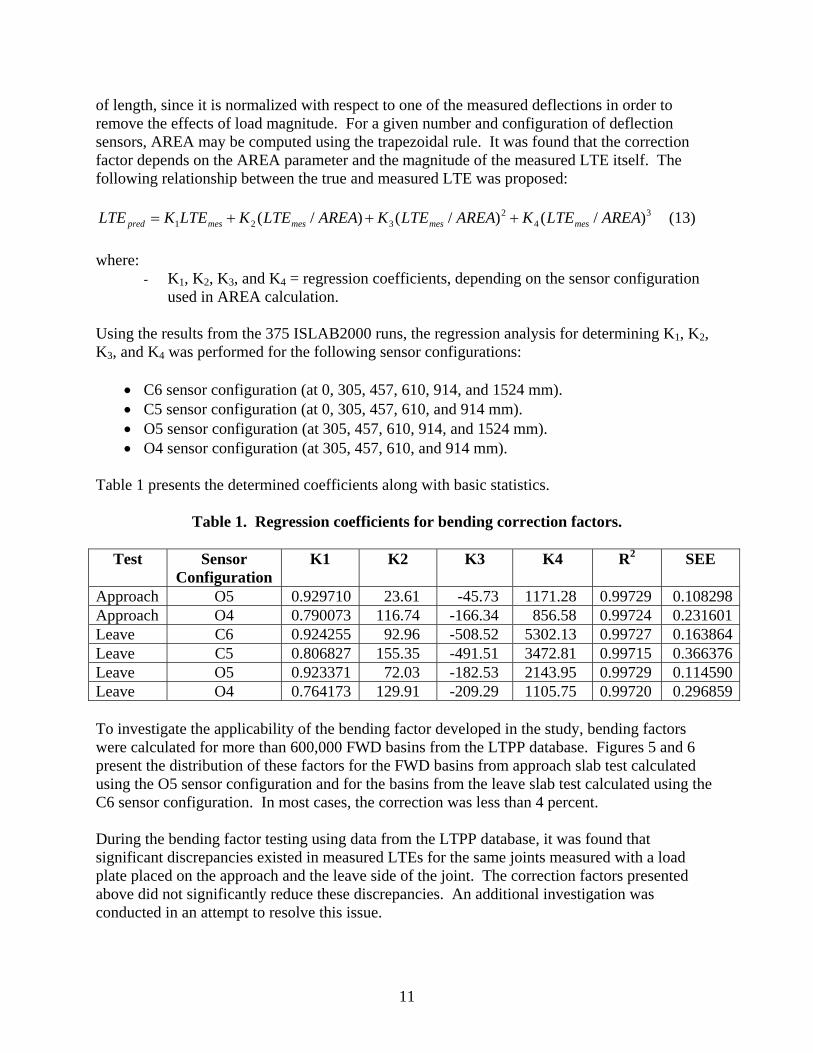
of length, since it is normalized with respect to one of the measured deflections in order to remove the effects of load magnitude. For a given number and configuration of deflection sensors, AREA may be computed using the trapezoidal rule. It was found that the correction factor depends on the AREA parameter and the magnitude of the measured LTE itself. The following relationship between the true and measured LTE was proposed:
34
2321 )/()/()/( AREALTEKAREALTEKAREALTEKLTEKLTE mesmesmesmespred +++= (13)
where:
- K1, K2, K3, and K4 = regression coefficients, depending on the sensor configuration used in AREA calculation.
Using the results from the 375 ISLAB2000 runs, the regression analysis for determining K1, K2, K3, and K4 was performed for the following sensor configurations:
• C6 sensor configuration (at 0, 305, 457, 610, 914, and 1524 mm). • C5 sensor configuration (at 0, 305, 457, 610, and 914 mm). • O5 sensor configuration (at 305, 457, 610, 914, and 1524 mm). • O4 sensor configuration (at 305, 457, 610, and 914 mm).
Table 1 presents the determined coefficients along with basic statistics.
Table 1. Regression coefficients for bending correction factors.
Test Sensor Configuration
K1 K2 K3 K4 R2 SEE
Approach O5 0.929710 23.61 -45.73 1171.28 0.99729 0.108298Approach O4 0.790073 116.74 -166.34 856.58 0.99724 0.231601Leave C6 0.924255 92.96 -508.52 5302.13 0.99727 0.163864Leave C5 0.806827 155.35 -491.51 3472.81 0.99715 0.366376Leave O5 0.923371 72.03 -182.53 2143.95 0.99729 0.114590Leave O4 0.764173 129.91 -209.29 1105.75 0.99720 0.296859 To investigate the applicability of the bending factor developed in the study, bending factors were calculated for more than 600,000 FWD basins from the LTPP database. Figures 5 and 6 present the distribution of these factors for the FWD basins from approach slab test calculated using the O5 sensor configuration and for the basins from the leave slab test calculated using the C6 sensor configuration. In most cases, the correction was less than 4 percent. During the bending factor testing using data from the LTPP database, it was found that significant discrepancies existed in measured LTEs for the same joints measured with a load plate placed on the approach and the leave side of the joint. The correction factors presented above did not significantly reduce these discrepancies. An additional investigation was conducted in an attempt to resolve this issue.
11

The finite element model used in the development of the correction factors did not account for differences in pavement responses as a result of the location of the loaded plate. Also, the PCC slabs were assumed to be in full contact with the subgrade. In reality, the application of a large number of a heavy axle loads moving in one direction may cause the formation of permanent voids under the leave side of the joint. An assumption was made that those voids are responsible for the discrepancy between leave and approach test results. In addition, PCC slab curling causes slabs to separate, creating temporary voids. This effect also was analyzed in this study.
0
10
20
30
40
50
60
70
80
90
100
0.98 0.99 1 1.01 1.02 1.03 1.04 1.05 1.06 1.07 1.08
Bending Correction Factor
Cum
ulat
ive
Perc
enta
ge o
f Mea
sure
men
tsem
ens
Figure 5. Distribution of bending correction factors for approach slab testing based on O5 sensor configuration.
A factorial of 504 finite element runs with different temperature gradients through slab thickness, joint stiffness, and subgrade stiffness was performed. In all cases, a 1.52-m (5-ft)-long permanent void occupying the entire leave slab width was modeled. In half of the cases, the load was placed at the approach side of the joint, and in the other half it was placed at the leave side. The load transfer values from the deflections induced by the loads placed at the approach side of the joint, LTE1, were compared with the corresponding load transfer values calculated for the same systems but the load placed on the leave side on the joint, LTE2. Figure 7 presents a comparison of those LTEs. As shown in the figure, the presence of a void significantly skewed computed LTE values. The figure shows that LTEs computed from the leave slab test should be lower than those computed from the approach slab test. Moreover, this effect may be much more pronounced than the effect of slab bending.
12

0
10
20
30
40
50
60
70
80
90
100
0.98 0.99 1 1.01 1.02 1.03 1.04 1.05 1.06 1.07 1.08
Bending Correction Factor
Cum
ulat
ive
Perc
enta
ge o
f Mea
sure
men
sem
ens
Figure 6. Distribution of bending correction factors for leave slab testing based on C6
sensor configuration.
0 10 20 30 40 50 60 70 80 90
100
0 20 40 60 80
LTE1 (%)
LT
E2 (
%)
100
Figure 7. Comparison of LTEs predicted using ISLAB2000 for the approach slab test
(LTE1) and the leave slab test (LTE2) for pavements with voids.
13

This analysis agrees with the analysis of LTPP data that discrepancies may exist between the LTEs computed from leave and approach tests; however, in the vast majority of cases analyzed, an opposite trend was observed. As will be discussed in chapter 3, LTEs computed from the leave slab test usually were higher than LTEs computed from the approach slab test. At this stage, no mechanistic explanation of this phenomenon was found. More research is needed to address this issue. Meanwhile, considering that the correction factors presented above did not change the calculated LTE values significantly, and that void/curling correction should be incorporated into this factor, a decision was made not to use the bending factor in this study.
14
CHAPTER 3. FWD DEFLECTION DATA ASSESSMENT AND LTE CALCULATION METHODOLOGY
This section presents the results of an assessment of FWD deflection data used in joint/crack LTE calculation and describes the procedure used to determine representative LTE parameters. Deflection Testing Details The deflection data were downloaded during the summer of 2001 from LTPP database table MON_DEFL_DROP_DATA. Information about sensor locations was obtained from database tables MON_DEFL_LOC_INFO and MON_DEFL_DEV_SENSORS (June 2001 release). For rigid pavements in the LTPP program, the following types of deflection tests are conducted:
1. Center slab tests (J1 and C1 tests). 2. Corner tests (J2 and C2 tests). 3. Midpanel at the pavement edge tests (J3 and C3 tests). 4. LTE of joints/cracks tests (J4, J5, C4, and C5 tests).
For this study, only the LTE test data were used. For the LTE testing, the FWD load is applied at one side of the joint or crack and the deflections are measured at both sides of the joint or crack. The LTE testing with the load plate placed at the leave side of the joint requires deflection sensors placed at 0 and 305 mm (0 and 12 inches) from the center of the load plate. The LTE testing with the load plate placed at the approach side of the joint requires deflection sensors placed at 0 and -305 mm (0 and -12 inches) from the center of the load plate. The load sequence, as stored, for rigid pavement testing is as follows:
Drop Height
No. of Drops
Target Load, kN Acceptable Range, kN
2 3 4
4 4 4
40.0 53.3 71.1
36.0 to 44.0 48.1 to 58.7 64.1 to 78.3
For JCP, LTE tests are performed along the midlane path at each tested slab, and the test locations are designated as J4 for loads placed at the leave slab and J5 for loads placed at the approach slab. The number of panels can vary from as few as 9 or 10 to as many as 35 or more on a 152.4-m (500-ft)-long section. Regardless of the total number of panels present, no more than 20 panels are tested at one section. For the CRCP, deflection basin tests are also performed along the midlane path at spacing of about 7.6 m (25 ft) and on both sides of a crack. The test locations are designated as C4 and C5 for leave and approach panel loading, respectively. For CRCP, two adjacent transverse cracks are typically at a spacing of 0.3 to 2.5 m (1 ft to 8 ft). Tests are performed at 20 effective panels.
15

Deflection Data Assessment A total of 850,791 raw deflection basins were extracted from the LTPP database for 581 JCP sections and 116 CRCP sections, as shown in table 3. The extracted data were examined to ensure their consistency and reasonableness, and some data were excluded from the analysis. The reasons for data rejection were:
• Incorrect FWD sensor configuration. • Incorrect testing time or location. • Insufficient number of data points for a section.
Two percent of the basins (17,214 basins) were eliminated from the analysis. LTEs were calculated for the remaining 833,577 basins, but 13,181 of them were identified as questionable and excluded from calculation of representative statistical indexes for joint and section LTEs. The reason for the rejection was inconsistency with other measurements for the same time of testing, joint, load plate location, and load level. The following procedure was used to examine the consistency of the FWD measurements. First, for each time of testing, location, and FWD load and level, the average loaded and unloaded deflections and applied pressure were calculated. After that, each FWD basin was tested on its deviation from the mean values. The basin was rejected if at least one of the following conditions was violated:
LLL δδδ 01.12299.0 +<<− (14)
UUU δδδ 01.12299.0 +<<− (15)
PPP 02.15.25.298.0 +<<− (16) where:
- Lδ = FWD sensor deflection on the loaded side of the crack/joint, microns. - Lδ = mean FWD sensor deflection on the loaded side of the crack/joint for the same
time of testing, joint location, and FWD load level microns. - Uδ = FWD sensor deflection on the loaded side of the crack/joint, microns.
- Uδ = mean FWD sensor deflection on the loaded side of the crack/joint for the same FWD pass, joint location, and FWD load level, microns.
- P and P = total FWD load and mean FWD load for the same FWD pass, joint location, and FWD load level in kN, respectively. They are defined as follows:
paP 2π= (17) paP 2π= (18)
where: - a = FWD plate radius, mm. - p and p = FWD pressure and mean FWD pressure for the same FWD pass, joint
location, and FWD load level in kN, respectively.
16

Only 597 basins were rejected because of high variability in FWD load magnitude measurement. Significantly more basins were rejected because of variability in loaded or unloaded deflection, as shown in table 2.
Table 2. Number of basins rejected because of high variability.
Reason for Rejecting Number of Basins
High variability in FWD load magnitude 597 High variability in loaded deflection 4,293 High variability in unloaded deflection 6,784 High variability in both loaded and unloaded deflection
1,507
Overall, the quality of the deflection data was found to be very high. More than 96 percent of the deflection basins measured for almost 700 sections were accepted for future analysis. Table 3 shows the distribution of the accepted and rejected basins for each test types.
Table 3. Availability of deflection data.
Test Type Number of Sections
Represented
Number of Records
Number of Excluded Records
C4 (approach) 116 69,025 847 C5 (leave) 116 65,172 805 J4 (approach) 581 355,825 7,243 J5 (leave) 572 343,555 4,286 Total 1,385 833,577 13,181
Load Transfer Index Calculation Procedures From the basins accepted after initial screening, representative LTE parameters were calculated for each deflection basin, for each joint, and for each FWD pass. Analyses were performed separately for approach and leave tests. Procedures for calculation of each set of parameters are presented below. First, for each deflection basin extracted from the LTPP database, deflection LTE is calculated using equation 1. After that, statistical summaries of LTE for each joint were computed. This involved the following steps: Step 1. Compute mean LTE for joint/crack and FWD load level For each FWD pass, joint/crack location, and drop height, mean LTE was computed. Only LTEs from deflection basins that passed the criteria defined by equations (14) through (16) were used for computing these parameters.
17

Step 2. Compute LTE crack/joint statistics For each FWD pass and joint/crack location, the following parameters were computed:
• Mean joint/crack LTE. • Minimum joint/crack LTE. • Maximum joint/crack LTE. • Standard deviation of joint/crack LTE.
LTEs from all FWD load levels were used to compute these parameters. Step 3. Determine joint/crack LTE load dependency index Using mean LTE for nominal load levels of 40 kN (drop height equal to 2) and 70 kN (drop height equal to 4), LTE load dependency index was identified using the following criteria:
⎪⎩
⎪⎨⎧
><<
=5LTE_70-LTE_405LTE_70-LTE_405LTE_40-LTE_70
,3,2,1
EVEL_FLAG LTE_LOAD_Lififif
(19)
where:
- LTE_LOAD_LEVEL_FLAG = a flag indicating if joint/crack LTE depends on FWD load level
= 1, if load level independent = 2, if LTE increases with load = 3, if LTE decreases with load
- LTE_40 = mean LTE for the crack/joint for nominal load levels of 40 kN, percent. - LTE_70 = mean LTE for the crack/joint for nominal load levels of 70 kN, percent.
Second, once LTE parameters for each joint were calculated, statistical summaries of LTE for each section were created. These parameters were calculated for each FWD pass. This required performing the following steps: Step 1. Determine FWD pass number To compute statistics of joint/crack LTE parameters for the SMP LTPP sections, FWD deflection basins were grouped by FWD passes. Each FWD test and corresponding LTE parameters received an FWD pass number from 1 to 9. The following procedure was used:
• Sort all extracted deflection basins by section, test date, test position, test time, and test location.
• If the deflection basin is the first deflection basin of its test type for the LTPP section conducted on that day, assign FWD pass number equal to 1.
18

• If the deflection basin has the same LTPP section ID, test date, and test type as the previous basin, and the test location is greater than or equal to the test location for the previous basin, assign the same FWD pass number as for the previous basin; otherwise, assign the FWD pass the next higher number.
Step 2. Compute LTE section statistics for each FWD load level For each FWD pass and FWD load level, the following parameters were computed:
• Mean section joint/crack LTE. • Minimum section joint/crack LTE. • Maximum section joint/crack LTE. • Standard deviation of LTEs.
Step 3. For each FWD pass, perform t-test for load level dependence Statistical t-tests were conducted if the LTEs from nominal load levels of 40 kN and 70 kN were statistically different (p-value is less than 0.05). Step 4. Compute LTE section statistics for deflection basins from all FWD load levels For each FWD that pass using LTEs from all joints and load levels, compute the following parameters:
• Overall mean section joint/crack LTE. • Overall minimum section joint/crack LTE. • Overall maximum section joint/crack LTE. • Overall standard deviation of LTE.
Step 5. Determine section LTE load dependency index Using the mean section LTE for nominal load levels of 40 kN and 70 kN, and the results of t-test from step 4, determine LTE load dependency flag for crack/joint:
⎪⎩
⎪⎨
⎧
<><<
<=
0.05p and5LTE_70-LTE_400.05p and 5LTE_70-LTE_40
5LTE_70-LTE_40
,3,2,1
FLAG OAD_LEVEL_LTE_SECT_Lififif
(20)
where: - LTE_SECT_LOAD_LEVEL_FLAG = a flag indicating if section LTE depends on
FWD load level = 1, if load level independent = 2, if increases with load = 3, if decreases with FWD load
- LTE_40 = mean LTEs for the crack/joint for nominal load levels of 40 kN. - LTE_70 = mean LTEs for the crack/joint for nominal load levels of 70 kN.
19

Results of LTE Analysis The research team proposes that the results of the basin-by-basin LTE calculation be stored in the LTPP database table MON_DEFL_RGD_LTE_POINT. Summary values of calculated LTE parameter results for each joint of the GPS and SPS sections should be stored in database table MON_DEFL_RGD_LTE_JOINT. The results are presented in terms of the mean values, minimum values, maximum values, and load dependency index. Summary values of calculated LTE parameters for each section should be stored in database table MON_DEFL_RGD_LTE_SECT.
20

CHAPTER 4. LTE TREND ANALYSIS This chapter presents the results of the analysis of LTE calculated from the LTPP FWD data using the procedure described in chapter 3. This analysis included:
• Assessment of the LTE for individual joints and sections, as well as variability associated with those parameters.
• Evaluation of the effect of different factors (presence of dowels, base type, subgrade type, PCC thickness, climatic conditions, pavement age, traffic level) on LTE.
• Evaluation of the relationship between the LTE level and amount of faulting and other distresses observed.
LTE Data Assessment The LTTP database contains FWD deflection data for PCC pavement sections throughout the United States and Canada. These sections vary in age, design features, and site conditions. Therefore, it is not a surprise that the resulting LTEs vary from very low (less than 20 percent) to very high (close to or greater than 100 percent). Figures 8 and 9 present cumulative frequency curves for mean LTE for joints in the LTPP JCP and cracks in the LTPP CRCP, respectively. These frequency curves are based on the results of the analysis of mean values of LTE for individual cracks and joints performed for the same FWD pass from multiple drops and FWD load levels. In the LTPP FWD load-testing program, the FWD loads are applied at both sides of the joints, so the resulting LTEs were grouped by load plate positions. Comparison of figures 8 and 9 shows that the LTEs of joints in JCP vary over a much wider range than do the LTEs of cracks in CRCP. Approximately 10 percent of joints exhibited LTE of less than 50 percent, whereas the vast majority of cracks had LTE greater than 85 percent. Also, in more than 60 percent of cases, CRCP cracks exhibited LTE greater than 90 percent, whereas less than 40 percent of JCP joints had the same level of LTE. Steel reinforcement in a properly designed CRCP keeps cracks tight, which provides a high level of LTE. One can observe that a small fraction of joints and cracks exhibited LTE greater than 100 percent. Although it is possible that high LTEs might be results from measurement errors, it is also possible that the ratios of deflections from the unloaded and loaded slabs measured 152 mm (6 inches) away from the joint can exceed 100 percent. To investigate this phenomenon, an ISLAB2000 finite element model with the following parameters was developed:
• PCC thickness—229 mm (9 inches). • PCC modulus of elasticity—27,560 MPa (3.99 Mpsi). • PCC Poisson’s ratio—0.15. • PCC coefficient of thermal expansion—1.0x10⁻⁵ mm/mm/oC (3.0x10⁻⁷ inch/inch/oC). • Coefficient of subgrade reaction—54 MPa/m (199 Psi/inches). • PCC slab width—3.66 m (12 ft). • PCC joint spacing—4.58 m (15 ft). • Joint type—aggregate joint. • Joint stiffness (AGG factor)—7.0x10⁷ MPa (10,152.6 Mpsi).
21

• FWD load—50.0 kN. Three cases of temperature loading and four void sizes (a total of nine cases) were considered. The difference between the temperatures of the top and the bottom surfaces was equal to -13, 0, or 13 oC (8.6, 32, or 55 oF). The void length in the longitudinal direction was equal to 0 [no void], 0.76, 1.52, and 2.29 m (0, 30, 60, 90 inches). The void width was assumed to be equal to the PCC slab width for all cases. For each combination of void size and temperature differential, deflections were calculated using ISLAB2000 for FWD loads of 50.0 and 0 [no FWD load] kN. Table 4 presents the differences between these deflections for four locations at the slab centerline:
• Under the center of the FWD load plate (152 mm [6 inches] away from the joint). • At the loaded side of the joint. • At the unloaded sides of the joint. • 152 mm (6 inches) away from the joint on the centerline.
Table 4 also presents calculated true and measured LTEs determined as ratios of deflections from unloaded and loaded slabs calculated at the joint and 152 mm (6 inches) from the joint, respectively.
Table 4. Deflections from ISLAB2000 near joints.
Deflections at Different Distances from the Joint (mm (inches))
Loaded Slab Unloaded Slab
LTE Void length
(m (inches))
Temperature Difference (oC (oF))
152 mm (6 inches)
0 mm (0 inches)
0 mm (0 inches)
152 mm (6 inches)
True % Computed %
0 (0) -13 (8.6) 0.562940 0.618033 0.618033 0.549885 100.0 97.7 0 (0) 0 (32) 0.243180 0.266040 0.266040 0.230429 100.0 94.8 0 (0) 13 (55) 0.306476 0.325552 0.325552 0.290093 100.0 94.7 0.76 (30) -13 (8.6) 0.639851 0.705231 0.705231 0.633959 100.0 99.1 0.76 (30) 0 (32) 0.338836 0.375437 0.375437 0.333477 100.0 98.4 0.76 (30) 13 (55) 0.401396 0.437515 0.437515 0.397256 100.0 99.0 1.52 (60) -13 (8.6) 0.657174 0.728802 0.728802 0.669798 100.0 101.9 1.52 (60) 0 (32) 0.379501 0.421945 0.421945 0.383413 100.0 101.0 1.52 (60) 13 (55) 0.433349 0.474777 0.474777 0.438937 100.0 101.3 2.29 (90) -13 (8.6) 0.545617 0.607289 0.607289 0.566420 100.0 103.8 2.29 (90) 0 (32) 0.397053 0.442011 0.442011 0.407873 100.0 102.7 2.29 (90) 13 (55) 0.441731 0.484734 0.484734 0.452145 100.0 102.4
Analysis of table 4 shows that true LTEs are the same for all cases, whereas computed LTEs vary from 94.7 to 103.8 percent. Computed LTE increases as void size and temperature differential increase, supporting the hypothesis that the presence of voids and slab lift-off may lead to FWD measurements corresponding to LTE higher than 100 percent.
22

From these data, one can conclude that high LTE does not necessary mean measurement error; it can be explained by the fact that measurements are usually taken 152 mm (6 inches) away from the joint. Therefore, these LTEs were retained in the analysis. Effect of FWD Load Position Analysis of figure 8 also shows that loading position has a significant effect on resulting LTEs of individual cracks of CRCP sections. Indeed, less that 30 percent of cracks had mean LTEs of less than 90 percent from the FWD test with a load plate on the leave side of a crack (loading position C5). Moreover, more than 37 percent of cracks had mean LTEs of less than 90 percent if an FWD load plate was placed on the approach side of a crack (loading position C4). As observed in figure 9, the loading position has an even greater effect on the resulting LTEs of individual joints of JCP sections. For example, more that 30 percent of joints had mean LTE less than 70 percent from the FWD test with a load plate on the approach side of a joint (loading position J4). In addition, fewer than 24 percent of joints had mean LTEs less than 70 percent if an FWD load plate was placed on the leave side of a joint (loading position J5).
0
10
20
30
40
50
60
70
80
90
100
70 75 80 85 90 95 100 105 110Mean LTE (%)
Cum
ulat
ive
Perc
enta
ge o
f Joi
nts
Approach Tests Leave Tests
Figure 8. Distribution of crack LTE mean values, CRCP sections.
23

0
10
20
30
40
50
60
70
80
90
100
20 30 40 50 60 70 80 90 100 110Mean LTE (%)
Cum
ulat
ive
Per
cent
age
of J
oint
s
Approach Tests Leave Tests
Figure 9. Distribution of joint LTE mean values, JCP sections.
Because loading position has a significant effect on mean LTEs for individual cracks and joints, it is not a surprise that mean values for LTPP sections were also affected by loading position. Figures 10 and 11 present comparisons of mean LTEs derived from data under the approach and leave tests for CRCP and JCP sections, respectively, calculated for each test section for each FWD pass. To further investigate this effect, a Student t-test was conducted for the FWD tests conducted on each section in the same FWD pass to compare the average LTEs computed from approach and leave tests deflection data. The data were considered to come from the same population if the null hypothesis of equal means and mean could not be rejected at the 95 percent confidence level (p-value < 0.05). Table 5 presents the results of this analysis. For CRCP sections, 223 of 353 data sets (66 percent) did not exhibit a significant difference between the LTEs determined from approach and leave tests. Twenty-one data sets (6 percent) resulted in LTEs from approach tests statistically higher than LTEs from leave tests. Finally, 99 data sets (28 percent) resulted in LTEs from leave tests statistically higher than LTEs from approach tests. For JCP sections, 1893 of 2652 data sets (71 percent) did not exhibit significant differences between LTEs determined from approach and leave tests. Only 163 data sets (6 percent) resulted in LTEs from approach tests statistically higher than LTEs from leave tests. Finally, 596 data sets (22 percent) resulted in LTEs from leave tests statistically higher than LTEs from approach tests.
24

Although a significant number of data sets were identified as producing statistically different mean LTEs from approach and leave tests, in many cases the differences of mean values from those data sets were not practically significant. To address this issue, the results of t-tests were re-evaluated and data sets with an absolute difference in LTEs from approach and leave tests less than 5 percent were assigned to be indifferent to FWD load position. The results of this analysis are presented in table 6. As expected, the number of FWD data sets for which mean LTEs from leave and approach test were found to be statistically and practically different are lower than the number of data sets for which these LTEs are just statistically different. At the same time, however, the number of data sets for JCP sections for which mean LTEs from tests approach and leave are different both statistically and practically is still quite high.
Table 5. Comparison of statistical significance of LTEs from approach and leave deflection tests.
Pavement Number of FWD Passes Type Total Statistically
Similar Approach LTE
is Greater Leave LTE is
Greater CRCP 353 233 21 99 JCP 2652 1893 163 596
Table 6. Comparison of practical difference between LTEs
from approach and leave deflection tests.
Pavement Number of FWD Passes Type Total Practically
Similar Approach LTE
is Greater Leave LTE is
Greater CRCP 353 346 1 6 JCP 2652 2174 63 415 As was discussed in chapter 2, an attempt was made to explain this effect by considering the presence of voids under the leave slab. However, that model could only provide an explanation for the cases when mean LTE from the approach test is greater than mean LTE from the leave test. For the majority of the cases when the opposite trend was observed, no good mechanistic explanation was found. As suggested by Byrum (2001), test sequence can affect LTE measurements significantly. Since in the LTPP testing program the approach test is always performed prior to the leave test, aggregate interlock is better established after the approach tests are completed, which may result in higher measured LTE. This hypothesis, however, could not be verified under this study.
25

60
70
80
90
100
110
60 70 80 90 100 110Approach LTE (C4), % OOOO
Lea
ve L
TE
(C5)
, %
OOOO
Figure 10. Effect of FWD load position on mean section crack LTE for CRCP.
10
20
30
40
50
60
70
80
90
100
110
10 20 30 40 50 60 70 80 90 100 110Approach LTE (J4), % OOOOO
Lea
ve L
TE
(J5)
, %
OOOO
Figure 11. Effect of FWD load position on mean section LTE for JCP.
26

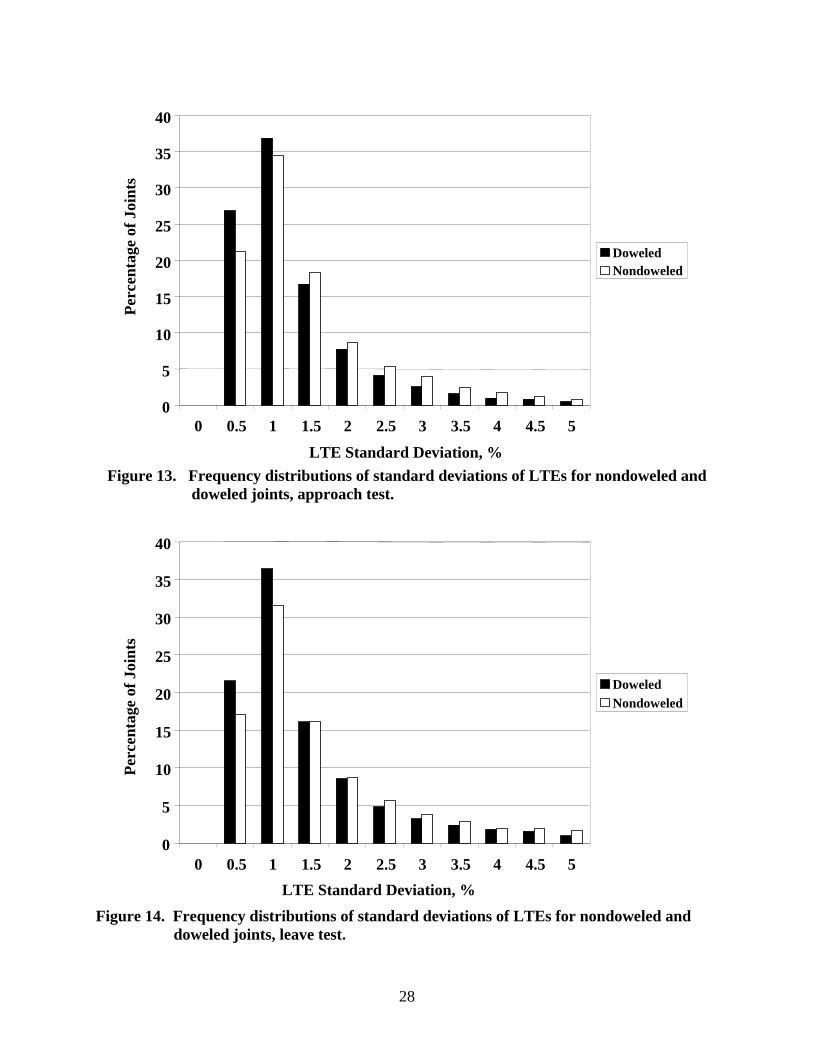
Variability in Measured LTEs for Individual Cracks/Joints The LTPP database contains up to 12 records of LTE measurements for each joint at any specific time (4 repetitive measurements at 3 different load levels). This provides an opportunity to investigate the extent of variability in measured LTE for a single joint. To characterize this variability, standard deviations of LTE for individual cracks/joints were computed. Figure 12 presents a frequency histogram of standard deviations for CRCP and JCP for leave and approach tests. Most joints showed low variability in LTE measurement with a standard deviation of less that 2 percent. Moreover, variability in LTE for cracks was lower than for joints. Joint LTEs determined from the leave slab test exhibited slightly higher variability than LTEs from the approach slab test. For JCP sections, comparison of variability of joint LTE for doweled and nondoweled sections was also conducted. It was found that doweled joints exhibited slightly lower coefficient of variation than nondoweled joints for both approach and leave tests, as can be observed from figures 13 and 14, respectively. Therefore, one can conclude that the presence of dowels reduces the variability of load transfer.
0
5
10
15
20
25
30
35
40
45
0 0.5 1 1.5 2 2.5 3 3.5 4 4.5 5LTE Standard Deviation, % OOOOO
Perc
enta
ge o
f Joi
nts
Approach Tests for CRCP Leave Tests for CRCPApproach Tests for JCPLeave Tests for JCP
Figure 12. Frequency distributions of standard deviations of LTEs for individual
cracks/joints from different test types.
27
0
5
10
15
20
25
30
35
40
0 0.5 1 1.5 2 2.5 3 3.5 4 4.5 5
LTE Standard Deviation, %
Perc
enta
ge o
f Joi
nts
DoweledNondoweled
Figure 13. Frequency distributions of standard deviations of LTEs for nondoweled and
doweled joints, approach test.
0
5
10
15
20
25
30
35
40
0 0.5 1 1.5 2 2.5 3 3.5 4 4.5 5 LTE Standard Deviation, %
Perc
enta
ge o
f Joi
nts
DoweledNondoweled
Figure 14. Frequency distributions of standard deviations of LTEs for nondoweled and doweled joints, leave test.
28
Load Level Dependency It is generally believed that the LTE of cracks and joints does not depend on load level if the load level is sufficiently large. However, for joints that exhibited high variability (or poor repeatability) in LTE measurements, load level dependency might be one of the reasons for such variability. To investigate this hypothesis, an analysis of the load dependency index was performed. The load dependency index classifies joint/crack LTE as load-dependent if the mean LTE for the lowest load level is more than 5 percent different from the mean LTE for the highest load level. Table 7 presents the summary of load dependency indexes for all joints and cracks evaluated. The majority of LTEs of cracks in CRCP were classified as load level independent (more than 96 percent for both leave and approach tests). A higher percentage of LTEs of JCP joints were classified as load level dependent (decreasing or increasing with the FWD load level) (9 percent for approach slab tests and 16 percent for leave slab tests). It is interesting to note that, for approach slab testing, the number of joints that exhibited an increase in LTE level with load level increase is almost equal to the number of joints that exhibited a decrease in LTE with an increase in load level. Moreover, for the leave slab testing, almost all load level-dependent LTEs increased as load levels increased.
Table 7. Joint LTE load level dependence.
Percentage of Joint with LTE–Load Level Relationship Test Type Independent Decreasing with
Load Increasing Decreasing with Load Decreasing
Not Defined
C4 (approach) 96.8 2.0 1.0 0.2 C5 (leave) 96.4 1.9 1.5 0.2 J4 (approach) 90.0 5.0 4.1 0.9 J5 (leave) 82.9 1.2 15.2 0.8 Different percentages of load level-dependent joints for leave and approach tests for the same type of pavement indicate that the same joint may exhibit load level-dependent behavior for FWD tests on one side of the joint and load level-independent behavior for another side of the joint. Figures 15 and 16 give examples of such behavior. The joints of section 370201 in North Carolina exhibited very low load level dependency for an approach test on November 27, 1995. During the same FWD pass, a leave test indicated that joint LTE increased as the load level increased. To further evaluate this phenomenon, mean LTEs were computed for each LTPP section for individual FWD passes and load levels. Similar to what was discussed above for LTE of individual joints, load level dependency for each FWD pass was determined. The section was identified to exhibit load level-independent behavior for a certain FWD pass and test type (leave or approach) if a student t-test finds LTEs from the lowest and highest load level statistically different and mean values for the lowest and highest load level LTEs differ by more than 5 percent.
29
Table 8 presents a summary of load dependency indexes for all FWD passes evaluated. The vast majority of LTPP sections were classified as having load level-independent LTEs (99.7 and 98.9 percent of FWD passes of CRCP sections for approach and leave tests, respectively, and 97.2 percent of approach test FWD passes for JCP sections). In addition, more than 10 percent of FWD passes of leave tests of JCP sections resulted in load level-dependent LTE (mostly LTE increasing with FWD load increasing).
Table 8. FWD pass LTE load level dependence.
Test Type Independent, Percentage of FWD
Passes
Decreased, Percentage of FWD Passes
Increased, Percentage of FWD
Passes C4 (approach) 99.7 0.0 0.3 C5 (leave) 98.9 0.3 0.8 J4 (approach) 97.2 1.4 1.4 J5 (leave) 89.6 0.2 10.2 To evaluate whether load level dependency is a repeatable effect, sections with multiple FWD visits were evaluated. For each section that exhibited load level-dependent LTE behavior on at least one FWD visit, the ratio of the visits that resulted in load level-dependent behavior to the total number of FWD visits of that section was calculated. The averages of those ratios then were computed and found to be 0.36 and 0.52 for approach and leave tests, respectively. Thus, if a section exhibited load level-dependent LTE for a leave test, there is only about a 50 percent chance that the next FWD visit also will find the LTE for this section load level dependent. Conversely, such low repeatability may be explained by variability from visit to visit in the actual LTE measurements. LTE level may vary from one visit to another, as a result of changes in temperature conditions. As will be discussed later in this chapter, FWD passes with higher mean LTE have lower overall variability than passes with lower mean LTE. Therefore, an increase in LTE level from one pass to another may render the difference in LTEs from different load levels statistically insignificant. To eliminate this effect, the analysis of load dependency variability was repeated for FWD passes with mean LTEs of less than 80% and for FWD passes with mean LTEs of less than 70%. The results of those analyses are summarized in table 9. If only passes with low LTEs are considered, the repeatability of load level dependency for the leave test increases to 82%. Therefore, it is quite likely that load level dependency is a repeatable effect for the leave test. However, no explanation was found for why the same trend was not observed for approach tests.
30

Table 9. Repeatability ratios for different LTE levels.
Average Repeatability Ratio Test Type All Passes Passes with Mean LTE
Lower than 80% Passes with Mean LTE
Lower than 70% Approach (J4) 0.36 0.42 0.45 Leave (J5) 0.52 0.73 0.82
0
10
20
30
40
50
60
70
80
90
100
0 20 40 60 80 100 120 140 160 Station (m)
LT
E (%
)
Load Level 2 Load Level 3 Load Level 4
Figure 15. LTE for section 370201 on November 27, 1995, approach (J4) test.
31
1 m = 3.28 ft
0 10 20 30 40 50 60 70 80 90
100
0 20 40 60 80 100 120 140 160 Station (m)
LT
E (%
)
Load Level 2 Load Level 3 Load Level 4
1 m = 3.28 ft
Figure 16. LTE for section 370201 on November 27, 1995, leave (J5) test.
Variability in LTE Along Section Length In this study, mean values and standard deviations of joint/crack LTEs were calculated for each FWD pass of GPS and SPS sections. To further examine how well these mean values represent pavement section joint/crack properties, distributions of coefficients of variation of LTE for FWD visits were analyzed. Figure 17 shows cumulative frequency distributions of the coefficient of variation of LTE for JCP and CRCP sections. The variability in LTE is much lower for CRCP sections than for JCP sections. The coefficient of variation in crack LTE is less than 5 percent for more than 90 percent of CRCP pavement sections. In addition, more than 30 percent of JCP sections exhibited a coefficient of variation greater than 10 percent. The lower spatial variability in CRCP crack LTE can be explained by the fact that the LTE of CRCP cracks is expected to be very high (in the range of 90 to 100 percent) for pavements that are performing well. To achieve this, low spatial variability is required. Because joint LTE is expected to deteriorate over time, higher variability is possible for older sections. The relationship between LTE level and LTE variability was first identified by Wu and Tayabji (2002). They found that the LTE coefficient of variation (a ratio of the standard deviation and mean LTE) is inversely related to the mean LTE. This hypothesis was confirmed by this study.
32

0
10
20
30
40
50
60
70
80
90
100
0 5 10 15 20 25 30
Coefficient of variation at particular section
Cum
ulat
ive
perc
enta
ge o
f sec
tions
OO
OO
Approach Tests for CRCPLeave Tests for CRCPApproach Tests for JCPLeave Tests for JCP
CRCP
JCP
Figure 17. Coefficient of variation of LTE within a section.
Figure 18 shows the coefficients of variation as a function of mean LTE. The coefficient of variation decreases as the mean LTE increases. The figure also confirms the observation made by Wu and Tayabji that variability of coefficients of variation among sections with lower LTE is higher than those with a higher level of LTE. The effect of load location on spatial variability also was investigated. Analysis of figure 17 shows no appreciable difference in spatial variability from LTE tests of approach slabs (J4 and C4) and from leave sides (J5 and C5) for JCP and CRCP sections. Moreover, it was found that doweled JCP sections exhibited lower spatial variability than nondoweled JCP sections for both leave and approach tests (see figures 19 and 20).
33
y = -0.0054x + 0.5398
R2 = 0.5185
0
0.1
0.2
0.3
0.4
0.5
0.6
0.7
0.8
0.9
1
0 20 40 60 80 100 Mean LTE (%)
Coe
ffic
ient
of V
aria
tion
Figure 18. Coefficient of variation versus mean LTE for approach tests.
0
5
10
15
20
25
30
0 2 4 6 8 10 12 14 16 18 20 22 24 26 28 30LTE Standard Deviation (%)
Perc
enta
ge o
f Pas
ses
Doweled Nondoweled
Figure 19. Comparison of standard deviations of section LTE for doweled and nondoweled JCP sections (approach tests).
34

0
5
10
15
20
25
30
0 2 4 6 8 10 12 14 16 18 20 22 24 26 28 30LTE Standard Deviation (%)
Perc
enta
ge o
f Pas
ses
Doweled Nondoweled
Figure 20. Comparison of standard deviations of section LTE for doweled and nondoweled JCP sections (leave tests). Effect of Design Features and Site Conditions on LTE The effects of design features and site conditions affecting LTE were investigated in this study. The effects of the following parameters were investigated:
• Type of load transfer device. • Base type. • Subgrade type. • PCC thickness. • PCC strength. • Percentage of steel reinforcement (CRCP). • Joint spacing (JCP). • Joint orientation (JPCP). • Climatic factors. • Pavement age.
35

Type of Load Transfer Device As expected, the type of load transfer device has a major effect on the LTE of JCP joints. Figures 21 and 22 show comparisons of cumulative distributions of mean LTEs for each FWD pass for doweled and nondoweled sections for approach and leave tests, respectively. Doweled joints exhibited much higher LTE than nondoweled joints. For example, 64 and 68 percent of doweled sections exhibited mean LTE greater than 80 percent for approach and leave tests, respectively. For nondoweled sections, the corresponding values were only 40 and 48 percent of sections. Surprisingly, dowel diameter was not found to have a significant effect on LTE (see figures 24 and 26). However, these results could be confounded by many factors, including pavement age, traffic level, PCC properties, and construction quality.
0
10
20
30
40
50
60
70
80
90
100
20 30 40 50 60 70 80 90 100 110Mean LTE (%) OOOO
Cum
ulat
ive
Perc
enta
ge o
f Pas
ses
Doweled Nondoweled
Figure 21. Distribution of section LTE mean value, nondoweled versus doweled,
approach test (J4).
36

0
10
20
30
40
50
60
70
80
90
100
20 30 40 50 60 70 80 90 100 110Mean LTE (%)
Cum
ulat
ive
Perc
enta
ge o
f Pas
ses
Doweled Nondoweled
Figure 22. Distribution of section LTE mean value, nondoweled versus doweled,
leave test (J5).
0
10
20
30
40
50
60
70
80
90
100
20 30 40 50 60 70 80 90 100 110Mean LTE (%)
Cum
ulat
ive
Perc
enta
ge o
f Joi
nts
Doweled Nondoweled
Figure 23. Distribution of joint LTE mean value, nondoweled versus doweled,
approach test (J4).
37

0
10
20
30
40
50
60
70
80
90
100
20 30 40 50 60 70 80 90 100 110Mean LTE (%)
Cum
ulat
ive
Perc
enta
ge o
f Joi
nts
Dowel Diameter < 1.25 in Dowel Diameter = 1.25 in Dowel Diameter > 1.25 in
Figure 24. Distribution of joint LTE mean value for different dowel diameter approach test (J4).
0
10
20
30
40
50
60
70
80
90
100
20 30 40 50 60 70 80 90 100 110Mean LTE (%)
Cum
ulat
ive
Perc
enta
ge o
f Joi
nts
Doweled Nondoweled
Figure 25. Distribution of joint LTE mean value, nondoweled versus doweled leave test (J5).
38
1 inch = 25.4 mm
s,
,

0
10
20
30
40
50
60
70
80
90
100
20 30 40 50 60 70 80 90 100 110Mean LTE (%)
Cum
ulat
ive
Perc
enta
ge o
f Joi
nts
Dowel Diameter < 1.25 in Dowel Diameter = 1.25 in Dowel Diameter > 1.25 in
1 inch = 25.4 mm
Figure 26. Distribution of joint LTE mean value for different dowel diameters, leave test (J5).
Effect of Base Type The LTPP PCC pavement sections employ many different types of materials as the base layer. To analyze the effects of base type on joint/crack LTE determined from the FWD deflection data, these different types were combined into four groups: untreated aggregate base (AGG), asphalt-treated base (ATB), cement-treated base (CTB), and lean concrete base (LCB). The materials used for AGG included gravel or crushed stone, limerock, and soil-aggregate mixture. The materials used for ATB included dense-graded asphalt cement, open-graded asphalt concrete, and sand asphalt. The materials used for CTB included cement-aggregate mixture and cement-treated subgrade soil. LTEs of individual joints were separated according these base types. Figures 27 and 28 show cumulative distributions of doweled joints LTEs for different base types calculated from approach and leave tests, respectively. No significant correlation was found between LTE distribution and base type for doweled joints. LTE distributions for nondoweled joints for different base types computed from approach and leave tests are shown in figures 29 and 30, respectively. AGG, ATB, and CTB exhibited very similar distributions of LTE. In addition, joints in JCP sections with LCB exhibited lower LTE than joints in JCP sections with other base types. A statistical t-test was conducted to compare the significance of the difference in LTE for pavements with LCB and other bases. It was found that this difference was statistically significant (p-value equal to 1.e-9).
39
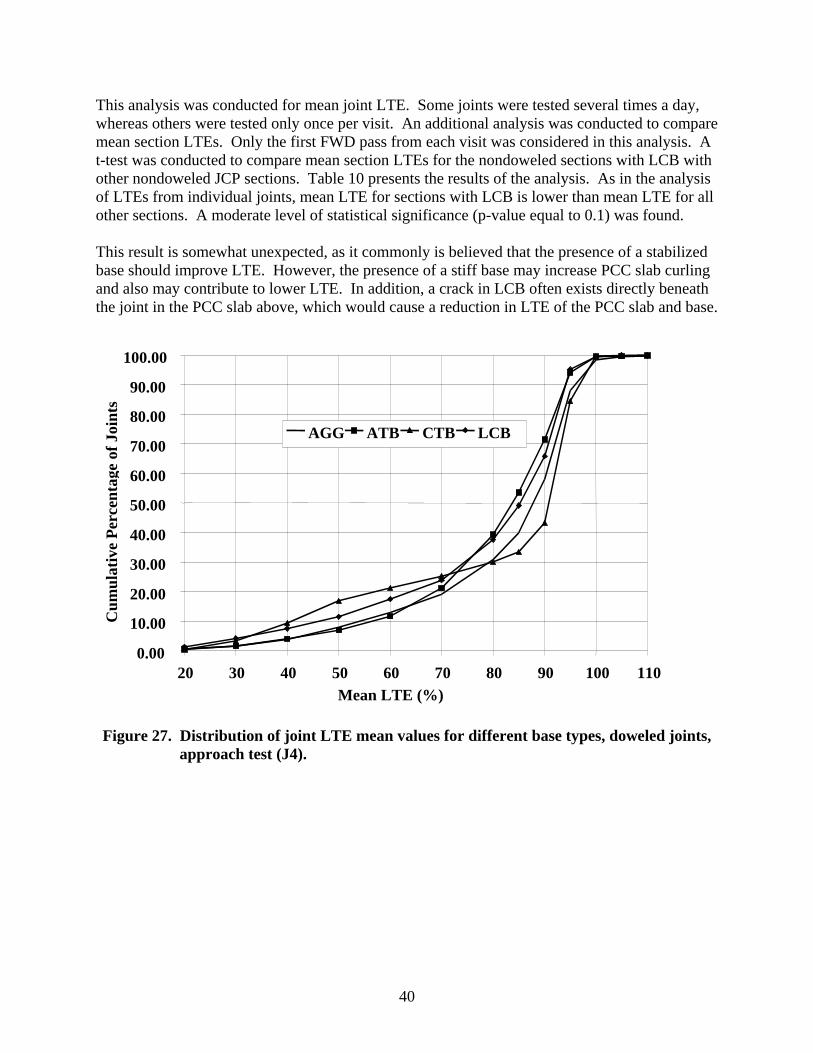
This analysis was conducted for mean joint LTE. Some joints were tested several times a day, whereas others were tested only once per visit. An additional analysis was conducted to compare mean section LTEs. Only the first FWD pass from each visit was considered in this analysis. A t-test was conducted to compare mean section LTEs for the nondoweled sections with LCB with other nondoweled JCP sections. Table 10 presents the results of the analysis. As in the analysis of LTEs from individual joints, mean LTE for sections with LCB is lower than mean LTE for all other sections. A moderate level of statistical significance (p-value equal to 0.1) was found. This result is somewhat unexpected, as it commonly is believed that the presence of a stabilized base should improve LTE. However, the presence of a stiff base may increase PCC slab curling and also may contribute to lower LTE. In addition, a crack in LCB often exists directly beneath the joint in the PCC slab above, which would cause a reduction in LTE of the PCC slab and base.
0.00
10.00
20.00
30.00
40.00
50.00
60.00
70.00
80.00
90.00
100.00
20 30 40 50 60 70 80 90 100 110Mean LTE (%) OOOO
Cum
ulat
ive
Perc
enta
ge o
f Joi
nts
AGG ATB CTB LCB
Figure 27. Distribution of joint LTE mean values for different base types, doweled joints, approach test (J4).
40

0.00
10.00
20.00
30.00
40.00
50.00
60.00
70.00
80.00
90.00
100.00
20 30 40 50 60 70 80 90 100 110Mean LTE (%) OOOO
Cum
ulat
ive
Perc
enta
ge o
f Joi
nts
AGG ATB CTB LCB
Figure 28. Distribution of joint LTE mean values for different base types, doweled joints,
leave test (J5).
0.00
10.00
20.00
30.00
40.00
50.00
60.00
70.00
80.00
90.00
100.00
20 30 40 50 60 70 80 90 100 110Mean LTE (%) OOOO
Cum
ulat
ive
Perc
enta
ge o
f Joi
nts
AGG ATB CTB LCB
Figure 29. Distribution of joint LTE mean values for different base types, nondoweled
joints, approach test (J4).
41

0.00
10.00
20.00
30.00
40.00
50.00
60.00
70.00
80.00
90.00
100.00
20 30 40 50 60 70 80 90 100 110Mean LTE (%) OOOO
Cum
ulat
ive
Perc
enta
ge o
f Joi
nts
AGG ATB CTB LCB
Figure 30. Distribution of joint LTE mean values for different base types, nondoweled joints, leave test (J5).
Table 10. Results of t-test for the effects of LCB on mean section LTE.
Mean LTE Statistical Test LCB Other JCP
p-value Significance*
Approach (J4) 57.48 62.9 0.10 Moderately significant Leave (J5) 65.46 70.3 0.11 Moderately significant * p-value less than or equal to 0.05 was considered significant.
Effect of Subgrade Type on LTE LTPP rigid pavement section support conditions vary from soft, fine-graded material to rock subgrade. Using the American Association of State Highway and Transportation Officials’ (AASHTO) soil classification, the PCC test section subgrade soils were grouped into coarse subgrade (AAHTO soil types A-1, A-2, and A-3) and fine subgrade (AASHTO soil types A-4, A-5, A-6, and A-7). Mean joint LTEs were compared separately for doweled and nondoweled joints. Figures 31 and 32 show comparisons of cumulative distributions of LTE for doweled joints from approach and
42

leave tests, respectively. The joints of PCC sections with fine subgrade exhibited higher LTEs than sections with coarse subgrade for both approach and leave tests. For example, in the approach test, only 30 percent of joints of the sections with fine subgrade had LTEs less than 80 percent, whereas for sections with coarse subgrade such joints account for almost 40 percent of all joints. Although mean LTEs for fine and coarse subgrade sections were quite close (81.9 and 78.5, respectively, for approach tests, and 83.9 and 81.0, respectively, for leave tests), a statistical t-test showed that the difference between LTE for fine and coarse subgrade sections is statistically significant, as shown in table 11. Although this observation is somewhat surprising, it can be explained mechanistically. As was explained in chapter 2, joint LTE is governed by a nondimensional joint stiffness parameter, AGG*, defined as
lkAGGAGG tot=* (21)
where:
- AGGtot = the combined joint stiffness due to dowel and aggregate load transfer. - k = the subgrade k-value. - = the radius of relative stiffness. l
If two pavements have the same joint and other design features but are placed on different subgrades, they should have the same joint stiffness. In addition, a section with a lower k-value will have lower product of k-value and the radius of relative stiffness. Therefore, a section with a lower k-value will have higher nondimensional joint stiffness, AGG, and higher joint LTE. As found by Khazanovich et al. (2001), the LTPP sections with a coarse subgrade have, on average, higher k-values than the sections with fine subgrade, and this difference is statistically significant. Therefore, it is reasonable to expect that JCP with a coarse subgrade would exhibit lower LTE, on average. However, an analysis of the effect of subgrade type on LTE of nondoweled joints found higher LTE for sections with fine subgrade only for approach tests, as presented in figure 33. A statistical t-test also confirmed the significance of the difference. No difference was found for LTE calculated from the leave slab test, as demonstrated in figure 34. A statistical t-test confirmed lack of significance (see table 11).
43

0
10
20
30
40
50
60
70
80
90
100
20 30 40 50 60 70 80 90 100 110Mean LTE (%)
Cum
ulat
ive
Perc
enta
ge o
f Joi
nts
coarse-grained fine-grained
Figure 31. Distribution of joint LTE mean values for different subgrade types, doweled
joints, approach test (J4).
0
10
20
30
40
50
60
70
80
90
100
20 30 40 50 60 70 80 90 100 110Mean LTE (%)
Cum
ulat
ive
Perc
enta
ge o
f Joi
nts
coarse-grained fine-grained
Figure 32. Distribution of joint LTE mean values for different subgrade types, doweled
joints, leave test (J5).
44

0
10
20
30
40
50
60
70
80
90
100
20 30 40 50 60 70 80 90 100 110Mean LTE (%)
Cum
ulat
ive
Perc
enta
ge o
f Joi
nts
coarse-grained fine-grained
Figure 33. Distribution of joint LTE mean values for different subgrade types, nondoweled joints, approach test (J4).
0
10
20
30
40
50
60
70
80
90
100
20 30 40 50 60 70 80 90 100 110Mean LTE (%)
Cum
ulat
ive
Perc
enta
ge o
f Joi
nts coarse-grained fine-grained
Figure 34. Distribution of joint LTE mean values for different subgrade types, nondoweled joints, leave test (J5).
45

Table 11. Results of t-test for the effects of subgrade type on mean section LTE.
Mean LTE Statistical Joint Type Test
Fine Subgrade
Coarse Subgrade
p-value Significance*
Doweled approach 78.54 81.99 0.000240 significant Doweled leave 81.00 83.95 <0.000001 significant Nondoweled approach 65.35 67.51 0.000481 significant Nondoweled leave 72.82 73.25 0.427858 not significant * p-value less than or equal to 0.05 was considered significant.
Effect of PCC Thickness on LTE The effects of PCC thickness of cracks and joints on LTE were analyzed in this study. To exclude the effects of multiple visits and passes, only one LTE value for each section was used in the analysis (the value that corresponds to the lowest mean LTE from all visits from both test types). The analysis was performed separately for CRCP, doweled JCP, and nondoweled JCP. Figures 35, 36, and 37 present the results of this analysis. No significant correlation between PCC thickness and LTE level was observed for any pavement type.
y = 0.0148x + 85.782
R2 = 0.0178
0
10
20
30
40
50
60
70
80
90
100
0 50 100 150 200 250 300 350Hpcc (mm)
LT
E (%
)
Figure 35. PCC thickness versus LTE in CRCP sections.
46
1 mm = .039 inch

y = 0.0115x + 68.761 R2 = 0.0005
0
10
20
30
40
50
60
70
80
90
100
0 50 100 150 200 250 300 350 400Hpcc (mm)
LT
E (%
)
1 mm = .039 inch
Figure 36. PCC thickness versus LTE in JCP doweled sections.
y = -0.0363x + 61.791
R2 = 0.0022
0
10
20
30
40
50
60
70
80
90
100
0 50 100 150 200 250 300 350 400Hpcc (mm)
LT
E (%
)
1 mm = .039 inch
Figure 37. PCC thickness versus LTE in JCP nondoweled sections.
47

Effect of PCC Strength on LTE The effect of PCC compressive strength on LTE of cracks and joints was analyzed in this study. The analysis was performed separately for CRCP, doweled JCP, and nondoweled JCP, using only the minimum LTE values from all FWD visits and test types. Figures 38, 39, and 40 present the results. No significant correlation was found between PCC strength and LTE level for any pavement type. For CRCP, a slight decrease in LTE level was observed with strength increase. This may be explained by the higher level of shrinkage usually associated with high-strength PCC mixes. A higher level of shrinkage may increase crack opening and reduce LTE. It should be noted, however, that the trend is not significant enough to draw any definitive conclusions.
0
10
20
30
40
50
60
70
80
90
100
0 1000 2000 3000 4000 5000 6000 7000 8000Compressive Strength (psi)
L
TE
(%)
1 psi = 6.895 kPa
Figure 38. PCC compressive strength versus LTE in CRCP sections.
48
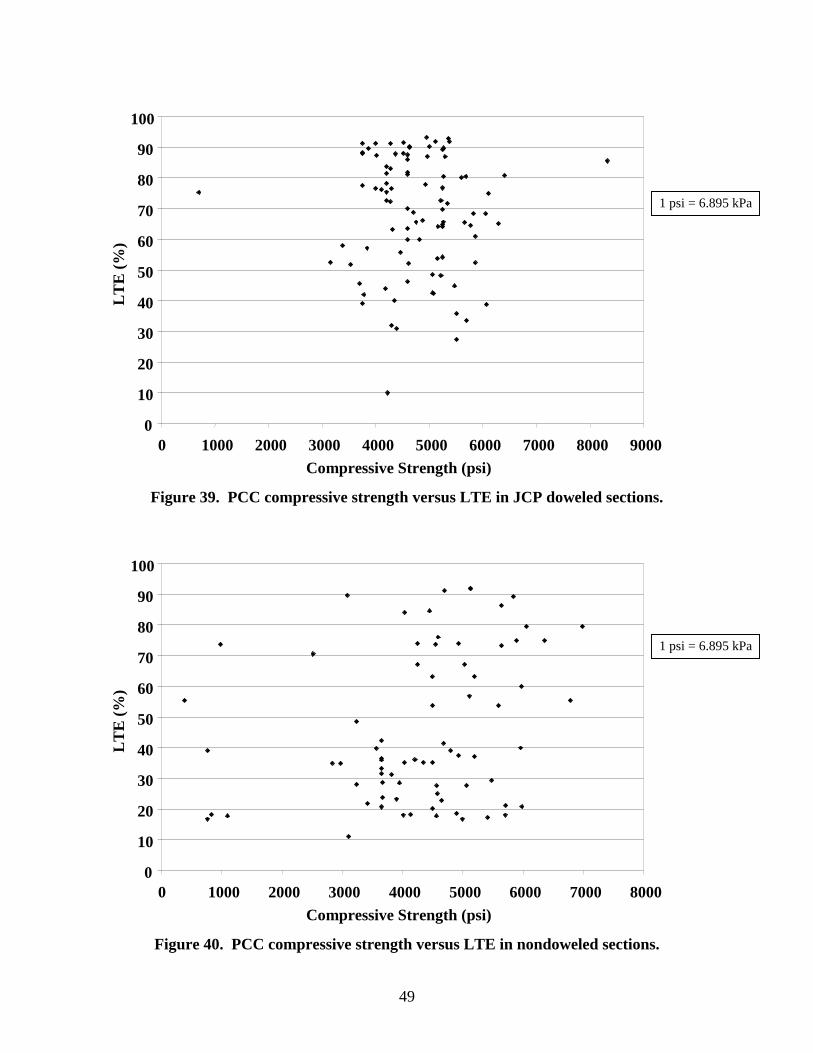
0
10
20
30
40
50
60
70
80
90
100
0 1000 2000 3000 4000 5000 6000 7000 8000 9000Compressive Strength (psi)
LT
E (%
)
1 psi = 6.895 kPa
Figure 39. PCC compressive strength versus LTE in JCP doweled sections.
0
10
20
30
40
50
60
70
80
90
100
0 1000 2000 3000 4000 5000 6000 7000 8000Compressive Strength (psi)
LT
E (%
)
1 psi = 6.895 kPa
Figure 40. PCC compressive strength versus LTE in nondoweled sections.
49

Effect of Design Steel Content on LTE The effect of the longitudinal reinforcement on LTE of cracks in CRCP sections was investigated in this study, using only the minimum LTE values from all FWD visits and test types. Figure 41 presents the results. No significant correlation between PCC thickness and LTE level was observed for any pavement type.
0
10
20
30
40
50
60
70
80
90
100
0.5 0.55 0.6 0.65 0.7 0.75 0.8
Longitudinal Steel (%)
LT
E (%
)
Figure 41. Steel content versus LTE in CRCP sections.
Effect of Joint and Crack Spacing on LTE The effects of contraction joint spacing on lowest mean LTE of JCP joints and cracks in CRCP sections were investigated in this study. Figures 42 and 43 present plots of LTE of JCP sections versus mean joint spacing, and LTE of CRCP sections versus mean crack spacing, respectively. No significant correlation between LTE and joint/crack spacing was observed in either case.
50

0
10
20
30
40
50
60
70
80
90
100
0 10 20 30 40 50 60 70Layer Spacing (ft)
LT
E (%
)
Figure 42. Mean joint spacing versus LTE in nondoweled JCP sections.
0
10
20
30
40
50
60
70
80
90
100
110
0 0.5 1 1.5 2 2.5 3Observed Average Crack Spacing (m)
LT
E (%
)
Figure 43. Mean crack spacing versus LTE in CRCP sections.
51
1 m = 3.28 ft
1 ft = .305 m

Effect of Joint Orientation on LTE Although the practice of skewing joints has been common for many years, there exists little evidence of its benefits. The effects of joint skewness on LTE were investigated in this study. As can be observed from figure 44, no significant correlation between LTE and joint skewness was found.
y = 0.0612x + 49.213 R2 = 5E-06
0
10
20
30
40
50
60
70
80
90
100
0 1 2 3 4 5 6Joint Skewness (ft/lane)
LT
E (%
)
1 ft = .305 m
Figure 44. Joint skewness versus JCP LTE.
Effect of Climatic Factors on LTE The effects of four climatic parameters (annual precipitation, number of annual freezing-thawing cycles, annual freezing index, and mean annual temperature) on LTE were also analyzed in this study. The analysis was conducted separately for CRCP, doweled JCP, and nondoweled JCP. Annual precipitation showed no appreciable effect on LTE. Figure 45 shows a slight decrease in LTE as precipitation increases. This effect is even less pronounced for nondoweled JCP and CRCP sections. Analysis of the effects of temperature factors show that sections in a cold climate (Freezing Index of greater that 800 oC-day) exhibited higher LTE than sections located in a warmer climate, as can be observed from figure 46. No appreciable effect of climatic variables on LTE of nondoweled JCP and CRCP sections was found, as can be observed from figures 47 and 48.
52

y = -0.0122x + 82.702
R2 = 0.0578 0
10
20
30
40
50
60
70
80
90
100
0 200 400 600 800 1000 1200 1400 1600 1800Mean Annual Precipitation (mm)
LT
E (%
)
1 mm = .039 inch
Figure 45. Annual precipitation versus LTE of doweled JCP.
y = 0.0178x + 65.084
R2 = 0.1342
0
10
20
30
40
50
60
70
80
90
100
0 200 400 600 800 1000 1200 1400 1600Freezing Index (°C-days)
LT
E (%
)
°F-days = 1.8 °C-days
Figure 46. Freezing index versus LTE of doweled JCP.
53

y = -0.0059x + 53.262 R2 = 0.0001
0
10
20
30
40
50
60
70
80
90
100
0 50 100 150 200 250Average Number of Freeze-Thaw Cycles
L
TE
(%)
Figure 47. Annual number of freeze-thaw cycles versus LTE of nondoweled JCP.
y = -0.27x + 91.773 R2 = 0.0447
0
10
20
30
40
50
60
70
80
90
100
0 5 10 15 20 25Mean Annual Temperature (°C)
LT
E (%
)
F = 1.8C + 32
Figure 48. Mean annual temperature versus LTE of CRCP.
54

Effect of Pavement Age on LTE It is expected that the LTE of joints and cracks deteriorate over time. However, the rate of deterioration depends on many parameters, such as climatic conditions, design features, traffic loading, and PCC material properties. Figures 49, 50, and 51 show LTEs of nondoweled JCP, doweled JCP, and CRCP, respectively, versus time for approach slab testing. No strong trends were observed. For example, many old JCP and CRCP exhibited a high level of LTE after more than 20 years of service. In addition, several recently constructed JCP, both doweled and nondoweled, show a low level of LTE after only a few years of construction. This is a phenomenon that should be investigated further. Analysis of LTEs from leave slab tests also did not identify any definitive trend.
0
10
20
30
40
50
60
70
80
90
100
0 5 10 15 20 25 30 35 40 45 50Age (Year)
L
TE
(%)
Figure 49. Age versus LTE of nondoweled sections, approach test (J4).
55

0
10
20
30
40
50
60
70
80
90
100
0 5 10 15 20 25 30 35 40 45Age (Year)
LT
E (%
)
Figure 50. Age versus LTE of doweled sections, approach test (J4).
0
10
20
30
40
50
60
70
80
90
100
0 5 10 15 20 25 30 35 40 45Age (Year)
LT
E (%
)
Figure 51. Age versus LTE of CRCP sections, approach test (C4).
56
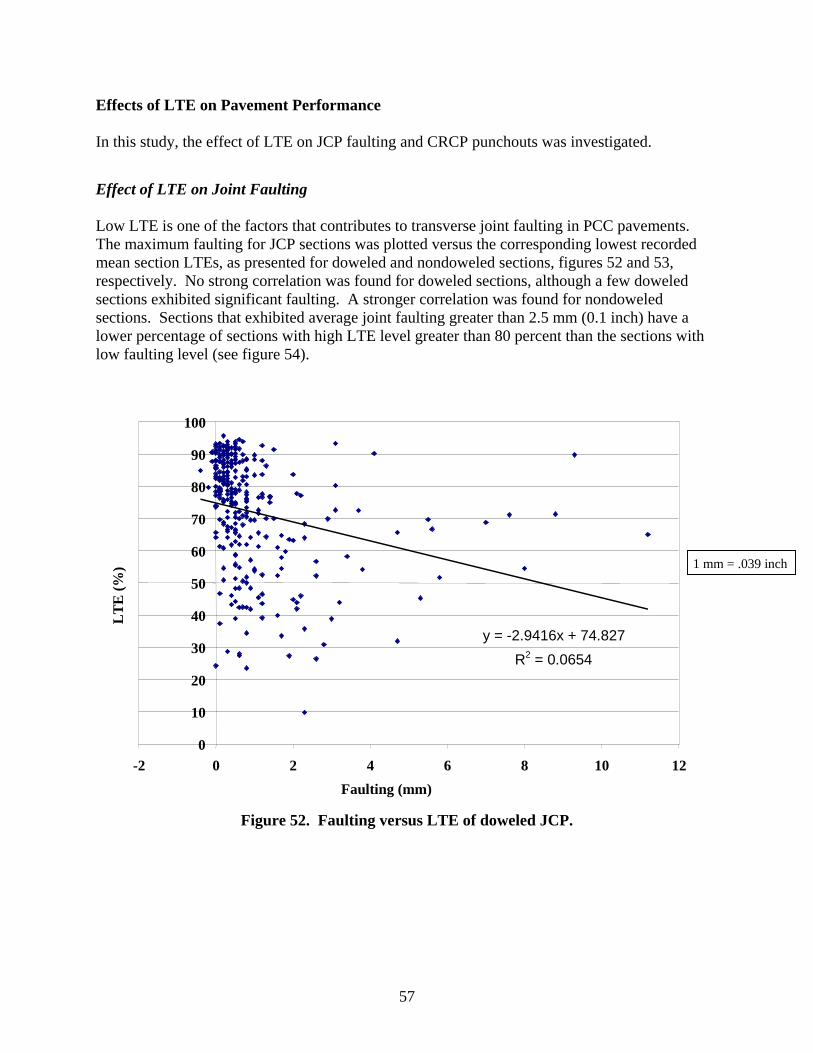
Effects of LTE on Pavement Performance In this study, the effect of LTE on JCP faulting and CRCP punchouts was investigated.
Effect of LTE on Joint Faulting Low LTE is one of the factors that contributes to transverse joint faulting in PCC pavements. The maximum faulting for JCP sections was plotted versus the corresponding lowest recorded mean section LTEs, as presented for doweled and nondoweled sections, figures 52 and 53, respectively. No strong correlation was found for doweled sections, although a few doweled sections exhibited significant faulting. A stronger correlation was found for nondoweled sections. Sections that exhibited average joint faulting greater than 2.5 mm (0.1 inch) have a lower percentage of sections with high LTE level greater than 80 percent than the sections with low faulting level (see figure 54).
y = -2.9416x + 74.827 R2 = 0.0654
0
10
20
30
40
50
60
70
80
90
100
-2 0 2 4 6 8 10 12Faulting (mm)
LT
E (%
)
Figure 52. Faulting versus LTE of doweled JCP.
57
1 mm = .039 inch

y = -3.9855x + 59.886 R2 = 0.0915
0
10
20
30
40
50
60
70
80
90
100
0 1 2 3 4 5 6 7 8 9 10Faulting (mm)
LT
E (%
)
1 mm = .039 inch
Figure 53. Faulting versus LTE of nondoweled JCP.
37
26
18
8
21
5
0
5
10
15
20
25
30
35
40
<2.5 mm >2.5 mmMaximum Edge Faulting
Num
ber
of S
ectio
ns
LTE < 50% 50% < LTE < 80%LTE > 80%
1 mm = .039 inch
Figure 54. Effect of LTE on faulting of nondoweled pavements.
58
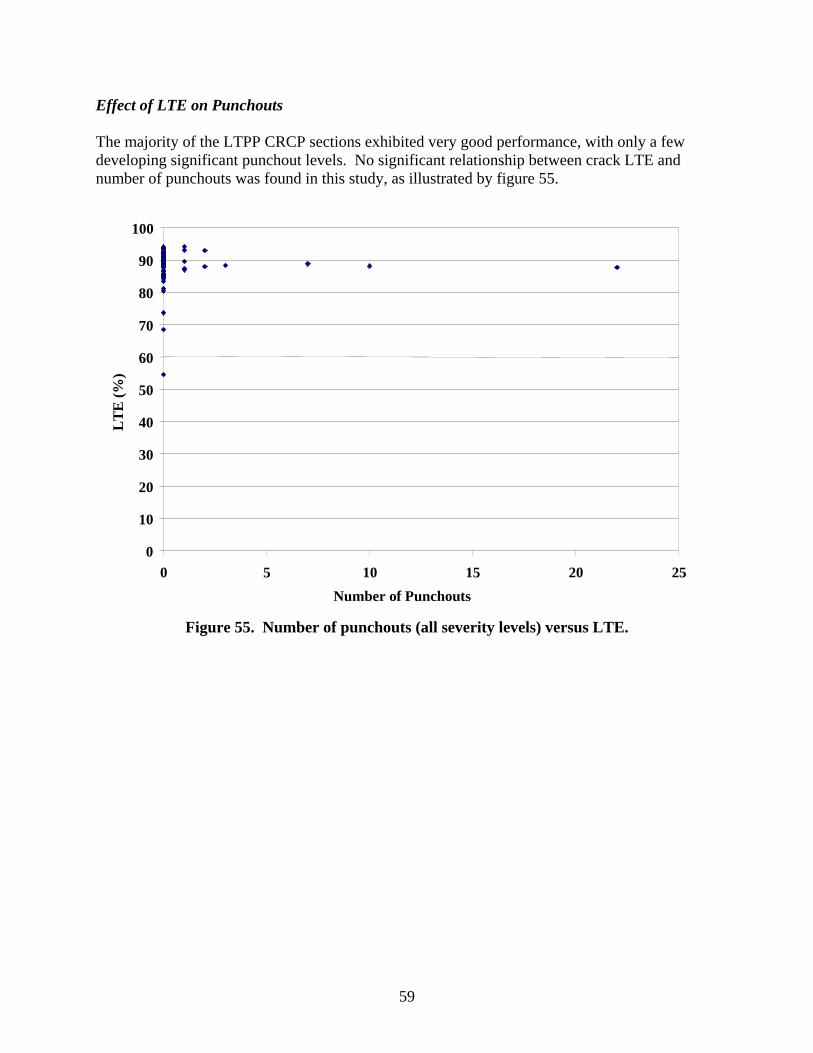
Effect of LTE on Punchouts The majority of the LTPP CRCP sections exhibited very good performance, with only a few developing significant punchout levels. No significant relationship between crack LTE and number of punchouts was found in this study, as illustrated by figure 55.
0
10
20
30
40
50
60
70
80
90
100
0 5 10 15 20 25Number of Punchouts
LT
E (%
)
Figure 55. Number of punchouts (all severity levels) versus LTE.
59

60
CHAPTER 5. LTE ANALYSIS FOR SMP SECTIONS The FWD data collected for the SMP LTPP sections allow for analysis of the effect of season and time of day on joint LTE. Analysis of LTE was performed for 19 SMP sections, with a total of 1,945 FWD passes. The number of passes is much higher than the number of sections because the sections could be tested several times a day and several times per year. The deflection data were downloaded during the summer of 2001 from the LTPP database table MON_DEFL_DROP_DATA. Information about sensor locations was obtained from database tables MON_DEFL_LOC_INFO and MON_DEFL_DEV_SENSORS (June 2001 release). The procedure described in chapter 3 was used to calculate LTE from the FWD deflection basins and determine representative LTE indexes for individual joints and for each FWD pass. Effects of Time of Testing on Joint LTE The collected FWD data allow for analysis of the effect of time of day on measured joint LTE. Typically, several passes are conducted on SMP sections to study the variations that may occur over a single day. Almost all sections showed dependence of calculated LTE on the time of the testing. Figures 56 and 57 show the LTEs from approach (J4) and leave (J5) tests, respectively, for nondoweled section 163023 (Idaho) obtained from the three FWD passes conducted in September 1992 at 10:45 a.m., 1:10 p.m., and 3:15 p.m. The results show great variation over the course of the day. The lowest LTE values came from the first FWD pass for that day, when the calculated LTEs for several joints are approximately three times lower than from the 3:15 p.m. testing. Figures 58 and 59 show daily variation in LTEs for doweled section 040215 (Arizona) in March 1996. The lowest level of LTE for this section was measured at 10 a.m., whereas the highest one was measured after 2 p.m. Similar effects were observed for many sections located in different climatic regions. Figures 60 and 61 present comparisons of mean LTEs for the doweled and nondoweled SMP sections, obtained for the same day from the first and third FWD pass deflection data. Significant differences in mean LTEs from different FWD passes were observed for many doweled and nondoweled sections. Moreover, the nondoweled sections exhibited much higher variability in LTE than the doweled sections for both approach and leave tests. To investigate daily variation in LTE further, coefficients of variation of the mean section LTE for the SMP LTPP sections from different FWD passes made on the same day of testing were computed. Table 12 presents mean and maximum values of these coefficients of variation. The mean coefficient of variation of mean LTE was found to be less than 10 percent for all doweled SMP sections for both approach and leave tests. However, of the 12 SMP doweled sections for which multiple FWD passes were available, a coefficient of variation in mean LTE greater than 10 percent was observed on at least 1 day of testing for 4 sections for test approach (J4) and for 5 sections for leave (J5) test.
61
0
20
40
60
80
100
130 140 150 160 170Station (m)
L
TE
(%)
11:01 a.m., Ta=81, Ts=73 1:09 p.m., Ta=86, Ts=90 3:02 p.m., Ta=86, Ts=97
Figure 56. Daily variation in calculated approach LTE, section 163023 (Septembe
0
20
40
60
80
100
130 140 150 160Station (m)
L
TE
(%)
10:44 a.m., Ta=75, Ts=63 1:12 p.m., Ta=77, Ts=75 3:14 p.m., Ta=82, Ts=8
Figure 57. Daily variation in calculated leave LTE, section 163023 (October 1
62
1 m = 3.28 ft
r 1992).
17
1
992
1 m = 3.28 ft
0
).

0
20
40
60
80
100
130 135 140 145 150 155 160Station (m)
L
TE
(%)
10:05 a.m., Ta=72, Ts=77 11:36 a.m., Ta=77, Ts=92 1:03 p.m., Ta=86, Ts=97 2:37 p.m., Ta=88, Ts=102
1 m = 3.28 ft
Figure 58. Daily variation in calculated approach LTE, section 4_0215 (March 1996).
0
20
40
60
80
100
130 135 140 145 150 155 160 165 170Station (m)
L
TE
(%)
10:07 a.m., Ta=72, Ts=77 11:39 a.m., Ta=79, Ts=90 1:06 p.m., Ta=84, Ts=97 2:39 p.m., Ta=86, Ts=100
1 m = 3.28 ft
Figure 59. Daily variation in calculated leave LTE, section 4_0215 (March 1996).
63

10
20
30
40
50
60
70
80
90
100
110
10 20 30 40 50 60 70 80 90 100 110Pass 1 LTE (%)
P
ass 3
LT
E (%
) Approach Tests Leave Tests Pass 1 LTE = Pass 3 LTE
Figure 60. Comparison of mean LTEs for doweled SMP sections from different FWD
passes on the same day of testing.
10
20
30
40
50
60
70
80
90
100
110
10 20 30 40 50 60 70 80 90 100 110Pass 1 LTE (%)
P
ass 3
LT
E (%
)
Approach Tests Leave Tests Pass 1 LTE = Pass 3 LTE
Figure 61. Comparison of mean LTEs for nondoweled SMP sections from different FWD
passes on the same day of testing.
64

Table 12. Coefficients of variation of the section mean LTEs from the same day of testing.
Approach (J4) Leave (J5) Section State Type Joint Mean Max Mean Max
040215 Arizona doweled 0.088 0.181 0.070 0.192 133019 Georgia doweled 0.088 0.267 0.041 0.110 183002 Indiana doweled 0.084 0.147 0.080 0.156 274040 Minnesota doweled 0.062 0.104 0.063 0.102 320204 Nevada doweled 0.025 0.047 0.019 0.034 364018 New York doweled 0.031 0.058 0.043 0.079 370201 North Carolina doweled 0.041 0.076 0.103 0.103 390204 Ohio doweled 0.010 0.013 0.010 0.018 421606 Pennsylvania doweled 0.025 0.060 0.030 0.059 484142 Texas doweled 0.009 0.019 0.011 0.032 484143 Texas doweled 0.022 0.060 0.027 0.070 893015 Quebec doweled 0.007 0.012 0.007 0.015 063042 California nondoweled 0.063 0.142 0.086 0.173 163023 Idaho nondoweled 0.250 0.470 0.147 0.412 204054 Kansas nondoweled 0.057 0.152 0.068 0.160 313018 Nebraska nondoweled 0.243 0.478 0.307 0.447 493011 Utah nondoweled 0.259 0.538 0.136 0.455 533813 Washington nondoweled 0.031 0.045 0.022 0.032 833802 Manitoba nondoweled 0.213 0.213 0.102 0.102
Much higher variability was observed for nondoweled sections. Only three of seven nondoweled SMP sections showed a mean coefficient of variation less than 10 percent. The remaining four sections exhibited a mean coefficient of variation greater than 20 percent for mean LTEs calculated from approach tests. Three sections (163023, 313018, and 493011) exhibited a coefficient of variation in mean LTE greater than 40 percent on at least one day of testing for both approach and leave tests. Only one section, 533813, did not exhibit significant daily variability in LTE. Significant daily variability in subgrade k-values backcalculated from FWD center slab deflections (test J1) for this section was reported in another study by Khazanovich et al. (2001). It is reasonable to conclude, therefore, that the time of day of FWD testing may significantly affect joint LTE. This effect is most likely due to temperature differences and the resulting joint movement and slab curling. Therefore, accounting for the effect of PCC slab curling is very important for reliable interpretation of FWD deflection data. The effects of temperature conditions and joint opening on measured LTE will be discussed further in chapter 7. Nevertheless, the results presented above suggest that it is important to conduct FWD basin testing early in the morning to measure the lowest level of LTE, or during cold times of the year, when temperature remains constant all day.
65

Effects of Season of Testing on Joint LTE As expected, the season in which testing was performed was found to affect measured joint LTE. This effect is highly confounded, however, with the time of testing. To reduce the latter effect, only first FWD passes for each day of testing were considered in the analysis of seasonal variation in joint LTE. For each SMP section, mean LTEs obtained from different days of testing for the first FWD pass on each day were analyzed. Mean, maximum, and minimum values of those LTEs, as well as corresponding standard deviations and coefficients of variation, were determined. The results of that analysis for doweled sections for FWD for approach and leave test are summarized in tables 13 and 14, respectively. Tables 15 and 16 present corresponding results for nondoweled sections. Significant seasonal variability in LTE, as well as between the LTEs from approach and leave tests, was observed for both doweled and nondoweled pavements. Analysis of tables 13 and 14 shows that every doweled SMP sections exhibited mean LTE of greater than 90 percent for at least one day of testing. At the same time, six sections exhibited an LTE lower than 60 percent (and four lower than 50 percent) from approach tests on at least one day of testing. Although slightly lower variability in LTE was observed for leave tests of doweled sections, five sections exhibited lower than 60 percent LTE on at least one day of testing.
Table 13. Seasonal variation of approach LTE (test J4) for doweled SMP sections.
Section Mean LTE, percent
Minimum LTE, percent
Maximum LTE, percent
Standard Deviation,
percent
Coefficient of Variation
40215 75.2 45.4 96.2 13.6 0.18 133019 80.3 45.5 95.8 15.2 0.19 183002 81.4 64.3 93.5 10.5 0.13 274040 76.8 57.7 94.5 9.9 0.13 320204 88.4 80.4 98.6 5.9 0.07 364018 80.6 59.9 91.5 6.5 0.08 370201 72.1 41.8 96.8 19.3 0.27 390204 93.3 87.6 98.2 2.7 0.03 421606 73.0 39.1 94.0 21.5 0.29 484142 90.3 83.1 97.0 2.8 0.03 484143 89.1 79.0 96.2 5.2 0.06 893015 90.5 76.6 102.7 4.6 0.05
66
Table 14. Seasonal variation of leave LTE (test J5) for doweled SMP sections.
Section Mean LTE,
percent Minimum
LTE, percentMaximum LTE,
percent Standard Deviation,
percent
Coefficient of Variation
40215 75.1 54.4 91.2 12.0 0.16 133019 84.6 56.1 94.8 9.6 0.11 183002 82.6 64.6 93.4 10.6 0.13 274040 74.5 52.4 92.1 10.9 0.15 320204 88.8 84.0 96.0 4.2 0.05 364018 78.4 62.5 92.0 6.7 0.09 370201 79.3 58.4 96.6 13.8 0.17 390204 93.3 88.0 96.8 3.0 0.03 421606 78.7 52.2 92.0 13.6 0.17 484142 90.8 84.8 95.4 2.6 0.03 484143 88.9 78.6 98.1 6.5 0.07 893015 90.4 81.9 95.4 3.6 0.04
Table 15. Seasonal variation of approach LTE (test J4) for nondoweled SMP sections.
Section Mean LTE, percent
Minimum LTE, percent
Maximum LTE, percent
Standard Deviation,
percent
Coefficient of Variation
63042 64.4 27.6 96.6 22.5 0.35 163023 51.1 24.9 91.8 20.8 0.41 204054 74.3 53.7 90.1 14.1 0.19 313018 38.1 23.8 85.8 15.8 0.41 493011 41.5 16.7 92.7 23.0 0.56 533813 72.7 37.6 95.6 18.0 0.25 833802 58.7 18.6 96.9 26.9 0.46
Table 16. Seasonal variation of leave LTE (test J5) for nondoweled SMP sections.
Section Mean LTE,
percent Minimum
LTE, percentMaximum
LTE, percentStandard Deviation,
percent
Coefficient of Variation
63042 64.4 27.6 96.6 22.5 0.35 163023 51.1 24.9 91.8 20.8 0.41 204054 74.3 53.7 90.1 14.1 0.19 313018 38.1 23.8 85.8 15.8 0.41 493011 41.5 16.7 92.7 23.0 0.56 533813 72.7 37.6 95.6 18.0 0.25 833802 58.7 18.6 96.9 26.9 0.46
67

As expected, seasonal variability is much higher for nondoweled sections. Analysis of tables 15 and 16 shows that every nondoweled SMP section exhibited mean LTE greater than 85 percent for at least one day of testing. In addition, of the 7 nondoweled sections, 5 and 4 exhibited lower than 30 percent LTE from approach and leave tests, respectively, on at least 1 day of testing. Therefore, the same section may be ranked as having very good or very poor LTE, depending on the day the testing was performed. Figures 62 through 68 show mean LTEs and mean PCC surface temperature (for the duration of a FWD pass) obtained from different days of testing for the first FWD pass on each day. Analysis of these figures shows that, as a general trend, LTE increases when the PCC surface temperature increases. However, when PCC temperature drops below the freezing temperature of water (0 ºC [32 ºF]), LTE may increase dramatically (see figure 63). It may be concluded that joint LTE depends significantly on the season and time of testing. Therefore, the results of LTE measurements taken in hot summer weather are not useful. Also, the poor correlations between design features and site conditions presented in chapter 4 may be explained by the fact that GPS sections were tested under a wide variety of climatic conditions.
0
10
20
30
40
50
60
70
80
90
100
1995 1996 1997 Date (Years)
LT
E (%
)
0
5
10
15
20
25
30
35
40
45
50
Approach LTE (J4) Leave LTE (J5) Surface Temperature
Figure 62. Seasonal variation in LTE and PCC surface temperature, section 630
68
F = 1.8C + 32
Ts (
°C)
42.

0
10
20
30
40
50
60
70
80
90
100
1991 1992 1993 1994 Date (Years)
LT
E (%
)
-10
-5
0
5
10
15
20
25
30
35
40
Ts (
°C)
Approach LTE (J4) Leave LTE (J5) Surface Temperature
F = 1.8C + 32
Figure 63. Seasonal variation in LTE and PCC surface temperature, section 163023.
0
10
20
30
40
50
60
70
80
90
100
1993 1994 1995 1996 Date (Years)
LT
E (%
)
0
5
10
15
20
25
30
35
40
45
50
Ts (
°C)
Approach LTE (J4) Leave LTE (J5) Surface Temperature
F = 1.8C + 32
Figure 64. Seasonal variation in LTE and PCC surface temperature, section 204054.
69

0
10
20
30
40
50
60
70
80
90
100
1998 1999 2000 2001 Date (Years)
LT
E (%
)
OOO
-10
-5
0
5
10
15
20
25
30
35
40
Approach LTE (J4) Leave LTE (J5) Surface Temperature
Figure 65. Seasonal variation in LTE and PCC surface temperature, section 313
0
10
20
30
40
50
60
70
80
90
100
1993 1994 1995 1996 Date (Years)
LT
E (%
)
-10
-5
0
5
10
15
20
25
30
35
40
Approach LTE (J4) Leave LTE (J5) Surface Temperature
Figure 66. Seasonal variation in LTE and PCC surface temperature, section 493
70
F = 1.8C + 32
Ts
(°C
)
018.
F = 1.8C + 32
Ts (°C
)
011.

0
10
20
30
40
50
60
70
80
90
100
1995 1996 1997 Date (Years)
LT
E (%
)
0
5
10
15
20
25
30
35
40
45
50
Ts (
°C)
Approach LTE (J4) Leave LTE (J5) Surface Temperature
F = 1.8C + 32
Figure 67. Seasonal variation in LTE and PCC surface temperature, section 533813.
0
10
20
30
40
50
60
70
80
90
100
1993 1994 1995 Date (Years)
L
TE
(%)
OOOO
-15
-10
-5
0
5
10
15
20
25
30
35
Ts (
°C)
Approach LTE (J4) Leave LTE (J5) Surface Temperature
F = 1.8C + 32
Figure 68. Seasonal variation in LTE and PCC surface temperature, section 833802.
71

72

CHAPTER 6. JOINT STIFFNESS BACKCALCULATION AND ANALYSIS Mechanistic modeling of joints and cracks in PCC pavements using a finite element program requires input of certain parameters. The most commonly used finite element programs for rigid pavement analysis usually require input of joint stiffness. This chapter presents a procedure for backcalculation of joint stiffness for the LTPP rigid sections and assessment of the results. Joint Stiffness Backcalculation Procedure To backcalculate joint/crack stiffness, the following information must be available:
• Joint/crack LTE. • Coefficient of subgrade reaction, k. • PCC slab radius of relative stiffness.
To calculate LTEs for cracks and joints, coefficients of subgrade reaction and radii of relative stiffness were downloaded during the summer of 2001 from the LTPP database table MON_DEFL_RGD_BAKCAL_SECT (June 2001 release). This table provides representative k-values and radii of relative stiffness for rigid LTPP sections for different FWD passes. Representative joint stiffnesses were calculated using the following procedure:
Step 1. Select LTE value For each FWD pass, compare mean LTEs from leave and approach tests (tests J4 and J5 for JCP and C4 and C5 for CRCP) and select the lowest value.
Step 2. Calculate nondimensional joint stiffness Using the LTE value from step 1, calculate nondimensional joint stiffness using the following equation:
17786.1
*
012.0
01.01 −
⎟⎟⎟⎟
⎠
⎞
⎜⎜⎜⎜
⎝
⎛ −= LTEAGG (22)
where:
- AGG* = nondimensional joint stiffness. This equation is obtained by inverting Crovetti’s equation (presented in equation 8). Analysis of the ISLAB2000 deflection data presented in figure 69 shows that these equations adequately predict nondimensional joint stiffness for a wide range of values.
73

0.01
0.1
1
10
100
1000
0.01 0.1 1 10 100 1000
Predicted nondimensional joint stiffness
Act
ual n
ondi
men
sion
al jo
int s
tiffn
ess
Figure 69. Predicted versus actual ISLAB2000 nondimensional joint stiffness.
Step 3. Calculate joint stiffness Using the following equation, calculate joint stiffness:
lkAGGAGG *= (23)
where:
- k = the coefficient of subgrade reaction - = radius of relative stiffness l- AGG = joint stiffness
This procedure cannot account for several effects discussed in chapters 4 and 5, such as possible load level dependency and different behavior under loading on the leave and approach side of the joint. However, an advantage of this procedure is that the resulting joint stiffness can be used for a forward analysis using a popular finite element program for rigid pavement analysis, such as ILLI-SLAB and J-SLAB.
74
Joint Stiffness Data Assessment Joint stiffnesses were backcalculated for those LTPP sections and FWD visits for which the LTPP database table MON_DEFL_RGD_BAKCAL_SECT contained k-values and radii of relative stiffness. This resulted in representative crack stiffness for 134 visits of 72 CRCP sections and 910 visits of 250 JCP sections. Figure 70 presents a frequency distribution of crack stiffness for CRCP sections. For more than two-thirds of the cases, the backcalculated CRCP crack stiffnesses ranged between 800 and 1600 MPa. The mean crack stiffness value for all cases was 1240 MPa. Frequency distributions of representative joint stiffness of joints of doweled and nondoweled JCP pavements are presented in figure 71. Comparing these distributions show that nondoweled joints usually have much lower stiffness than doweled joints. More than half of the backcalculated stiffness for nondoweled joints were less than 200 MPa, and the average value from all cases was 470 MPa. In addition, more than 60 percent of doweled joints had stiffnesses greater than 600 MPa, with the average value equal to 730 MPa. As stated above, LTE of cracks and joints varies with time, as do joint and crack stiffnesses. Figure 72 presents a comparison of joint stiffnesses backcalculated from the FWD deflections obtained on the same day of testing, but from different FWD passes. Significant variability exists for some joints, especially for those that exhibited lower stiffness at the time of the first FWD pass. Recommendation for Joint Stiffness Selection Currently, very little guidance is available for selecting joint and crack stiffness parameters for analyses of rigid pavement using finite element programs like ILLI-SLAB or JSLAB. This study’s findings have resulted in recommendations for the selection of joint stiffness values if they cannot be obtained from other sources. These recommendations are summarized in table 17. However, more research is needed to validate these recommendations.
Table 17. Recommended joint/crack stiffnesses for different types of pavements.
Pavement Type Recommended Ranges
(MPa) Nondoweled JCP 100–500 Doweled JCP 400–1000 CRCP 800–1400
75

0
5
10
15
20
25
30
200 400 600 800 1000 1200 1400 1600 1800 2000 3000Joint Stiffness (MPa)
Perc
enta
ge o
f Pas
ses
Figure 70. Frequency distribution of representative CRCP crack stiffnesses.
0
10
20
30
40
50
60
200 400 600 800 1000 1200 1400 1600 1800 2000 3000 Joint Stiffness (MPa)
Perc
enta
ge o
f Pas
ses
Nondoweled Doweled
Figure 71. Frequency distributions of representative joint stiffnesses for joints of doweled
and nondoweled JCP.
76

0
500
1000
1500
2000
2500
3000
3500
0 500 1000 1500 2000 2500 3000 3500Joint Stiffness Pass 1 (MPa)
Join
t Stif
fnes
s Pas
s 2( M
Pa)
Figure 72. Comparison of backcalculated joint stiffnesses from two FWD passes on the
same day of testing.
77

78

CHAPTER 7. JOINT MOVEMENTS: CALCULATION METHODOLOGY, DATA ASSESSMENT, AND TREND ANALYSIS
As part of the LTPP program, data of rigid pavement joint movement are regularly obtained with gage measurements on all SMP test sections. This testing program is being conducted periodically to study the daily and seasonal joint movements. These data are intended to provide valuable pavement structural characteristics that are needed to achieve the goals of the LTPP program. This chapter presents the procedure used in determination of representative joint movements from the measurements of distances between gages collected for the LTPP SMP sections. This is followed by an assessment of joint movement data and a trend analysis. Joint Movement Measurements Gage distance measurements are performed at the joints of the LTPP SMP sections for which FWD deflection data are also collected. The gage distance data were downloaded during the summer of 2001 from LTPP database table MON_JOINT_GAGE_DATA. To determine the temperature distribution throughout the PCC layer at the time of gage distance measurements, PCC temperature measurements were downloaded from LTPP database table MON_DEFL_TEMP_VALUES. For rigid pavements in the SMP LTPP program, three pairs of gages are installed at each joint where joint movements are measured:
• At the outer PCC slab edge. • At the midlane (center of lane). • At the inner slab edge.
Any change in distance between gages indicates a change in joint opening. PCC slab temperature gradients are measured during the time of the deflection and joint movement testing with an interval of 30 minutes. PCC temperatures are measured at 25 mm (1 inch) from the top of the PCC surface, at the middepth of the PCC layer, and at 25 mm (1 inch) from the bottom surface of the PCC layer. An attempt was made to address temperature conditions at the time of gage distance measurements. Since the time of temperature gradient measurements does not correspond exactly to the time of temperature measurements, PCC temperatures at the time of measurement were obtained by interpolation between the closest measurements. Assessment of Gage Measurement Data A total of 4,279 records were extracted from the LTPP database for 18 JCP sections. The extracted data were examined to ensure their consistency and reasonableness. Some records were excluded from the analysis for the following reasons:
• Incorrect testing time or location. • High variability in measurements for different gages in the joint.
79
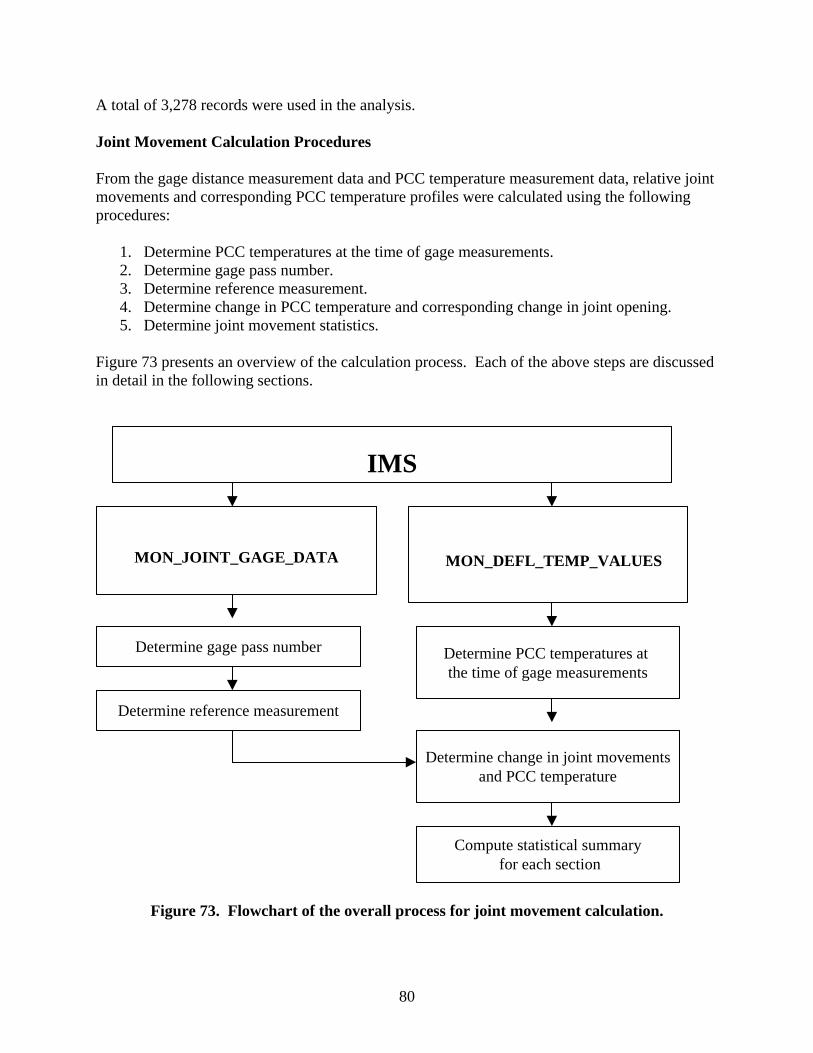
A total of 3,278 records were used in the analysis. Joint Movement Calculation Procedures From the gage distance measurement data and PCC temperature measurement data, relative joint movements and corresponding PCC temperature profiles were calculated using the following procedures:
1. Determine PCC temperatures at the time of gage measurements. 2. Determine gage pass number. 3. Determine reference measurement. 4. Determine change in PCC temperature and corresponding change in joint opening. 5. Determine joint movement statistics.
Figure 73 presents an overview of the calculation process. Each of the above steps are discussed in detail in the following sections.
IMS
MON_DEFL_TEMP_VALUES MON_JOINT_GAGE_DATA
Determine PCC temperatures at the time of gage measurements
Compute statistical summary for each section
Determine gage pass number
Determine reference measurement
Determine change in joint movementsand PCC temperature
Figure 73. Flowchart of the overall process for joint movement calculation.
80

Step 1. Determine PCC temperatures at the time of gage measurements To evaluate the effects of change in PCC temperature on joint opening, it is important to estimate PCC temperature at the time gage distance is measured. To this end, PCC temperature measurements performed at the same section within 30 minutes before and after a gage distance measurement were located from LTPP database table MON_DEFL_TEMP_VALUES. If two or more temperature records measured before gage measurements were found, the one that was measured at the closest location to the gage measurement at the closest time was selected. If two or more temperature record measured after gage measurements were found, the one that was measured at the closest location to the gage measurement at the closest time was selected. If a total of two records were selected (one before and one after the measurements), then the PCC temperature at the time of gage measurement, TG, was determined using the following equation:
ba
gaabgbG tt
ttTttTT
−
−+−=
)()( (24)
where:
- tg = the time of gage measurement. - tb = the nearest time of PCC temperature measurement before the time of gage
measurement. - ta = the nearest time of PCC temperature measurement after the time of gage
measurement. - Tb = PCC temperature at time tb. - Ta = PCC temperature at time ta.
If only one record with temperature measurement either before or after the gage measurements was found, then that PCC temperature was assigned.
Step 2. Determine gage pass number To compute statistics for changes in joint opening for the SMP LTPP sections, gage distance measurements were grouped by gage passes. Each gage measurement and joint opening parameter received a gage pass number from 1 to 9. The following procedure was used:
• Sort all extracted gage distance measurements by section, test date, test position, and test time.
• If the measurement is the first measurement of its position for the LTPP section conducted on that day, assign gage pass number equal to 1.
• If the measurement has the same LTPP section ID, test date, and test position as the previous measurement, and the test location is greater than the test location for the previous measurement, assign the same gage pass number as for previous measurement; otherwise, assign the gage pass the next higher number.
81

Step 3. Determine reference measurement By default, for each section, measurements during the first gage pass at the earliest test day are assigned as reference measurements. However, if these measurements are incomplete or exhibit an unrealistically high difference in change in joint opening from different gages at the same joint (indicating either measurement error or significant slab rotation), then another set of measurements should be assigned as a reference by specifying test date and gage pass.
Step 4. Determine change in PCC temperature and corresponding change in joint opening To obtain a change in joint opening, the corresponding reference gage measurement was subtracted from each gage measurement. Also, a change in temperature measurement was compared to the temperature at the time the reference gage measurement was computed. Because only uniform PCC slab extraction/contraction was investigated in this study, pair-wise comparisons of joint movements, obtained from different gages for the same test time, were made. If the difference in movements was greater than the acceptable value 1 mm (0.039 inch), then the record was excluded from joint movement statistics calculation. A threshold of 1 mm (0.039 inch) was selected because it represents a high level of expected change in joint opening during one day. If the measured magnitude of change in joint opening for the same joint and test time but at different joint locations (inner slab edge, midlane, outer slab edge) exceeds this value, then it indicates either a measurement error, or significant slab rotation in addition to extraction/contraction. Investigation of nonuniform joint opening was beyond the scope of this study.
Step 5. Determine joint movement statistics For each gage pass, the mean, minimum, maximum, and standard deviation of joint movements from all gages at all locations were determined, as well as the mean, minimum, maximum, and standard deviation of change in PCC temperature. Daily Variation in Joint Opening The collected gage distance data do not allow for determining absolute joint opening but can be used to study changes in joint opening, including daily changes. Typically, several FWD passes are conducted each day on SMP sections to study the variations that may occur over a single day. For many of those passes, gage distance measurements were performed. As an example, figure 74 presents changes in joint opening for individual joints of section 274040 in May 1997 from three sets of measurements made at 10 a.m., noon, and 2 p.m. The reference gage distance measurements were made on October 18, 1993. Negative values of joint movements indicate that the joints were narrower than at the time of the reference measurement. On May 6, 1997, the majority of the joints were open the most at 10 a.m. After 2 p.m., the majority of the joints were tighter than at 10 a.m. or noon.
82

-5
-4.5
-4
-3.5
-3
-2.5
-2
-1.5
-1
-0.5
0 110 120 130 140 150 160
Station (m)
Join
t Mov
emen
t (m
m)
10:04 a.m. 12:33 p.m. 2:24 p.m.
Figure 74. Relative changes in joint opening for section 274040 on May 6, 199 compared to joint opening in October 1993. To further investigate daily joint movements, changes in joint opening from the first to thsecond gage distance measurement pass were calculated for each section visit. Table 18 paverage, minimum, and maximum changes in joint opening for each section from multiplFigure 75 shows frequency distributions of those changes for nondoweled SMP jointed pconcrete pavement (JPCP) sections, doweled SMP JPCP sections, and doweled SMP joinreinforced concrete pavement (JRCP) sections. Analyses of table 18 and figure 75 show that the majority of all computed changes in joinopening are within reasonable limits (less than 2 mm (0.078 inches)). Many sections exhpositive change in joint opening, although PCC temperature increased from the first to sepass for all but one case considered. For example, the largest increase in joint opening, 1(0.066 inch), was observed for section 370201 on January 23, 1996. Although that day wrelatively cold for North Carolina (PCC temperature was approximately 6 oC [42.8 oF]), ttemperature did increase at the time of second pass by about 2 oC (35.6 oF). No good expfor this observation was found.
83
1 m = 3.28 ft
7,
e resents e visits. lain ted
t ibited a cond .70 mm as he lanation
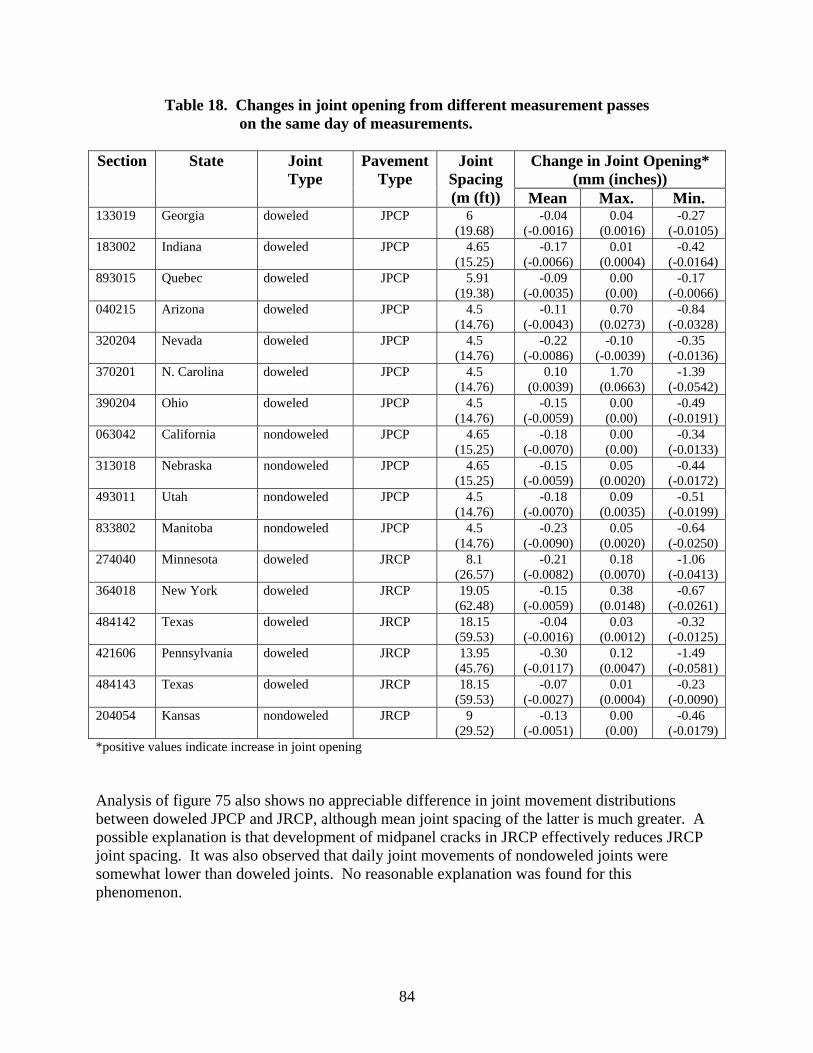
Table 18. Changes in joint opening from different measurement passes on the same day of measurements.
Change in Joint Opening* (mm (inches))
Section State Joint Type
PavementType
Joint Spacing (m (ft)) Mean Max. Min.
133019 Georgia doweled JPCP 6 (19.68)
-0.04 (-0.0016)
0.04 (0.0016)
-0.27 (-0.0105)
183002 Indiana doweled JPCP 4.65 (15.25)
-0.17 (-0.0066)
0.01 (0.0004)
-0.42 (-0.0164)
893015 Quebec doweled JPCP 5.91 (19.38)
-0.09 (-0.0035)
0.00 (0.00)
-0.17 (-0.0066)
040215 Arizona doweled JPCP 4.5 (14.76)
-0.11 (-0.0043)
0.70 (0.0273)
-0.84 (-0.0328)
320204 Nevada doweled JPCP 4.5 (14.76)
-0.22 (-0.0086)
-0.10 (-0.0039)
-0.35 (-0.0136)
370201 N. Carolina doweled JPCP 4.5 (14.76)
0.10 (0.0039)
1.70 (0.0663)
-1.39 (-0.0542)
390204 Ohio doweled JPCP 4.5 (14.76)
-0.15 (-0.0059)
0.00 (0.00)
-0.49 (-0.0191)
063042 California nondoweled JPCP 4.65 (15.25)
-0.18 (-0.0070)
0.00 (0.00)
-0.34 (-0.0133)
313018 Nebraska nondoweled JPCP 4.65 (15.25)
-0.15 (-0.0059)
0.05 (0.0020)
-0.44 (-0.0172)
493011 Utah nondoweled JPCP 4.5 (14.76)
-0.18 (-0.0070)
0.09 (0.0035)
-0.51 (-0.0199)
833802 Manitoba nondoweled JPCP 4.5 (14.76)
-0.23 (-0.0090)
0.05 (0.0020)
-0.64 (-0.0250)
274040 Minnesota doweled JRCP 8.1 (26.57)
-0.21 (-0.0082)
0.18 (0.0070)
-1.06 (-0.0413)
364018 New York doweled JRCP 19.05 (62.48)
-0.15 (-0.0059)
0.38 (0.0148)
-0.67 (-0.0261)
484142 Texas doweled JRCP 18.15 (59.53)
-0.04 (-0.0016)
0.03 (0.0012)
-0.32 (-0.0125)
421606 Pennsylvania doweled JRCP 13.95 (45.76)
-0.30 (-0.0117)
0.12 (0.0047)
-1.49 (-0.0581)
484143 Texas doweled JRCP 18.15 (59.53)
-0.07 (-0.0027)
0.01 (0.0004)
-0.23 (-0.0090)
204054 Kansas nondoweled JRCP 9 (29.52)
-0.13 (-0.0051)
0.00 (0.00)
-0.46 (-0.0179)
*positive values indicate increase in joint opening Analysis of figure 75 also shows no appreciable difference in joint movement distributions between doweled JPCP and JRCP, although mean joint spacing of the latter is much greater. A possible explanation is that development of midpanel cracks in JRCP effectively reduces JRCP joint spacing. It was also observed that daily joint movements of nondoweled joints were somewhat lower than doweled joints. No reasonable explanation was found for this phenomenon.
84

0
5
10
15
20
25
30
35
-2 -1 -0.6 -0.4 -0.2 -0.1 0 0.1 0.2 0.4 0.6 1 2
Change in Joint Opening (mm)
Perc
ent o
f Obs
erva
tions
DDN
Figure 75. Changes in joint opening from different measurement passes measurements. Seasonal Variation in Joint Opening In this study, gage distance data were used to evaluate seasonal variation in jreduce the effect of daily variability in joint opening, only measurements frogage measurements were considered. The changes in joint opening from themeasurement were matched with changes in mean PCC temperature throughthickness (average of PCC temperatures at the top surface, at the bottom surfmiddepth location). For each SMP section, plots of changes in joint openingmean PCC temperature were then prepared and analyzed. It was found that,significant changes in relationships between joint movement and PCC tempea significant gap (several years) in joint opening measurements exists. In thereference measurement was assigned for subsequent changes in joint openintemperature. Finally, a linear regression for change in joint opening and chatemperature was performed for each section. Figures 76 through 90 present some trends identified in this study. Strong coobserved between changes in joint opening and changes in PCC temperature204054, 274040, 39024, 421606, 484142, 484143, and 493011. For these seregressions between changes in joint opening and changes in PCC temperatuin percent. Thus, more than 75 percent of the changes in joint openby changes in PCC temperature. Conversely, very poor correlations were fo040215, 370201, and 893015 (see figures 76, 83, and 90).
752 >R
85
1 mm = .039 inch
oweled JPCP oweled JRCP ondoweled JPCP
on the same day of
oint opening. To m the first pass of reference out the PCC slab ace, and in the versus change in for several sections, rature might exist if se cases, a new
g and PCC nge in PCC
rrelations were for sections 133019, ctions, linear res that resulted
ing can be explained und for sections

y = -0.0261x - 0.2192 R2 = 0.3222
-1.5
-1
-0.5
0
0.5
1
-20 -15 -10 -5 0 5 10 15 20
T-Tref (°C)
Join
t Ope
ning
(mm
)
F = 1.8C + 32
Figure 76. Change in joint opening versus change in PCC temperature, section 040215.
y = -0.0711x - 0.3354 R2 = 0.4301
-2
-1.5
-1
-0.5
0
0.5
1
-15 -10 -5 0 5 10
T-Tref (°C)
Join
t Ope
ning
(mm
)
F = 1.8C + 32
Figure 77. Change in joint opening versus change in PCC temperature, section 063042.
86

y = -0.0219x - 0.0522 R2 = 0.8499
-0.8
-0.6
-0.4
-0.2
0
0.2
0.4
0.6
-20 -15 -10 -5 0 5 10 15 20 25 30
T-Tref (°C)
Join
t Ope
ning
(mm
)
Figure 78. Change in joint opening versus change in PCC temperature, section 13
y = -0.0359x + 0.454 R2 = 0.8025
-0.2
0
0.2
0.4
0.6
0.8
1
1.2
-15 -10 -5 0 5 10 15
T-Tref (°C)
Join
t Ope
ning
(mm
)
Figure 79. Change in joint opening versus change in PCC temperature, section 20
87
F = 1.8C + 32
3019.
F = 1.8C + 32
4054.

y = -0.0524x - 0.2388 R2 = 0.7553
-2
-1.5
-1
-0.5
0
0.5
1
1.5
-15 -10 -5 0 5 10 15 20 25
T-Tref (°C)
Join
t Ope
ning
(mm
)
F = 1.8C + 32
Figure 80. Change in joint opening versus change in PCC temperature, section 274040.
y = -0.0294x + 0.0835 R2 = 0.5002
0
0.2
0.4
0.6
0.8
1
1.2
-30 -25 -20 -15 -10 -5 0 T-Tref (°C )
Join
t Ope
ning
(mm
)
F = 1.8C + 32
Figure 81. Change in joint opening versus change in PCC temperature, section 313018.
88
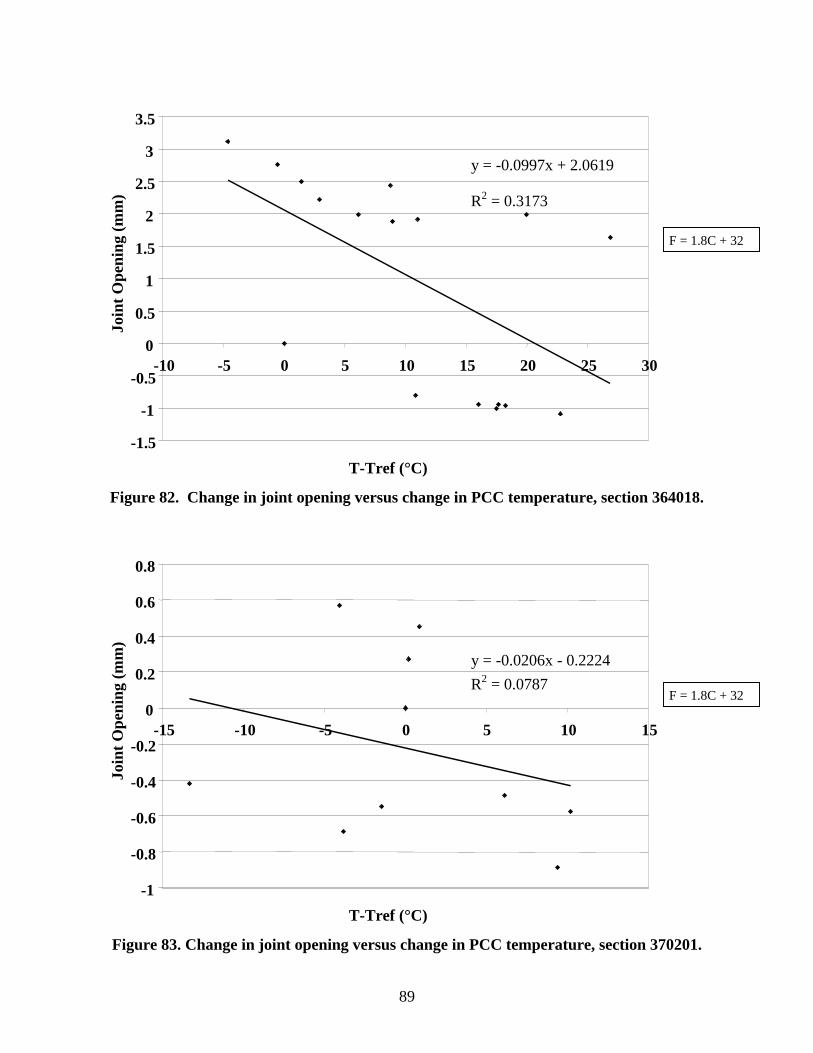
y = -0.0997x + 2.0619
R2 = 0.3173
-1.5
-1
-0.5
0
0.5
1
1.5
2
2.5
3
3.5
-10 -5 0 5 10 15 20 25 30
T-Tref (°C)
Join
t Ope
ning
(mm
)
Figure 82. Change in joint opening versus change in PCC temperature, section 36
y = -0.0206x - 0.2224 R2 = 0.0787
-1
-0.8
-0.6
-0.4
-0.2
0
0.2
0.4
0.6
0.8
-15 -10 -5 0 5 10 15
T-Tref (°C)
Join
t Ope
ning
(mm
)
Figure 83. Change in joint opening versus change in PCC temperature, section 37
89
F = 1.8C + 32
4018.
F = 1.8C + 32
0201.

y = -0.0631x + 0.2128 R2 = 0.7422
-0.2
-0.1
0
0.1
0.2
0.3
0.4
0.5
0.6
0.7
0.8
0.9
-10 -5 0 5 10
T-Tref (°C)
Join
t Ope
ning
(mm
)
F = 1.8C + 32
Figure 84. Change in joint opening versus change in PCC temperature, section 390204.
y = -0.1093x + 0.9451 R2 = 0.9248
-0.5
0
0.5
1
1.5
2
2.5
3
-15 -10 -5 0 5 10 15
T-Tref (°C)
Join
t Ope
ning
(mm
)
F = 1.8C + 32
Figure 85. Change in joint opening versus change in PCC temperature, section 421606.
90

y = -0.0359x + 0.0408 R2 = 0.9519
-0.6
-0.5
-0.4
-0.3
-0.2
-0.1
0
0.1
0.2
0.3
0.4
0.5
-10 -5 0 5 10 15 20
T-Tref (°C)
Join
t Ope
ning
(mm
)
Figure 86. Change in joint opening versus change in PCC temperature, section 48
y = -0.0563x + 0.0429
R2 R2 = 0.9325
-1.2
-1
-0.8
-0.6
-0.4
-0.2
0
0.2
0.4
0.6
-5 0 5 10 15 20
T-Tref (°C)
Join
t Ope
ning
(mm
)
Figure 87. Change in joint opening versus change in PCC temperature, section 48
91
F = 1.8C + 32
4142.
F = 1.8C + 32
4143.

y = -0.0447x + 0.0128 R2 = 0.8862
-1
-0.8
-0.6
-0.4
-0.2
0
0.2
0.4
0.6
0.8
1
-15 -10 -5 0 5 10 15 20
T-Tref (°C)
Join
t Ope
ning
(mm
)
F = 1.8C + 32
Figure 88. Change in joint opening versus change in PCC temperature, section 493011.
y = -0.0485x - 0.0636 R2 = 0.6125
-2.5
-2
-1.5
-1
-0.5
0
0.5
1
1.5
-15 -10 -5 0 5 10 15 20 25 30 35
T-Tref (°C)
Join
t Ope
ning
(mm
)
F = 1.8C + 32
Figure 89. Change in joint opening versus change in PCC temperature, section 833802.
92

y = -0.0577x + 1.8316 R2 = 0.1221
-2
-1.5
-1
-0.5
0
0.5
1
1.5
2
2.5
3
-10 -5 0 5 10 15 20 25
T-Tref (°C)
Join
t Ope
ning
(mm
)
Figure 90. Change in joint opening versus change in PCC temperature, section 89 The slopes of linear regressions between changes in joint opening and changes in PCC temperatures were used to calculate the PCC/base friction factor for each section. According to Darter et al. (1977), change in PCC temperature should produce the followichange in joint opening:
PCCTLu ∆=∆ αβ where:
- = the change in joint opening. u∆- = the change in PCC temperature. PCCT∆- β = the PCC/base friction factor. - α = the PCC coefficient of thermal expansion. - L = the effective joint spacing.
The PCC/base friction factor adjusts unrestrained movement of a slab at a joint to a loweras a result of slab base friction. For a given section, a linear relationship between changejoint opening and changes in PCC temperature has the following form:
bTku PCC +∆=∆ where:
- k = the slope of the joint opening-temperature change relationship. - b = the intercept of that relationship.
93
F = 1.8C + 32
3015.
ng
(25)
value s in
(26)

If intercept b is ignored, then the friction factor can be determined from the following relationship:
Lk
αβ = (27)
Using this relationship, friction coefficients were determined for the sections with very low intercepts in the identified relationships. For sections where joint spacing was longer than 6 m (20 ft), the presence of working transverse cracks reduced effective slab length. To account for this effect, an effective joint spacing equal to one-half or one-third was assigned for each slab. These spacing represent typical distances between transverse joints and cracks in jointed reinforced pavements. Table 19 presents the results of this analysis. One can observe that only one section (133019) resulted in a very low friction factor. For all other sections, the friction factor ranges from 0.34 to 0.8, which agrees with the results of previous studies.
Table 19. PCC/base friction factors for SMP LTPP sections.
Section State Base Type Coefficient of Thermal Expansion, mm/mm/oC
(inch/inch/°F)
Joint Spacing,m (ft)
Effective Joint Spacing,
m (ft)
Slope k mm/oC
(inch/°F)
Friction Factor
133019 Georgia AGG 1.00 (0.56) 6 .00(19.68) 6.0 (19.68) 0.0068 (0.00015) 0.11 204054 Kansas CTB 1.09 (0.61) 9.00 (29.52) 4.5 (14.76) 0.0111 (0.00024) 0.40 274040 Minnesota AGG 1.02 (0.57) 8.10 (26.57) 4.05 (13.28) 0.0161 (0.00035) 0.69 390204 Ohio AGG 0.95 (0.53) 4.50 (14.76) 4.5 (14.76) 0.0194 (0.00043) 0.81 421606 Pennsylvania AGG 1.24 (0.69) 13.95 (45.76) 6.9 (22.63) 0.0339 (0.00075) 0.70 484142 Texas AGG 0.95 (0.53) 18.15 (59.53) 6.0 (19.68) 0.0111 (0.00024) 0.35 484143 Texas CTB 0.95 (0.53) 18.15 (59.53) 6.0 (19.68) 0.0172 (0.00038) 0.53 493011 Utah CTB 0.95 (0.53) 4.50 (14.76) 4.5 (14.76) 0.0139 (0.00031) 0.58 833802 Manitoba CTB 1.03 (0.58) 4.50 (14.76) 4.5 (14.76) 0.0149 (0.00033) 0.57
1 mm/mm/°C = 0.56 inch/inch/°F 1 mm/°C = 0.22 inch/°F Effects of Joint Opening on LTE Finally, the effect of change in joint opening on LTE was conducted. Figures 91 through 108 present joint opening versus LTEs for the LTPP SMP sections. For each section, LTEs from leave and approach tests are plotted separately. Surprisingly, only two sections, 484142 and 484143, showed very strong relationships between LTEs and joint opening (see figures 91 through 94). Two other sections, 133019 and 493011, show moderately strong relationships between joint opening and LTE (see figures 95 through 98). For all other sections, very weak relationships were found (see figures 99 through 108). At this point, it is premature to say what caused these poor correlations. They may be explained by measurement errors in joint opening, or a contribution of factors, including PCC slab curling. More research is needed to clarify this issue.
94

y = -10.701x + 87.705 R2 = 0.7554
0
10
20
30
40
50
60
70
80
90
100
-0.5 -0.4 -0.3 -0.2 -0.1 0 0.1 0.2 0.3Joint Opening (mm)
LT
E J
4 (%
)
Figure 91. Approach LTE versus joint opening, section 484142.
y = -14.005x + 87.708
R2 = 0.7726
0
10
20
30
40
50
60
70
80
90
100
-0.5 -0.4 -0.3 -0.2 -0.1 0 0.1 0.2 0.3Joint Opening (mm)
LT
E J
5 (%
)
Figure 92. Leave LTE versus joint opening, section 484142.
95
1 mm = .039 inch
1 mm = .039 inch

y = -10.667x + 81.811 R2 = 0.6453
0
10
20
30
40
50
60
70
80
90
100
-1.2 -1 -0.8 -0.6 -0.4 -0.2 0 0.2 0.4 0.6Joint Opening (mm)
LT
E J
4 (%
)
1 mm = .039 inch
Figure 93. Approach LTE versus joint opening, section 484143.
y = -17.257x + 77.349
R2 = 0.8166
0
10
20
30
40
50
60
70
80
90
100
-1.2 -1 -0.8 -0.6 -0.4 -0.2 0 0.2 0.4 0.6Joint Opening (mm)
LT
E J
5 (%
)
1 mm = .039 inch
Figure 94. Leave LTE versus joint opening, section 484143.
96

y = -55.61x + 50.492 R2 = 0.4357
0
10
20
30
40
50
60
70
80
90
100
-0.7 -0.6 -0.5 -0.4 -0.3 -0.2 -0.1 0 Joint Opening (mm)
LT
E J
4 (%
)
Figure 95. Approach LTE versus joint opening, section 133019.
y = -31.843x + 70.59
R2 = 0.4928
0
10
20
30
40
50
60
70
80
90
100
-0.7 -0.6 -0.5 -0.4 -0.3 -0.2 -0.1 0 Joint Opening (mm)
LT
E J
5 (%
)
Figure 96. Leave LTE versus joint opening, section 133019.
97
1 mm = .039 inch
1 mm = .039 inch

y = -33.47x + 52.062
R2 = 0.4158
0
10
20
30
40
50
60
70
80
90
100
-1 -0.8 -0.6 -0.4 -0.2 0 0.2 0.4 0.6 0.8 1 Joint Opening (mm)
LT
E J
4 (%
)
1 mm = .039 inch
Figure 97. Approach LTE versus joint opening, section 493011.
y = -26.544x + 67.587 R2 = 0.4976
0
10
20
30
40
50
60
70
80
90
100
-1 -0.8 -0.6 -0.4 -0.2 0 0.2 0.4 0.6 0.8 1 Joint Opening (mm)
LT
E J
5 (%
)
1 mm = .039 inch
Figure 98. Leave LTE versus joint opening, section 493011.
98
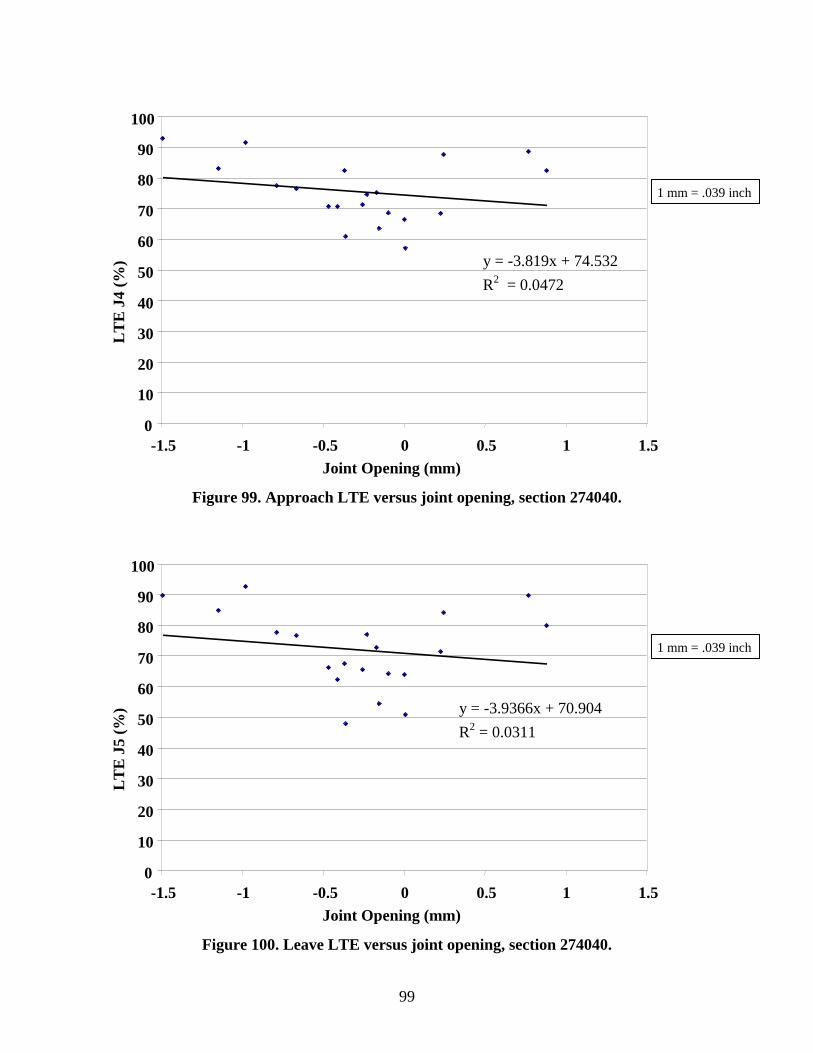
y = -3.819x + 74.532 R2 = 0.0472
0
10
20
30
40
50
60
70
80
90
100
-1.5 -1 -0.5 0 0.5 1 1.5Joint Opening (mm)
LT
E J
4 (%
)
Figure 99. Approach LTE versus joint opening, section 274040.
y = -3.9366x + 70.904 R2 = 0.0311
0
10
20
30
40
50
60
70
80
90
100
-1.5 -1 -0.5 0 0.5 1 1.5Joint Opening (mm)
LT
E J
5 (%
)
Figure 100. Leave LTE versus joint opening, section 274040.
99
1 mm = .039 inch
1 mm = .039 inch
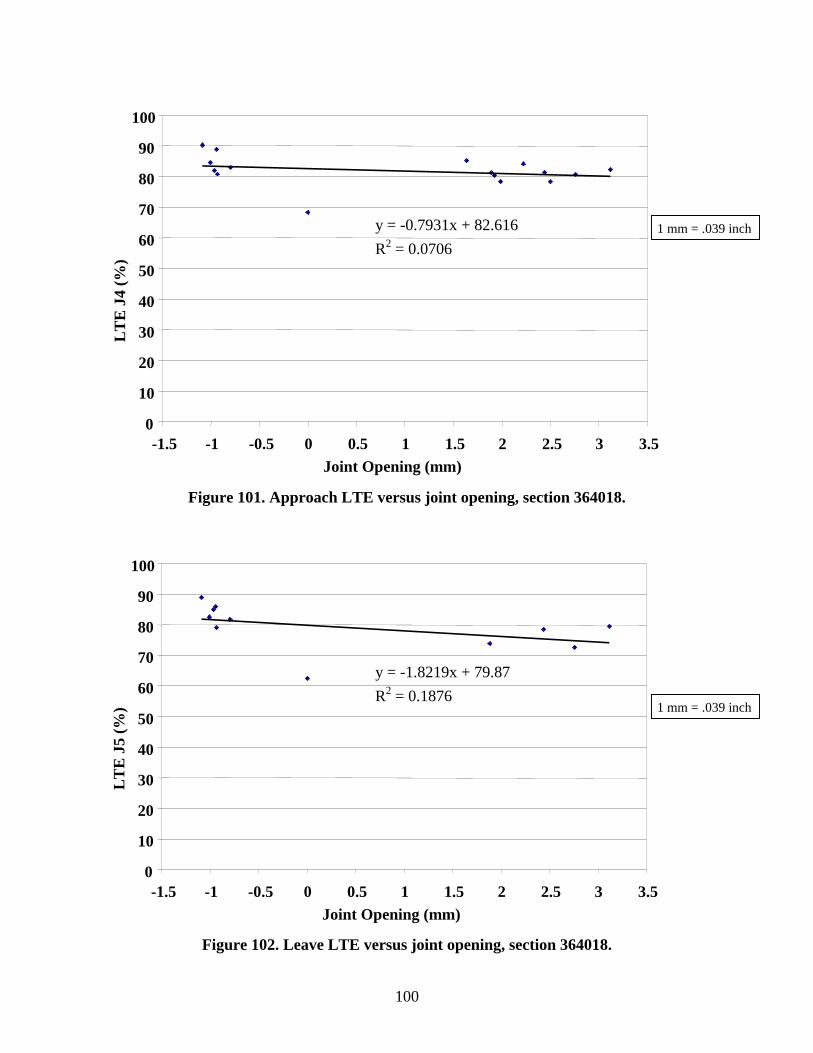
y = -0.7931x + 82.616 R2 = 0.0706
0
10
20
30
40
50
60
70
80
90
100
-1.5 -1 -0.5 0 0.5 1 1.5 2 2.5 3 3.5Joint Opening (mm)
LT
E J
4 (%
)
1 mm = .039 inch
Figure 101. Approach LTE versus joint opening, section 364018.
y = -1.8219x + 79.87 R2 = 0.1876
0
10
20
30
40
50
60
70
80
90
100
-1.5 -1 -0.5 0 0.5 1 1.5 2 2.5 3 3.5Joint Opening (mm)
LT
E J
5 (%
)
1 mm = .039 inch
Figure 102. Leave LTE versus joint opening, section 364018.
100

y = -10.37x + 71.074
R2 = 0.0783
0
10
20
30
40
50
60
70
80
90
100
-1.6 -1.4 -1.2 -1 -0.8 -0.6 -0.4 -0.2 0 0.2 0.4 0.6Joint Opening (mm)
LT
E J
4 (%
)
Figure 103. Approach LTE versus joint opening, section 370201.
y = -1.5691x + 77.789
R2 = 0.0038
0
10
20
30
40
50
60
70
80
90
100
-1.6 -1.4 -1.2 -1 -0.8 -0.6 -0.4 -0.2 0 0.2 0.4 0.6Joint Opening (mm)
LT
E J
5 (%
)
Figure 104. Leave LTE versus joint opening, section 370201.
101
1 mm = .039 inch
1 mm = .039 inch

y = -2.9171x + 94.009 R2 = 0.3343
0
10
20
30
40
50
60
70
80
90
100
-0.2 -0.1 0 0.1 0.2 0.3 0.4 0.5 0.6 0.7 0.8 0.9Joint Opening (mm)
LT
E J
4 (%
)
1 mm = .039 inch
Figure 105. Approach LTE versus joint opening, section 390204.
y = -1.0111x + 94.775
R2 = 0.1088
0
10
20
30
40
50
60
70
80
90
100
-0.2 -0.1 0 0.1 0.2 0.3 0.4 0.5 0.6 0.7 0.8 0.9Joint Opening (mm)
LT
E J
5 (%
)
1 mm = .039 inch
Figure 106. Leave LTE versus joint opening, section 390204.
102

y = -0.3923x + 90.736
R2 = 0.0247
0
10
20
30
40
50
60
70
80
90
100
-2 -1.5 -1 -0.5 0 0.5 1 1.5 2 2.5 3 3.5Joint Opening (mm)
LT
E J
4 (%
)
Figure 107. Approach LTE versus joint opening, section 893015.
y = -1.1674x + 91.452
R2 = 0.2109
0
10
20
30
40
50
60
70
80
90
100
-2 -1 0 1 2 3 4Joint Opening (mm)
LT
E J
5 (%
)
Figure 108. Leave LTE versus joint opening, section 893015.
103
1 mm = .039 inch
1 mm = .039 inch

104

CHAPTER 8. SUMMARY AND RECOMMENDATIONS FOR CONTINUED RESEARCH
The analyses reported in this document were intended to calculate LTE and backcalculate stiffnesses of cracks and joint of PCC pavements from deflection measurements, as well as joint opening from gage distance data, and recommend representative parameters for each section for inclusion in the LTPP database. This report presents a discussion on the selection of the computational methodology and the results of the calculations of LTE and stiffness of cracks and joints for GPS, SPS, and SMP rigid pavement sections, as well as changes in joint opening for SMP sections. The following are highlights of the study:
• Large amounts of high-quality LTE data have been collected under the LTPP program. This information will be a valuable resource in improving the understanding of load transfer effects and improving pavement design and rehabilitation procedures.
• LTE was found to be a complex parameter that depends on many factors, including the presence of dowels, base type, subgrade, FWD load plate position (approach and leave side), testing time, and season.
• It was found that nondoweled JCP with a significant level of faulting had a much higher percentage of sections with a low level of LTE than sections that did not exhibit significant faulting (sections with high faulting had lower LTE).
• Testing time and season were found to have profound effects on LTE. For the same joints, LTEs measured early in the morning in a cool season were found to be much lower than LTEs measured in the afternoon in warmer weather. This effect was much greater for nondoweled JCP.
• A strong correlation was found between LTE and PCC slab temperature when higher temperature resulted in higher LTE joints.
• LTE of CRCP cracks was found to be very high (more than 98 percent of cracks had LTE greater than 80 percent).
• LTE of doweled joints was found to be much higher than LTE of nondoweled joints (more than 66 percent of doweled joints had LTE greater than 80 percent, whereas only 44 percent of nondoweled joints had LTE greater than 80 percent).
• LTEs from leave and approach side deflection testing data were found to be statistically different for more than 20 percent of JCP sections. The difference in LTE was greater for sections with lower LTE. An attempt to explain this phenomenon by the presence of a void under the leave side of the joint was not successful. The hypothesis that this discrepancy may be caused by test sequence could not be verified under this study.
• LTE of CRCP cracks was found to have lower variability (crack to crack), load level dependency, and FWD load position dependency than LTE of JCP joints.
• LTE of doweled joints was found to have lower variability, load level dependency, and load position dependency than LTE of nondoweled joints.
• The effect of dowel diameter on LTE of doweled joints was not clearly identified. However, this may be explained by confounding effects of other factors, such as traffic level. In some cases, for large diameter dowels, the LTE was fairly low (less than 40 percent). Poor consolidation of PCC around dowels may significantly reduce dowel effectiveness.
105

• LTE of nondoweled joints was found to be slightly lower for sections with a lean concrete base compared to sections with other base types.
• Nondoweled joints of sections with fine subgrade exhibited slightly higher LTE than those with a coarse subgrade.
• Poor correlation was found between LTE and design parameters such as PCC thickness, PCC strength, design steel content, joint spacing, and joint orientation.
• Joint width changes daily and seasonally. Mean daily opening and closing were found to be within plus or minus 1 mm (0.039 inch). Mean seasonal opening and closing were found to be within plus or minus 3 mm (0.117 inch).
• Strong correlation was found between PCC slab temperature and joint opening and closing. In addition, only a few sections showed good relationships between LTE and joint opening.
• A backcalculation procedure for joint stiffnesses was developed based on Crovetti’s equation. From the results of backcalculation for the LTPP sections, typical ranges were recommended for selection of joint stiffnesses for CRCP cracks, doweled and nondoweled joints for use in finite element analysis.
• With the current procedure to measure LTE with the FWD sensor configuration, LTE may need to be adjusted slightly for slab bending occurring between the joint and FWD sensors. An assumption of symmetrical joint behavior and full contact between the slab and the foundation was made. This assumption, however, is most likely invalid in the field. A more sophisticated correction factor needs to be developed.
Design, construction, and evaluation implications:
• CRCP with adequate reinforcement has very high crack LTE, which controls crack deterioration and punchouts.
• Use of dowels provides joint LTE that is higher and more consistent over time and seasons.
• Poor LTE occurred on some doweled joints. This may lead to premature faulting. The cause may be a lack of consolidation around the dowel, which may need to be checked at construction.
• It is important to conduct FWD LTE testing early in the morning in cool weather to provide a realistic estimation of LTE during times when the most damage occurs.
To improve procedures for evaluation of PCC joints and cracks, the most urgent needs are to:
• Develop a mechanistic model for PCC cracks/joints capable of describing load position dependent behavior.
• Develop a better understanding of the effects of joint/crack opening and PCC slab curling on LTE.
• Develop a better understanding of the effects of permanent voids (erosion) under the joint on LTE and faulting.
• Develop a bending correction factor accounting for nonsymmetrical joint behavior, presence of a void, and PCC slab curling.
106

• Perform multivariate analysis to identify the effect of design features and site condition on LTE accounting for interaction between these parameters.
• Perform time history analysis of FWD deflection data for tests J4, C4, J5, and C5. • Investigate the effects of LTE deterioration on development of base/subgrade erosion,
pumping, joint faulting, and CRCP punchouts. These additional studies will significantly improve our understanding of rigid pavement behavior and significantly contribute toward the improvement of mechanistic-empirical design procedures.
107

108

REFERENCES Byrum (2001). Personal Communication Crovetti, J.A. (1994). “Design and Evaluation of Jointed Concrete Pavement Systems
Incorporating Open-Graded Permeable Bases,” Ph.D. Dissertation, University of Illinois at Urbana-Champaign.
Darter, M.I. (1977). “Design of Zero-Maintenance Plain Jointed Concrete Pavement: Vol. I—Development of Design Procedures,” Federal Highway Administration, FHWA-RD-77-111, Washington, DC, June. Davids, W.G., G.M. Turkiyyah, and J. Mahoney (1998). “EverFE—A New Rigid Pavement
Finite Element Analysis Tool,” Transportation Research Record, National Research Council, Washington, DC, pp. 69–78.
Friberg, B.F. (1940). “Design of Dowels in Transverse Joints of Concrete Pavements,”
Transactions, ASCE. Vol. 105. Guo H, J.A. Sherwood, and M.B. Snyder (1995). “Component Dowel-Bar Model for Load-
Transfer Systems in PCC Pavements,” Journal of Transportation Engineering, Vol. 121, pp. 289–298. Ioannides, I.M, E.J. Barenberg, and J.A. Lary (1989). “Interpretation of Falling Weight
Deflectometer Results Using Principles of Dimensional Analysis,” Proceedings, Fourth International Conference on Concrete Pavement Design and Rehabilitation, Purdue University, W. Lafayette, IN, April 18–20, pp. 231–247.
Ioannides, A.M., and G.T. Korovesis (1990). “Aggregate Interlock: A Pure-Shear Load Transfer
Mechanism,” Transportation Research Record 1286, Transportation Research Board, Washington, DC.
Ioannides, A.M., and G.T. Korovesis (1992). “Analysis and Design of Doweled Slab-On-Grade
Pavement Systems,” Journal of Transportation Engineering, American Society of Civil Engineers, Vol. 118, No. 6, New York, NY, pp. 745–768.
Ioannides, A.M., D.R. Alexander, M.I. Hammons, and C.M. Davis (1996). “Application of
Artificial Neural Networks to Concrete Pavement Joint Evaluation,” Transportation Research Record 1540, Transportation Research Board, Washington, DC, pp. 54–64.
Khazanovich, L., H.T. Yu, S. Rao, K. Galasova, E. Shats, and R. Jones (2000). ISLAB2000—
Finite Element Analysis Program for Rigid and Composite Pavements. User’s Guide, ERES Consultants, Champaign, IL.
109

Khazanovich, L., N. Buch, and A. Gotlif (2001). “Mechanistic Evaluation of Vertical Misalignment of Dowel Bars and their Effect on Joint Performance,” Proceedings, Seventh International Conference on Concrete Pavement, September 9–13, Lake Buena Vista, FL, pp. 525–538.
Khazanovich, L., S. Tayabji, and M. Darter (2001). “Backcalculation of Layer Parameters for
Long Term Pavement Performance (LTPP) Test Sections, Volume I: Slab on Elastic Solid and Slab on Dense-Liquid Foundation Analysis of Rigid Pavements,” Federal Highway Administration, FHWA-RD-00-086, Washington, DC.
Parson. I.D., I. Eom, and K.D. Hjelmstad (1997). “Numerical Simulations of Load Transfer
between Doweled Pavement Slabs,” Proceedings, American Society of Civil Engineers Specialty Conference on Aircraft/Pavement Technology in the Midst of Change, Seattle, WA, pp. 166–177.
Scarpas, A., E. Ehrola, and J. Judycki (1994). “Simulation of Load Transfer Across Joints in RC
Pavements,” Proceedings, Third International Workshop on the Design and Evaluation of Concrete Pavements, Krumbach, Austria, pp. 113–122.
Shoukry S.N., and G. William (1998). “3D FEM Analysis of Load Transfer Efficiency,”
Proceedings of the National Symposium on 3D FEM for Pavement Analysis and Design, Charleston, WV.
Tabatabie, A.M. and E.J Barenberg (1980). “Structural Analysis of Concrete Pavement
Systems,” Transportation Engineering Journal, American Society of Civil Engineers, Vol. 106, No. 5, pp. 493–506.
Wu, C.L. and S.D. Tayabji (2002). “Variability of Concrete Pavement Load Transfer Efficiency
Data,” TRB Paper No. 02-2448, Presented at the January 2002 Annual Meeting of the Transportation Research Board.
Zollinger, D.G. and J. Soares (1999). “Performance of Continuously Reinforced Concrete
Pavements: Volume VII: Summary,” Final Report, Federal Highway Administration, FHWA-RD-98-102, PCS/Law Engineering.
110