Embed Size (px)
Citation preview

Evaluation of Highly Polymer-Modified Asphalt Mixtures: Phase I
http://www.virginiadot.org/vtrc/main/online_reports/pdf/18-r14.pdf
BENJAMIN F. BOWERS, Ph.D., P.E. Research Scientist BRIAN K. DIEFENDERFER, Ph.D., P.E. Associate Principal Research Scientist STACEY D. DIEFENDERFER, Ph.D., P.E. Senior Research Scientist
Final Report VTRC 18-R14
Standard Title Page - Report on Federally Funded Project 1. Report No.: 2. Government Accession No.: 3. Recipient’s Catalog No.: FHWA/VTRC 18-R14
4. Title and Subtitle: 5. Report Date: Evaluation of Highly Polymer-Modified Asphalt Mixtures: Phase I
May 2018 6. Performing Organization Code:
7. Author(s): Benjamin F. Bowers, Ph.D., P.E., Brian K. Diefenderfer, Ph.D., P.E., and Stacey D. Diefenderfer, Ph.D., P.E.
8. Performing Organization Report No.: VTRC 18-R14
9. Performing Organization and Address: Virginia Transportation Research Council 530 Edgemont Road Charlottesville, VA 22903
10. Work Unit No. (TRAIS): 11. Contract or Grant No.: 106481
12. Sponsoring Agencies’ Name and Address: 13. Type of Report and Period Covered: Virginia Department of Transportation 1401 E. Broad Street Richmond, VA 23219
Federal Highway Administration 400 North 8th Street, Room 750 Richmond, VA 23219-4825
Final 14. Sponsoring Agency Code:
15. Supplementary Notes: 16. Abstract:
Reflective cracking in asphalt overlays placed over jointed concrete pavement has been a concern of the Virginia Department of Transportation (VDOT) for years. Although there are many techniques to delay crack propagation through an asphalt overlay, they may require specialized equipment, unique mix designs, or other specific mixture additives. The introduction of highly polymer-modified (HP) binders to the market brings forward a new potential crack mitigation method requiring only the use of the HP binder in an asphalt mixture to provide mitigation.
Before asphalt mixtures with HP binder were used on a jointed concrete overlay project, a trial project to evaluate the
constructability and laboratory performance of a mixture using this type of binder was conducted. The trial project compared an asphalt surface mixture with an HP binder and a standard surface mixture (control) in a mill and resurfacing pavement project in a subdivision in Northern Virginia. The asphalt surface mixture with the HP binder was found to be constructible without major changes in paving operations; in addition, the laboratory performance was equivalent or superior to that of the control mixture.
The results were promising enough to support investigating the use of HP binders in asphalt mixtures over jointed concrete as a reflective crack mitigation technique or when deemed appropriate as a tool for increased crack resistance. The study recommends that VDOT consider the use of asphalt mixtures with HP binders as a tool for increased crack resistance when deemed appropriate by the appropriate VDOT decision maker (e.g., the district materials engineer). The study also recommends that the Virginia Transportation Research Council and the VDOT districts with concerns about reflective cracking potential in asphalt overlays investigate the use of HP mixtures as a reflective crack mitigation layer. 17 Key Words: 18. Distribution Statement: Polymer modified asphalt, pavement crack mitigation, overlays (pavements), styrene butadiene styrene
No restrictions. This document is available to the public through NTIS, Springfield, VA 22161.
19. Security Classif. (of this report): 20. Security Classif. (of this page): 21. No. of Pages: 22. Price: Unclassified Unclassified 38
Form DOT F 1700.7 (8-72) Reproduction of completed page authorized

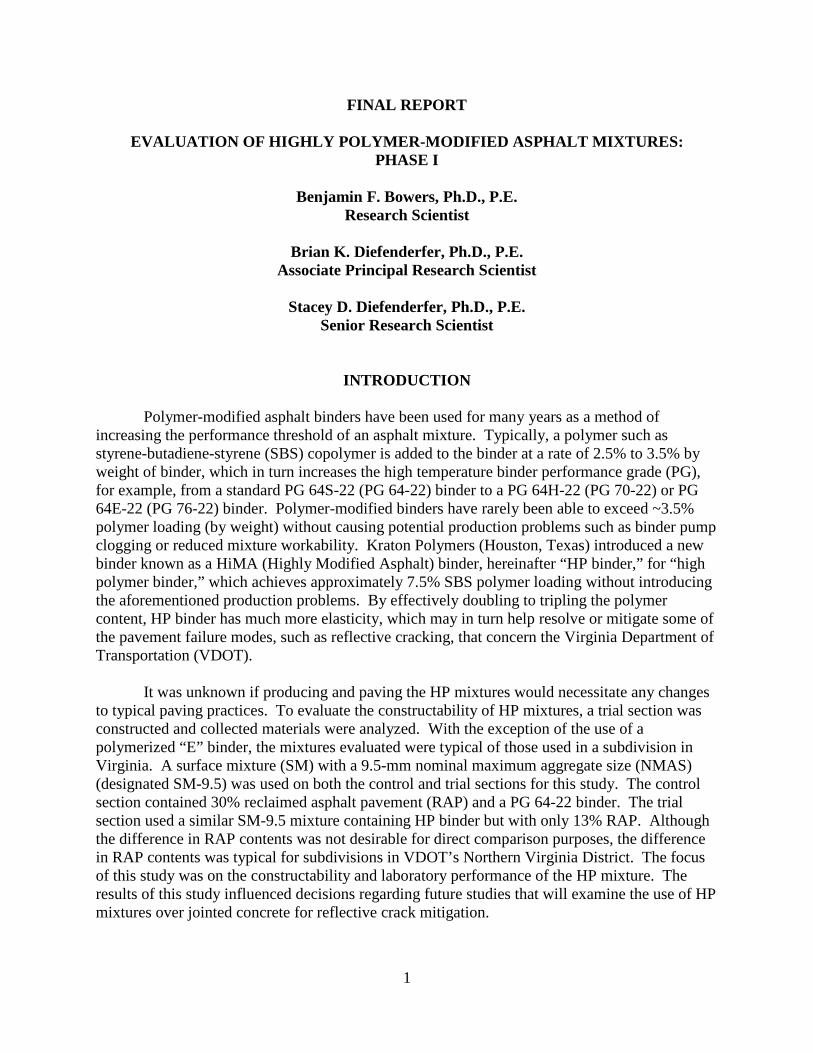
FINAL REPORT
EVALUATION OF HIGHLY POLYMER-MODIFIED ASPHALT MIXTURES: PHASE I
Benjamin F. Bowers, Ph.D., P.E. Research Scientist
Brian K. Diefenderfer, Ph.D., P.E.
Associate Principal Research Scientist
Stacey D. Diefenderfer, Ph.D., P.E. Senior Research Scientist
In Cooperation with the U.S. Department of Transportation Federal Highway Administration
Virginia Transportation Research Council
(A partnership of the Virginia Department of Transportation and the University of Virginia since 1948)
Charlottesville, Virginia
May 2018
VTRC 18-R14

ii
DISCLAIMER
The contents of this report reflect the views of the authors, who are responsible for the facts and the accuracy of the data presented herein. The contents do not necessarily reflect the official views or policies of the Virginia Department of Transportation, the Commonwealth Transportation Board, or the Federal Highway Administration. This report does not constitute a standard, specification, or regulation. Any inclusion of manufacturer names, trade names, or trademarks is for identification purposes only and is not to be considered an endorsement.
Copyright 2018 by the Commonwealth of Virginia. All rights reserved.
iii
ABSTRACT
Reflective cracking in asphalt overlays placed over jointed concrete pavement has been a concern of the Virginia Department of Transportation (VDOT) for years. Although there are many techniques to delay crack propagation through an asphalt overlay, they may require specialized equipment, unique mix designs, or other specific mixture additives. The introduction of highly polymer-modified (HP) binders to the market brings forward a new potential crack mitigation method requiring only the use of the HP binder in an asphalt mixture to provide mitigation.
Before asphalt mixtures with HP binder were used on a jointed concrete overlay project,
a trial project to evaluate the constructability and laboratory performance of a mixture using this type of binder was conducted. The trial project compared an asphalt surface mixture with an HP binder and a standard surface mixture (control) in a mill and resurfacing pavement project in a subdivision in Northern Virginia. The asphalt surface mixture with the HP binder was found to be constructible without major changes in paving operations; in addition, the laboratory performance was equivalent or superior to that of the control mixture.
The results were promising enough to support investigating the use of HP binders in
asphalt mixtures over jointed concrete as a reflective crack mitigation technique or when deemed appropriate as a tool for increased crack resistance. The study recommends that VDOT consider the use of asphalt mixtures with HP binders as a tool for increased crack resistance when deemed appropriate by the appropriate VDOT decision maker (e.g., the district materials engineer). The study also recommends that the Virginia Transportation Research Council and the VDOT districts with concerns about reflective cracking potential in asphalt overlays investigate the use of HP mixtures as a reflective crack mitigation layer.
1
FINAL REPORT
EVALUATION OF HIGHLY POLYMER-MODIFIED ASPHALT MIXTURES: PHASE I
Benjamin F. Bowers, Ph.D., P.E.
Research Scientist
Brian K. Diefenderfer, Ph.D., P.E. Associate Principal Research Scientist
Stacey D. Diefenderfer, Ph.D., P.E.
Senior Research Scientist
INTRODUCTION
Polymer-modified asphalt binders have been used for many years as a method of increasing the performance threshold of an asphalt mixture. Typically, a polymer such as styrene-butadiene-styrene (SBS) copolymer is added to the binder at a rate of 2.5% to 3.5% by weight of binder, which in turn increases the high temperature binder performance grade (PG), for example, from a standard PG 64S-22 (PG 64-22) binder to a PG 64H-22 (PG 70-22) or PG 64E-22 (PG 76-22) binder. Polymer-modified binders have rarely been able to exceed ~3.5% polymer loading (by weight) without causing potential production problems such as binder pump clogging or reduced mixture workability. Kraton Polymers (Houston, Texas) introduced a new binder known as a HiMA (Highly Modified Asphalt) binder, hereinafter “HP binder,” for “high polymer binder,” which achieves approximately 7.5% SBS polymer loading without introducing the aforementioned production problems. By effectively doubling to tripling the polymer content, HP binder has much more elasticity, which may in turn help resolve or mitigate some of the pavement failure modes, such as reflective cracking, that concern the Virginia Department of Transportation (VDOT).
It was unknown if producing and paving the HP mixtures would necessitate any changes to typical paving practices. To evaluate the constructability of HP mixtures, a trial section was constructed and collected materials were analyzed. With the exception of the use of a polymerized “E” binder, the mixtures evaluated were typical of those used in a subdivision in Virginia. A surface mixture (SM) with a 9.5-mm nominal maximum aggregate size (NMAS) (designated SM-9.5) was used on both the control and trial sections for this study. The control section contained 30% reclaimed asphalt pavement (RAP) and a PG 64-22 binder. The trial section used a similar SM-9.5 mixture containing HP binder but with only 13% RAP. Although the difference in RAP contents was not desirable for direct comparison purposes, the difference in RAP contents was typical for subdivisions in VDOT’s Northern Virginia District. The focus of this study was on the constructability and laboratory performance of the HP mixture. The results of this study influenced decisions regarding future studies that will examine the use of HP mixtures over jointed concrete for reflective crack mitigation.

2
PURPOSE AND SCOPE
The purpose of this study was to evaluate the constructability, laboratory performance, and initial field performance of an asphalt mixture containing HP asphalt binder. The study evaluated both laboratory- and field-produced specimens taken from mixtures placed over a milled asphalt pavement located in a subdivision in VDOT’s Northern Virginia District. The details of the production and lay-down operations and short-term (15 months) performance were also evaluated.
The scope of the study comprised a literature review, documentation of the construction, initial and 22-month in-service laboratory evaluations, and a 15-month condition survey of an HP-modified mixture and its paired control. All testing was conducted in the asphalt laboratory of the Virginia Transportation Research Council (VTRC) and included tests on road cores collected from the project, reheated specimens produced in the VTRC laboratory from sampled plant-mixed materials, and specimens produced in the contractor’s laboratory at the time of production (not reheated).
METHODS
Four tasks were performed to achieve the study objectives: 1. A literature review was conducted. 2. The construction of an HP mixture and a paired control mixture trial section was
documented. 3. Laboratory tests of specimens from the HP and control mixtures were conducted. 4. A surface condition survey of the pavements was conducted at 15 months.
Literature Review
Literature on HP-modified asphalt mixtures was identified by searching various databases related to transportation engineering such as the Transport Research International Documentation (TRID) database. The identified literature was then reviewed to identify what studies have been published with respect to HP-modified asphalt mixtures.
Documentation of Construction The construction of an HP mixture and a paired control mixture trial section was
documented to include a visual observation of the pre-construction condition of the roadway and notes relevant to the paving operation (e.g., paving temperatures).

3
Laboratory Testing of Mixture Specimens
An extensive suite of laboratory tests was performed on specimens fabricated from the control and HP mixtures. Table 1 lists each test conducted and the type of specimen evaluated.
The types of specimens were as follows: • Plant mixed, plant compacted (PMPC). These specimens were fabricated in the
contractor’s laboratory before they were allowed to cool from production temperatures.
• Plant mixed, laboratory compacted (PMLC). These specimens were collected as loose mixture and later reheated and compacted at VTRC’s laboratory. They were fabricated by reheating the mixture to the laboratory compaction temperature from the mix design and then compacting them.
• Plant mixed, field compacted (PMFC). These specimens were collected by coring on the day of paving.
• In-service PMFC. These specimens were cores collected 22 months after paving.
Table 1. Specimen Type and Laboratory Tests
Test
Control HP
PMPCa
PMLCb
PMFCc
In-Service PMFCd
PMPC
PMLC
PMFC
In-Service PMFC
Performance Grading Xe X Xe X Multiple Stress Creep and Recovery (MSCR)
Xe X Xe X
Volumetric Analysis X X Dynamic Modulus Test X X X X X X X X Repeated Load Permanent Deformation Test
X X X X X X
Asphalt Pavement Analyzer Rutting Test
X X
Bending Beam Fatigue Test
X X
Overlay Test X X X X X X HP = high polymer. a PMPC = plant mixed, plant compacted. b PMLC = plant mixed, laboratory compacted. c PMFC = plant mixed, field compacted. d In-service PMFC = cores collected approximately 22 months after construction. e Performance grading for on-site material was performed on tank samples collected at the asphalt plant. Mixture Volumetrics, Gradation, and Binder Testing
Volumetric analyses were performed to determine fundamental mixture properties. The data collected included asphalt content and gradation; bulk and Rice mixture specific gravities
4
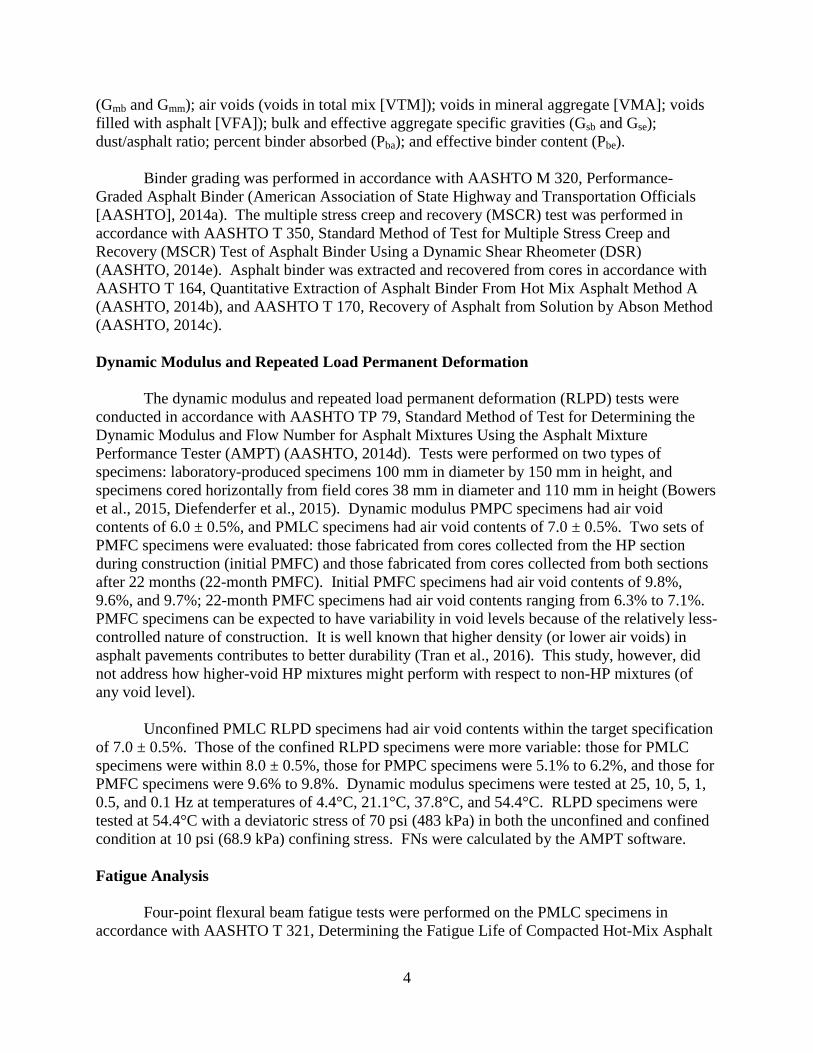
(Gmb and Gmm); air voids (voids in total mix [VTM]); voids in mineral aggregate [VMA]; voids filled with asphalt [VFA]); bulk and effective aggregate specific gravities (Gsb and Gse); dust/asphalt ratio; percent binder absorbed (Pba); and effective binder content (Pbe).
Binder grading was performed in accordance with AASHTO M 320, Performance-Graded Asphalt Binder (American Association of State Highway and Transportation Officials [AASHTO], 2014a). The multiple stress creep and recovery (MSCR) test was performed in accordance with AASHTO T 350, Standard Method of Test for Multiple Stress Creep and Recovery (MSCR) Test of Asphalt Binder Using a Dynamic Shear Rheometer (DSR) (AASHTO, 2014e). Asphalt binder was extracted and recovered from cores in accordance with AASHTO T 164, Quantitative Extraction of Asphalt Binder From Hot Mix Asphalt Method A (AASHTO, 2014b), and AASHTO T 170, Recovery of Asphalt from Solution by Abson Method (AASHTO, 2014c). Dynamic Modulus and Repeated Load Permanent Deformation
The dynamic modulus and repeated load permanent deformation (RLPD) tests were conducted in accordance with AASHTO TP 79, Standard Method of Test for Determining the Dynamic Modulus and Flow Number for Asphalt Mixtures Using the Asphalt Mixture Performance Tester (AMPT) (AASHTO, 2014d). Tests were performed on two types of specimens: laboratory-produced specimens 100 mm in diameter by 150 mm in height, and specimens cored horizontally from field cores 38 mm in diameter and 110 mm in height (Bowers et al., 2015, Diefenderfer et al., 2015). Dynamic modulus PMPC specimens had air void contents of 6.0 ± 0.5%, and PMLC specimens had air void contents of 7.0 ± 0.5%. Two sets of PMFC specimens were evaluated: those fabricated from cores collected from the HP section during construction (initial PMFC) and those fabricated from cores collected from both sections after 22 months (22-month PMFC). Initial PMFC specimens had air void contents of 9.8%, 9.6%, and 9.7%; 22-month PMFC specimens had air void contents ranging from 6.3% to 7.1%. PMFC specimens can be expected to have variability in void levels because of the relatively less-controlled nature of construction. It is well known that higher density (or lower air voids) in asphalt pavements contributes to better durability (Tran et al., 2016). This study, however, did not address how higher-void HP mixtures might perform with respect to non-HP mixtures (of any void level).
Unconfined PMLC RLPD specimens had air void contents within the target specification
of 7.0 ± 0.5%. Those of the confined RLPD specimens were more variable: those for PMLC specimens were within 8.0 ± 0.5%, those for PMPC specimens were 5.1% to 6.2%, and those for PMFC specimens were 9.6% to 9.8%. Dynamic modulus specimens were tested at 25, 10, 5, 1, 0.5, and 0.1 Hz at temperatures of 4.4°C, 21.1°C, 37.8°C, and 54.4°C. RLPD specimens were tested at 54.4°C with a deviatoric stress of 70 psi (483 kPa) in both the unconfined and confined condition at 10 psi (68.9 kPa) confining stress. FNs were calculated by the AMPT software. Fatigue Analysis
Four-point flexural beam fatigue tests were performed on the PMLC specimens in accordance with AASHTO T 321, Determining the Fatigue Life of Compacted Hot-Mix Asphalt

5
(HMA) Subjected to Repeated Flexural Bending (AASHTO, 2013), in a pneumatic beam fatigue test apparatus. At least three replicate specimens were tested at three strain levels (minimum total of nine specimens) for each mixture type. All tests were conducted at 20ºC in the strain-controlled mode. Tensile strain levels from 300 to 750 microstrain were applied so that the relationships between strain and number of cycles to failure could be developed. During the test, repeated application of the specified strain was continued until failure occurred in the test specimen. Specimen failure was defined as the number of cycles at which beam stiffness degraded to 50% of the initial flexural stiffness. Cracking Analysis
The Texas overlay test (hereinafter “overlay test”) was performed to assess the susceptibility of each mixture to cracking. Testing was performed using a universal testing machine with a 25 to 100 kN loading capacity generally in accordance with TX-248-F, Test Procedure for Overlay Test (Texas Department of Transportation, 2013), on test specimens 150 mm in diameter with a minimum height of 38 mm. Test specimens were cut in pairs from the center of gyratory specimens that were 150 mm in diameter and 170 mm in height; care was taken to minimize any influence of an air void differential between the top and bottom of the specimen. Testing was performed at a temperature of 25 ± 0.5°C. Loading was applied for a total of 2,400 cycles or until a 93% reduction of the initial load was reached. It may be noted that the test jig used at the time of this study has been found to provide test results that are not comparable with those of other test jigs. All specimens, however, were tested using the same jig; thus, relative comparisons between the control and treatment are valid.
Surface Condition Survey at 15 Months A survey of pavement performance was conducted 15 months after paving commenced.
The test sections were visually observed, photographs were taken, and notes about current condition (e.g., any cracking) were recorded.
RESULTS AND DISCUSSION
Literature Review
Reflective cracking of asphalt overlays placed over jointed concrete pavements is of major concern in Virginia and nationally. Asphalt overlays may be used to help preserve the underlying concrete and enhance pavement ride quality, among other uses. When reflective cracks form in the asphalt overlay, they degrade ride quality and lead to premature pavement deterioration. Although there are many different mitigation techniques, such as slab fracturing, geo-fabrics, and stress-absorbing membrane interlayers, mitigation techniques that will provide a mechanism for crack delay without requiring major changes to typical asphalt mixtures, their placement, or the structural design of the pavement are of particular interest. One way to make minor changes is to use binder modifiers, such as asphalt rubber, polymer-modified asphalt binders, or HP binders. Von Quintus et al. (2007) studied polymer-modified test sections across

6
North America and found that polymer-modified asphalt binders extended the service life of asphalt pavements by reducing fatigue cracking, transverse cracking, and rutting.
Many of the previous studies that examined HP mixtures focused on applications in thin
asphalt structures or overlays in an effort to reduce the thickness of the pavement structure. A study completed at the National Center for Asphalt Technology in 2012 (Timm et al., 2012; Willis et al., 2012) compared the performance of an HP mixture and a mixture using traditional SBS-modified binder with 2.8% polymer loading. The study evaluated HP surface, intermediate, and base asphalt mixtures. The control section contained the traditional SBS-modified binder in the surface and intermediate layers and a non-polymerized asphalt base. The binder from the HP mixture was classified as a PG 88-22 binder, and the binder from the control SBS was classified as a PG 76-22 binder. The surface mixture had a 9.0-mm NMAS, and the intermediate and base mixtures had a 19.0-mm NMAS. Dynamic modulus test results showed that the HP additive had a far greater stiffening effect on the surface mixture than on the base mixture. The mixtures were evaluated for rutting by the Asphalt Pavement Analyzer and RLPD testing. The FN for the HP surface mixture was 4,825, which was significantly higher than the FN of 164 for the control SBS surface mixture. The increased FN indicated a reduced susceptibility to rutting. Cracking was evaluated by the beam fatigue test and the indirect tension creep compliance and strength test. Finally, moisture susceptibility was evaluated by the tensile strength ratio. The study concluded that the HP mixture had either passed all the mixture requirements along with the traditional SBS or had outperformed the traditional SBS-modified asphalt binder but that more research was needed on HP mixtures in the field. In the final report published in 2013, the authors noted that simplified viscoelastic continuum damage (S-VECD) fatigue testing in the AMPT showed that the HP base mixture had a fatigue life more than an order of magnitude greater than that of the control (Timm et al., 2013).
Mogawer et al. (2012) investigated an HP mixture in a high-performance thin overlay in
conjunction with warm-mix asphalt (WMA) technologies and high RAP contents. A high-performance thin overlay is considered a pavement preservation strategy and is defined as having a thickness of 1 in or less. Interestingly, the overlay test indicated that the HP mixtures failed sooner than the control mixtures, which the authors postulated might have been attributable to the high levels of strain induced in the mixtures, whereas the increased performance previously reported was at lower strain levels. The authors suggested that this was attributable to the increase in stiffness caused by the modification of the binders.
A later study by Mogawer et al. (2014) used an HP mixture in a high-performance thin overlay and documented the specification process and performance for projects in Vermont and New Hampshire. The overlay test values ranged from 1,000 to 2,000 cycles when RAP was included. Further, all mixture types met four-point flexural beam fatigue test criteria, which required 10,000 cycles or greater at 750 microstrain prior to failure. The field performance was positive with limited cracking.
7
Summary of Construction Documentation Project Information
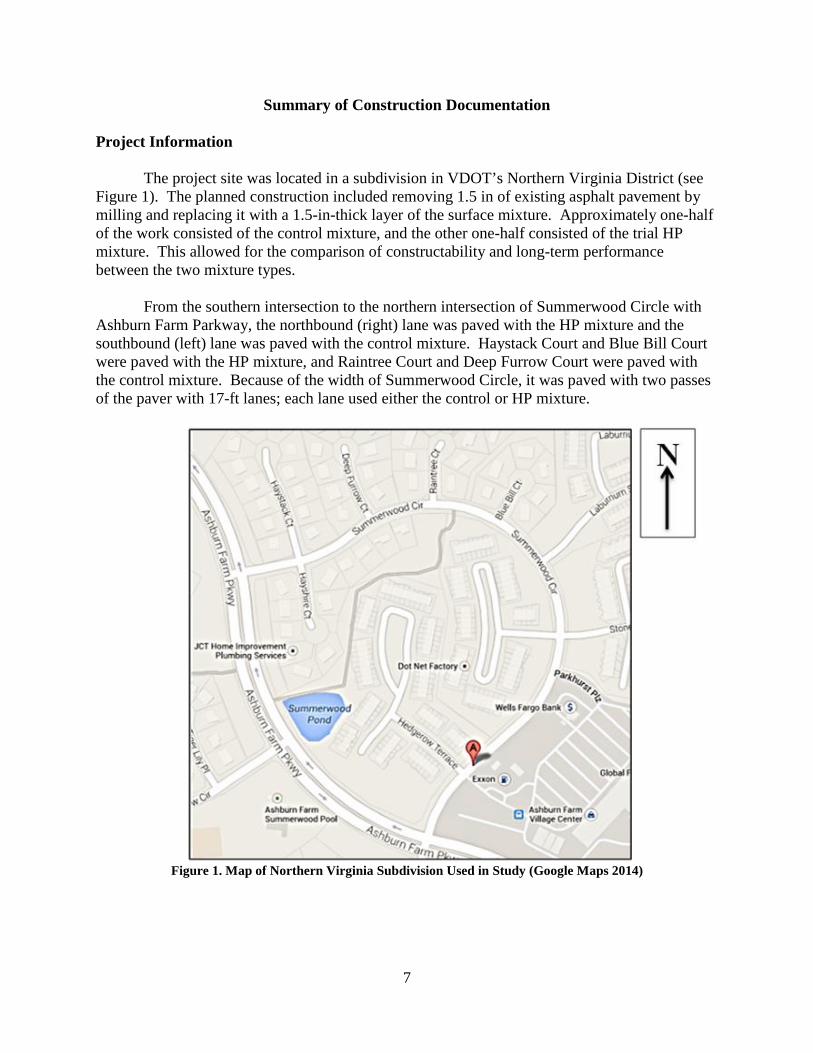
The project site was located in a subdivision in VDOT’s Northern Virginia District (see Figure 1). The planned construction included removing 1.5 in of existing asphalt pavement by milling and replacing it with a 1.5-in-thick layer of the surface mixture. Approximately one-half of the work consisted of the control mixture, and the other one-half consisted of the trial HP mixture. This allowed for the comparison of constructability and long-term performance between the two mixture types.
From the southern intersection to the northern intersection of Summerwood Circle with
Ashburn Farm Parkway, the northbound (right) lane was paved with the HP mixture and the southbound (left) lane was paved with the control mixture. Haystack Court and Blue Bill Court were paved with the HP mixture, and Raintree Court and Deep Furrow Court were paved with the control mixture. Because of the width of Summerwood Circle, it was paved with two passes of the paver with 17-ft lanes; each lane used either the control or HP mixture.
Figure 1. Map of Northern Virginia Subdivision Used in Study (Google Maps 2014)
8
Pre-Construction
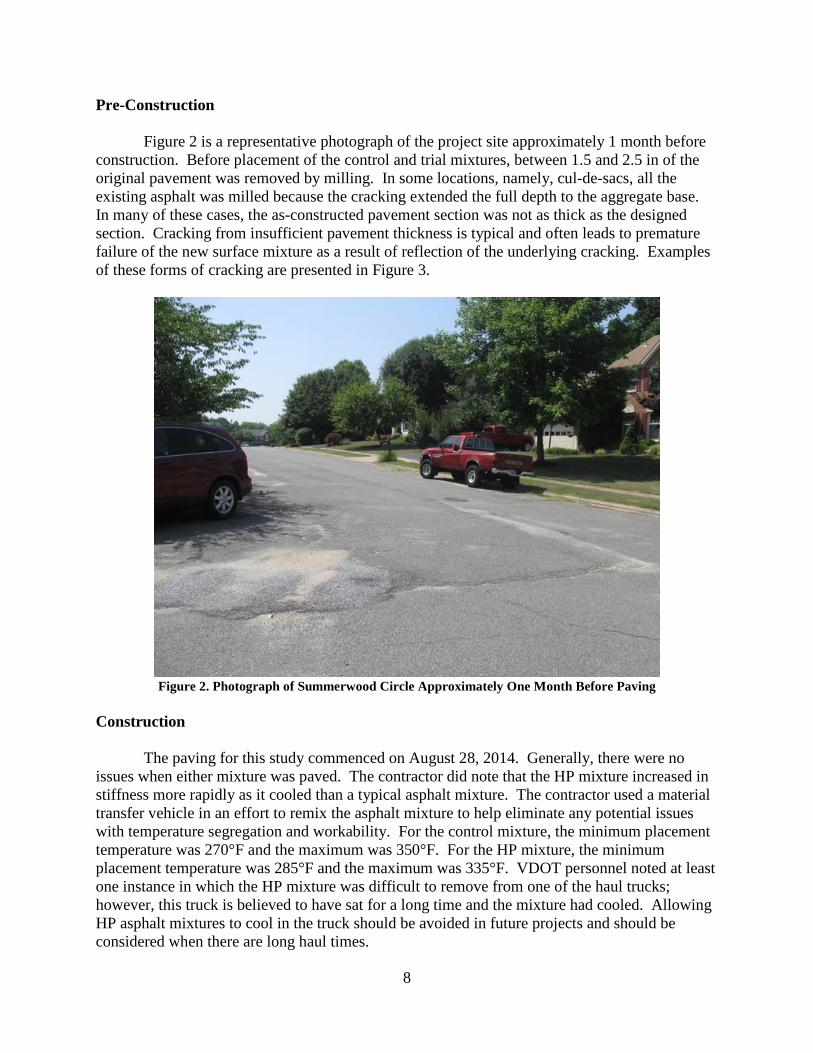
Figure 2 is a representative photograph of the project site approximately 1 month before construction. Before placement of the control and trial mixtures, between 1.5 and 2.5 in of the original pavement was removed by milling. In some locations, namely, cul-de-sacs, all the existing asphalt was milled because the cracking extended the full depth to the aggregate base. In many of these cases, the as-constructed pavement section was not as thick as the designed section. Cracking from insufficient pavement thickness is typical and often leads to premature failure of the new surface mixture as a result of reflection of the underlying cracking. Examples of these forms of cracking are presented in Figure 3.
Figure 2. Photograph of Summerwood Circle Approximately One Month Before Paving
Construction
The paving for this study commenced on August 28, 2014. Generally, there were no issues when either mixture was paved. The contractor did note that the HP mixture increased in stiffness more rapidly as it cooled than a typical asphalt mixture. The contractor used a material transfer vehicle in an effort to remix the asphalt mixture to help eliminate any potential issues with temperature segregation and workability. For the control mixture, the minimum placement temperature was 270°F and the maximum was 350°F. For the HP mixture, the minimum placement temperature was 285°F and the maximum was 335°F. VDOT personnel noted at least one instance in which the HP mixture was difficult to remove from one of the haul trucks; however, this truck is believed to have sat for a long time and the mixture had cooled. Allowing HP asphalt mixtures to cool in the truck should be avoided in future projects and should be considered when there are long haul times.

9
Figure 3. Milled Surfaces (left and right) and Typical Cracking (right). The image on the left shows the joint between passes of the paver from the original paving project, and the image on the right shows a typical transverse crack.
A non-tracking tack coat was used to bond the new overlay to the milled surface. The
target tack coat rate was 0.10 gal/yd2 based on the tack truck reading. However, the tack coat
rate appeared higher than what was expected and was reduced to one-half that rate to create a more realistic scenario for performance. For Haystack Court, the reduced tack rate was used. It is not yet known if the difference in tack rate will influence the long-term performance of the mixture. Although evaluating the impact of tack and bond on the performance of these mixtures was not within the scope of this study, if premature failures do occur, this information can be used as a consideration for forensic analysis.
Figure 4 shows the control and HP sections on Summerwood Circle. The pavement on either side of the longitudinal joint represents each of the sections. Based on visual observation, the sections looked identical. Figure 5 shows the different phases of the pavement operation.
Figure 4. Pavement Images of Control and Experimental Sections Where Sections Share a Common Longitudinal Joint

10
Figure 5. Each Phase of Paving Operation . Top left: pavement train; top right: material transport vehicle; bottom left: material transport vehicle feeding paver; bottom right: the roller.
Laboratory Tests of Mixture Specimens Mixture Volumetrics and Gradation
The control and HP mixtures were collected, and volumetric data were determined. Figure 6 displays the mixture gradations. Table 2 shows the job-mix formula and volumetric data computed for each mixture. From Figure 6 it can be seen that the gradations of the control and HP mixtures are similar despite their varying RAP contents. Table 2 shows that both the total and effective asphalt contents were higher for the control mixture than for the HP mixture. There was a notable difference in the asphalt content of the final paved mixtures: the control mixture had a total asphalt content of 5.49% and an effective binder content of 5.33%, and the HP mixture had a total asphalt content of 5.00% and an effective binder content of 4.75%. These differences must be taken into consideration when mixtures are compared. However, for the purposes of assessing constructability, laboratory performance, and initial field performance of two similar subdivision mixtures, as well as comparing them to those with traditional paving practices in VDOT’s Northern Virginia District, the comparison is reasonable.

11
Figure 6. Gradation of Control and HP Mixtures After Ignition Furnace Test. HP = high polymer.
Table 2. Volumetric Properties of Control and HP Mixtures
Property
Control JMF
HP JMF
As-Produced Control
As-Produced HP
Asphalt Content, % 5.2 5.30 5.49 5.00 Maximum Theoretical Specific Gravity, Gmm 2.685 2.647 2.708 2.700 Voids in Total Mix, VTM, % 4.0 3.7 1.9 3.1 Voids in Mineral Aggregate, VMA, % - - 15.6 15.2 Voids Filled With Asphalt, VFA, % - - 88.1 79.5 Fine Aggregate (FA) Ratio - - 1.26 1.32 Mixture Bulk Specific Gravity, Gmb - - 2.658 2.616 Aggregate Effective Specific Gravity, Gse - - 2.991 2.952 Aggregate Bulk Specific Gravity, Gsb - - 2.977 2.930 Absorbed Binder Content, Pba, % - - 0.16 0.26 Effective Binder Content, Pbe, % - - 5.33 4.75 Effective Film Thickness, Fbe, microns - - 8.7 8.0 HP = high polymer; JMF = job-mix formula; - = No values presented in the JMF. Asphalt Binder Characterization
Table 3 summarizes the PG grading and MSCR results of the binder testing. The HP and control binder were collected as tank samples. The in-service control binder and in-service HP binder were extracted from field cores and graded. The tank sample control binder was graded as a PG 64-22 binder. This grading did not reflect any binder addition from the 30% RAP in the control mixture, which is expected to raise the high temperature grade. The tank sample HP binder was specified as a PG 76E-28 binder (since revised to a PG 76E-28 [HP] binder), which would yield an expected grading as a PG 76-28 binder. However, this binder graded 6 degrees higher as a PG 82-28 binder, which can be attributed to the HP loading. A detailed report of the PG grading is provided in Appendix A.
19.012.59.54.752.361.180.600.300.150.0750
10
20
30
40
50
60
70
80
90
100
Perc
ent P
assi
ng (%
)
Sieve Size0.45 (mm)
Control Mixture
HP Mixture

12
Table 3. Binder Test Results
Test Tank Sample PG 64-22 (Control)a
Tank Sample PG 76E-28 (HP)a
In-Service Control
In-Service HP
Performance Grade 64-22 82-28 76-16 82-22 Multiple Stress Creep and Recovery (AASHTO T 350) Test Temperature, °C 64 76 64 76 Non-Recoverable Jnr0.1 kPa 2.646 0.03094 0.5975 0.2278 Average Recovery0.1 kPa, % 4.047 95.61 14.13 80.39 Non-Recoverable Jnr3.2 kPa 2.872 0.03183 0.6405 0.4566 Average Recovery3.2 kPa, % 1.39 95.44 9.309 62.75 Percent Difference, % 65.95 0.1741 34.13 21.94 Jnr, % 8.551 2.862 7.197 100.4 Jnr, = non-recoverable creep compliance. aOnly virgin binder was tested.
The most notable information provided in Table 3 is the average percent recovery at 3.2 kPa as provided by the MSCR test. For the tank sample control binder, the percent recovery was 1.39%, which is acceptable. However, the tank sample HP binder had a recovery of 95.44% when tested at 76°C because of the HP loading. The importance of this is outlined in Section 211.04 (e) of VDOT Supplemental Specification 211, which requires the non-recoverable creep compliance (Jnr) and percent recovery tests to be run at 76°C and also requires an elastic recovery of 90% or greater for HP binder. This is what distinguishes a highly elastic binder, such as HP binder, from other asphalt binders. The version of Section 211.04 (e) of Supplemental Specification 211 used in this project is provided in Appendix B, and the most recent version as of the publication of this report is provided in Appendix C.
Additional testing was conducted on in-service PMFC specimens collected from the project after 22 months of service. The in-service control binder graded as a PG 76-16 binder, which was stiffer than the tank sample control because of oxidative aging from plant production and the 30% RAP content. The in-service HP binder graded as a PG 82-22 binder. This was stiffer than the HP binder tank sample primarily because of aging during production, as the HP mixture contained only 13% RAP. The low temperature grade of the HP binder increased by 6 degrees when field-cored and tank samples were compared, and the average recovery at 3.2 kPa of the binder decreased from 95.44% to 62.75%. Although there was a reduction of more than 30%, a recovery value of 62.75% is still higher than that of the virgin control binder at 1.39% and the recovered in-service control binder at 9.31% (the control binder recovery increase was attributed to the presence of RAP binder, which may have a higher initial recovery). This means that after 2 years of aging, the binder remained more elastic than an unmodified binder. Generally, some polymeric material may break down over time because of oxidative aging. An assessment of whether the reduction in recovery for the HP binder has stabilized has not been conducted, although it is believed that stabilization will occur.
The binder master curves are provided for the tank-sampled control binder and HP binder in Figure 7. The HP binder was less susceptible to changes in temperature and frequency than the control binder with respect to the shear modulus. At higher temperatures, represented by the lower frequencies in the figure, the HP binder was stiffer than the control binder. However, at low temperatures, represented by higher frequencies in the figure, the HP binder was softer than the control binder. In addition, the HP binder had a higher phase angle at all frequencies, signaling the expected increased elasticity.

13
Figure 7. Dynamic Modulus and Phase Angle Master Curves for Virgin Control Binder and HP Binder. HP = high polymer.
One parameter used to define the rutting susceptibility of a binder is the ratio of the complex shear modulus, G*, to the sine of the phase angle, δ (G*/Sinδ), obtained using a DSR. The G*/Sinδ parameter of the Rolling Thin-Film-Oven (RTFO)–aged control binder was 3.548 kPa at 64°C. The HP binder had a G*/Sinδ of 6.045 kPa at 76°C, 12°C higher than that of the control binder. The control binder failed the rutting criterion of G*/Sinδ > 2.20 kPa at 70°C, but the HP binder passed with a G*/Sinδ of 2.20 kPa at 82°C and 88°C, finally failing at 94°C with a value of 2.107 kPa. This indicated that the HP binder was less susceptible to rutting than the control binder. The intermediate temperature cracking parameter, G*Sinδ, for the control binder was 4,126 kPa at 25°C, passing the intermediate temperature requirement of G*Sinδ < 5,000 kPa but failing the criterion at 22°C with a value of 5,802 kPa. The HP binder had a G*Sinδ of 4,447 kPa at 16°C but failed at 13°C, with a value of 6,316 kPa. This indicates that the HP binder should be more crack resistant than the control binder at intermediate temperatures. Regarding low temperature cracking, the control binder and the HP binder were tested at -18°C with the bending beam rheometer. The HP binder had a stiffness value (S) of 161 MPa and a creep value (M) of 0.332, which passed the bending beam rheometer criteria of S < 300 MPa and M > 0.300. The control binder had an S value of 407 MPa and an M value of 0.261, which failed both criteria at -18°C. This indicated that the HP binder should resist low temperature cracking better than the control binder. Additional binder data are provided in Appendix A.
14
Dynamic Modulus
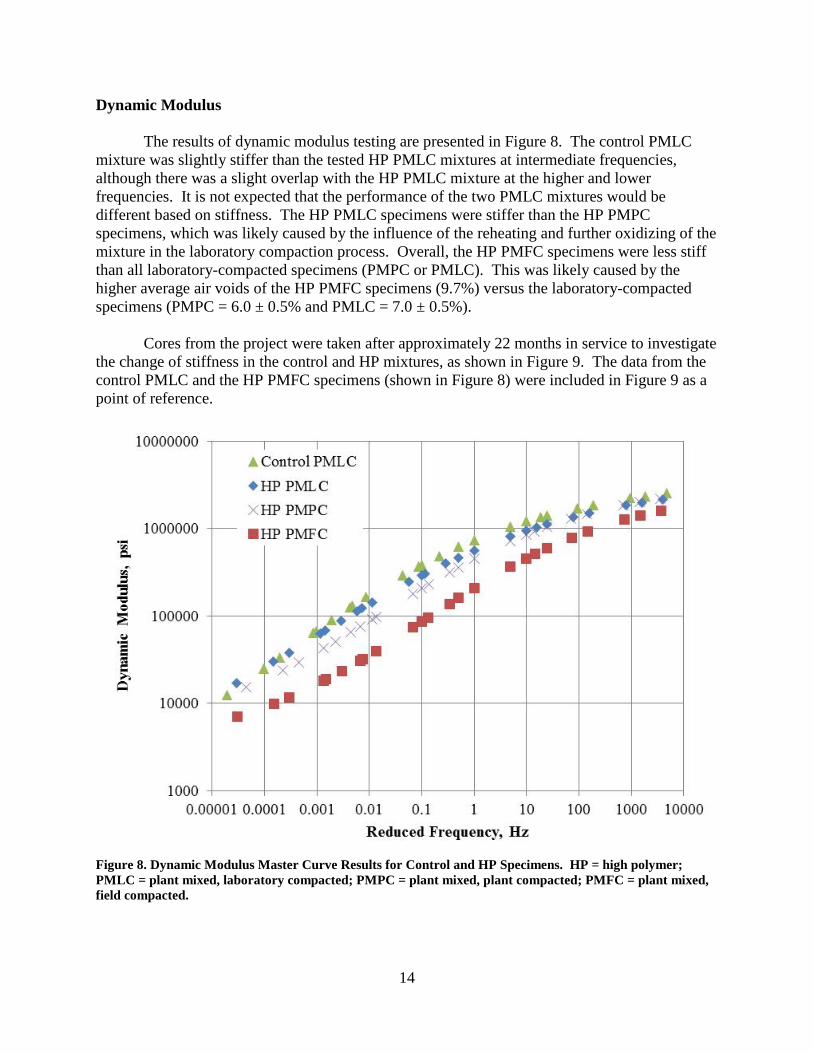
The results of dynamic modulus testing are presented in Figure 8. The control PMLC mixture was slightly stiffer than the tested HP PMLC mixtures at intermediate frequencies, although there was a slight overlap with the HP PMLC mixture at the higher and lower frequencies. It is not expected that the performance of the two PMLC mixtures would be different based on stiffness. The HP PMLC specimens were stiffer than the HP PMPC specimens, which was likely caused by the influence of the reheating and further oxidizing of the mixture in the laboratory compaction process. Overall, the HP PMFC specimens were less stiff than all laboratory-compacted specimens (PMPC or PMLC). This was likely caused by the higher average air voids of the HP PMFC specimens (9.7%) versus the laboratory-compacted specimens (PMPC = 6.0 ± 0.5% and PMLC = 7.0 ± 0.5%).
Cores from the project were taken after approximately 22 months in service to investigate the change of stiffness in the control and HP mixtures, as shown in Figure 9. The data from the control PMLC and the HP PMFC specimens (shown in Figure 8) were included in Figure 9 as a point of reference.
Figure 8. Dynamic Modulus Master Curve Results for Control and HP Specimens. HP = high polymer; PMLC = plant mixed, laboratory compacted; PMPC = plant mixed, plant compacted; PMFC = plant mixed, field compacted.

15
Figure 9. Dynamic Modulus Master Curve Results for In-Service Control and HP Specimens. HP = high polymer; PMLC = plant mixed, laboratory compacted; PMFC = plant mixed, field compacted.
The in-service HP PMFC mixture appeared to have aged in the field, as shown by an
increase in stiffness across all frequencies. However, a striking observation about this dataset is how closely the results from the laboratory PMLC specimens compared to those from the in-service PMFC specimens. This was attributed either to an average specimen air void reduction (the HP PMFC specimens had an average air void content of 9.7%, whereas the in-service HP PMFC specimens had an average air void content of 6.5%) or to the further aging in the field after 22 months. Figure 9 also shows that the in-service HP PMFC specimens had dynamic modulus values similar to those of the in-service control PMFC specimens following the trend of similar dynamic modulus values from the control PMLC and HP PMLC specimens, as shown in Figure 8. Repeated Load Permanent Deformation
The control PMLC and HP PMLC specimens were tested in the confined and unconfined conditions, and all other specimen types were tested only in the confined condition. Figure 10 shows the RLPD envelopes for the unconfined control PMLC and HP PMLC specimens. Each envelope encapsulates the highest deforming and lowest deforming specimens of the triplicate series. The control PMLC specimens reached a tertiary flow point earlier and at a higher total accumulated microstrain than that of the HP PMLC material. For each specimen, the FN, or point at which the curve crosses from a secondary flow state into a tertiary flow state, is indicated by filled diamonds in Figure 10. FN values are shown in Table 4.

16
Figure 10. RLPD Data Envelopes for Unconfined Control PMLC Mixtures and HP PMLC Mixtures. RLPD = repeated load permanent deformation; PMLC = plant mixed, laboratory compacted; HP = high polymer. For each specimen, the flow number, or point at which the curve crosses from a secondary flow state into a tertiary flow state, is indicated by filled diamonds.
Table 4. Flow Number and Subsequent Microstrain Values for Each Replicate for Unconfined Control
and HP Mixtures
Mix Type
Specimen Air Void Content
(%)
FN
Microstrain
Mean FN
FN SD
FN COV
Mean Microstrain
Microstrain SD
Microstrain COV
Control PMLC
7.5 901 28,474 1,145 242 21.1% 26,808 1,449 5.4% 6.5 1,384 25,843 7.4 1,151 26,108
HP PMLC
7.4 7,579 20,807 8,260 986 11.9% 23,539 3,394 14.4% 7.4 9,391 22,471 7.4 7,811 27,339
HP = high polymer; FN = flow number; SD = standard deviation; COV = coefficient of variation; PMLC = plant mixed, laboratory compacted.
The data presented in Figure 11 show the results of confined RLPD testing. Generally, there was overlap among all HP mixture specimens, with the HP PMPC specimens having the lowest total accumulated permanent strain. The reason the envelope for the PMPC specimens begins later in the sequence is that an alteration was made in the sampling frequency of the AMPT during testing. However, the test was not altered in any way other than with regard to the sampling frequency and the data are directly comparable to other data collected.

17
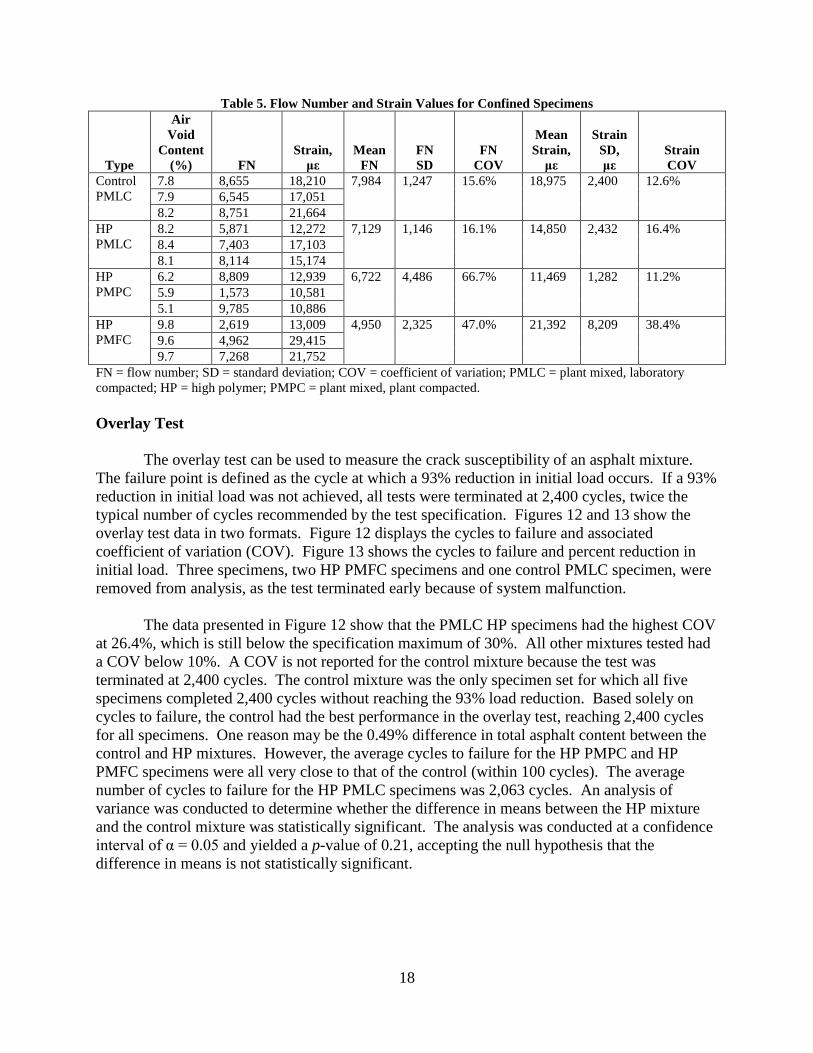
Figure 11. RLPD Data Envelopes for Confined Control PMLC Material and HP PMLC, Field-Compacted and Cored Mixtures. RLPD = repeated load permanent deformation; PMLC = plant mixed, laboratory compacted; PMPC = plant mixed, plant compacted; HP = high polymer; FN = flow number. The specimens from the control PMLC mixture had higher accumulated strains than all of the HP PMLC and HP PMPC specimens. Some of the HP PMFC specimens, however, did have a higher permanent deformation than those of all of the other mixtures. It is unclear why this difference existed, though it is likely due to the higher air voids in the specimens. Contrary to what was expected, those specimens with a higher air void content showed a lower accumulated strain than those with lower air void contents. Table 5 shows the FN and subsequent strain values for each mixture. Although the AMPT software calculates the FN based on apparent changes in the data, it is not clear based on visual observation whether the mixtures ever actually transitioned from a secondary flow state to a tertiary flow state.
18
Table 5. Flow Number and Strain Values for Confined Specimens
Type
Air Void
Content (%)
FN
Strain, με
Mean FN
FN SD
FN COV
Mean Strain, με
Strain
SD, με
Strain COV
Control PMLC
7.8 8,655 18,210 7,984 1,247 15.6% 18,975 2,400 12.6% 7.9 6,545 17,051 8.2 8,751 21,664
HP PMLC
8.2 5,871 12,272 7,129 1,146 16.1% 14,850 2,432 16.4% 8.4 7,403 17,103 8.1 8,114 15,174
HP PMPC
6.2 8,809 12,939 6,722 4,486 66.7% 11,469 1,282 11.2% 5.9 1,573 10,581 5.1 9,785 10,886
HP PMFC
9.8 2,619 13,009 4,950 2,325 47.0% 21,392 8,209 38.4% 9.6 4,962 29,415 9.7 7,268 21,752
FN = flow number; SD = standard deviation; COV = coefficient of variation; PMLC = plant mixed, laboratory compacted; HP = high polymer; PMPC = plant mixed, plant compacted. Overlay Test
The overlay test can be used to measure the crack susceptibility of an asphalt mixture. The failure point is defined as the cycle at which a 93% reduction in initial load occurs. If a 93% reduction in initial load was not achieved, all tests were terminated at 2,400 cycles, twice the typical number of cycles recommended by the test specification. Figures 12 and 13 show the overlay test data in two formats. Figure 12 displays the cycles to failure and associated coefficient of variation (COV). Figure 13 shows the cycles to failure and percent reduction in initial load. Three specimens, two HP PMFC specimens and one control PMLC specimen, were removed from analysis, as the test terminated early because of system malfunction.
The data presented in Figure 12 show that the PMLC HP specimens had the highest COV at 26.4%, which is still below the specification maximum of 30%. All other mixtures tested had a COV below 10%. A COV is not reported for the control mixture because the test was terminated at 2,400 cycles. The control mixture was the only specimen set for which all five specimens completed 2,400 cycles without reaching the 93% load reduction. Based solely on cycles to failure, the control had the best performance in the overlay test, reaching 2,400 cycles for all specimens. One reason may be the 0.49% difference in total asphalt content between the control and HP mixtures. However, the average cycles to failure for the HP PMPC and HP PMFC specimens were all very close to that of the control (within 100 cycles). The average number of cycles to failure for the HP PMLC specimens was 2,063 cycles. An analysis of variance was conducted to determine whether the difference in means between the HP mixture and the control mixture was statistically significant. The analysis was conducted at a confidence interval of α = 0.05 and yielded a p-value of 0.21, accepting the null hypothesis that the difference in means is not statistically significant.

19
Figure 12. Overlay Test Results With Subsequent COV. COV = coefficient of variation; NA = not applicable; PMLC = plant mixed, laboratory compacted; HP = high polymer; PMPC = plant mixed, plant compacted; PMFC = plant mixed, field compacted.
Examining the proximity to the failure criteria may yield insight into why the HP
mixtures failed at fewer cycles on average than did the control mixtures. The specification (TX-238-F) (Texas Department of Transportation, 2013) states that failure occurs at a 93% reduction in initial load, shown by the dashed line in Figure 13. Overall, the average reductions in initial load were as follows: control mixture specimens (five specimens), 90.9%; HP PMFC specimens (four specimens), 84.9%; HP PMPC specimens (six specimens), 85.0%; HP PMLC specimens (six specimens), 90.2%. For the HP specimens, each set had at least three specimens fail by termination of the test at 2,400 cycles rather than the initial load reduction. If the tests had not been terminated based on the number of cycles, the test for the HP specimens, on the basis of percent reduction in initial load, would have likely run longer than that for the control specimens.
Table 6 presents the initial and final overlay test loads for each mixture. An interesting
observation from Table 6 is that the HP mixtures have average initial loads from 332.9 lb to 550.8 lb and the control mixtures have an average initial load of 1,129.2 lb. The lesser initial load for the HP mixtures may be attributable to the increased elasticity and ductility of the binder as compared to the properties of the binder in the control. This finding is interesting in that the criterion for failure (93% reduction from initial load) defines failure of the HP mixture at a lower final load than that of the control mixture.
For example, the HP PMLC mixture had an average initial load of 540.2 lb, meaning that
the test termination point at 93% reduction was 37.8 lb. However, the control mixture had an average initial load of 1,129.2 lb, meaning the termination point was 79.0 lb, which is more than double the termination point of the HP PMLC mixture. Based on the termination point, the control mixture appears to be as crack resistant in the overlay test as the HP mixture. However, examining the proximity to the failure criteria (93% reduction in initial strength) indicates that the termination point (2,400) cycles may be a limiting factor. The COVs for the initial loads were relatively low with the exception of that for the HP PMFC mixtures; the COV for final load is not reported, as tests for many of the samples were artificially terminated when they reached 2,400 cycles.

20
Figure 13. Overlay Test Results With Subsequent Average Percent Reduction in Load. The error bars represent 1 standard deviation above and below the mean. The dashed line represents the 93% reduction in initial load failure criteria. PMLC = plant mixed, laboratory compacted; HP = high polymer; PMPC = plant mixed, plant compacted.
Table 6. Average Initial and Final Loads and Respective Coefficients of Variation for Overlay Testing
Mixture Average Initial
Load, lb Average Initial Load COV, %
Average Final Load, lb
Control PMLC 1,129.2 13.4 101.9 HP PMPC 550.8 10.3 79.8 HP PMLC 540.2 12.8 51.8 HP PMFC 332.9 26.6 45.0
COV = coefficient of variation; PMLC = plant mixed, laboratory compacted; HP = high polymer; PMPC = plant mixed, plant compacted; PMFC = plant mixed, field compacted. Beam Fatigue Test
Beam fatigue test results are summarized in Table 7. Beam fatigue specimens were fabricated from PMLC mixtures. Outlier analysis was conducted on each strain grouping for each material in accordance with ASTM E178, Standard Practice for Dealing with Outlying Observations (ASTM, 2016); one outlier was found among the HP mixture specimens and was excluded from further analysis. In addition to the outlier, one control mixture specimen had an air void content of 8.0%, which exceeded the 7.0 ± 0.5% test requirement; despite this discrepancy, the specimen test results did not meet outlier criteria so the specimen was included in the analysis. The two mixtures were tested at the same strain levels except for the lowest level, 300 microstrain. Initially, one HP mixture specimen was tested at 300 microstrain; however, the beam did not fail prior to the 10 millionth cycle at which the test stops. Thus, testing for the HP mixtures was continued at higher strain levels. Similar to the trend seen previously in the overlay test data, the HP mixture was again found to have lower initial stiffness upon loading, likely attributable to the increased elasticity of the binder.

21
Table 7. Fatigue Test Results Control Mixture HP Mixture
Strain Level, με
Initial Stiffness,
MPa
Cycles to Failure,
Nf
Specimen Air Voids,
%
Strain Level, με
Initial Stiffness,
MPa
Cycles to Failure,
Nf
Specimen Air Voids,
% 300 8,287 858,000 6.2 450 4,690 5,887,730 7.1 300 9,029 2,536,220 7.1 450 4,928 7,901,010 7.0 300 8,753 4,356,380 6.8 600 4,381 480,960 6.9 450 8,003 106,750 7.0 600 4,335 734,480 7.4 450 8,085 204,460 6.8 600 4,206 1,056,640 6.9 450 7,871 207,650 7.1 600 3,948 1,361,500 6.9 600 5,536 1,170 8.0 600 3,190 4,023,800 7.0 600 8,036 23,610 7.0 750 4,382 126,500 6.9 600 8,061 26,380 6.8 750 3,301 197,330 7.4 - - - - 750 3,872 239,590 7.2
Text in italics indicates outlier data.
Figure 14 shows the relationships of applied strain versus cycles to failure for the mixtures. The HP mixture was shown to have improved performance. In general, under the same applied strain, the HP mixture had a fatigue life approximately 40 to 50 times greater than that of the control mixture. To examine the implications of the difference, strain endurance limit predictions were calculated for each mixture using the methodology described in NCHRP Report 646, Appendix A (Prowell et al., 2010). The predicted endurance fatigue limits for the HP and control mixtures were 305 and 166 microstrain, respectively, which indicated that the HP mixture should perform very well in fatigue.
Figure 14. Fatigue Relationships Between the Control and HP Mixtures As a Result of the Beam Fatigue Test. HP = high polymer.
Control:Nf = 5E+25ε-7.773
R² = 0.8343
HP:Nf = 4E+25ε-7.093
R² = 0.9474
1,000
10,000
100,000
1,000,000
10,000,000
100 1000
Cyc
les
to F
ailu
re, 5
0% in
itial
stif
fnes
s
Strain, microstrain
Control
HP

22
15-Month Visual Survey
A visual survey was conducted on November 6, 2015. The entire section of pavement was “walked” by two VTRC researchers. There was no visible deterioration in the control or experimental sections. Figure 15 is a photograph of Summerwood Circle at the 1-year survey. To the left of the longitudinal joint is the control section; to the right is the HP section. One noticeable difference is that the HP section appears to have faded to a lighter gray color, although this does not appear to be of any detriment. To date, there is no explanation for the graying of the HP section.
The survey provided some encouraging findings with respect to field performance. The first is that a core was taken from the experimental section at the corner of Summerwood Circle and Blue Bill Court on the day of construction that showed a large crack in the subsurface asphalt material. This was noted as a location where reflective cracking would likely appear. The location was investigated during the 15-month survey, and there was no apparent reflective cracking. Further, the core hole was patched with the HP mixture. This patch did not appear to be raveling or show any signs of cracking, a problem that often occurs in patched core holes. Figure 16 shows images of the core that were taken during paving and the subsequent patched core hole from the 1-year survey.
Figure 15. Photograph Taken of Summerwood Circle on November 6, 2015, 15 Months After Completion of the Project. To the left of the longitudinal joint is the control section; to the right is the HP (high polymer) section.

23
Figure 16. Bottom of Core Taken at Construction Showing Cracked Underlying Pavement Structure Beneath Experimental Section (left) and Subsequent Core Hole and Patch After 15 Months in Service (right)
Another interesting finding from the survey was that the asphalt pavement around the water main access points did not show any signs of major deterioration. It is not uncommon for these locations to undergo premature raveling because of the amount of handwork required in these areas. Figure 17 provides an example photograph of a water main access point that was taken from the HP section during the 1-year survey. A majority of the water main access points were in the HP section as opposed to the control section.
Figure 17. Water Main Access Point in Experimental Section. Photograph taken during the 1-year survey.
Summary of Findings • The constructability of the HP mixture designated as an SM-9.5 mixture containing 13%
RAP and the SM-9.5A mixture containing 30% RAP was not observably different. The

24
major difference noted by the contractor included a lower margin of error for the HP mixtures with regard to the mixture cooling too fast. The contractor used a material transfer vehicle to help mitigate this issue.
• After approximately 15 months, the HP and control mixtures were performing satisfactorily. • Binder testing showed that the HP mixture was more elastic than the control binder mixture.
The minimum elastic recovery of 90% was easily achievable. • Dynamic modulus data indicated that the HP and control mixtures had nearly the same
stiffness when PMLC specimens were tested. • Dynamic modulus data indicated that the HP mixture as tested using road cores was less stiff
than laboratory-compacted specimens. This was attributed to the higher air void content of the road cores. This was further shown in the in-service HP PMFC specimens, which had an average decrease in air voids of 3.2% and an overall increase in stiffness similar to that of the HP PMLC specimens.
• RLPD testing showed that the HP mixture should perform better with regard to rutting than
the control mixture. • The overlay test showed that crack resistance was similar for the HP and control mixtures.
However, the HP mixture had an initial load of nearly one-half that of the control mixture, which was believed to be attributed to the increased elasticity and ductility of the mixture because of the presence of HP binder. This increased elasticity and ductility may lead to better field performance with respect to crack resistance. Using a failure criterion of 93% reduction from initial strength, the HP mixture was identified as having “failed” at a lower final strength than the control.
• Beam fatigue testing indicated that the HP mixture should have a longer fatigue life than the
control mixture. The HP mixture fatigue life was 40 to 50 times longer than that of the control mixture under the same applied strain. This is consistent with previously referenced research (Timm et al., 2012; Willis et al., 2012) that showed an increased fatigue life for HP mixtures.
• Endurance limit analysis showed that the strain endurance limit of the HP mixture was
approximately 1.8 times higher than that of the control mixture. • The short-term field performance of the HP trial section was promising, and laboratory
testing of field cores supported the expectation of long-term performance. The typical surface mixture represented by the control also has performed satisfactorily to date with no cracking.

25
CONCLUSIONS • HP surface mixtures can be produced and constructed using equipment available to
contractors. Care must be taken to ensure an adequate mixture temperature for placement and compaction purposes.
• The use of HP binder can increase the laboratory fatigue life of asphalt mixtures. • Cracking tests using the overlay test were inconclusive, although the high elasticity of the HP
binder is demonstrated by the reduction in the required load to mobilize the specimens constructed with HP binder compared to the specimens made with the control binder.
RECOMMENDATIONS 1. VDOT decision makers (e.g., the district materials engineer) should consider HP asphalt
mixtures as a tool for increased crack resistance. 2. VTRC and the VDOT districts with concerns about reflective cracking potential in asphalt
overlays should investigate the use of HP mixtures as a reflective crack mitigation layer. Specific testing over jointed concrete pavement is recommended.
BENEFITS AND IMPLEMENTATION
Benefits
The benefit of implementing Recommendation 1 is that HP asphalt mixtures can be used by VDOT in cases where a specialized crack-resistant mixture is required. This application can be a more cost-effective solution than traditional methods used to eliminate reflective cracking.
The benefit of implementing Recommendation 2 is that VDOT will begin to investigate
the potential for the placement of HP asphalt mixtures over jointed concrete pavements as a reflective crack mitigation technique.
Implementation
Recommendation 1 has already been implemented and is in Section 211, Asphalt
Concrete, of the 2018 specifications. Recommendation 2 has already been implemented as a part of VTRC’s Phase II study,
which is in progress. The Phase II study examines HP asphalt mixtures placed on I-95 and I-495 over jointed concrete pavement as a reflective crack mitigation treatment.

26
ACKNOWLEDGMENTS
The authors acknowledge the assistance of Samuel Rosser and Cory Zimmerman, University of Virginia; Troy Deeds, Donnie Dodds, and Benjamin Earl, VTRC; Ken Elliton, Sam DeLoche, Kim Snead, and Guido Zaga, formerly of VTRC; Trenton Clark, Virginia Asphalt Association; and the personnel at Superior Paving. The authors acknowledge Linda Evans, VTRC, for assistance with the editorial process. Tanveer Chowdhury, VDOT Maintenance Division; Rob Crandol, VDOT Materials Division; David Shiells, VDOT Northern Virginia District; and Michael Sprinkel, VTRC, served as the technical review panel for this study; in addition, Mary Bennett, VTRC; Sungho Kim, VDOT Materials Division; and Kevin Wright, VTRC, provided assistance.
REFERENCES American Association of State Highway and Transportation Officials. T 321, Determining the
Fatigue Life of Compacted Hot-Mix Asphalt (HMA) Subjected to Repeated Flexural Bending. Standard Specifications for Transportation Materials and Methods of Sampling and Testing, AASHTO Provisional Standards. Washington, DC, 2013.
American Association of State Highway and Transportation Officials. M 320, Performance-
Graded Asphalt Binder. Standard Specifications for Transportation Materials and Methods of Sampling and Testing, AASHTO Provisional Standards. Washington, DC, 2014a.
American Association of State Highway and Transportation Officials. T 164, Quantitative
Extraction of Asphalt Binder from Hot Mix Asphalt Method A. Standard Specifications for Transportation Materials and Methods of Sampling and Testing, Part 1: Standard Specifications and Standard Practices. Washington, DC, 2014b.
American Association of State Highway and Transportation Officials. T 170, Recovery of
Asphalt From Solution by Abson Method. Standard Specifications for Transportation Materials and Methods of Sampling and Testing, Part 2: Tests. Washington, DC, 2014c.
American Association of State Highway and Transportation Officials. TP 79, Standard Method
of Test for Determining the Dynamic Modulus and Flow Number for Asphalt Mixtures Using the Asphalt Mixture Performance Tester (AMPT). Standard Specifications for Transportation Materials and Methods of Sampling and Testing, Part 2: Tests. Washington, DC, 2014d.
American Association of State Highway and Transportation Officials. T 350, Standard Method
of Test for Multiple Stress Creep and Recovery (MSCR) Test of Asphalt Binder Using a Dynamic Shear Rheometer (DSR). Standard Specifications for Transportation Materials and Methods of Sampling and Testing, Part 2: Tests. Washington, DC, 2014e.

27
ASTM International. ASTM E178, 2016: Standard Practice for Dealing with Outlying Observations. West Conshohocken, PA, 2016.
Bowers, B.F., Diefenderfer, B.K., and Diefenderfer, S.D. Evaluation of Dynamic Modulus in
Asphalt Pavement Mixtures Utilizing Small-Scale Specimen Geometries. Journal of the Association of Asphalt Paving Technologists, Vol. 84, 2015, pp. 497-526.
Diefenderfer, B.K., Bowers, B.F., and Diefenderfer, S.D. Asphalt Mixture Performance
Characterization Using Small-Scale Cylindrical Specimens. VCTIR 15-R26. Virginia Center for Transportation Innovation and Research, Charlottesville, 2015.
Mogawer, W.S., Austerman, A.J., Kluttz, R., and Mohammad, L.N. Development and
Validation of Performance-Based Specifications for High-Performance Thin Overlay Mixture. In Application of Asphalt Mixture Performance-Based Specifications. Transportation Research Circular E-C189. Transportation Research Board, Washington DC, 2014, pp. 52-68.
Mogawer, W.S., Austerman, A.J., Kluttz, R., and Roussel, M. High-Performance Thin-Life
Overlays With High Reclaimed Asphalt Pavement Content and Warm-Mixture Asphalt Technology. Transportation Research Record: Journal of the Transportation Research Board, No. 2293, 2012, pp. 18-28.
Prowell, B.D., Brown E.R., Anderson R.M., Daniel J.S., Swamy, A.V., Von Quintus, H., Shen,
S., Carpenter, S.H., Bhattacharjee, S., and Maghsoodloo, S. NCHRP Report 646: Validating the Fatigue Endurance Limit for Hot Mixture Asphalt. Transportation Research Board, Washington, DC, 2010.
Texas Department of Transportation. Test Procedure for Overlay Test Tex-248-F. Effective
Dates: January 2009–October 2013. http://ftp.dot.state.tx.us/pub/txdot-info/cst/TMS/200-F_series/archives/248-80109.pdf. Accessed August 2, 2015.
Timm, D.H., Robbins, M.M., Willis, J.R., Tran, N., and Taylor, A. Field and Laboratory Study
of High-Polymer Mixtures at the NCAT Test Track—Interim Report. Report 12-08. National Center for Asphalt Technology, Auburn, AL, 2012.
Timm, D.H., Robbins, M.M., Willis, J.R., Tran, N., and Taylor, A. Field and Laboratory Study
of High-Polymer Mixtures at the NCAT Test Track—Final Report. Report 13-03. National Center for Asphalt Technology, Auburn, AL, 2013.
Tran, N., Turner, P., and Shambley, J. Enhanced Compaction to Improve Durability and Extend
Pavement Service Life: A Literature Review. Report 16-02R. National Center for Asphalt Technology, Auburn, AL, 2016.
Von Quintus, H.L., Mallela, J., and Buncher, M. Quantification of Effect of Polymer-Modified
Asphalt on Flexible Pavement Performance. Transportation Research Record: Journal of the Transportation Research Board, No. 2001, 2007, pp. 141-154.

28
Willis, J.R., Taylor, A., Tran, N.H., Kluttz, B., and Timm, D.H. Laboratory Evaluation of High Polymer Plant-Produced Mixtures. Journal of the Association of Asphalt Paving Technologists, Vol. 81, 2012, pp. 605-631.
29
APPENDIX A
BINDER GRADING TEST RESULTS
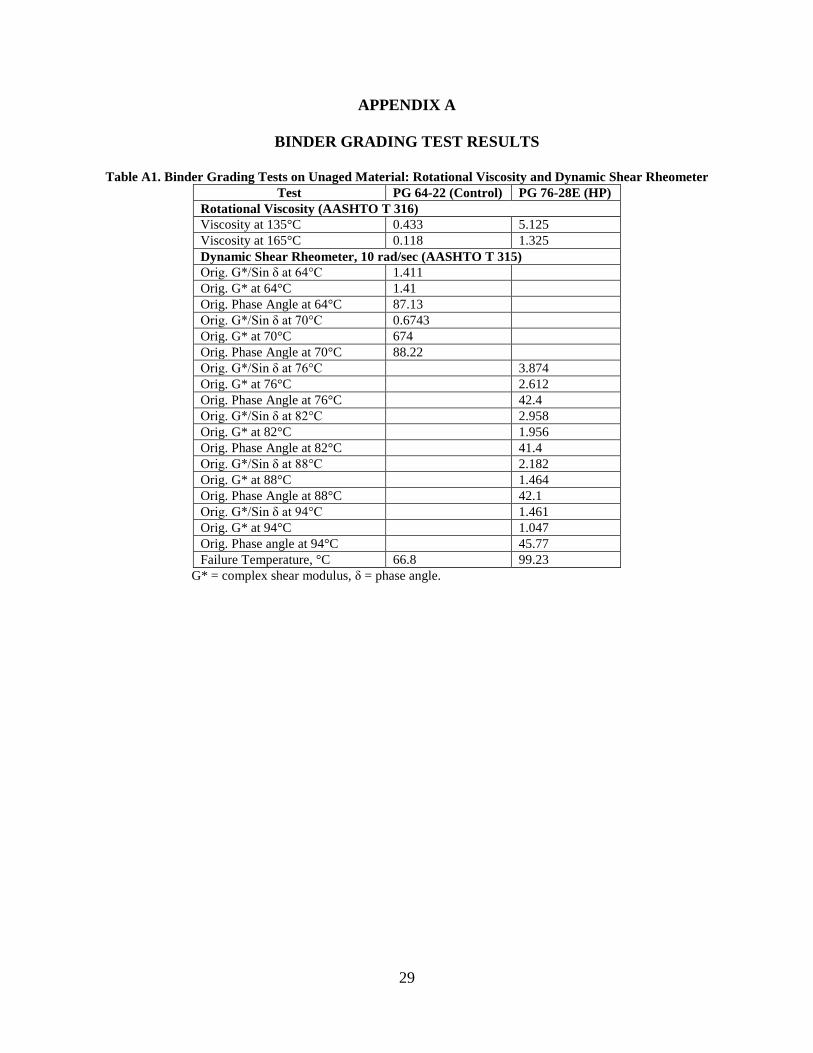
Table A1. Binder Grading Tests on Unaged Material: Rotational Viscosity and Dynamic Shear Rheometer Test PG 64-22 (Control) PG 76-28E (HP)
Rotational Viscosity (AASHTO T 316) Viscosity at 135°C 0.433 5.125 Viscosity at 165°C 0.118 1.325 Dynamic Shear Rheometer, 10 rad/sec (AASHTO T 315) Orig. G*/Sin δ at 64°C 1.411 Orig. G* at 64°C 1.41 Orig. Phase Angle at 64°C 87.13 Orig. G*/Sin δ at 70°C 0.6743 Orig. G* at 70°C 674 Orig. Phase Angle at 70°C 88.22 Orig. G*/Sin δ at 76°C 3.874 Orig. G* at 76°C 2.612 Orig. Phase Angle at 76°C 42.4 Orig. G*/Sin δ at 82°C 2.958 Orig. G* at 82°C 1.956 Orig. Phase Angle at 82°C 41.4 Orig. G*/Sin δ at 88°C 2.182 Orig. G* at 88°C 1.464 Orig. Phase Angle at 88°C 42.1 Orig. G*/Sin δ at 94°C 1.461 Orig. G* at 94°C 1.047 Orig. Phase angle at 94°C 45.77 Failure Temperature, °C 66.8 99.23
G* = complex shear modulus, δ = phase angle.
30
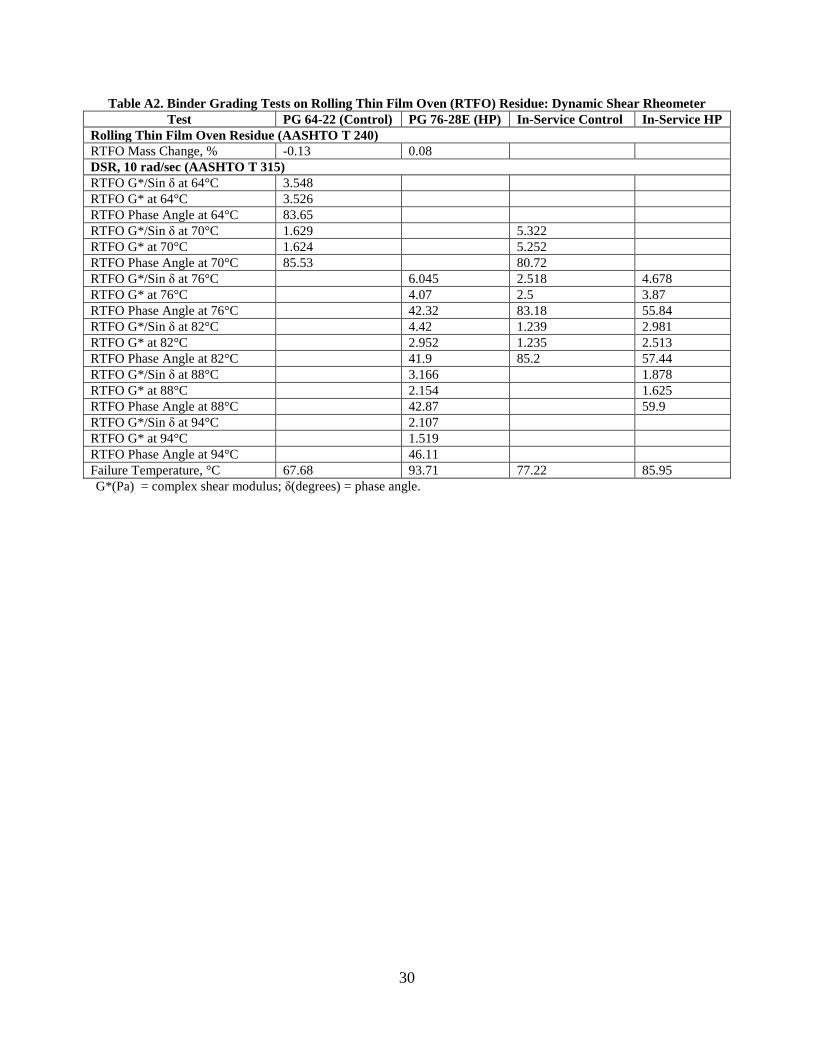
Table A2. Binder Grading Tests on Rolling Thin Film Oven (RTFO) Residue: Dynamic Shear Rheometer Test PG 64-22 (Control) PG 76-28E (HP) In-Service Control In-Service HP
Rolling Thin Film Oven Residue (AASHTO T 240) RTFO Mass Change, % -0.13 0.08 DSR, 10 rad/sec (AASHTO T 315) RTFO G*/Sin δ at 64°C 3.548 RTFO G* at 64°C 3.526 RTFO Phase Angle at 64°C 83.65 RTFO G*/Sin δ at 70°C 1.629 5.322 RTFO G* at 70°C 1.624 5.252 RTFO Phase Angle at 70°C 85.53 80.72 RTFO G*/Sin δ at 76°C 6.045 2.518 4.678 RTFO G* at 76°C 4.07 2.5 3.87 RTFO Phase Angle at 76°C 42.32 83.18 55.84 RTFO G*/Sin δ at 82°C 4.42 1.239 2.981 RTFO G* at 82°C 2.952 1.235 2.513 RTFO Phase Angle at 82°C 41.9 85.2 57.44 RTFO G*/Sin δ at 88°C 3.166 1.878 RTFO G* at 88°C 2.154 1.625 RTFO Phase Angle at 88°C 42.87 59.9 RTFO G*/Sin δ at 94°C 2.107 RTFO G* at 94°C 1.519 RTFO Phase Angle at 94°C 46.11 Failure Temperature, °C 67.68 93.71 77.22 85.95 G*(Pa) = complex shear modulus; δ(degrees) = phase angle.
31
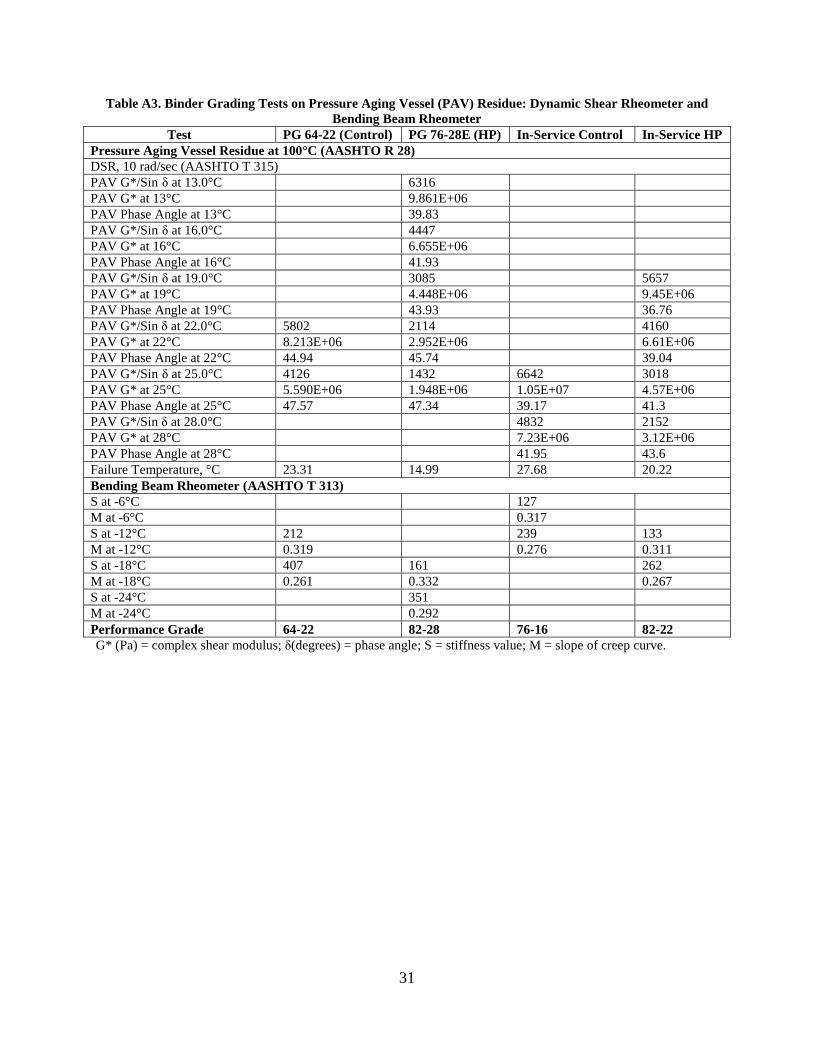
Table A3. Binder Grading Tests on Pressure Aging Vessel (PAV) Residue: Dynamic Shear Rheometer and Bending Beam Rheometer
Test PG 64-22 (Control) PG 76-28E (HP) In-Service Control In-Service HP Pressure Aging Vessel Residue at 100°C (AASHTO R 28) DSR, 10 rad/sec (AASHTO T 315) PAV G*/Sin δ at 13.0°C 6316 PAV G* at 13°C 9.861E+06 PAV Phase Angle at 13°C 39.83 PAV G*/Sin δ at 16.0°C 4447 PAV G* at 16°C 6.655E+06 PAV Phase Angle at 16°C 41.93 PAV G*/Sin δ at 19.0°C 3085 5657 PAV G* at 19°C 4.448E+06 9.45E+06 PAV Phase Angle at 19°C 43.93 36.76 PAV G*/Sin δ at 22.0°C 5802 2114 4160 PAV G* at 22°C 8.213E+06 2.952E+06 6.61E+06 PAV Phase Angle at 22°C 44.94 45.74 39.04 PAV G*/Sin δ at 25.0°C 4126 1432 6642 3018 PAV G* at 25°C 5.590E+06 1.948E+06 1.05E+07 4.57E+06 PAV Phase Angle at 25°C 47.57 47.34 39.17 41.3 PAV G*/Sin δ at 28.0°C 4832 2152 PAV G* at 28°C 7.23E+06 3.12E+06 PAV Phase Angle at 28°C 41.95 43.6 Failure Temperature, °C 23.31 14.99 27.68 20.22 Bending Beam Rheometer (AASHTO T 313) S at -6°C 127 M at -6°C 0.317 S at -12°C 212 239 133 M at -12°C 0.319 0.276 0.311 S at -18°C 407 161 262 M at -18°C 0.261 0.332 0.267 S at -24°C 351 M at -24°C 0.292 Performance Grade 64-22 82-28 76-16 82-22 G* (Pa) = complex shear modulus; δ(degrees) = phase angle; S = stiffness value; M = slope of creep curve.

32
Table A4. Binder Grading Tests on Rolling Thin Film Oven (RTFO) Residue: Multiple Stress Creep and Recovery
Test PG 64-22 (Control) PG 76-28E (HP) In-Service Control In-Service HP Multiple Stress Creep and Recovery (AASHTO TP 70) Test Temperature, °C 64 76 64 76 Non-Recoverable Jnr0.1 kPa 2.646 0.03094 0.5975 0.2278 Average Recovery0.1 kPa,, % 4.047 95.61 14.13 80.39 Non-Recoverable Jnr3.2 kPa 2.872 0.03183 0.6405 0.4566 Average Recovery3.2 kPa,, % 1.39 95.44 9.309 62.75 Percent Difference, % 65.95 0.1741 34.13 21.94 Jnr, % 8.551 2.862 7.197 100.4 Jnr = non-recoverable creep compliance.

33
APPENDIX B
SECTION 211.04 (e) OF SUPPLEMENTAL SPECIFICATION 211 (USED IN THIS PROJECT)
SPECIFICATIONS Section 211.04 (e) of Supplemental Specification 211—Asphalt Concrete is amended to add the following: Type E(HP) asphalt mixtures shall consist of mixes incorporating a neat asphalt material with a high polymer modification (approximately 7.5%) complying with the requirements of AASHTO MP 19 for PG 76–28E with the exception of Multiple Stress Creep and Recovery (MSCR), TP 70, which shall have a Jnr3.2 maximum value of 0.1 kPa-1. A minimum MSCR elastic recovery of 90% is also required. The MSCR elastic recovery test shall be run at 76°C. The preferred viscosity is less than or equal to 3.0 Pa-s, however the viscosity limit may reach as high as 5.0 Pa-s if the binder supplier and contractor can agree on suitable workability. HP designated mixtures shall not contain more than 15 percent reclaimed asphalt pavement (RAP) material.

34
35
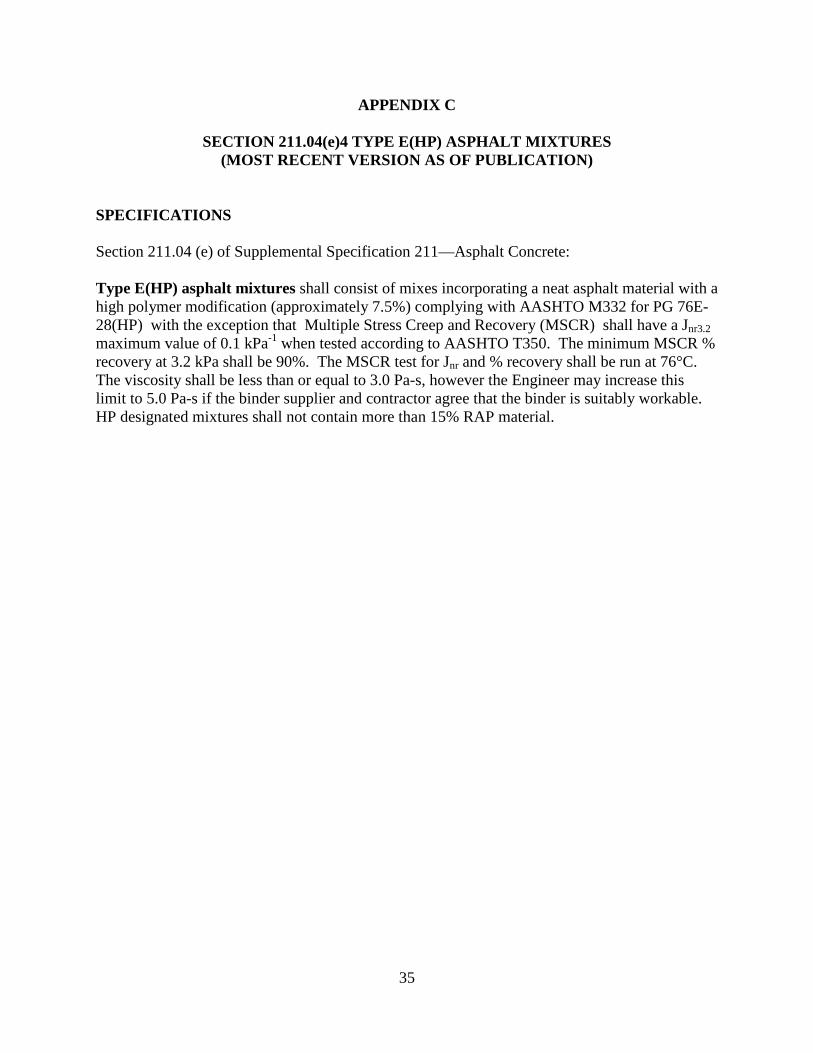
APPENDIX C
SECTION 211.04(e)4 TYPE E(HP) ASPHALT MIXTURES (MOST RECENT VERSION AS OF PUBLICATION)
SPECIFICATIONS Section 211.04 (e) of Supplemental Specification 211—Asphalt Concrete: Type E(HP) asphalt mixtures shall consist of mixes incorporating a neat asphalt material with a high polymer modification (approximately 7.5%) complying with AASHTO M332 for PG 76E-28(HP) with the exception that Multiple Stress Creep and Recovery (MSCR) shall have a Jnr3.2 maximum value of 0.1 kPa-1 when tested according to AASHTO T350. The minimum MSCR % recovery at 3.2 kPa shall be 90%. The MSCR test for Jnr and % recovery shall be run at 76°C. The viscosity shall be less than or equal to 3.0 Pa-s, however the Engineer may increase this limit to 5.0 Pa-s if the binder supplier and contractor agree that the binder is suitably workable. HP designated mixtures shall not contain more than 15% RAP material.