Embed Size (px)
Citation preview

5. C.R. Rao. Linear Statistical Inference and Its Applications, 2nd ed. Wiley, New York, 1973.
6. C.R. Rao and S.K. Mitra. Generalized I nverse of Matrices and Its Applications. Wiley, New York, 1971.
7. SAS User's Guide: Statistics. SAS Institute, Inc., Cary, N.C., 1982.
8. The IMSL Library. IMSL, Inc., Houston, Texas, 1982.
9. J. Horowitz. Specification Tests for Probabilistic Choice Models. Transportation Research, Vol. 16A, 1982, pp. 383-394.
7
10. J.L. Horowitz. Evaluation of Usefulness of Two Standard Goodness-of-Fit Indicatot"s fo.r Comparing Non-Nested Random Utility Models. !!!. Transportation Research Record 874, TRB, National Research Council, Washington, o.c., 1982, pp. 19-25.
11. A. Wald. Tests o f Statistical Hypotheses Conce.rning Several Parameters When the Number of Observations Is Large. Transactions of the American Mathematical Society, Vol. 54, 1943, pp. 426-487.
Evaluation of Heuristic Transit Network Optimization
Algorithms
KAY W. AXHAUSEN and ROBERT L. SMITH, JR.
ABSTRACT
Changes in urban land use and travel demand have created the need to restructure many existing mass transit networks. Heuristic network optimization as one of the available methodologies to improve transit networks is described. The characteristics and results of the algorithms developed in Europe are summarized and a short description of the 1\merican algorithms is given. The potential for applying network optimization methodologies in the conte.xt of small to mediums ·ized Arner ican cities is evaluated. The review and evaluation of 13 heuristic methodologies revealed a wide range of approaches that are generally theoretically sound, have reasonable potential for gene rating improved networks, and are computationally and otherwise feasible. Application of an unproven new algorithm by Mandl to the bus network for Madison, Wisconsin, and the light .rai l network for Duesseldorf, West Germany, showed that a fairly complex heuristic al.gor ithm can be implemented quickly and easily. Mandl' s a.19orithm, however, did not generate an improved network, primarily because the initial computer-generated network does not follow demand. Better results were obtained with two other heuristic methodologies that have been applied to the Duesseldor f netwoi:k. The Madison and Duesseldor f applications form the basis for recorrunendations for further improvement of heuristic methodologies.
The bus transit networks that are the predominant form of public transit in American cities have
changed only slowly since the elimination of the streetcar in the 1930s and 1940s. Often the major bus lines still run on the same streets that the streetcars used. Because of the major shifts in population and employment that have occurred in recent years, the bus networks in many cities could probably be restructured to serve the existing demand better and reduce operating costs at the same time. Transit managers are often reluctant to make major changes in routes because of the almost ce.r tain political opposition by those who think they will receive poorer service. Also, transit managers generally do not have analytical tools readily available to aid them in generating and evaluating alternative networks. As the result of the current fiscal crisis in transit, transit managers should be more interested in methodologies for restructuring their bus networks.
Chu.a and Silcock Ill identify six methodologies for transit network restructuring and optimization: manual approach using service standards and guidelines, systems analysis using sta·ndard travel demand and trip assignment models, market analysis using manual trip assignment for coi:ridors or small service areas, systems analysis with interactive graphics, heuristic procedures, and mathematical optim.ization. The first three methodologies are limited by the number of alternative networks that can be evaluated in a reasonable amount of time. By adding interactive graphics to systems analysis, network development and evaluation are greatly enhanced. Many more networks can be tested in much less time. The methodology, however, tends to be biased toward the existing network, so unconventional solutions may not be examined. Furthermore, there is no guarantee that solutions near the optimum will be f ound.
In contrast, mathematical optimization using linear programming or general integer programming will produce an optimal network within the specified
8
constraints and should not be biased toward the existing network. Mathematical optimization, however, is limited by the computational requirements to relatively small networks. Even with the recent advances in the speed and memory size of computers, networks are limited to about 70 or 80 nodes, which results in a coarse network for bus systems in larger urban areas. A network of 70 nodes may be adequate foi rail systems in larger urban areas or bus systems in small to medium-sized urban areas.
Heuristic methodologies bridge the gap between systems analysis with interactive graphics and the mathematical optimization methodologies. The heuristic methodologies utilize systematic procedures to generate and improve transit networks. The complexity of the overall problem is reduced by breaking it into manageable components. Within each component a good and sometimes optimal solution is obtained. The complexity and computational requirements are further reduced by 1 imiting the amount of interaction among the components. Because the heuristic networks are machine generated, many more network s can he evaluated and ·they are less likely to be biased by the existing networ ks. Although the heuristic methodologies de> not guarantee an optimum network, the starting conditions and other parameters can be varied to increase the chances that the true optimum that would be obtained from mathematical optimization is included in the range of networks considered. All the network evaluation procedures are constrained by the accuracy of the demand estimates and the simplification of the complex itie s of the transit network as it exists in a dynamic real world. Thus, even mathematical optimization procedures will only provide an indication of potential network improvements. Good heuristic methodologies will provide similar directions for network improvements.
In the past two decades a number of heuristic network optimization methodologies have been developed and applied in European cities to estimate possible means of restructuring both bus and light rail networks. In contrast, in the United States only one heuristic approach to transit network restructuring has actually been tested (~) and none of the European methodologies have been tested here. It must be noted, however, that there are no reports in the literature of the results of implementing the network improvements and comparing the predicted with the actual network performance. The overall purpose of this paper is to evaluate the potential for applying heuristic net.work optimization methodologies to improve transit networks in small to medium-sized American cities. The evaluation is limited to small to medium-sized cities because realistic networks for large cities would require prohibitive amounts of computer time. In achieving the overall purpose first, the literature on heuristic methodologies is reviewed and the available algorithms are analyzed in terms of their inherent potential for generating improved networks. The performance of these algorithTM that have been applied to actual transit networks is also analyzed. Next, one of the available heuristic algorithms is selected for testinq on an Ameril',;•n l'r;!!!'Oi': !'!~':~::::::!;.
The results of the American application are documented and evaluated. The same heuristic algorithm is also applied to a European transit network for which the results of the application of two other heuristic algorithms are available. The comparison of the performance of the heuristic algorithm in the two cities and with the two other algorithms provides the basis for recommendations for additional research on heuristic algorithms.
Transportation Research Record 976
REVIEW OF THE LITERATURF.
American Literature
In the United States work on the transit network restructuring and optimization problem has focused on the appl ication of systems analysis with interactive g raphics . Most of the work has used Rapp's Interactive Graphics Transit Design System ( IGTDS) or the more recent Interactive Graphics Transit l'letwork Optimization System (TNOP) (3-6). An enhanced version of TNOP has been applied-to transit network development in Washington, D.C.; Jacksonville; Baltimore; and Buffalo <ll·
The American experience with heuristic network optimization is limited to research by Rea (8), Sharp (~) , and Hsu and Surti <2.-ll>. Rea's service specification model assigns generalized modes to appropriate links by using a small base network, a fixed demand, and a 1 ink service level function in which headways (and the resulting wait time) are a fu nction Of link volumes. Rea 's algorithm uses an iterative procedure in which a minimum-time- path ass ignment is followed by adjustment of link service levels to correspond with link volumes. Even for the small test network, convergence to equilibrium conditions was sometimes a problem.
Sharp ' s iterative route-structuring algorithm is formulated as a multicommodity transshipment problem in which each commodity is repr esented by un ique travel demands for each origin and destination node pair. The objective is to minimize the sum of passenger travel and de.lay time costs and vehicle amodtization and operati1ig costs while satisfying the travel demands. The algorithm was applied to the Columbus, Georgia, bus network. The improved bus network provided a 5 percent reduction in trip time s for the base r idership and generated a 9 percent increase in ridership while increasing vehicle costs by only 3 percent.
Hsu and Sur ti's decomposition approach to bus network design uses a minimum-time-path algorithm to identify an initial set of routes between manually identified route origins and destinations. Incremental changes in route alignments are accepted if route ridership is increased. In the application to a 59-node bus network for a portion of the Denver urban area, the changes in route alignment were made manually; however, the aigorithm to select nodes in the vic inity of the shortest path in searching for improved routes no doubt could be computerized. The model is limited to providing local optima within the corridors defined by the initial route specification. Evaluation of alternative combinations of routes requires manual specification of those combinations.
European Literature
The European research on heuristic network optimization includes 10 studies ranging from Nebelung's in 1961 to Sahling's in 1981 (12-26). Because almost all of the studies are the result of consultinQ '"':':::"~ . ':!:::; ;; "°"l' ;,., more, yet unpublished algorithms. Except for Hasseistroem's approach, which is part of the Volvo Corporation's transportation planning package, none of the approaches appears to have been applied more than once.
Rather than review each of the 10 studies in d etail , the key features of the algor ithms are outlined and compared in terms of a three-step overall procedure that is common to nearly all of the algorithms (see Tables l and 2) • Only two of the algo-

Axhausen and Smith 9
TABLE I Characteristics of Early European Heuristic Network Optimization Algorithms
Author: Nebelung ( 196 1 J
Lacnpk ln ( 1967)
S Uman ( 197~)
Hoidn (197~)
Rosello (197 61
Step 1 -B3so Ne~work Construction De3l£11Cd Cor: LRT Bus Bu3 Bu~/LRT Bus
(Radial ) (R ad ial) (RaMal) llodes are: inter sect Io ns Zones Zones Zone" 'Zones lletwork• Based on : Terminal• Skeletons Skeletons Terminal•
Step 2--Inltial Line De velopme nt and Selection Line Constraints:
1) Pair All re as Ible All All lines Start v i th link & add nod es
selected terminals
2) Select completr~
lines
skeletons
l.ine -l .2'shortest Omlt Constraints: path infeasible
-Serve al l .ske leton3 l lnks
Line Hax. dlreot -Psgr . mi les Objectives: trips -line length
skeletons to center
Long th - 1.3 • Max. no. or shortest routes path (dist)
-1. 1.p• node-to-node min. th
Avg. total cost
-no. of nodes - intersect lng
llnca Step !letwork Dave!opment/lmprovement
Procedure: None Add node• 1) ~dd nodes I) SelecL -AdU nodes
ObJt!ct I ves:
Cons tr a lnt•:
Frequency Optimization: No
Ueer Exteno Ive Involvement: (terminal
select ion)
to be• t skeletons
See Step Z
Increase tn travel time max. of SOS
External
lnltl~l
to best skeleton to form line
2) Update 1 ist of best s ke le tons
3) Go to I Psgr. minute/ route length
lllix . or 5 l lnes added per run Max. or 100 be•t skeletQns
Yes-user .'3elects lines lnl t!al & frequency optimization
complete 1 in es
2) Delete demand as l lnes are added
Psgr.- mLles we lghted by directness of routing & use of l!no
No
Initial
-Delete nodes and 1 in es of 2 nodes
Avg. total cost/psgr.
External
No
aConnection o f logical adjacent nodes to form a web-like network.
rithms lack any of the three steps. The steps follow a logical progression from base network construction in step l to initial line development and selection in step 2. I n general, a large set of feasible lines is identified in step 2, from which an optimum set is selected in step 3 based on the specified objective function and constraints . In some cases additional lines are generated in step 3 . Also, the initial networks may be modified systematically in various ways to generate improvements as measured by the objective function .
All but one of the algol'.ithms use minimum time paths to identify node-to-node paths for creating lines or assigning demand to links or both . Sonntag uses a multipath assignment to create a loaded spider network as the basis for initial line development and selection in step 2 . !n a spider network adjacent nodes (zones) are connected to form a weblike network. 'Rosello uses an all-or-nothing assignment to create a loaded spide.i; network, The advantage of loaded spider networks is that no constraints are placed initially on the ultimate pattern of lines, but the number of possible 1ines is larg·e. Dubois solves the problem in part by using an initial assignment and cost constraints to reduce
the size of the base network. The mo.re common means of reducing the number of lines considered is to require that terminals, ring lines, or skeletons be specified. Ring 1.ines specify three nodes--the terminals and an intermediate node--as the starting point for developing a circular or ring line. Skeletons add a second intermediate node as the bas is for a linear line.
I n step 2 the initial line development procedure is with one exception based on eithec a loaded spider network or specification of nodes (terminals, etc.). With the spider network an objective .function and constraints are applied to the loaded links either in pairs (Sonntag) or inccementally as nodes are added (Rosello) • When terminals and so on are specified , the most common approach to generating a feasible set o f pase lines is to expand the minimumt ime-path connections between the terminals to include all lines that are longer than the minimum time path by up to a specified percentage, usually 20 or 30 percent. The idea is to reduce computing times to a manageable level while sti11 providing a range of lines that includes the optimal or nearopt imal network. l.ampkin a·nd Mandl, however, only consider minimum-t ime-path lines between terminals
10 Transportation Research Record 976
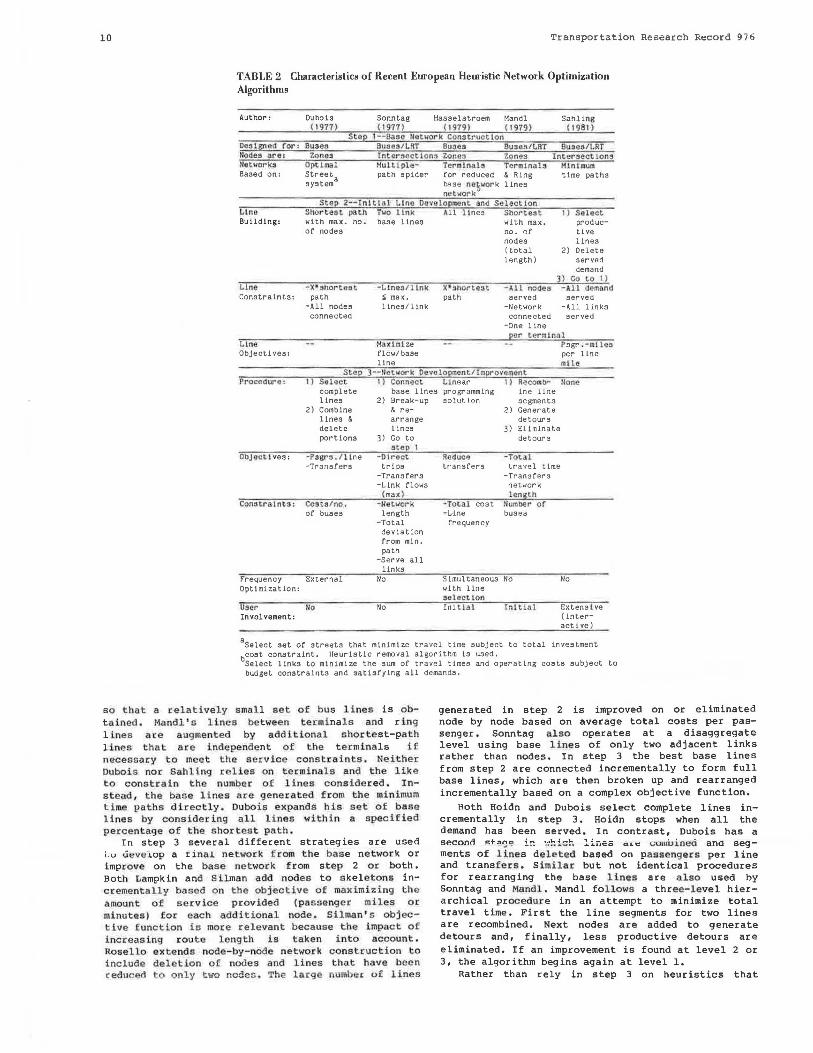
TABLE 2 Characteristics of Recent European Heuristic Network Optimization Algorithms
Author: Dubois ( 1977)
Sonntag Hasselstroem Mandl Sahling ( 19Bt) (1977) (1 979) (1979)
Stop 1 ·-Baae Network C.onstruot Ion Designed ror: Buses 9uses/LRT Bu3eo Bus"3/l..RT Bu•es/LRT Node• are: 7.ones Inter•ect Ion• Zonu 7.Qnos Inceraeet Ions tle~works Opt I rnal ttultlple- Terminals Terminals Mlnl10um Based on: Street
system3
path spider for reduced & Ring base neswork lines network
time paths
Step 2--Inll:. i111 Line Develo!l"'ent and Selection Line Building:
Shortest path Two llnk All Unes Shortest I) Select with max. no. base lines with max. produc-of nodes no. of
nodes (total length)
ti ve lines
2) Delete served demand
3) CO to I) Line - x•shortan t ·t.1nc3/llnk X••hortest -All nodes - Ali demand Constraints: path S max. path served served
Line Objectives:
-All nodes connected
lines/link
Maximize flow/base line
-Network -All links connected served
-One line Por term~ nal
Psgr . -rn11eo per l lne '" Ile
Step 3- lletwork Davolopincntltmprovement Procedure: I) Sel ect
complete lines
2) Combine lines & delete portions
I) Connect base lines
2) Break-up & re-arrange lines
3) Go to 3tep I
Objecti ves: -Psgrs./llne - Dlrect -Transfers trips
-Transfers -Llnk flows
(max) Com1tra ln ts : Costs/no . - //etwcrk
of buses length
Frequency External Optimization:
User No Involvement :
-Total deviation from min. path
-Serve all links
No
No
Linear I ) Re comb-programming lne line soll1tlon segments
2) Generate detours
3) Eliminate detours
Roduc'l -Total transfers travel time
-Transfers network len th
· Total cost II umber or -:-L·lne buses
rrequency
s 1mul taneous No with line select Ion Ini t!al !nl tlal
!lone
No
Ext ens t ve (interact 1 ve)
8Select set or streets that minimize travel time subject to total investment
beast constraint. Heuristic removal algorithm ls used. Select links to minimize the sum of travel times and operating costs .subject to budget constraints and satisfying all demands.
s o that a relatively small set of bu s lines is obt ained. Mandl's lines betwee n terminals and ring l ines are augmented by additional shortest-pa th lines that are independent of the terminals if necessary to meet the setvioe constraints . Neither Dubois nor Sabling relies on terminals and the like t o const rain the number of lines cons ide red. Instead , the base lines are generated from the minimum time paths direc tly. Dubois expands his set of base lines by c onsidering all lines with in a spec ified percentage of the shortest path.
In step 3 several different strategies are used Lu uevelop a rina! network from the base network or improve on the base network from step 2 or both. Both Lampkin and Silman add nodes to skeletons incrementally based on the objective of maximizing the a mount of service provided (passenger mi les or mi nutes ) for each additional node . Silman's objective function is more relevant bec ause the impact of i nc reasing r oute length ls taken into account. Rosello e xtends node-by-node network construction to include deletion of nodes and lines that have been (educed to only two nodes. The large numlieL of lines
generated in step 2 is improved on or eliminated node by node based on average total costs per passenger. Sonntag also operates at a disaggregate level using base lines of only two adjacent links rather than nodes. In step 3 the best base lines from step 2 are connected incrementally to form full base lines, which are then broken up and rearranged incrementally based on a complex objective function.
Roth Hoidn and Dubois select complete lines incrementally in step 3. Hoidn stops when all the demand has been served. In contrast, Dubois has a seconn R~~rz~ i~ ..... ~ !=~ !i;;c5 cu.-=: t:umi.JlneO anc.1 segments of lines deleted based on passengers per line and transfers . Simila r but not identical procedures for rearranging the base lines are also used by Sonntag and Mandl . Mand! follows a three-level hierarchical procedu i: e in an attempt to minimize total travel time. First the line segments for two lines are recombined. Next nodes are added to generate detours and, finally, less productive detours are eliminated. If an improvement is found at level 2 or 3, the algorithm begins again at level 1.
Rather than rely in step 3 on heuristics that
Axhausen and Smith
provide no assurance of an optimal solution, Hasselstroem applies linear programming with the objective of maximization of through trips per vehicle trip, which is ·equivalent to minimizing transfers . The resulting network is optimal in terms of providing for through trips but only for the set of lines generated in steps l and 2. In contrast, s tep 3 is not used at all by the authors of the earliest and the most recent algorithms. Both Nebelung and Sahling stop with the generation of a feasible set of base lines. Nebelung's primary purpose was to check the quality of manually produced network improvements.
EVALUATION OF THE HEURISTIC ALGORITHMS
The review of the literature on 'American and European heuristic network optimization algorithms clearly shows that there is a wide variety o f approaches to developing improved transit networks. I n order to provide a basis for selecting algorithms for application in ·the United States , the algorithms are evaluated in three ways:
1. Subjective evaluation of the basic procedures using the information presented in the literature review,
2. Comparison of the level of network improvement predicted (different algorithms applied to different cities), and
3. Comparison of predicted network improvement for the same city and transit demand.
The last two comparisons are severely limited by the lack of data on applications , especially applications to the same network . The evaluation is also l i mited by the lack of published before-and-a ft er studies that would provide a benchmark for validation of the algorithms. The impact of the network improvements on demand, however, could be estimated with an independent modal-choice model as was done by Hasselstroem.
Subjective Evaluation
The results of the subjective evaluation of the American and European algorithms are presented in Table 3. In order to approximate an optimal solution in the mathematical programming sense, heuristics must consider the entire range of possible lines and use an algorithm that gives good if not consistently near-optimal solutions. The potential for an optimal solution can be i'ncreased by increasing the range of f easible lines considered. The most common approach is to assume that feasible lines diverge from minimum-time-path lines by a limited amount, say 20 or 30 percent. Most of the algorithms constrain the base minimum-time-path lines by specifying terminals, but Dubois avoids terminals by selecting the shortest paths that have the most nodes. If base lines generated by X times the shortest path connecting terminals are likely to capture the optimal network, Hasselstroem's al.goritbms will give excellent results because his algorithm uses linear programming to select the optimal network from the given base lines.
Solutions that are independent of the existing network and the planner's preconceived ideas of good solutions are desirable. Such solutions can potentially be obtained from the incremental line generation approaches of Rosello and Sonntag. The use of the shortest paths with the most nodes by Dubois also has some potential, but demand should be considered as well.
11
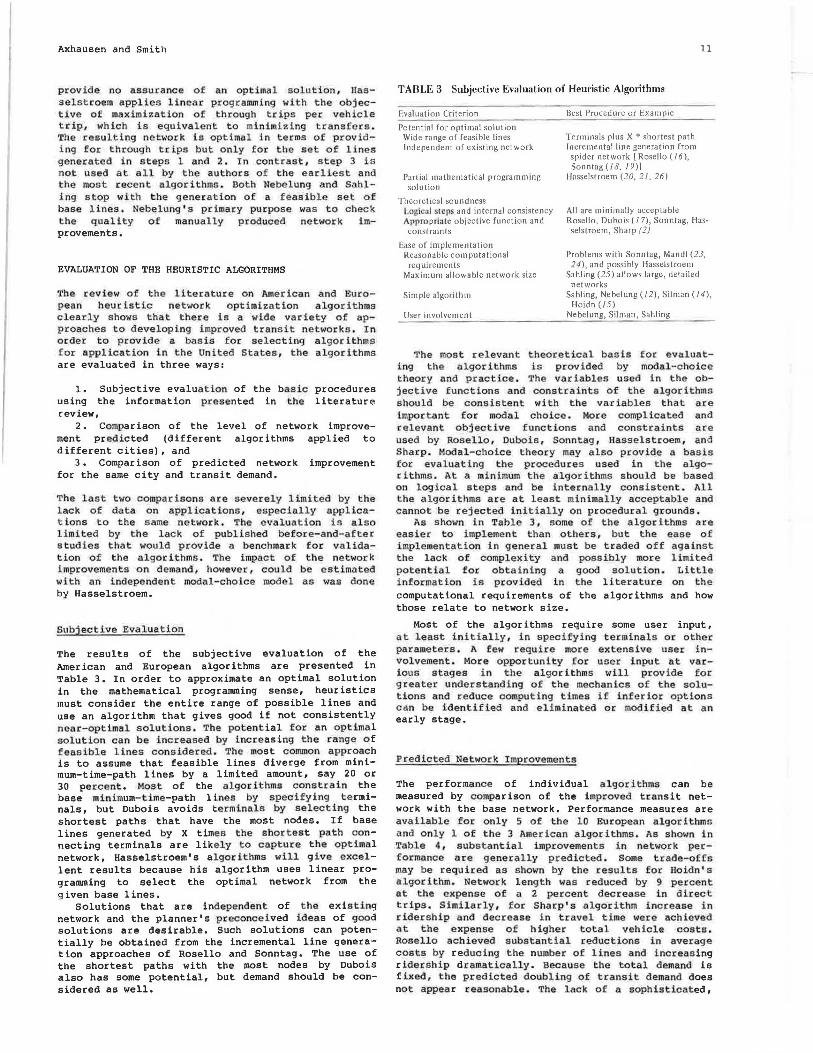
TABLE 3 Subjective Evaluation of Heuristic Algorithms
Evaluation Criterion
Potential for optimal solution Wid e range of feasible lines lndepe11ctent of existing net work
Partial mathematical programming solution
Theoretical soundness Lllsical steps and in ternal consistency Ap \>ropriatc objective function and constraints
Ease o f implementation Reasonable co mputational requirements
Maximum allowable network size
Simple a\go1ithm
User involvement
Best Procedure or Example
Terminals plus X • shortest path incremental line generation rrom spider network l Rosello (16), Sonntag(IS, /9)]
Hasselstroem (20, 21, 26)
All are minimally acceptable Rosello, Dubois ( 17), Sonntag, Has
selstroem, Sharp (2)
Problems with Sonntag, Mandi (23, 24), and possibly Hasselstroem
Sahling (25) allows large, detailed networks
Sahling, Nebclung (12), Silman (14), Hoid n (15)
Nebelung, Silman , Sahling
'l'he most relevant theoretical basis for evaluating the algorithms is provided by modal-choice theory and practice. The variables used in the objective functions and constraints of the algorithms should be consistent with the variables that are important for modal choice. More complicated and relevant objective functions and constraints are used by Rosello, Dubois, Sonntag, Hasselstroem, and Sharp . Modal-choice theory may also provide a basis for evaluating the procedures used in the algorithms. At a minimum the a·lgorithms should be based on logical steps and be internally cons i stent. All the a·lgorithms are at least minimally acceptable and cannot be rejected initially on procedural grounds .
As shown in Table 3, some of the algorithms are easier to implement than others, but the ease of implementation in general must be traded off against the lack of complexity and possibly more limited potential for obtaining a good solution. Little information is provided in the literature on the computational requirements of the algorithms and how those relate to network size.
Most of the algorithms require some user input, at least initially, in specifying terminals or other parameters. A few require more extensive user involvement. More opportunity for use.r input at various stages in the algorithms will provide for greater understanding of the mechanics of the solutions and reduce computing times if inferior options can be identified and eUminated or modified at an early stage.
·predicted Network Improvements
The performance of individual algorithms can be measured by comparison of the improved transit network with the base network. Performance measures are available for only 5 of the 10 European algorithms and only l of the 3 American algorithms. As shown in Table 4, substantial improvements in network performance are generally predicted . Some trade-offs may be required as shown by the .results for Boidn' s algorithm. Network length was reduced by 9 percent at the expense of a 2 percent decrease in direct trips. Similarly, for Sharp's algorithm increase in ridership and decrease in travel time were achieved at the expense of higher total vehicle costs. Rosello achieved substantial reductions in average costs by reducing the number of lines and increasing ridership dramatically. Because the total d.emand is flxed, the predicted doubling of transit demand does not appear reasonable. The lack of a sophisticated,

12
TABLE 4 Improvements Predicted Using Heuristic Network Optimization
Performance Base Improved Source Measure Network Network
Lampkin ( 1967) No, of buses 88 66 Mileage NA NA Wage bill NA NA
Sharp ( l 974) Base rider travel time NA NA Ridership NA NA Total vehicle costs NA NA
Hoidn ( l 97 5) Network length (km) 43.0l 39.20 Direct trips(%) 57.14 56 . 24 Satisfied demand(%) 92.20 92.20 Objective function
for direct trips 529 686 All trips 2,226 2,723
Rosello (I 976) No. of lines 9 8 No . of trips l 1,200 23 ,366 Avg costs($) 14.66 l l.72
Sonntag" ( l 977) Direct trips(%) 49 59 Avg travel time (sec) 590 520 Possible demand
(no. of trips) 84,100 86,100
Hasselstroem ( 1979) No , of trips 8,636 9,435 Total costs (skr) 9945 8401 Cost/trip (skr) I. l 5 0.89
Note: NA= not available.
Change (%)
- 25 5
- 13
5 + 9 + 3
9 - l.6
0
+ 30 + 22
- ll +108 - 20
+ 20 - 12
+ 2 + 9 - JG - 23
aThe results are for an earlier and simpler form of the algoritl1m that was aµplied to part of Oerlin's hus network.
well-calibrated modal-choice model may be the problem here.
I>xcept for direct validation o f the pred lcted performance, the best measures of performance would be obtained by applying different algorithms to the same network and travel demand pattern. Unfortunately·, only one such comparison is presented in the literature. Sonntag (18,l:!J compa~ed his solution for the Duesseldorf light rail network with that of Nebelung <!1> . Sonntag ' s network was marginally better with about 2 percent more direct trips (77. 49 versus 76 .15 percent) and 2 percent lower average travel times (l,483. 7 versus 1,511.8). The small difference between Sonntag' s sophisticated and comp .Ucated algorithm and Nebelung's simple, only partially computerized algorithm is surprising. The Duesseldorf netwotk, however, was not vety complex and may be more amenable to the extensive user involvement required by Nebelung's algorithm.
Overall Conclusions
The evaluation of the existing heuristic algorithms shows that both of the basic approaches to network improvement--incremental development from a loaded spider network versus minimum-time-path base generat lon of feasible lines~give reasonable results . The magnitude of the predicted improvement for the two i ncremental approaches (Rosello and Sonntag) is similar to that for the other approaches shown in Table 4. No firm conclusions can be drawn from the direct comparison of Sonntag' s incremental approach with Nebelung 1 s early algorithm based on minimum
No published results of appl.ications of the two most recent algorithms (those of Mandl and Sabling) were available. Both algor i.thms represent a departure from prior algorithms based on minimum time path in which lines close to the shortest path are included in the set of feasible lines. Mandl only considers the shortest paths with the maximum number of nodes and initially only allows one line per terminal. The feasible set of base lines, thus, is quite small. Sahling also only considers minimum
Transportation Research Record 976
time paths for lines. Be selects the most productive minimum time paths as lines incrementally and does not attempt to optimize the base network as Mandl does .
Because the a lg or i thms of both Mandl and Sahling represent untested new approaches to heuristic network optimization and are likely to require substantially less computational time, they both should be tested and compared with the other approaches. 1\ddit · onal direct comparisons between algorithms .representing the incremental approach versus shortest-path-based generation are also needed to provide an improved basis for selecting heuristic algorithms for practical app1.ications and fo-r pi;oviding direct ion to further research and development of hettristic algorithms.
SELECTION OF A HEURISTIC ALGORITHM FOR TESTING
I n selecting a heuristic algorithm for application in the United States , only the most recent algorithms were considered because these are more ikely to incorporate the latest shortest path and other r outines that take advantage of the advances in computer speed and memory size. Of the five most recent algorithms, only those of Sonntag and Mandl were potentially available at the beginning of thi 11 study . Sahling ' s work was not yet published officially and that o f Dubois and Hasselstroem was not cl iscovered until the study was well under way. unfortunately , Sonntag's algorithm is programmed in AI,.GLOW , a special version of ALGOL developed at the Technisohe Universitaet Berlin. The time required for translation into standard ALGOL or FORTRAN was not a vailable. Also, because of its complexity , Sonntag ' s algorithm would have taken a long time to implement. Consequently, Mandl's algorithm was selected for testing a state-of-the-art heuristic algorithm in the context of a small to medium-sized American city.
Mandl 's algorithm is programmed in FORTRAN and is available as part of the Interactive Network Optimization (IANOJ system from the Institute for Advanced Studies in Vienna (24). IANO has been implemented on both Sperry Univiie" and Digital Equipment (VAX) computers . Fo.r this study the programs were imple.mented o.n a VAX 11/780 with 4 megabytes of main memory, virtual memory, and a time-sharing operating s ystem . Mandl' s algorithm is contained in the program BOSOPTMAIN and its related subroutines. Implementing BUSOPTMAlN on the VAS H/780 required only three minor modifications in the progtam.
SELECTION OF TEST CITIES
Mandl's algorithm could potentially be applied to a wide range of transit networks in the United States. Both radial and grid networks with buses or light rail could be analyzed. In general, the test city should meet the following criteria:
l. It should have a small to medium-,.hon t::?:=!!s it network,
2. Transit network and transit demand data should be available,
3. The network should need restructuring, and 4. The analyst should be familiar with the tran
sit system and urban activity system characteristics.
The first criterion reduces the computing requirements whereas the second reduces the cost of data collection. The transit demand data can be obtained from eithe~ a recent on- board survey or a calib~ated
Axhausen and Smith
modal-choice model. Most transit systems in the United States could benefit from an evaluation of the need for restructuring routes. Familiarity with local conditions can be obtained quickly if necessary through interviews with local transit staff, traffic engineers, and planners.
Because Madison, Wisconsin, met all the criteria at the lowest cost for this study, it was selected as the test city in the United States. For a city of its size Madison has excellent bus service, partly because the central area is located qn a narrow isthmus between two large lakes. As a result, the radial lines to and through the central business district (CBD) provide a high level of service to the central area. The bus operator, Madison Metro, provides service on 19 lines with a fleet of 189 buses ( 27) • A minor restructuring was completed in 1979 to-Provide direct service between the two major regional shopping centers.
In order to compare the performance of Mandl's algorithm with that of other heuristic algorithms, Duesseldorf, West Germany, was selected as the second test city. Duesseldorf is the only city for which the performance of two other heuristic algorithms (Nebelung's and Sonntag's) has been reported. Duesseldorf also meets all but the fourth criterion for selection of a test city. Thus, Mandl's sparse, shortest-path-oriented algorithm can be compared directly with Nebelung's emphasis on an expanded set of feasible near-shortest-path lines and Sonntag' s incremental construction of optimal lines.
IMPLEMENTATION OF MANDL'S ALGORITHM
Model Structure
Mandl's algorithm is divided into two stages. In the first a feasible network is created. An attempt is made to maximize direct trips by creating lines along the longest shortest paths. Only the geometrics of the base network are considered, not the demand. Thus, the resulting lines may not be along the paths with the highest demands. In the second stage the initial lines are recombined in an attempt to minimize transfers through the minimization of total travel time. The flowchart for the two stages is presented in Figure 1. The second stage can be started with either the network generated in the first stage or a user-specified network.
The second stage of the algorithm uses an objective function defined as total travel time including travel and waiting times. The waiting time is assumed to be equal on all lines and is calculated as the ratio of the network length to the given number of buses. Thus, the number of buses can be used to increase or decrease the amount of waiting time. An all-or-nothing assignment algorithm is used with one-half of the demand assigned on the basis of minimum time and one-half on the basis of minimum transfers. The rationale here is that route-choice behavior is not adequately represented by travel time alone. This is an arbitrary split that could be changed with only a minor modification to the computer program.
The second stage follows a hierarchical, threestep search for improvements. If an improvement is found at any step, the search returns to the lowest step. In the first step, the intersecting lines at the node with the highest net transfers are recombined so that the net transfers are reduced. In the second step new transfer points are created by rerouting lines to include nodes with large flows. Thus, feasible detours are created. In the third and highest step transfer nodes with the lowest total
13
activity (flow plus transfers) that are not on the shortest path are proposed for elimination. Those detours that result in higher total travel time are eliminated.
The main limitation of Mandl's algorithm is the initial lack of consideration of the demand patterns. If the range of lines considered is large enough, the minimization of transfers in the second stage should reorient the network to better serve the demand.
Computer Program
The original version of the computer program was designed to accommodate a maximum of 40 nodes with all the data entered interactively. In order to accommodate the Madison network, the maximum network size was increased to 150 nodes. To facilitate handling large networks, the trip table and list of nodes were input from mass storage files.
The most critical subroutine used by the program is the shortest-path algorithm, SHOPAT. SHOPAT uses Floyd's algorithms for the calculation of shortest paths. As a matrix formulation, Floyd's algorithm provides a memory-intensive but fast solution. SHOPAT separates the network into a transfer network and a complementary network. The transfer network includes all nodes where transfers between the lines are possible for the first and for the last time between two lines. This transfer network is reformulated to include links that represent waiting and transfer times. For this network, which is smaller (has a smaller number of nodes) than the original network, the shortest distances are calculated. This procedure saves computing time and storage space, because the requirement for both in Floyd's algorithm grows rapidly with the number of nodes. The shortest distances between all the other nodes of the network are calculated by finding the transfer node, which is nearest to the destination node.
Because the design of large networks is not computationally feasible with Mandl's algorithm, a program was developed to aggregate a base network to a reasonable size. The user specifies the equivalence table for the aggregation and the program computes the new center-of-gravity zonal centroids and generates the corresponding compressed trip table and distance matrix. The selection of the new aggregate zones is critical because the characteristics of the new zones directly affect the results of the optimization.
The main program that generates the optimal network uses only total travel time as the objective function. Thus, a separate program was developed to provide a wider range of evaluation measures, including the length of the base and the line networks, the mean squared error for the difference in travel time for each orig in-destination (OD) pair between the optimum network and the actual network, and the average travel times, waiting times, and number of transfers for all users and for every stop. The demand density, defined as the ratio of the number of trips with n transfers to the number of OD pairs connected with n transfers, is also calculated. The evaluation program applies Floyd's shortest-path algorithm to the transit network and performs an all-or-nothing assignment of transit trips at the same time. These evaluation measures allow a more detailed comparison of the various solutions in terms of passenger-oriented performance measures. It would have been desirable to calculate the frequencies of the various lines, more accurate values of waiting and transfer times, and an ap-

14 Transportation Research Record 9i6
STAGE 1 CALCULATE THE SHORTEST PATH BETWEEN ALL PAIRS OF TERMINALS
CHOOSE THE PATH WITH THE HIGHEST NUMBER OF NODES AS A LINE. DELETE THE SERVED TERMINALS FROM THE LIST.
NO
ARE ALL TERMINALS SE RV SD?
YES
INCLUDE UNSERVED NODES AS POSSIBLE DETOURS OR AS TERMINALS OF NEW LINES.
ARE
DEFINE SOME NODES OF THE DIFFERENT SETS OF MUTUALLY REACHABLE NODES AS TERMINALS. YES
STAGE 2 CALCULATE THE TRAVEL TIME OF THE EXISTING NETWORK • D*
EXCHANGE LINE PORTIONS AT THE NODE WITH THE HIGHEST NUMBER OF TRANSFERS. FIND THE ONE COMBINATION WITH THE LOWEST TOTAL TRAVEL TIME D
NO
INCLUDE THE NODE WITH THE HIGHEST DEMAND TO NODES OF ANOTHER LINE BY MAKING A DETOUR IN THIS LINE. CALCULATE THE NEW TOTAL TRAVEL TIME D.
]~o_• __ ·_ D_.i..---------1 D ~ D* YES
NO
EXCLUDE THE NODE WITH THE LOWEST DEMAND TO NODES OF ANOTHER LINE RELATIVE TO THE DETOUR FROM THIS LINE. CALCULATE THE NEW TOTAL TRAVEL TIME D.
• D D ~ B11--------YES NO
FIGURE 1 Flowchart of Mandi's algorithm.
STOP
proximate measure of the operating costs involved, but the time to develop a program capable of generating these performance measures was not available.
consuming elements of Mandl's algorithm. The results for the 73-node network show that unless computer time is nearly free, networks must be limited to 70 to 80 nodes.
Comput ational Experience
The computer time required by Mandl's algorithm is difficult to predict because the number of iterations through the three-step hierarchical network optimization process is a complex function of the starting point (number and location of terminals and ring lines) , the network geometry, and the demand. The range in computer central processing unit (CPU) time as a function of the number of nodes in the network is shown in Figure 2. Both the range in times and the maximum time increase rapidly with increasing network size. The best least-squares fit to the data is givPn hy number of nodes (NN) to the third power. The regression equation for CPU time in minutes is
CPU = -3.96 + 0.000213 * NN' (1)
(-0.25) (3.60)
with an overall t = 2.07 and an R2 = 0.35. The two other possible independent variables, number of terminals and number of ring lines, did not contribute significantly to the explanatory power of the regression equation.
The rapid increase in CPU time with increasing network size is characteristic of the assignment and shortest-path calculations that are the most time-
APPLICATION TO MADISON
Development of the Data Base
A reasonable transit trip the 1980 on-board survey operator, Madison Metro.
CPU 250 .
~ 200 t
"' " 150 :
50 '
matrix was available from conducted by the transit Computerized highway and
NUMBER OF NODES
FIGURE 2 Computing time as a function of network size.

Axhausen and Smith
transit networks at the level of 377 traffic analysis zones were available from the Wisconsin Department of Transportation. The minimum time paths for the highway network were selected for developing aggregate networks for Mandl's algorithm because the networks would not be biased by the existing transit route pattern. The primary disadvantage of using highway travel time is that node pairs connected by higher-speed highways are favored. The problem is minimized in Madison because the only freeway within the urban area is a short, circumferential facility with no transit service and hence no transit trips.
The 377-zone base network was aggregated first to 89 zones based on Planning Analysis Area (PAA) . The PAA zone system is coarse in the downtown area and does not provide for clear delineation of multiple corridors within the central isthmus. A second zonal system with 104 zones was developed in order to define central corridors more clearly. Even for the 104-zone system the definition of the central corridors was limited by the base zonal system, which uses arterial streets as zonal boundaries. For transit planning, zones that straddle main arterial streets would represent potential transit corridors more accurately, so that a finer-grained zonal system would not be needed. At the regional scale the lack of a full range of central corridors was not a major problem because the overall distances involved were small. Also, precise identification of all central corridors was not essential because the overall transit network is represented at a sketchplanning level. Network alternatives are evaluated on a comparative basis with the objective of finding directions for possible improvement.
In order to reduce the size of the network, zones with less than 25 transit trip origins or destinations were consolidated with other zones. After consolidation, the first aggregation contained 58 zones (nodes) and 122 links. The second aggregation contained 73 zones and 153 links.
Results foe t he Firs t Aggrega tion
The 58-zone network was used to test the basic operation of Mandl's algorithm and to develop a strategy for selecting a set of input parameters. In running the program the number of buses was held constant at 120. The other two inputs, the number of terminals and the number of ring lines, were varied to test the sensitivity of the algorithm.
The evaluation measures for 11 runs of the model are presented in Table 5. The evaluation program was also run for a network that simulates the existing Madison Metro bus network. The evaluation program was run both with and without a 10-min transfer-time penalty. With the transfer penalty the assignment model in the evaluation program assigns a much higher proportion of the trips to direct routes, that is, routes with no transfers.
The first run uses the obvious ends of lines as terminals. The second run tries to substitute ring lines for some of the terminals as do runs 4, 5, and 9. Runs 3 and 8 specify some high-use terminals more than once to force the algorithm to build lines through high-density corridors. Runs 6 and 7 again use the obvious terminals, but the main purpose of these two runs was to test the sensitivity of the algorithm to the input order of the terminals. The different input orders did change the output network. Thus, the user would be well advised to test the sensitivity of the best output networks. Runs 10 and 11 use extremes. Run 10 gives total freedom to the algorithm to chose the terminals except that one terminal is located in the CBD, whereas run 11 forces the alqorithm to build all lines along ring
15
lines that correspond to the lines of the existing Madison Metro network.
tn evaluating the results fot Ma dl ' s algorithm to find directions for possible ne~work improve men ts, Table 5 shows clearly that the' -algorithm, i n general, produces substantially short networks bu t at the expP,nse of much greater proport:ions o.f transfers and somewhat longer travel times. Because of the shorter network, the indirectness of routing as measured by the mean squared error (MSE) is also generally greater than that for the simulated Madison Metro network.
When analyzed in the context of the structure of Mandl's algorithm, the performance measures shown in Table 5 are consistent with that structure. Solution 10 allows the algorithm to select shortest-path 1 ines unconstrained by terminal locations. The result is the shortest network but at the expense of long average travel times. The addition of terminals and ring lines consistently increases the length of the network and generally provides more direct routing (lower MSE). Additional terminals and ring lines, however, do not guarantee lower average travel times and fewer transfers. The travel times are sensitive to the location of terminals and ring lines. For example, solution 5 has the second lowest travel time and a moderate network length. Excess line length exists because two of th.e nine lines connect low-demand suburban areas. The problems with solution 5 were solved in solution 6c. by selecting fewer terminals and eliminating the r}ng line. The result is a much shorter network with._. only a small increase in average travel time.
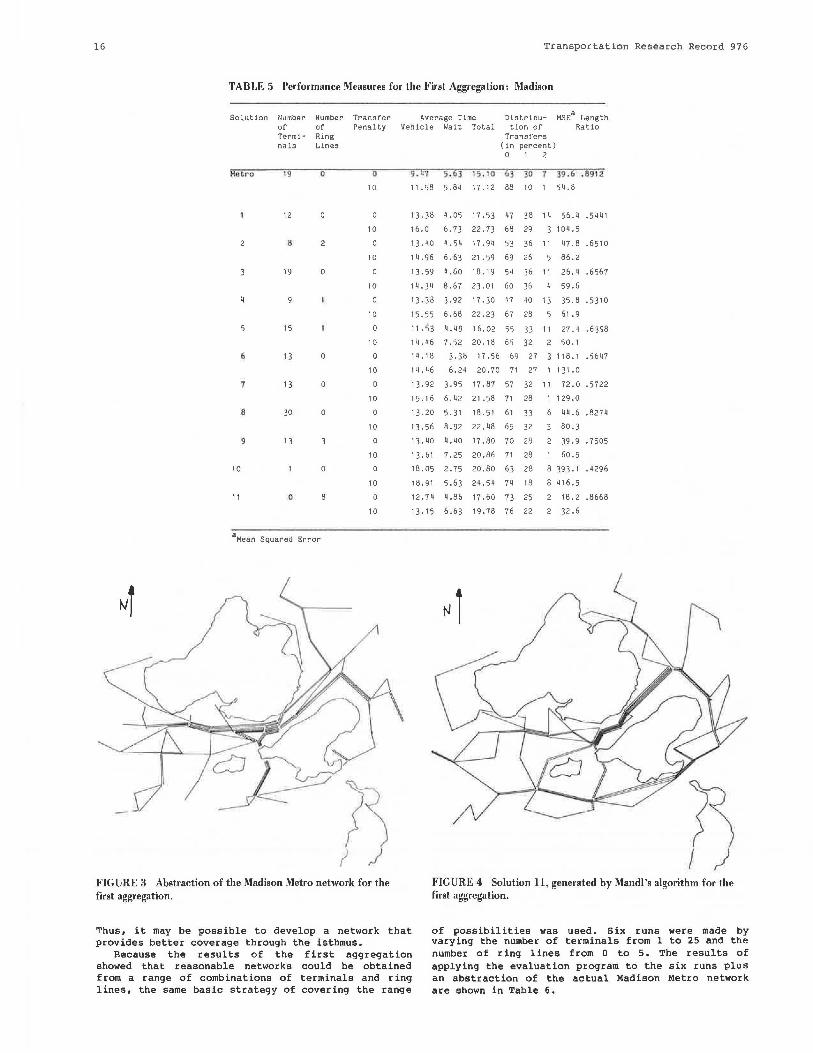
In terms of total travel time, the best computergenerated network is solution 11, which was designed specifically using ring lines to follow Metro's line pattern (Figures 3 and 4). Although the average travel time is about 15 percent longer than that for the Metro network and the proportion of transfers is much greater, solution 11 actually provides more direct service (lower MSE) with a network of about the same length. As can be seen in Figure 4, solution 11 has considerable extra mileage on the south side of Madison, which is required only to complete the specified ring line. Elimination of that mileage should not affect the average travel times significantly.
A comparison of the pattern of lines of solution 11 with that for the Metro network (Figures 3 and 4) shows that Mandl' s solution concentrates lines in one corridor through the isthmus rather than spreading the 1 ines over the isthmus following Metro's pattern. The concentration is caused by limiting the feasible lines to only those on minimum time paths. Other algorithms that consider feasible paths as X times the shortest paths or require service on all links should provide better coverage.
In summary, the sensitivity analysis of Mandl's algorithm to combinations of terminals and ring lines indicates that, at least for the radially oriented Madison network, specifying only a moderate number of terminals and no ring lines will produce a balance between network length and travel time. One strategy for selecting terminals is to start with the obvious ends of lines as terminals and incrementally improve subsequent runs by incorporating the good features ,and eliminating theI problems of earlier runs. Such an interactive p r ocess wou l d be speeded up considerably through the us~ of inte r active graphics.
Re s ul ts for t he Second Agg regat i on
The more detailed 73-zone network provides a better definition of corridors within the central area.
16 Transportation Research Record 976
TABLE 5 Performance Measures for the First Aggregation: Madison
Solution Number Number Transfer of of Penalty Term!- Ring nals Lines
Hotro 19 0 0
10
12
10
8
10
19 0
10
10
15
10
6 13 0
10
13 0
10
8 30 0 0
10
9 13 0
10
10 0
10
11 0
10
aMean Squared Error
FIGURE 3 Abstraction of the Madison Metro network for the first aggregation.
Average T lme Distribu- MSEa Length Vehicle Walt Total tion of Ratio
Transfers (in percent) 0 1 2
9 , 117 5.63 15 .1 0 63 30 39 .6 .8912
11 .58 5 .84 17 .12 88 10 1 54. 8
13.38 4. 05 17. 53 47 38 14 56. 4 .5441
16.0 6. 73 22. 73 68 29 104.5
13.40 4. 54 17. 94 53 36 11 47. 8 .6510
14 .96 6. 63 21 . 59 69 26 86.2
13.59 4 .60 18. 19 54 36 11 26.4 .6567
14. 34 8.67 23. 01 60 36 59.6
13.38 3.92 17.30 47 40 13 35. 8 .5310
15. 55 6. 68 22. 23 67 28 61 .9
11. 53 4. 49 16.02 55 33 11 27. 4 .6398
14.46 7. 52 20. 18 65 32 2 50.1
14. 18 3 . )8 17. 56 69 27 118 .1 .5647
14.46 6. 24 20. 70 71 27 1 1 31 .o 13. 92 3. 95 17.87 57 32 11 72 .o .5722
15.16 6. 42 21 .58 71 28 1 129.0
13.20 5. 31 18. 51 61 33 44. 6 .8274
13.56 8. 92 22. 48 65 32 80.3
13.40 4. 40 17.80 70 28 2 39. 9 • 7505
13. 61 7 .25 20 .86 71 28 60.5
18 .05 2. 75 20.80 63 28 393. 1 . 4296
18.91 5 .63 24. 54 74 18 8 416. 5
12. 7 4 4 .86 17 .60 73 25 2 18. 2 .8668
13. 15 6 .63 19. 78 76 22 32 .6
FIGURE 4 Solution 11, generated by Mandi's algorithm for the first aggregation.
Thus, it may be possible to develop a network that provides better coverage through the isthmus.
of possibilities was used. Six runs were made by varying the number of terminals from 1 to 25 and the number of ring lines from O to 5. The results of applying the evaluation program to the six runs plus an abstraction of the actual Madison Metro network are shown in Table 6.
Because the results of the first aggregation showed that reasonable networks could be obtained from a range of combinations of terminals and ring lines, the same basic strategy of covering the range

Axhausen and Smith 17
TABLE 6 Performance Measures for the Second Aggregation: Madison
Solution Number Number Transfer Average Time Dlstrl- MSE Length of of Penalty Vehicle Wait Total bution or Ratio term!- ring nals lines
Metro 19 0
10
15 0 0
10
25 0
10
15 0
10
10 3 10
10
10
10
In comparing the Metro network with the six computer-generated networks to identify directions for possible improvement, the computer-generated networks again are much shorter than the Metro network. The reduction in length is achieved at the expense of more transfers and less direct routing. In terms of travel time, the computer-generated networks are generally better than the Metro network if transfer penalities are not included, but with a 10-min transfer penalty, the Metro network is consistently better. The computer-generated networks are able to provide direct routes that give short travel times only by using many transfers. The much longer Metro network provides many more opportunities for direct travel. When transfer penalties are added, the impact on average travel times is smaller for the Metro network than for the computer-generated networks because the proportion of transfers is much smaller. A similar result was observed for the first aggregation; however, the higher level of aggregation did not permit the computer-generated solutions to match the pattern of demand as closely.
In comparing the performance measures shown in Table 6 for the six solutions, the total travel time both with and without transfer penalties is relatively insensitive to the number of terminals and ring lines. The one exception is solution 6. Here the computer-generated lines are unconstrained by terminals or ring lines, resulting in the shortest possible network but with many transfers and very indirect routing (high MSE) .
Because the total travel time for solutions 1 to 5 is about the same, selection of the best computergenerated network depends on the relative importance of the three other performance measures. From a transit passenger's perspective, minimizing transfer will be most important. Solutions 1, 4, and 5 have the lowest and about equal transfer requirements. The basic trade-off then is between indirectness of routing and network length (MSE versus length ratio). Solution 4 provides an intermediate point between the two extremes. It provides more direct routing than solution 1 and a shorter network than solution 5.
The Madison Metro network and solution 4 are compared in Figures 5 and 6. In terms of coverage, solution 4 identifies corridors through the isthmus better than in the first aggregation. Solution 4, however, clearly does not follow the demand-oriented pattern of the Metro network. On the east
Transfers (in percent)
0 1 2 13. 32 6. 78 20.10 75 24 36. 0 1 • 0998
13. 45 7 .81 21 .26 82 18 - 58. 7
15. 55 4. 12 19.62 61 37 1 131.1 0.5973
15 .64 7 .87 23. 51 62 37 I I 40.5
12.81 6. 31 19 .12 51 40 10 68. 4 0.8139
13. 79 10.12 23. 91 58 40 2 95.8
13. 83 5.25 19.08 54 43 79. 4 0.7174
14. 02 9. 63 23. 65 54 44 2 87. 7
I 4. 66 4.67 19.29 56 40 95. I 0.6430
15.02 8. 38 23.40 61 37 I 105. I
13. 82 5. 45 19 .27 52 42 65.6 0.7242
14.56 8.87 23.43 62 37 87 .8
17. 24 4. 28 21 . 52 37 45 17 310. 3 0. 492 4
18.29 8.29 26. 58 55 42 377. 3
side of the CBD, the lines for solution 4 are concentrated on the north side of the isthmus whereas the Metro network follows demand on the south side. On the west side of the CBD the concentration of the lines for solution 4 again does not follow Metro's demand-oriented pattern. This illustrates a major weakness of Mandl's algorithm. The initial network selection procedure is not designed to follow demand. Because lines cannot subsequently be added or deleted, the rearrangement of lines to minimize transfers in the second stage cannot significantly change the line pattern to follow demand.
The primary advantage of Mandl's solutions is the much shorter network. Such solutions would be of interest if substantial cutbacks in service are required or light rail networks are being developed. The advantage, however, is outw~ighed by the lack of consideration for demand patterns. The results of the application to Madison indicate the importance of multiple performance measures in evaluating alternative networks.
APPLICATION TO DUESSELDORF
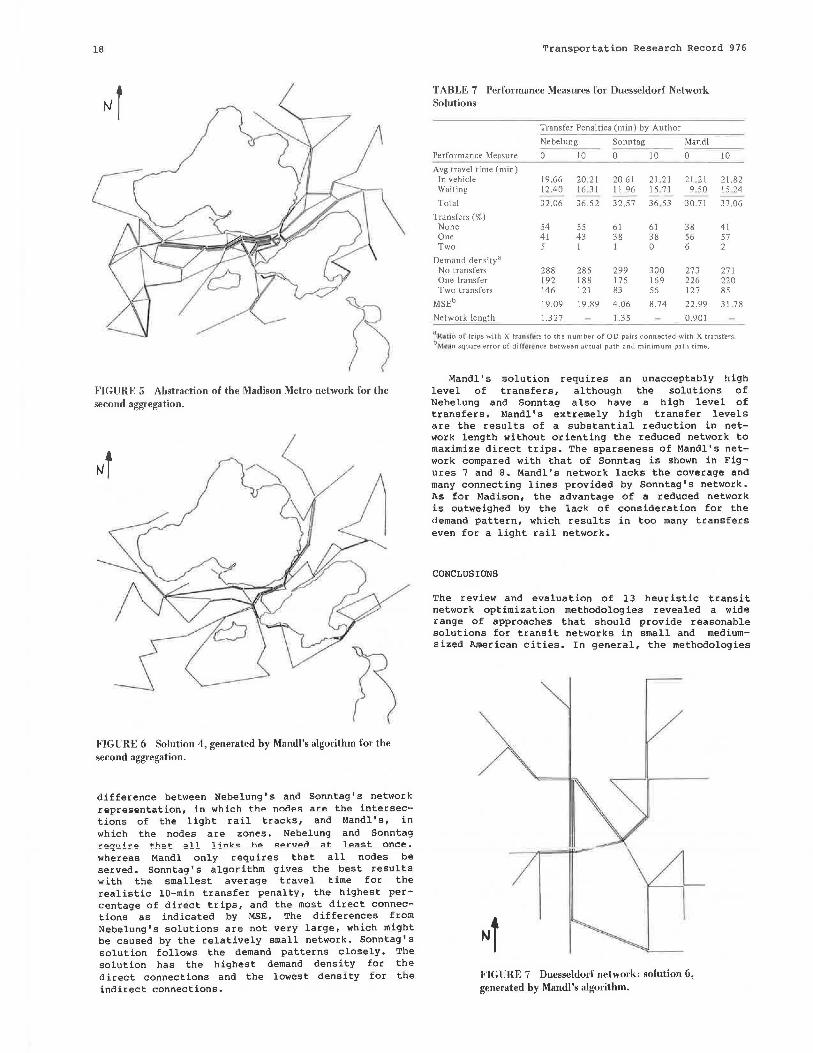
The data set for this application was generated in 1960 for Nebelung 's study about the reorganization of light rail systems (12). Sonntag used this data set for the developmentof his algorithm, although he intended his algorithm for the design of bus networks (.!.§._, 19) • The application of Mandl' s algorithm to the data set permits comparison of Mandl's geometrically oriented algorithm with Nebelung's algorithm, which maximizes direct trips on lines that are at most 1.2 times shortest paths, and Sonntag's, which builds lines incrementally along the demand without too strong an orientation toward the shortest paths.
In searching for the best solution with Mandl's algorithm, six combinations of terminals and ring lines were tested. For the 32-node, 48-link network the computing times ranged between 2 and 8 min on a minicomputer, which is much less than the 30 min of IBM 370-158 time required for Sonntag's algorithm. Using total travel time as the performance criterion, the run with only one terminal and no ring lines gave the best results.
The performance of Mandl's best solution is compared with those of Nebelung and Sonntag in Table 7. The comparison must be interpreted in view of the
18
FIGURE 5 Abstraction of the Madison Metro network for the second aggregation.
FIGURE 6 Solution 4, generated by Mandi's algorithm for the second aggregation.
difference between Nebelung' s and Sonntag' s network representation, in which the nodes are the intersections of the light rail tracks, and Mandl's, in which the nodes are zones. Nebelung and Sonntag ~eq~!~e th~! ?.!! !!nkc hP ~PruPn nt. lP.ast one~.
whereas Mandl only requires that all nodes be served. Sonntag's algorithm gives the best results with the smallest average travel time for the realistic 10-min transfer penalty, the highest percentage of direct trips, and the most direct connections as indicated by MSE. The differences from Nebelung's solutions are not very large, which might be caused by the relatively small network. Sonntag's solution follows the demand patterns closely. The solution has the highest demand density for the direct connections and the lowest density for the indirect connections.
Transportation Research Record 976
TABLE 7 Performance Measures for Duesseldorf Network Solutions
Transfer Penalties (min) by Author
Nebelung Sonntag Mand! ------Performance Measure 0 10 0 10 0 10
Avg travel time (min) In vehicle 19.66 20.21 20.61 21.21 21.21 21.82 Waiting 12.40 16 .31 11.96 15 71 9 50 15 .24
Total 32.06 36.52 32.57 36.53 30.71 37.06
Transfers(%) None 54 55 61 61 38 41 One 41 43 38 38 56 57 Two 5 I 1 0 6 2
Demand density" No transfers 288 285 299 300 273 271 One transfer 192 188 175 169 226 220 Two transfers 146 121 83 56 127 85
MSEb 19.09 19.89 4.06 8.74 22.99 31.78
Network length 1.327 1.35 0.901
a Ha llo of trips with X tran t1i(~ rs to the number of OD pairs connected with X transfers, b~h:tt n square error of dif(t re.nce between actual path and minimum path time.
Mandl's solution requires an unacceptably high level of transfers, although the solutions of Nebelung and Sonntag also have a high leve l of transfers. Mandl's extremely high transfer levels are the results of a substantial reduction in network length without orienting the reduced network to maximize direct trips. The sparseness of Mandl's network compared with that of Sonntag is shown in Figures 7 and 8. Mandl's network lacks the coverage and many connecting lines provided by Sonntag's network. As for Madison, the advantage of a reduced network is outweighed by the lack of consideration for the demand pattern, which results in too many transfers even for a light rail network.
CONCLUSIONS
The review and evaluation of 13 heuristic transit network optimization methodologies revealed a wide range of approaches that should provide reasonable solutions for transit networks in small and mediums ized American cities. In general, the methodologies
FIGURE 7 Duessel<lurf neiwork; solution 6, generated by Mandi's algorithm.

Axhausen and Smith
FIGURE 8 Duesseldorf network: Sonntag's solution.
have good potential for generating improved solutions because either a wide range of base lines is considered or an incremental approach to line construction is used. Most of the available heuristics provide a theoretically sound basis for network improvement because factors relevant to modal choice such as travel time, transfers, and cost are generally incorporated into the selection of base lines and the objective function and constraints for the algorithms. Although not all of the heuristics have been applied to actual transit networks, the computational requirements appear to be reasonable and should not be a major constraint on implementation, at least for medium-sized networks. The predicted improvements from applications of a few of the algorithms to one American and several European cities are positive enough to warrant further applications.
One major problem in applying the heuristic methodologies in the United States is the lack of readily available software in either the public or private domain. The emphasis in the United States has been on systems analysis with interactive graphics for transit network improvement. Thus, there has been almost no practical experience with the wide variety of heuristic methodologies that have been developed in Europe.
The potential for applying heuristic network optimization algorithms in the United States was tested with the unproved new algorithm by Mandl. The application of Mandl's algorithm to Madison, Wisconsin, showed first that with appropriate software and documentation, the computer program for a fairly complex heuristic algorithm can be implemented quickly and easily. Second, the available data base from a 1980 on-board OD survey and a standard urban area highway network provided an adequate basis for applying Mandl' s algorithm. Such data are available in many American cities. Third, the computational requirements of an algorithm based on minimum time path are affected dramatically by the number of nodes in the network. Initial testing of an algorithm is probably done most efficiently at a reasonably high level of aggregation. A more detailed network, however, many be required to represent critical corridors adequately, as was the case in Madison. The two levels of analysis have the advantage of indicating the sensitivity of the model to the level of aggregation.
19
The most important result of the application of Mandl' s algorithm to Madison was the demonstration of the need for a theoretically sound and fully tested algorithm. Mandl's algorithm held out the promise of a sparse network that could still satisfy demand through transfer optimization. The application to Madison resulted in a substantial reduction in network length but at the expense of an unacceptable increase in transfers for a bus network. Also, the revised network lacked the directness of routing provided by the base network. The importance of having a full range of performance measures available for evaluating the solutions generated by algorithms such as Mandl's was clearly indicated for Madison. If travel time and network length alone had been considered, Mandl's solutions would have appeared to perform well.
The same basic limitations of Mandl's algorithm were observed for the Duesseldorf light rail network application. The reduced network did not serve the demand directly and required high levels of transfers. Although emphasis on a small network is appropriate for the development of a light rail system in order to minimize capital costs, following demand so that ridership is maximized is even more important. Also, for restructuring an existing light rail network, Mandl' s algorithm is not really appropriate because the algorithm is not constrained to serve all links.
Finally, the applications of Mandl's algorithm to Madison illustrate the problem of selecting the input parameters. For Madison it was not sufficient to choose only the obvious terminals. Experiments with ring lines and multiple input of certain terminals were necessary to find the best networks.
Based on the results of the Madison and Duesseldorf applications, there is a clear need to make Mandl's algorithm more responsive to demand. One possib-ility is to use Sahling' s approach for selecting lines based on the most productive shortest paths in place of Mandl' s selection of the longest shortest path of the base network. Because the number of lines should not increase dramatically, the computing requirements of Mandl' s algorithm should remain reasonable. Mandl' s second stage could also be applied to the results of other simple algorithms such as Nebelung' s and others or to an existing base network. Mandl' s second stage should be particularly useful for identifying how existing lines can be reoriented to reduce transfers.
DIRECTIONS FOR ADDITIONAL RESEARCH
The review and evaluation of 13 heuristic methodologies, the application of Mandl's algorithm to Madison, and the comparison of Mandl's solution for Duesseldorf with those of Nebelung and Sonntag suggest two directions for future research. First, the existing transit network should be used as input to the second network improvement stage of a number of algorithms, including those of Rosello, Dubois, Sonntag, Mandl, and possibly Hasselstroem. This strategy is particularly important for Mandl's algorithm because Mandl's base network development phase is defective. For some of the algorithms the base network lines could be expanded to include families of lines that are within x times the base-line lengths.
Second, additional development and applications of full-scale heuristic methodologies are needed. The relative advantages of the three basic approaches to base network development--family of X times the shortest paths, incremental, and incremental selection of shortest paths to maximize productivity (Sahling)--should be evaluated so that

20
real-world applications can be made with greater confidence. The potential for reducing the complexity of the base network using the network select ion algorithms of Rea and Hasselstroem should also be explored further.
Validation of the predictions of the various heuristic methodologies is also a critical need. As an alternative, synthetic validation is possible with a calibrated modal-choice model. An external modal-choice model could also be applied iteratively with a heuristic algorithm to approximate an equilibrium solution to the interaction of supply and demand.
Finally, research is needed on the sensitivity of network performance to frequency optimization. The potential for including both line network generation and frequency optimization in one step using Hasselstroem' s linear programming approach should be explored further.
ACKNOWLEDGMENT
'l'he data used in this study were provided by the staff of Madison Metro, the Dane County Regional Planning Agency, and the Wisconsin Department of Transportation. The help and support provided by numerous individuals in these organizations are gratefully acknowledged. Support for computer time was provided by the Engineering Experiment Station at the University of Wisconsin-Madison.
REFERENCES
1 . T.H. Chua and D.T. Silcock. The Practice of British Bus Operators in Planning Urban Bus Services. Traffic Engineering and Control, 1982, pp. 66-70.
2. G.P. Sharp. Public Transit System Network Models: Consideration of Guideway Construction, Passenger Travel and Delay Time and Vehicle Scheduling Cost. Ph.D. dissertation. Georgia Institute of Technology, Atlanta, 1974.
3. M. Rapp. Transit System Planning: A Man-Computer Interactive Graphic Approach. In Highway Research Record 415, HRB, National Research Council, Washington, D.C., 1972, pp. 49-61.
4. M. Rapp. Interactive Graphics System for Transit Route Optimization. In Highway Research Record 559, HRB, National ~esearch Council, Washing- ton, D.C., 1976, pp. 73-88.
5. M. Rapp and C.D. Gehner. Transfer Optimization in an Interactive Graphics System for Transit Planning. In Highway Research Record 619, HRB, National Research Council, Washington, D.c., 1976, pp. 27-33.
6. M. Rapp and R. Keller. Netzoptimierungs System fuer die Netzstruktur der oeffentlichen Nahverkehrsmittel in der Region Basel. Baseler Verkehrsbetriebe, Basel, Switzerlancl, 1975.
7 . G.B. Douglas. Applications of Interactive Graphics in Urban Transit Analysis. In Transporta-
8.
9 .
~ion Kesearch Kecor<i 000, =ii\D, i~dLiunc:ti
search Council, Washington, D.C., 1982, 18-24.
PP•
J.C. Rea. Designing Urban Transit Systems: An Approach to the Route Technology Selection Problem. In Highway Research Record 417, HRB, National ""'Research Council, Washington, D.C., 1972, pp. 48-59. J. Hsu and V.H. Surti. Decomposition Approach
10.
11.
12.
13.
14.
15.
16.
17.
18.
19.
20.
21.
22.
23.
24.
25,
Transportation Research Record 976
to Bus Network Design. Transportation Engineering Journal of the ASCE, Vol. 103, 1977, pp. 447-459. J. Hsu and V.H. Surti. Demand Model for Bus Network Design. Transportation Engineering Journal of the ASCE, Vol. 102, 1976, pp. 451-461. J. Hsu and V.H. Surti. Framework of Route Selection in Bus Network Design. In Transportation Research Record 546, TRB, National Research Council, Washington, D.C., 1975, pp. 44-57. H. Nebelung, Rationelle Umgestaltung von Strassenbahnnetzen in Grossstaedten. Ministerium fuer Wirtschaft, Mittelstand und Verkehr des Landes Nordrhein, Westfalen, West Germany, 1961. W. Lampkin and P.D. Saalmans. The Design of Routes, Service Frequencies and Schedules for a Municipal Bus Undertaking: A Case Study. Operations Research Quarterly, Vol. 18, 1967, pp. 375-397. L.A. Silman, Z. Barzily, and u. Passy. Planning the Route System for Urban Buses. Computers and Operations Research, Vol. 1, 1974, pp. 201-211. H.P. Hoidn. Busnetz von Aarau, Neukonzeption der Linien. Institut fuer Operations Research der ETH Zuerich, Zuerich, Switzerland, 1975. X. Rosello. An Heuristic Algorithm to Generate an Urban Bus Network. In Advances in Operations Research: 1976.
Proceedings, Elsevier, Amsterdam,
D. Dubois, G, Bel, and M. LLibre. A Set of Methods in Transportation Network Synthesis and Analysis. Journal of the Operations Research Society, Vol. 30, 1977, pp. 797-808. H. Sonntag. Linienplanung im Oeffentlichen Personennahverkehr. Dissertation. Fachbereich Informatik, Technische 1977.
Universitaet Berlin,
H. Sonntag. Ein heuristisches Verfahren zum Entwurf nachfrageorientierter Linienfuerhrung im oeffentlichen Personennahverkehr. Zeitschr ift fuer Operations Research, Vol. 23, 1979, pp. Bl5-B23. D. Hasselstroem. Connecting Bus Routes at Points of Intersection. In Advances in Operations Research: Proceedings, Elsevier, Amsterdam, 1976. D. Hasselstroem. A Method for Optimization of Urban Bus Route Systems. Report 88-DH-03. Volvo Bus Corporation, Gothenburg, Sweden, 1979. Martin and Voerhess Associates and Volvo Transportation Systems. Coventry Bus Study: Summary Report. West Midlands Passenger Transport Executive, England, 1981. c. Mandl. Applied Network Optimization. Academic Press, New York, 1979. c. Mandl. User Reference and Implementer Manual !ANO-System. Institutsarbeit No. 122. Institute for Advanced Studies, Vienna, Austria, 1979. Seminar Verkehrswesen, Sommer Semester 1901• Linienplanung. Institutsnotiz 29. Instituts fuer Verkehrswesen der Universitaet Karlsruhe, loT--6.. r>-----·· 'Inn-, 1~----Z-.a....:-- --~ ___ ,,: __ ..... ,: __ ............ .......... 01w11z, .A.JV'J \Y!;:;;o::I'-".&.. .A.t',_.A....,11 UllY "'t't' .......... ~ ..... ...,,,
of Sahling's model). 26, D. Hasselstroem. Public Transportation Plan
ning: A Mathematical Programming Approach. Department of Business Administration, University of Gothenburg, Sweden, 1981.
27. Dane County Regional Planning Commission: Transit Development Program 1982-1986. Madison, Wisc., 1982.