Embed Size (px)
Citation preview
DRAFT MEMORANDUM
1
Project No.: 180249
September 9, 2019
To: Mike Hermanson – Spokane County Environmental Services, Lead Agency WRIA 55 Planning Unit Members
From:
Carl Einberger, LHG Associate Hydrogeologist [email protected]
Dan Haller, PE, CWRE Principal Water Resources Engineer [email protected]
Re: Evaluation of Future Exempt Well Demand ESSB 6091/RCW 90.94 Watershed Plan Update
Background The passage of Engrossed Substitute Senate Bill (ESSB) 6091, as codified by RCW 90.94, requires that an update to the existing Watershed Plan for Water Resource Inventory Area (WRIA) 55, the Little Spokane Watershed, be approved by the Washington Department of Ecology (Ecology) by February 1, 2021. Spokane County Environmental Services is serving as the lead agency for this process. The WRIA 55 Initiating Governments for the watershed planning process are Spokane County, Stevens County, Pend Oreille County, the City of Spokane, and Whitworth Water District. The process is supported by convening the WRIA 55 Planning Unit to review technical tasks and memorandums, policy decisions, and the pending watershed plan update. Aspect Consulting, LLC (Aspect) has been contracted by Spokane County to facilitate planning unit meetings, conduct supporting technical tasks, and prepare the Watershed Plan update.
Section 202 of ESSB 6091, which is applicable to WRIA 55, contains several provisions regarding how updated watershed plans are to offset or account for projected water use.
Specifically, Section 202(4)(b) states, in part:
“At a minimum, the [watershed] plan must include those actions that the planning units determine to be necessary to offset potential impacts to instream flows associated with permit exempt domestic water use. The highest priority recommendations must include replacing the quantity of consumptive water use during the same time as the impact and in the same basin or tributary.”
In March 2018, Ecology issued Recommendations for Water Use Estimates1 for ESSB 6091 that provides guidance on evaluation of future exempt well demand. Key excerpts from this document include:
1 https://fortress.wa.gov/ecy/publications/documents/1811007.pdf
e a r t h + w a t e r Aspect Consulting, LLC 710 2nd Avenue Suite 550 Seattle, WA 98104 206.328.7443 www.aspectconsulting.com

DRAFT MEMORANDUM September 9, 2019 Project No. 180249
Page 2
• Timeframe: To evaluate and offset potential consumptive impacts from permit-exempt domestic wells, a timeframe over which new domestic2 use will be considered must be designated. Since a “subsequent twenty years” is referenced throughout other sections of ESSB 6091 (such as sections 202(4)(c), Ecology interprets the timeframe for 202(4)(b) … to be the next twenty years. In its Interim Guidance for Determining Net Ecological Benefit3, Ecology further clarified that this 20-year planning horizon begins on the date ESSB 6091 was signed into law – January 19, 2018.
• Scope of “water use”: Ecology interprets all projected water use referenced in sections 202(4)(c)…to refer to only consumptive permit-exempt domestic groundwater water use (as opposed to water use associated with municipalities, for example).
• Consumptive use: Water Resources Program Policy 1020 (1991) states, “Consumptive water use causes diminishment of the source at the point of appropriation,” and that, “Diminishment is defined as to make smaller or less in quantity, quality, rate of flow, or availability.” This guidance document is focused on estimating only quantity diminishment, so for the purposes described here, consumptive water use is considered water that is evaporated, transpired, consumed by humans, or otherwise removed from an immediate water environment due to the use of permit-exempt domestic wells.
• Subbasins: ESSB 6091 is written in the context of WRIA-wide mitigation, so Ecology interprets the words “same basin or tributary” to refer to subareas or subbasins as opposed to entire WRIAs. For the purposes of this document, the term “subbasin” is equivalent to the words “same basin or tributary” as used in sections 202(4)(b).
This memorandum presents an evaluation of future exempt well demand on a subbasin level and on a 20-year horizon within WRIA 55 that is intended to meet the requirements of ESSB 6091. Figure 1 presents a map of WRIA 55 delineating the subbasins used in the evaluation, which are the Washington Department of Natural Resources Watershed Administrative Units and are consistent with subbasin boundaries used in previous watershed planning and management.
WRIA 55 extends into Spokane, Stevens, and Pend Oreille Counties. All three counties have conducted analysis and worked cooperatively together to develop estimates of future residential permits in WRIA 55 outside of public water districts to support the development of the exempt well demand estimates.
General Approach Prior to conducting the exempt well demand analysis described in this memorandum, staff from Spokane, Stevens, and Pend Oreille Counties, Aspect, and Ecology discussed potential approaches with consideration of Ecology’s Recommendations for Water Use Estimates for ESSB 6091. The following approach was agreed upon and implemented:
Each county developed growth projections on a subbasin level for single family residential units (SFUs) relying on exempt wells on the mandated 20-year horizon. Each county used professional
2 Ecology’s ESSB 6091-Streamflow Restoration Initial Policy Interpretations defines domestic use as “indoor and outdoor uses for a household (including watering of a lawn and noncommercial garden).” https://fortress.wa.gov/ecy/publications/documents/1811008.pdf 3 https://fortress.wa.gov/ecy/publications/documents/1811009.pdf

DRAFT MEMORANDUM September 9, 2019 Project No. 180249
Page 3
judgment in developing the forecast based on available county specific information. Specific approaches for each county are summarized below.
Each county then developed the estimates of average lawn size, on a subbasin level, through geographical information system (GIS) analysis of suitable aerial photos for homes relying on exempt wells built between 2001 to 2017. Each county analyzed a sufficient sample size from the set of exempt well properties to attain an approximate 95 percent confidence interval with a 5 percent margin of error, within that county’s portion of WRIA 55 that is served by exempt wells.
Aspect then used this information to estimate the average amount of consumptive use associated with the growth projections for SFUs relying on exempt wells, using the following methodology:
• Indoor consumptive use estimates were based on examples presented in Ecology’s Recommendations for Water Use Estimates for ESSB 6091 and a review of US Census data on average persons per household by county.
• Outdoor consumptive use estimates were made based on average irrigation lawn size determined on a subbasin level and methods described in Ecology Guidance 1210 (Determining Irrigation Efficiency and Consumptive Use), using crop demand estimates provided in the Washington Irrigation Guide (WIG) for pasture/turf for the Spokane and Newport stations.
County-specific approaches and the number of estimated new SFUs relying on exempt wells per subbasin are summarized below, followed by estimates of indoor, outdoor, and total consumptive use.
Spokane County Growth Projections and Estimated Lawn Sizes Approaches to Projecting Future Residential Units Spokane County estimated the projected increase over the next 20 years in residential units relying on permit exempt wells within the Spokane County portion of WRIA 55, outside of the area covered by WAC 173-557. Spokane County estimated the projected increase in two ways:
• The first approach is based on the Spokane Regional Transportation Council (SRTC) Horizon 2040 projected increase in SFUs. The SRTC Horizon 2040 growth projections are derived from and consistent with the Washington Office of Financial Management (OFM) 2017 Growth Management Act population projections for counties in the category: 2010 to 2040 medium growth.
• The second approach is based on extrapolating the historical growth rate based on the average number of new homes built annually from 2001 – 2017.
Estimates of New SFUs Based on OFM Medium Growth Projections The SRTC projected increase in single family residential units are spatially distributed into Transportation Analysis Zones (TAZs). TAZ boundaries do not conform to subbasin boundaries or areas served by public water supplies versus permit exempt wells. A GIS analysis was completed to allocate the distribution of the projected increase in SFUs and within each TAZ into each subbasin, followed by allocations between areas served by public water supplies and areas served by permit exempt wells in proportion to the distribution of existing SFUs derived from Spokane County Assessor data. Table 1, below provides an example of this approach, using TAZ 487, which has

DRAFT MEMORANDUM September 9, 2019 Project No. 180249
Page 4
area within the City of Deer Park water service area, the Dragoon Creek subbasin, and the Beaver Creek subbasin (Figure 1).
Table 1. Example of SFU Allocation Approach by TAZ
TAZ 487 Existing
Projected Growth in SFUs (20-Year
Planning Horizon) Units % of Total Total Residential Units 354 56 Within Public Water Supply 242 68.4 38 Outside Public Water Supply 112 31.6 18
Dragoon Subbasin 54 15.3 9 Beaver Creek Subbasin 58 16.3 9
Based on the allocation methodology described above, Table 2 presents the projected increases in SFUs by subbasin within Spokane County that are estimated to rely on a permit exempt well for domestic water supply in the next 20 years.
Table 2. Projected Growth in SFUs Relying on Exempt Wells in Spokane County (WRIA 55), based on OFM Medium Growth Projections
Subbasin Projected increase in SFUs (20-Year Planning Horizon)
Dartford Creek 265 Dragoon Creek 281 Deadman Creek/Peone Creek 319 Beaver Creek 155 Little Spokane/Deer Creek 261 Little Deep Creek 98 West Branch 67 Otter Creek 156
Total 1602 Estimates of New SFUs Based on 2001-2017 Historical Growth Rate Between 2001 and 2017 there were 1,901 new residences that rely on permit exempt wells in Spokane County’s portion of WRIA 55. This equates to an average growth rate of 112 homes per year. Based on this rate, there will be an estimated 2,235 new homes relying on permit exempt wells built within WRIA 55 in Spokane County in the next 20 years. Table 3 presents the historical growth data, along with the 20-year planning horizon projected growth estimated based on extrapolating the historical growth rate, with a comparison to the SRTC/OFM medium growth rate projected growth as outlined in Table 2. In both cases, the TAZ analysis approach discussed above was used to allocate the projected growth to each subbasin, which changes the percentages of growth estimated within each subbasin from the historical 2001-2017 distribution, based on where new growth is expected to occur.

DRAFT MEMORANDUM September 9, 2019 Project No. 180249
Page 5
Table 3. Comparison of Historical and Projected Growth in SFUs Relying on Exempt Wells in Spokane County (WRIA 55)
Subbasin
Actual 2001-2017
Historical Growth Rate - Projected 20-Year Growth
OFM Medium -Projected
20-Year Growth
SFUs % of total SFUs % of total SFUs % of total Dartford Creek 256 13% 370 17% 265 17% Dragoon Creek 367 19% 392 18% 281 18% Deadman-Peone Creek 338 18% 445 20% 319 20% Beaver Creek 178 9% 216 10% 155 10% Otter Creek 216 11% 218 10% 156 10% West Branch 104 5% 93 4% 67 4% Little Spokane/Deer Creek 370 19% 364 16% 261 16% Little Deep Creek 72 4% 137 6% 98 6%
Total 1901 2235 1602 Yearly Average 112 112 80
Irrigated Area Estimate by Subbasin A random sample of the 1,901 SFUs built between 2001-2017 were analyzed with aerial photos from 2006, 2009, 2014, 2016, and 2018. GIS methods were used to delineate the size of apparent area of lawn irrigation. A sample size of 321 was selected to achieve a 5 percent margin of error with a 95 percent confidence interval. Table 4 presents the results of this analysis.
Table 4. Estimated Irrigated Area by Subbasin in Spokane County (WRIA 55)
Subbasin
Number of Household
Lawns Analyzed
Average Irrigated Lawn
Size (sq. ft.)
Average Irrigated
Lawn Size (acres)
Dartford Creek 47 15,290 0.35 Dragoon Creek 50 15,211 0.35 Deadman-Peone Creek 52 17,334 0.40 Beaver Creek 44 14,753 0.34 Otter Creek 42 14,282 0.33 West Branch 14 8,948 0.21 Little Spokane/Deer Creek 53 10,433 0.24
Little Deep Creek 19 7,769 0.18 WRIA 55 Average 321 13,880 0.32

DRAFT MEMORANDUM September 9, 2019 Project No. 180249
Page 6
Stevens County Growth Projections and Estimated Lawn Sizes Projected Residential Units Stevens County estimated the projected increase over the next 20 years in SFUs relying on permit exempt wells within the Stevens County portion of WRIA 55. The County reviewed the number of building permits issued from 2001-2017 for new homes using a private water supply. GIS methods were used to filter the data to include only parcels within both WRIA 55 and Stevens County.
The average number of new homes built annually from 2001-2017 was used to predict the number of new homes for the 20-year planning horizon. Between 2001 and 2017 there were 209 new residences that rely on permit exempt wells in Stevens County’s portion of WRIA 55. This equates to an average growth rate of 12.3 homes per year. This rate was used to extrapolate growth over the next 20 years. Based on this rate, there will be an estimated 246 new homes relying on permit exempt wells built within WRIA 55 in Stevens County in the next 20 years (Table 5). That total will include an estimated 65 homes in the Beaver Creek subbasin, 179 homes in the Dragoon Creek subbasin, and 2 homes in the West Branch subbasin.
Table 5. Historical and Projected Growth in SFUs Relying on Exempt Wells in Stevens County (WRIA 55)
Year Beaver Creek Dragoon Creek West Branch Total 2001 4 12 1 17 2002 6 13 19 2003 6 16 22 2004 6 16 22 2005 6 16 22 2006 3 12 15 2007 6 10 16 2008 2 9 11 2009 8 8 2010 3 8 11 2011 3 3 6 2012 2 4 6 2013 2 3 5 2014 1 8 9 2015 1 4 1 6 2016 6 6 2017 4 4 8 Total 55 152 2 209
Projected SFUs 20-Year Horizon 65 179 2 246
Average Irrigated Area Estimate by Subbasin Average lawn size was estimated by choosing a random sample of the building permits and using aerial imagery (2015, 2017) to make a digitally-measured estimate of irrigated lawn and garden area. The sample for the lawn size analysis was chosen randomly to obtain a 95 percent confidence level with a 5 percent margin of error. Lawns were digitally measured for a randomly selected sample of 136 out of the 209 new residences in WRIA 55, providing a 95 percent confidence level with a 5 percent margin of error. The sample’s average lawn size was 6,316 square feet(sq. ft.; 0.1450 acres), with 97 out of 136 parcels having any identifiable irrigated lawn.

DRAFT MEMORANDUM September 9, 2019 Project No. 180249
Page 7
Table 6: Average Estimated Lawn Size in Stevens County for New Homes on Private Water Supply (WRIA 55)
Subbasin Lawns Sampled Average Lawn
Size (sq. ft.) Average Lawn
Size (acres) Beaver Creek 33 3,944 0.09 Dragoon Creek 102 7,145 0.16 West Branch 1 0 0
Total 136 6,316 0.15
Pend Oreille County Growth Projections and Estimated Lawn Sizes Projected Residential Units Pend Oreille County estimated the projected increase over the next 20 years in SFUs relying on permit exempt wells within the Pend Oreille County portion of WRIA 55. GIS methods were used to filter residential building permit data for the period 2011-2017 to include only permits that were in WRIA 55, but outside public water districts, indicating use of an exempt well. Between the years of 2011-2017 there were 116 new residential permits that are or will be relying on permit exempt wells in Pend Oreille County’s portion of WRIA 55 (Table 7). The average annual growth rate of 16.6 homes was used to extrapolate growth on a 20-year horizon. Based on this rate, there will be an estimated 332 new homes relying on permit exempt wells built within WRIA 55 in Pend Oreille County in the next 20 years (Table 8). That total will include an estimated 138 homes in the West Branch subbasin and 194 homes in the Otter Creek subbasin (Table 8).
Table 7: Pend Oreille County Residential Permits Issued Outside of Public Water Districts, 2011-2017 (WRIA 55)
Year Number Percentage of Total 2011 15 12.9% 2012 13 11.2% 2013 9 7.8% 2014 21 18.1% 2015 20 17.2% 2016 22 19.0% 2017 16 13.8% Total 116 100.0%
Average of 16.6 New Residential Permits a Year

DRAFT MEMORANDUM September 9, 2019 Project No. 180249
Page 8
Table 8. Project SFUs Relying on Exempt Wells in Pend Oreille County (WRIA 55)
Sub Basins
Projected SFU Growth 20-Year
Planning Horizon West Branch 138 Otter Creek 194 WRIA 55 Total 332
Average Irrigated Area Estimate by Subbasin An average lawn size was determined by choosing a random sample of the building permits, with a 95 percent confidence interval to achieve a 5 percent margin of error, and digitizing their irrigated lawn based off aerial photography (2011, 2015, 2017), NDVI imagery, and the Pend Oreille County Assessor photos from the field. All indefinable agricultural activity was excluded. Of the 116 newly permitted residence that rely on permit exempt wells within WRIA 55, 89 had their lawns digitized, providing a 95 percent confidence level with a 5 percent margin of error. The sample’s average lawn size was 9,648 sq. ft, with 53 out of 89 having any identifiable irrigated lawn (Table 9).
Table 9. Estimated Irrigated Area by Subbasin in Pend Oreille County (WRIA 55)
Subbasin Lawns Sampled Average Lawn
Size (sq. ft.) Average Lawn
Size (acres) West Branch 53 5,355 0.12 Otter Creek 36 12,564 0.29
Total 89 9,648 0.22
Analysis of Consumptive Use by Subbasin Aspect used the information provided by each County to estimate the average amount of consumptive use associated with the growth projections for SFUs relying on exempt wells, as described below:
Indoor Consumptive Use Indoor consumptive use estimates were developed based on examples presented in Ecology’s Recommendations for Water Use Estimates for ESSB 6091 and a review of US Census data on average persons per household by county. Key assumptions incorporated into the analysis include:
• The number of new exempt wells in the next 20 years in each subbasin is based on the analyses conducted by Spokane, Stevens, and Pend Oreille Counties discussed in this memorandum.
• US Census Data4 tabulating the persons per household from 2013-2017 were used combined with the per capita water use noted below. The US Census Data indicates that the average number of people per household is 2.43 in Spokane County, 2.48 in Stevens County, and 2.3 in Pend Oreille County.
• Per capita water use is 60 gallons per day (gpd), based on the analysis provided in Ecology’s Recommendations for Water Use Estimates for ESSB 6091:
4 https://www.census.gov/quickfacts

DRAFT MEMORANDUM September 9, 2019 Project No. 180249
Page 9
o To estimate the impacts of indoor water use, the population to be served by future permit-exempt domestic wells can be multiplied by assumed water use. A 2016 study by the Water Research Foundation (DeOreo, et al., 2016) determined an average per capita water use of 59 gallons per day (gpd) in homes provided municipal water in 23 areas across the U.S. and Canada. This result is based on actual flow monitoring and survey responses from 737 homes. The 59 gpd average is down 15.4 percent from results found during a 1999 American Water Works Association Research Foundation study (Mayer and DeOreo, 1999). Some homes supplied by Tacoma Water were monitored for the 2016 report, producing an average 51 gpd per capita indoor water use. Bearing in mind that homes supplied municipal water are more likely to be fitted with water saving appliances, an assumption of 60 gpd per capita seems reasonable when estimating water use for permit exempt wells.
• Indoor consumptive is equal to 10 percent of total use, based on the analysis provided in Ecology’s Recommendations for Water Use Estimates for ESSB 6091:
o A reasonable assumption for much of Washington is that about 10 percent of indoor domestic water use is consumed, and about 80 percent of outdoor domestic water use is consumed (Culhane and Nazy, 2015). A consumptive use rate of 10 percent for indoor domestic use is in keeping with recent groundwater models constructed by the U.S. Geological Survey (USGS) for the Kitsap peninsula (Frans and Olsen, 2016) and the Chamokane Creek basin (Ely and Kahle, 2012).
Table 10 presents the 20-year projected consumptive indoor use associated with exempt wells in WRIA 55, including both the OFM medium and the historical growth scenarios for Spokane County.

DRAFT MEMORANDUM September 9, 2019 Project No. 180249
Page 10
Table 10. Projected Consumptive Indoor Use Associated with Exempt Wells in WRIA 55, 20-Year Planning Horizon
Spokane County Spokane County Stevens County Pend Oreille County
OFM Medium Historical Growth
Rate Historical Growth
Rate Historical Growth
Rate
SFUs
Projected Consumptive Indoor Use
acre feet per year (afy)
SFUs Projected
Consumptive Indoor Use
(afy) SFUs
Projected Consumptive
Indoor Use (afy)
SFUs Projected
Consumptive Indoor Use
(afy)
WRIA 55 Subbasins Spokane County Spokane County Stevens County Pend Oreille County Dartford Creek 265 4.33 370 6.04 Dragoon Creek 281 4.59 392 6.40 179 2.92
Deadman-Peone Creek 319 5.21 445 7.27 Beaver Creek 155 2.53 216 3.53 65 1.06
Otter Creek 156 2.55 218 3.56 194 3.17 West Branch 67 1.09 93 1.52 2 0.03 138 2.25
Little Spokane/Deer Creek 261 4.26 364 5.94
Little Deep Creek 98 1.60 137 2.24 Total 1,602 26.16 2,235 36.50 246 4.02 332 5.42
Outdoor Consumptive Use Outdoor consumptive use estimates were developed based on average irrigation lawn size determined on a subbasin level and methods described in Ecology Guidance 1210 (Determining Irrigation Efficiency and Consumptive Use). Key assumptions incorporated into the analysis include:
• The number of new exempt wells in the next 20 years in each subbasin is based on the analyses conducted by Spokane, Stevens, and Pend Oreille Counties discussed in this memorandum.
• Average irrigation lawn sizes in each subbasin are based on the analyses conducted by Spokane, Stevens, and Pend Oreille Counties discussed in this memorandum.
• The seasonal net irrigation requirement was taken from Washington Irrigation Guide (WIG) for pasture/turf for the Spokane station (29.81 inches) for all subbasins, with the exception of the West Branch and Otter Creek subbasins, for which the Newport station (24.11 inches) was used. Data from a relatively new (2015) AgriMet station at Deer Park was also reviewed but not used in the analysis, as it was generally consistent with Spokane WIG values, ranging between 27.08 and 30.66 inches of lawn evapotranspiration between 2015 and 2018.
• An irrigation efficiency of 75 percent was used, which is applicable to sprinkler methods typically used for lawn irrigation, such as pop-up impact or handline methods referenced in Table 1 of Ecology Guidance 1210.
• Consumptive irrigation quantities are calculated from the number of new exempt wells in each subbasin, average irrigation lawn size, net irrigation demand from the WIG, and irrigation efficiency.
DRAFT MEMORANDUM September 9, 2019 Project No. 180249
Page 11
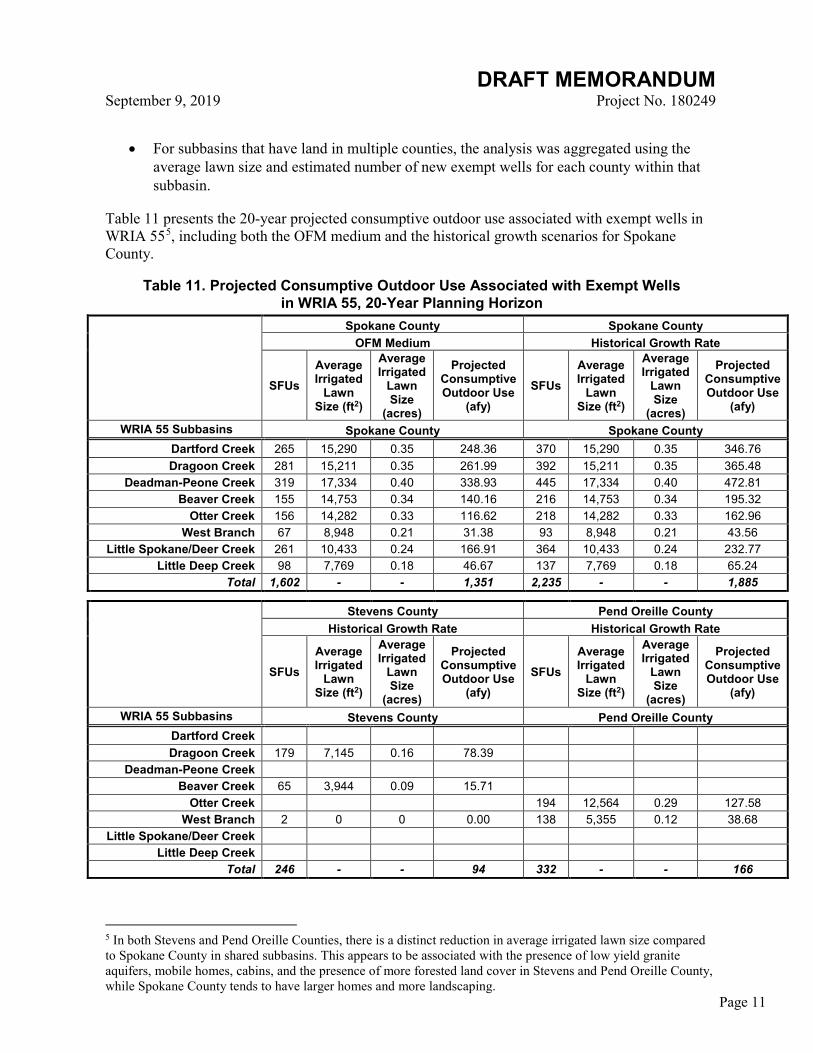
• For subbasins that have land in multiple counties, the analysis was aggregated using the average lawn size and estimated number of new exempt wells for each county within that subbasin.
Table 11 presents the 20-year projected consumptive outdoor use associated with exempt wells in WRIA 555, including both the OFM medium and the historical growth scenarios for Spokane County.
Table 11. Projected Consumptive Outdoor Use Associated with Exempt Wells in WRIA 55, 20-Year Planning Horizon
Spokane County Spokane County OFM Medium Historical Growth Rate
SFUs Average Irrigated
Lawn Size (ft2)
Average Irrigated
Lawn Size
(acres)
Projected Consumptive Outdoor Use
(afy) SFUs
Average Irrigated
Lawn Size (ft2)
Average Irrigated
Lawn Size
(acres)
Projected Consumptive Outdoor Use
(afy)
WRIA 55 Subbasins Spokane County Spokane County Dartford Creek 265 15,290 0.35 248.36 370 15,290 0.35 346.76 Dragoon Creek 281 15,211 0.35 261.99 392 15,211 0.35 365.48
Deadman-Peone Creek 319 17,334 0.40 338.93 445 17,334 0.40 472.81 Beaver Creek 155 14,753 0.34 140.16 216 14,753 0.34 195.32
Otter Creek 156 14,282 0.33 116.62 218 14,282 0.33 162.96 West Branch 67 8,948 0.21 31.38 93 8,948 0.21 43.56
Little Spokane/Deer Creek 261 10,433 0.24 166.91 364 10,433 0.24 232.77 Little Deep Creek 98 7,769 0.18 46.67 137 7,769 0.18 65.24
Total 1,602 - - 1,351 2,235 - - 1,885
Stevens County Pend Oreille County Historical Growth Rate Historical Growth Rate
SFUs Average Irrigated
Lawn Size (ft2)
Average Irrigated
Lawn Size
(acres)
Projected Consumptive Outdoor Use
(afy) SFUs
Average Irrigated
Lawn Size (ft2)
Average Irrigated
Lawn Size
(acres)
Projected Consumptive Outdoor Use
(afy)
WRIA 55 Subbasins Stevens County Pend Oreille County Dartford Creek Dragoon Creek 179 7,145 0.16 78.39
Deadman-Peone Creek
Beaver Creek 65 3,944 0.09 15.71
Otter Creek 194 12,564 0.29 127.58 West Branch 2 0 0 0.00 138 5,355 0.12 38.68
Little Spokane/Deer Creek
Little Deep Creek
Total 246 - - 94 332 - - 166
5 In both Stevens and Pend Oreille Counties, there is a distinct reduction in average irrigated lawn size compared to Spokane County in shared subbasins. This appears to be associated with the presence of low yield granite aquifers, mobile homes, cabins, and the presence of more forested land cover in Stevens and Pend Oreille County, while Spokane County tends to have larger homes and more landscaping.

DRAFT MEMORANDUM September 9, 2019 Project No. 180249
Page 12
Total Consumptive Use by New Exempt Wells in WRIA 55, 20-Year Planning Horizon Total consumptive use estimates were developed for both Spokane County growth scenarios (medium OFM and historical growth rates) and tallied with the estimates for Stevens and Pend Oreille Counties using the historical growth rate projections for those counties. The summary in Table 12 combines the results for indoor and outdoor consumptive use discussed above and presents the 20-year projected total consumptive use associated with exempt wells. The total consumptive use within WRIA 55 is estimated to range from a lower estimate of 1,646.98 afy (2.275 cubic feet per second [cfs]) to a higher estimate of 2,191.22 afy (3.027 cfs) for the 20-year planning horizon.
Table 12. Total Projected Combined Indoor/Outdoor Consumptive Use in WRIA 55, 20-Year Planning Horizon
With Spokane County Medium OFM Projection
(Lower Growth Rate Scenario)
With Spokane County Historical Growth Rate
Projection (Higher Growth Rate Scenario)
Projected Consumptive
Use (afy)
Projected Consumptive
Use (cfs)
Projected Consumptive
Use (afy)
Projected Consumptive
Use (cfs) WRIA 55 Subbasins
Dartford Creek 252.69 0.349 352.81 0.487 Dragoon Creek 347.90 0.481 453.20 0.626
Deadman-Peone Creek 344.14 0.475 480.07 0.663 Beaver Creek 159.47 0.220 215.63 0.298
Otter Creek 249.91 0.345 297.27 0.411 West Branch 73.44 0.101 86.04 0.119
Little Spokane/Deer Creek 171.17 0.236 238.72 0.330
Little Deep Creek 48.27 0.067 67.48 0.093 Total 1,646.98 2.275 2,191.22 3.027
Attachments: Figure 1 – WRIA 55 Subbasins and Stream Gages
V:\180249 WRIA 55 Watershed Plan Update\Deliverables\Exempt Well Demand\Draft WRIA 55 6091 Exempt Well Demand Memo_9-9-19.docx

!P
!P!P
!P
WRIA 59(Colville)
WRIA 55(Little Spokane)
WRIA 57(Middle Spokane)
WRIA 54(Lower Spokane)
WRIA 34( Palouse)
WRIA 56 ( Hangman)
WRIA 57(Middle Spokane)
124270.00Little Spokane at Elk
124310.00Little Spokane at Dartford
124315.00Little Spokane at Confluence
124295.00Little Spokane at Chattarory
OTTERCREEK
WESTBRANCH
BEAVERCREEK
LITTLESPOKANE/DEER
CREEKDRAGOON
CREEK
DARTFORDCREEK
DEADMANCREEK/PEONE
CREEK
LITTLEDEEP
CREEK
GIS Path: T:\projects_8\LittleSpokaneWaterBanking_140129\Delivered\WaterBankingDemandEvaluation\1 WRIA 55 Subbasins and Stream Gages.mxd || Coordinate System: NAD 1983 StatePlane Washington North FIPS 4601 Feet || Date Saved: 1/8/2015 || User: randrusyszyn || Print Date: 1/8/2015
0 3 6
Miles
C O N SU LTI N G
FIGURE NO.
1JAN-2015PROJECT NO.140129
BY:CME / RAA
REVISED BY:- - -
WRIA 55 Subbasins and Stream GagesLittle Spokane Water Banking Demand Evaluation,
Supply Assessment, and Water Transfer Framework ConsiderationsWRIA 55, Washington
!P USGS Gaging Station/Control Station
WRIA Boundary
WRIA 55 Subbasins
Named WatercourseNotes:-WRIA 55 Subbasin Source: Spokane County Water Resources Division ofUtilities, 2015
Basemap Layer Credits || Sources: Esri, HERE, DeLorme, TomTom, Intermap, increment P Corp., GEBCO, USGS, FAO, NPS, NRCAN, GeoBase, IGN, Kadaster NL, Ordnance Survey, Esri Japan, METI, Esri China (Hong Kong),swisstopo, MapmyIndia, © OpenStreetMap contributors, and the GIS User Community