Embed Size (px)
Citation preview

Hazen and Sawyer
1000 N Ashley Drive, Suite 1000
Tampa, FL 33602 • 813.630.4498
Evaluation of Exhibit D Water
Quality Final Report Tampa Bay Water PO 20190150-00 Hazen Project 41089-000 December 5, 2019

Tampa Bay Water
Evaluation of Exhibit D Water Quality
Final Report
| Table of Contents i
Table of Contents
Executive Summary ........................................................................................................ v
1. Introduction ............................................................................................................ 1-1
1.1 Background .............................................................................................................................. 1-1
1.1.1 Regional System and Treatment Facility Overview .................................................... 1-3
1.1.2 Exhibit D Water Quality Criteria Background .............................................................. 1-8
1.1.3 Potential Exhibit D Changes ....................................................................................... 1-8
1.2 Objectives ................................................................................................................................ 1-9
1.3 Scope of Work ....................................................................................................................... 1-10
2. Data Evaluation ..................................................................................................... 2-1
2.1 Approach .................................................................................................................................. 2-1
2.2 Data Summary ......................................................................................................................... 2-5
2.2.1 Existing Data ............................................................................................................... 2-5
2.2.2 Level-1 Grouping ........................................................................................................ 2-6
2.2.3 Level-2 Grouping ........................................................................................................ 2-9
2.2.4 Level-3 Test Locations .............................................................................................. 2-12
2.3 Data Analysis ......................................................................................................................... 2-14
3. System Model Development .................................................................................. 3-1
3.1 Selected Water Quality Parameters ........................................................................................ 3-1
3.2 Source Water Quality Variability .............................................................................................. 3-2
3.3 POC Water Quality Variability .................................................................................................. 3-2
4. Predicted Treatment Requirements ....................................................................... 4-1
4.1 Location and Estimated Percent Removal............................................................................... 4-1
4.2 Potential Treatment Processes ................................................................................................ 4-3
5. Opinion of Probable Construction Costs and Phasing Considerations .................. 5-1
5.1 Assumptions ............................................................................................................................ 5-1
5.2 Summary of Costs to Meet Water Quality Goals (Without Hardness) ..................................... 5-3
5.3 Additional Costs to Meet Proposed Exhibit D Calcium Hardness Goal ................................... 5-6
5.4 Phasing Consideration ............................................................................................................. 5-7
5.5 Preliminary Cost-Benefit Analysis ............................................................................................ 5-8

Tampa Bay Water
Evaluation of Exhibit D Water Quality
Final Report
| Table of Contents ii
6. Summary of Findings and Next Steps ................................................................. 6-10
List of Tables
Table 1-1 Comparison of Exhibit D Limits with accompanying FDEP Limits .......................... 1-2
Table 1-2: Existing Tampa Bay Water Treatment Facilities ....................................................... 1-3
Table 1-3: Existing and Proposed Exhibit D Water Quality Parameter limits ............................ 1-9
Table 2-1: Example Breakdown Showing Percentage of Wells Using Option 1, 2, or 3 for
Modeled Water Quality ...................................................................................................... 2-5
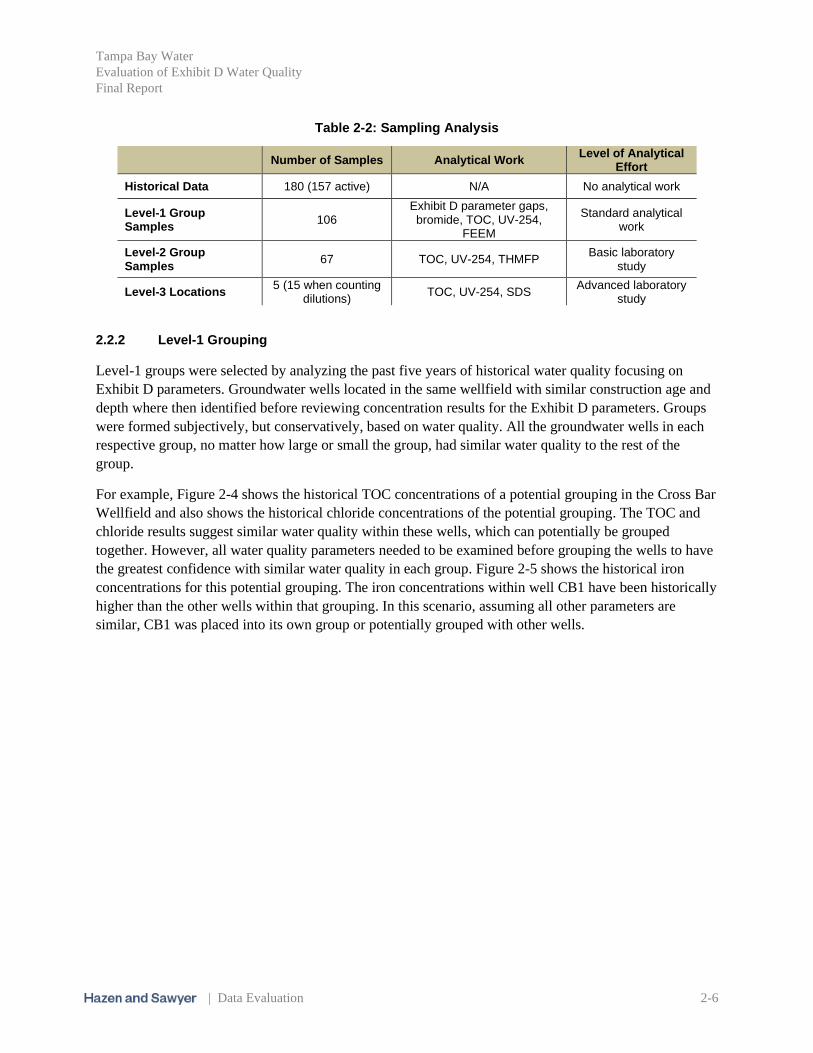
Table 2-2: Sampling Analysis ...................................................................................................... 2-6
Table 2-4: Identified Annual Average TOC Targets ................................................................. 2-15
Table 3-1: Selected Exhibit D Parameters for Further Study ...................................................... 3-1
Table 3-3: Wells Removed in Future Scenarios .......................................................................... 3-4
Table 4-1: Identified Treatment Scenarios .................................................................................. 4-1
Table 4-2: Location and TOC Percent Removal Requirements .................................................. 4-2
Table 4-3: Estimated Calcium Hardness Removal Requirements ............................................... 4-2
Table 4-4: Proposed Treatment Technologies and Performance Assumptions ........................... 4-3
Table 4-5: Summary of Selected Treatment Technologies.......................................................... 4-4
Table 5-1: Preliminary Design Criteria Summary ....................................................................... 5-3
Table 5-2: Summary of Planning Level Costs for Each Scenario ............................................... 5-3
Table 5-3: Cost Scenario A – 2.0 mg/L TOC Target ................................................................... 5-4
Table 5-4: Cost Scenario B – 1.5 mg/L TOC Target ................................................................... 5-4
Table 5-5: Cost Scenario C – 1.25 mg/L TOC Target ................................................................. 5-5
Table 5-6: Cost Scenario D – 1.0 mg/L TOC Target ................................................................... 5-6
Table 5-7: Summary of Estimated Calcium Removal Costs ....................................................... 5-7
Table 5-8: Potential Phasing and Capital Cost Distribution (Without Hardness) ....................... 5-8
Table 5-9: Scenario Based Cost-Benefit Analysis ....................................................................... 5-9
Table 6-1: Summary of Water Quality Benefits ........................................................................ 6-10
Table 6-2 Approximate Timing of Next Steps ...................................................................... 6-11
List of Figures
Figure 1-1: Map of Tampa Bay Water’s Existing System ........................................................... 1-5
Figure 1-2: Conceptual System Diagram ..................................................................................... 1-7
Figure 2-2: Graphic Representation of Well Grouping Process .................................................. 2-4
Figure 2-3: Basis for determining the modeled water quality for each source ............................ 2-4
Figure 2-4: Well Grouping Analysis Total Organic Carbon (mg/L) & Chloride (mg/L) ............ 2-7
Figure 2-5: Well Grouping Analysis Iron (mg/L)........................................................................ 2-7
Figure 2-6: Level-1 TOC results .................................................................................................. 2-8
Figure 2-7: Comparison on FEEM for (A) ELW103 and (B) ELW116 ...................................... 2-9
Figure 2-8: Level-2 Results Showing Strong Linear Correlation Between TOC and THMFP . 2-10
Figure 2-9: Level-2 Specific THMFP (ppb THMFP per mg/L TOC) ....................................... 2-10
Figure 2-10: Level-2 Specific UV-254 Absorbance (L/mg-m) ................................................. 2-11
Tampa Bay Water
Evaluation of Exhibit D Water Quality
Final Report
| Table of Contents iii
Figure 2-11: Level-3 Testing Free Chlorine Decay Curves....................................................... 2-12
Figure 2-12: Level-3 Testing Chloramine Decay Curves .......................................................... 2-13
Figure 2-13: Level-3 Testing Free Chlorine SDS Curves ......................................................... 2-13
Figure 2-14: Level-3 Testing Chloramine SDS Curves ............................................................. 2-14
Figure 2-15: Relationship between Level-3 TOC, Incubation Time, and SDS TTHM based on
free chlorine residual ........................................................................................................ 2-15
List of Appendices
Appendix A: 2017 Member Government Recommendations
Appendix B: Level-1 Well Sampling Protocol
Appendix C: Level-2 THMFP Test Protocol
Appendix D: Level-3 SDS Test Protocol
Appendix E: System Model Results
Appendix F: Level-1 & Level-2 Groups
Appendix G: System Model Water Quality Assumptions
Appendix H: Water Supply Contract
Appendix I: Summary of Study Water Quality Results
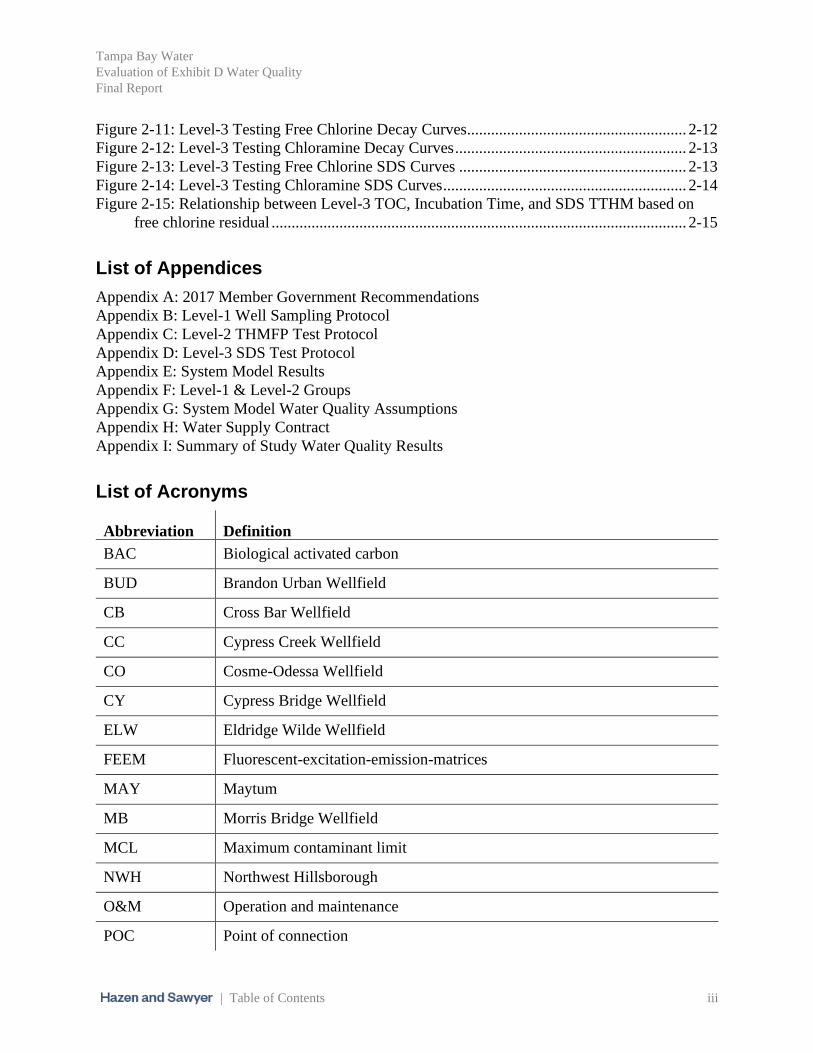
List of Acronyms
Abbreviation Definition
BAC Biological activated carbon
BUD Brandon Urban Wellfield
CB Cross Bar Wellfield
CC Cypress Creek Wellfield
CO Cosme-Odessa Wellfield
CY Cypress Bridge Wellfield
ELW Eldridge Wilde Wellfield
FEEM Fluorescent-excitation-emission-matrices
MAY Maytum
MB Morris Bridge Wellfield
MCL Maximum contaminant limit
NWH Northwest Hillsborough
O&M Operation and maintenance
POC Point of connection
Tampa Bay Water
Evaluation of Exhibit D Water Quality
Final Report
| Table of Contents iv
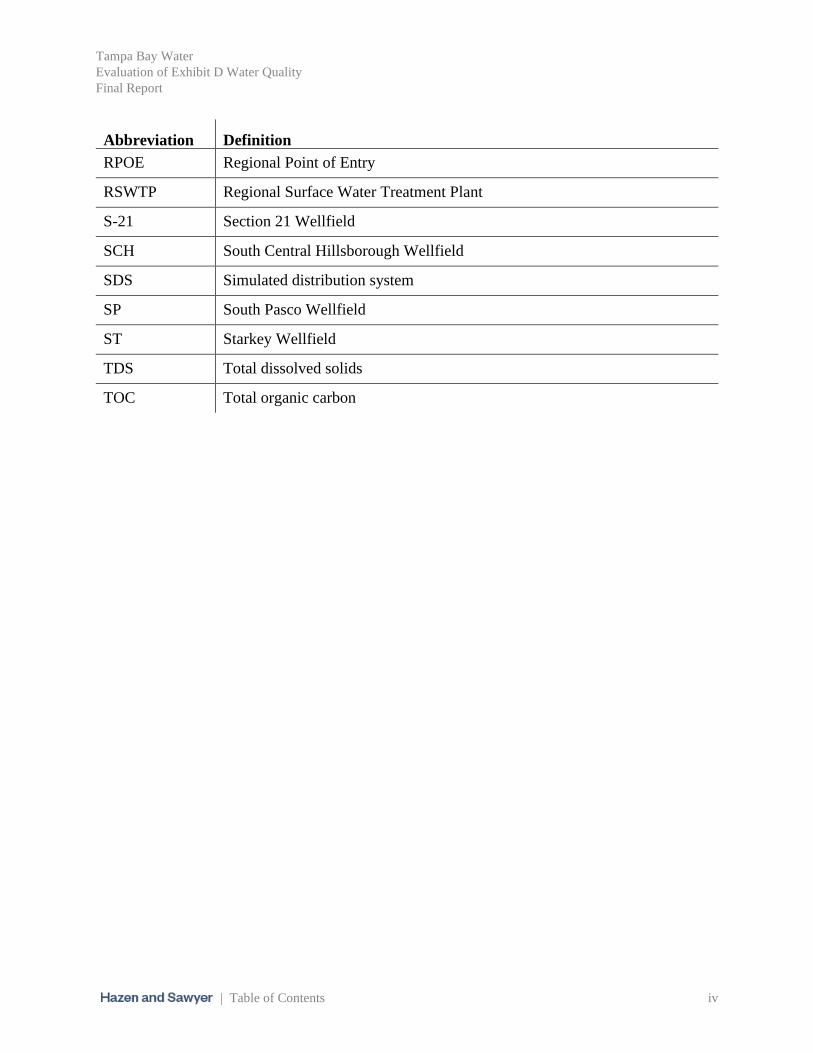
Abbreviation Definition
RPOE Regional Point of Entry
RSWTP Regional Surface Water Treatment Plant
S-21 Section 21 Wellfield
SCH South Central Hillsborough Wellfield
SDS Simulated distribution system
SP South Pasco Wellfield
ST Starkey Wellfield
TDS Total dissolved solids
TOC Total organic carbon
Tampa Bay Water
Evaluation of Exhibit D Water Quality
Final Report
| Executive Summary v
Executive Summary
Introduction
Tampa Bay Water is a regional wholesale water provider for six member governments: Hillsborough
County, Pinellas County, Pasco County, and the cities of Tampa, St. Petersburg, and New Port Richey.
Tampa Bay Water operates a diversified water supply including groundwater, surface water, and seawater
sources. The Master Water Supply Contract with the member governments requires Tampa Bay Water to
deliver similar water quality at all Points of Connection. Exhibit D, which defines the expected water
quality criteria at the regional Point of Connection, is an attachment to the Master Water Supply Contract,
which was approved in 1998 at the same time as the agency’s Amended and Restated Interlocal
Agreement. Section 2 of the Master Water Supply Contract contemplated Exhibit D would be modified
from time to time to address changes in regulations or customer demands. In 2004 Exhibit D was
modified to its present form following years of monitoring and study, including significant pilot testing.
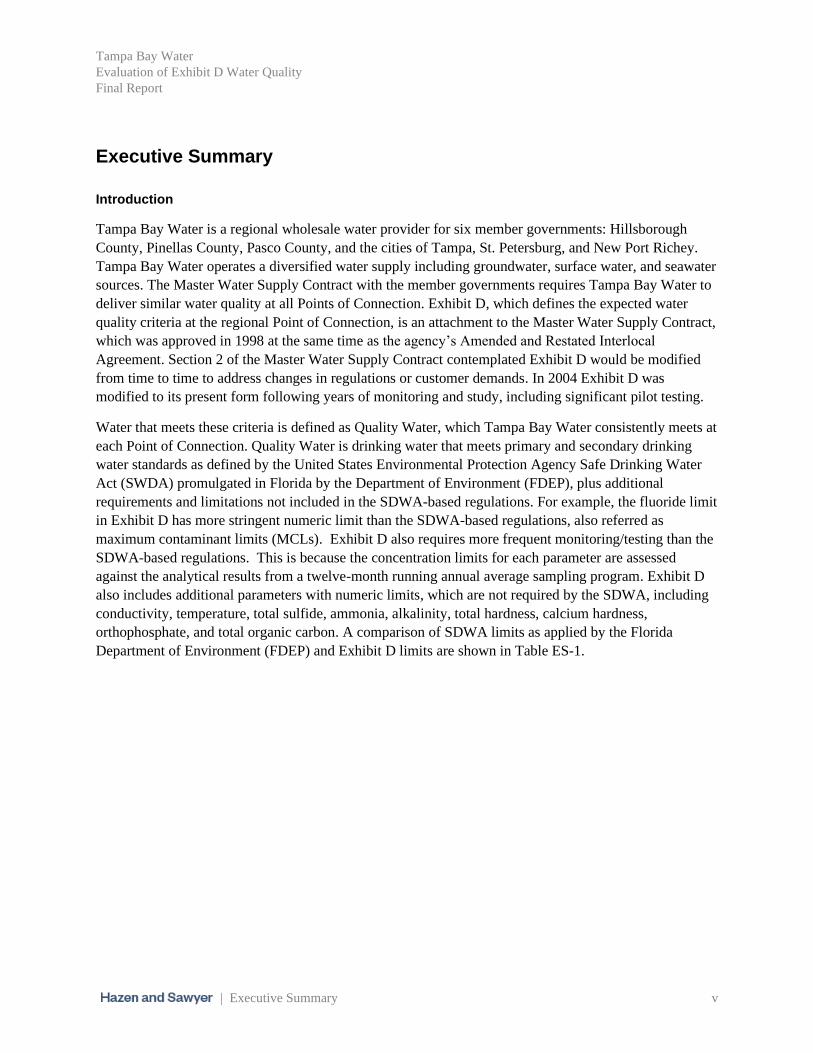
Water that meets these criteria is defined as Quality Water, which Tampa Bay Water consistently meets at
each Point of Connection. Quality Water is drinking water that meets primary and secondary drinking
water standards as defined by the United States Environmental Protection Agency Safe Drinking Water
Act (SWDA) promulgated in Florida by the Department of Environment (FDEP), plus additional
requirements and limitations not included in the SDWA-based regulations. For example, the fluoride limit
in Exhibit D has more stringent numeric limit than the SDWA-based regulations, also referred as
maximum contaminant limits (MCLs). Exhibit D also requires more frequent monitoring/testing than the
SDWA-based regulations. This is because the concentration limits for each parameter are assessed
against the analytical results from a twelve-month running annual average sampling program. Exhibit D
also includes additional parameters with numeric limits, which are not required by the SDWA, including
conductivity, temperature, total sulfide, ammonia, alkalinity, total hardness, calcium hardness,
orthophosphate, and total organic carbon. A comparison of SDWA limits as applied by the Florida
Department of Environment (FDEP) and Exhibit D limits are shown in Table ES-1.
Tampa Bay Water
Evaluation of Exhibit D Water Quality
Final Report
| Executive Summary vi
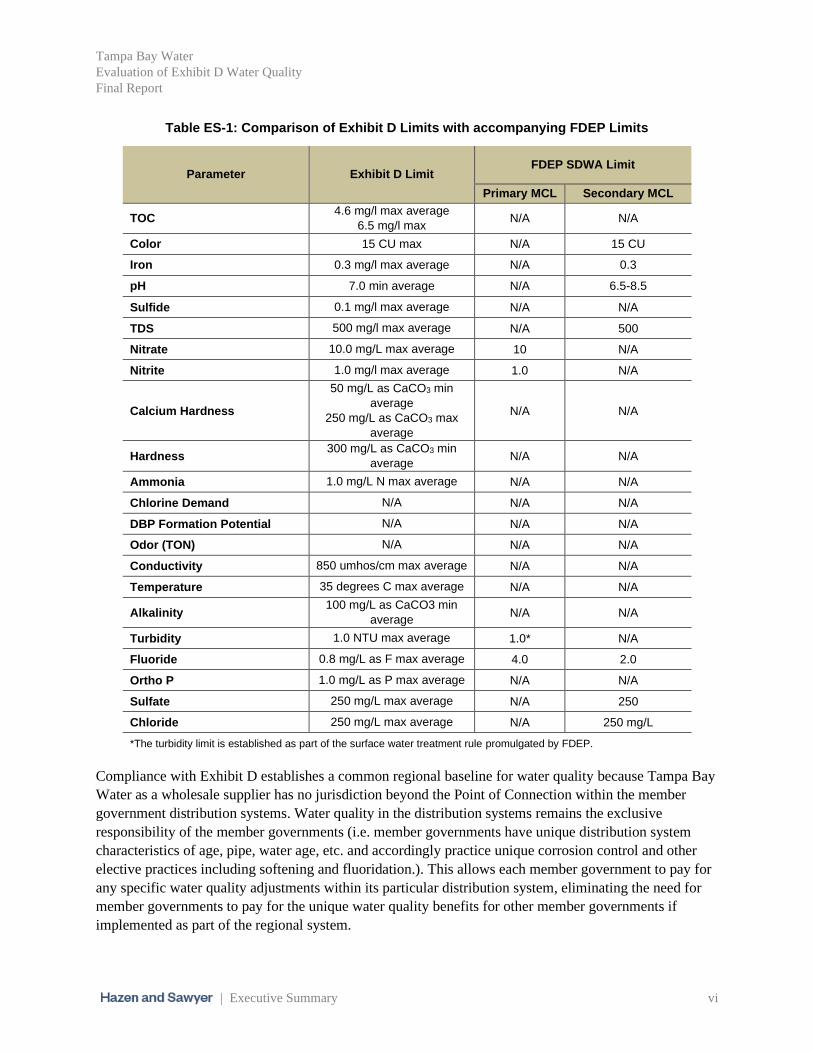
Table ES-1: Comparison of Exhibit D Limits with accompanying FDEP Limits
Parameter Exhibit D Limit FDEP SDWA Limit
Primary MCL Secondary MCL
TOC 4.6 mg/l max average
6.5 mg/l max N/A N/A
Color 15 CU max N/A 15 CU
Iron 0.3 mg/l max average N/A 0.3
pH 7.0 min average N/A 6.5-8.5
Sulfide 0.1 mg/l max average N/A N/A
TDS 500 mg/l max average N/A 500
Nitrate 10.0 mg/L max average 10 N/A
Nitrite 1.0 mg/l max average 1.0 N/A
Calcium Hardness
50 mg/L as CaCO3 min
average
250 mg/L as CaCO3 max
average
N/A N/A
Hardness 300 mg/L as CaCO3 min
average N/A N/A
Ammonia 1.0 mg/L N max average N/A N/A
Chlorine Demand N/A N/A N/A
DBP Formation Potential N/A N/A N/A
Odor (TON) N/A N/A N/A
Conductivity 850 umhos/cm max average N/A N/A
Temperature 35 degrees C max average N/A N/A
Alkalinity 100 mg/L as CaCO3 min
average N/A N/A
Turbidity 1.0 NTU max average 1.0* N/A
Fluoride 0.8 mg/L as F max average 4.0 2.0
Ortho P 1.0 mg/L as P max average N/A N/A
Sulfate 250 mg/L max average N/A 250
Chloride 250 mg/L max average N/A 250 mg/L
*The turbidity limit is established as part of the surface water treatment rule promulgated by FDEP.
Compliance with Exhibit D establishes a common regional baseline for water quality because Tampa Bay
Water as a wholesale supplier has no jurisdiction beyond the Point of Connection within the member
government distribution systems. Water quality in the distribution systems remains the exclusive
responsibility of the member governments (i.e. member governments have unique distribution system
characteristics of age, pipe, water age, etc. and accordingly practice unique corrosion control and other
elective practices including softening and fluoridation.). This allows each member government to pay for
any specific water quality adjustments within its particular distribution system, eliminating the need for
member governments to pay for the unique water quality benefits for other member governments if
implemented as part of the regional system.

Tampa Bay Water
Evaluation of Exhibit D Water Quality
Final Report
| Executive Summary vii
While today’s water quality is the highest ever delivered to Tampa Bay Water’s customers, meeting or
surpassing federal, state and Exhibit D standards, it is beneficial and logical to examine whether water
quality improvements can be made to better serve the member governments and the region, recognizing it
has been more than a decade since the last in-depth examination.
In 2017, the member governments requested that Tampa Bay Water evaluate several of the water quality
parameters within Exhibit D to improve water quality, which may enhance water quality within the
member governments’ distribution systems. The motivation for the potential changes is based on a more
consistent delivery of a higher quality water that would lead to improving the stability of the disinfectant
residual and further reducing disinfection byproduct formation (DBPs) in the member government
distribution systems. Additional benefits of enhanced water quality include potential reductions in
nitrification events, flushing volumes within the distribution systems, and potential taste and odor events.
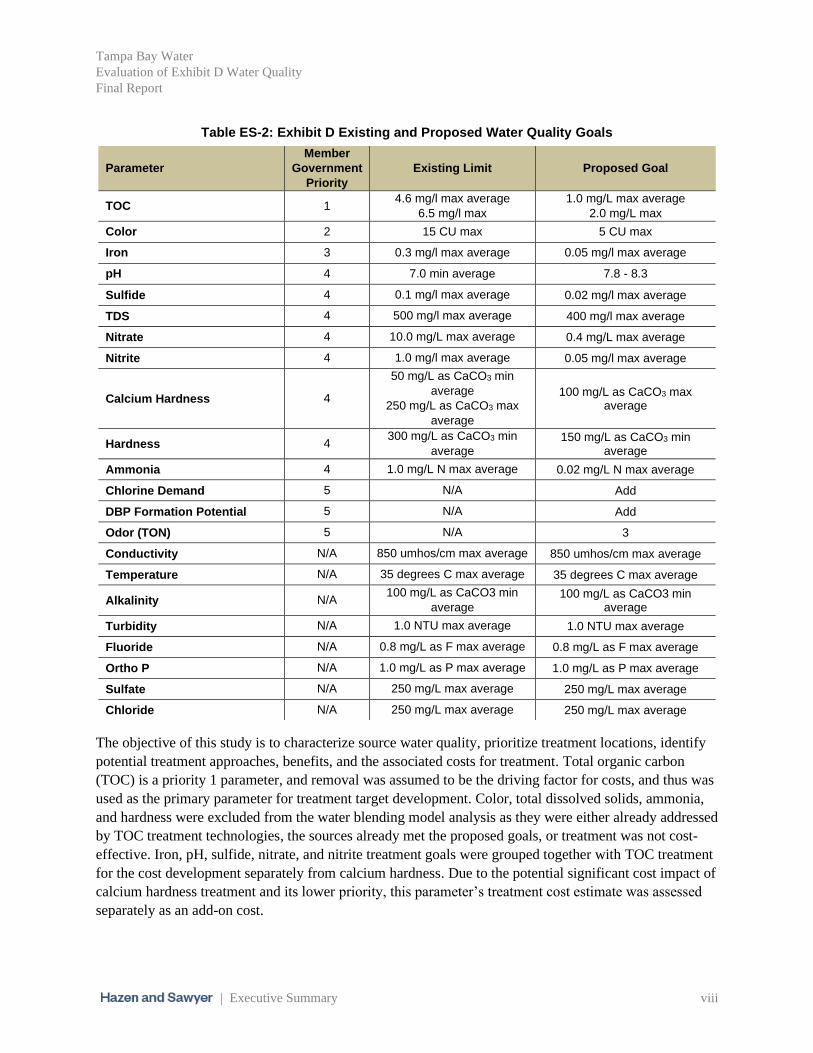
Table ES-2 summarizes the existing Exhibit D water quality limits and future water quality goals that are
evaluated in this report.
Tampa Bay Water
Evaluation of Exhibit D Water Quality
Final Report
| Executive Summary viii
Table ES-2: Exhibit D Existing and Proposed Water Quality Goals
Parameter
Member
Government
Priority
Existing Limit Proposed Goal
TOC 1 4.6 mg/l max average
6.5 mg/l max
1.0 mg/L max average 2.0 mg/L max
Color 2 15 CU max 5 CU max
Iron 3 0.3 mg/l max average 0.05 mg/l max average
pH 4 7.0 min average 7.8 - 8.3
Sulfide 4 0.1 mg/l max average 0.02 mg/l max average
TDS 4 500 mg/l max average 400 mg/l max average
Nitrate 4 10.0 mg/L max average 0.4 mg/L max average
Nitrite 4 1.0 mg/l max average 0.05 mg/l max average
Calcium Hardness 4
50 mg/L as CaCO3 min
average
250 mg/L as CaCO3 max
average
100 mg/L as CaCO3 max average
Hardness 4 300 mg/L as CaCO3 min
average 150 mg/L as CaCO3 min
average
Ammonia 4 1.0 mg/L N max average 0.02 mg/L N max average
Chlorine Demand 5 N/A Add
DBP Formation Potential 5 N/A Add
Odor (TON) 5 N/A 3
Conductivity N/A 850 umhos/cm max average 850 umhos/cm max average
Temperature N/A 35 degrees C max average 35 degrees C max average
Alkalinity N/A 100 mg/L as CaCO3 min
average 100 mg/L as CaCO3 min
average
Turbidity N/A 1.0 NTU max average 1.0 NTU max average
Fluoride N/A 0.8 mg/L as F max average 0.8 mg/L as F max average
Ortho P N/A 1.0 mg/L as P max average 1.0 mg/L as P max average
Sulfate N/A 250 mg/L max average 250 mg/L max average
Chloride N/A 250 mg/L max average 250 mg/L max average
The objective of this study is to characterize source water quality, prioritize treatment locations, identify
potential treatment approaches, benefits, and the associated costs for treatment. Total organic carbon
(TOC) is a priority 1 parameter, and removal was assumed to be the driving factor for costs, and thus was
used as the primary parameter for treatment target development. Color, total dissolved solids, ammonia,
and hardness were excluded from the water blending model analysis as they were either already addressed
by TOC treatment technologies, the sources already met the proposed goals, or treatment was not cost-
effective. Iron, pH, sulfide, nitrate, and nitrite treatment goals were grouped together with TOC treatment
for the cost development separately from calcium hardness. Due to the potential significant cost impact of
calcium hardness treatment and its lower priority, this parameter’s treatment cost estimate was assessed
separately as an add-on cost.

Tampa Bay Water
Evaluation of Exhibit D Water Quality
Final Report
| Executive Summary ix
Data Evaluation
Based on a historical review and evaluation of existing and supplemental data, a detailed model of the
system was developed to estimate target TOC values at the points of connection, which are summarized
in Table ES-3. Since TTHM formation is a function of both TOC concentration and time, these TOC
targets represented different estimated residence times where the TTHM concentration would remain
below 80 ppb.
Table ES-3: Selected Annual Average TOC Targets
TOC Target (mg/L)
Basis for Target(1)
Approx.
TTHM Concentration (2)
Approx. Residence Time in
Distribution System under free
chlorine
2.00 < 80 ppb < 3 days
1.50 < 80 ppb 3 to 5 days
1.25 < 80 ppb 5 to 7 days
1.00(3) < 80 ppb >7 days
1. Predicted TTHM concentration for a given incubation time based on analyzed SDS data.
2. TTHM or Total Trihalomethanes is a class of the disinfection byproducts (DBPs)
3. Member government requested max average proposed goal
The four annual average TOC targets at each Point of Connection were utilized in the water blending
model to determine the TOC and other water quality treatment requirements for the various source waters
that supply the Points of Connections. The evaluated scenarios are summarized in Table ES-4, which
were used to identify the required level of treatment at each source to achieve the targets at the Points of
Connections.
Table ES-4: Identified Treatment Scenarios
Scenario A Scenario B Scenario C Scenario D
2.0 mg/L TOC 1.5 mg/L TOC 1.25 mg/L TOC 1.0 mg/L TOC
Common Treatment Goals Among Scenarios
Iron – 0.05 mg/L
Sulfide – 0.02 mg/L
Nitrate – 0.4 mg/L-N
Nitrite – 0.05 mg/L-N
Calcium – 100 mg/L as
CaCO3 pH – 7.8 – 8.3
Estimated Treatment Requirements
It was assumed that treatment would be applied to sources rather than the POC. Treating at the source
allowed for treatment selection that was tailored for the water quality conditions unique to each source.
For example, if a POC was fed from three sources, but only one source had sulfide, then sulfide treatment
could be applied to that specific source rather than sizing sulfide treatment for the entire flow at the POC,
Tampa Bay Water
Evaluation of Exhibit D Water Quality
Final Report
| Executive Summary x
which would increase the overall cost. This source-treatment approach allowed for increased flexibility in
process selection, while ultimately focusing on the water quality at the POC which was often a blend of
multiple sources.
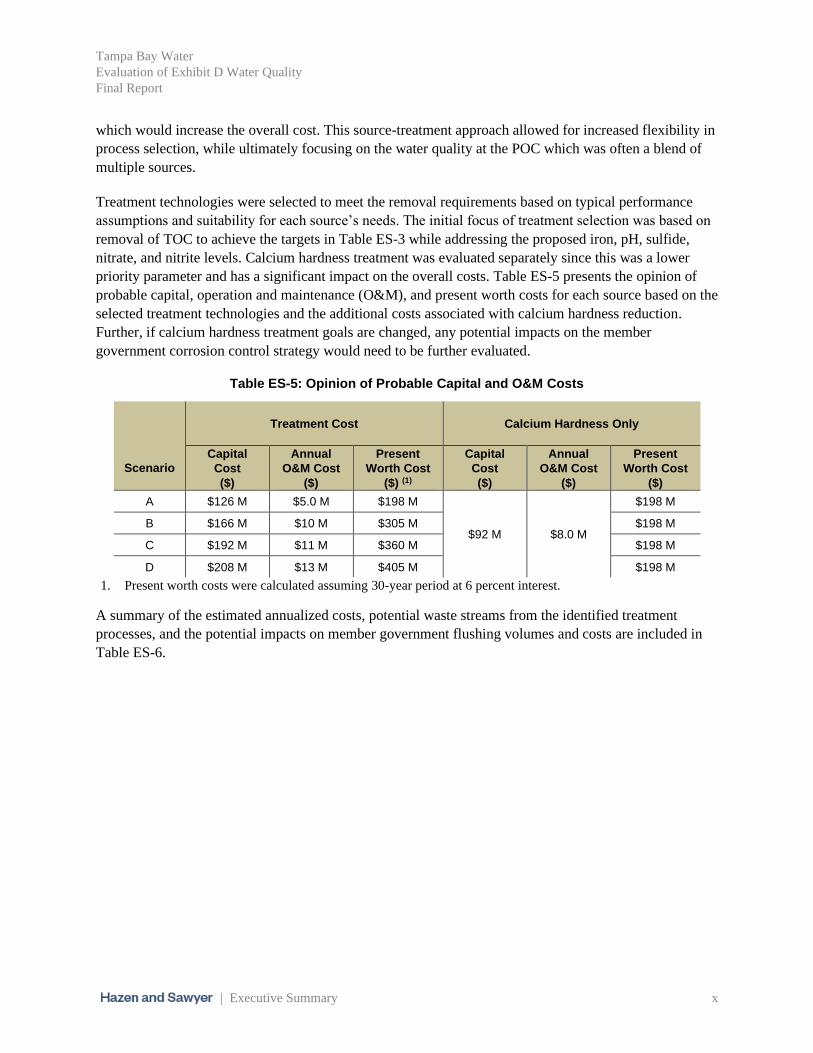
Treatment technologies were selected to meet the removal requirements based on typical performance
assumptions and suitability for each source’s needs. The initial focus of treatment selection was based on
removal of TOC to achieve the targets in Table ES-3 while addressing the proposed iron, pH, sulfide,
nitrate, and nitrite levels. Calcium hardness treatment was evaluated separately since this was a lower
priority parameter and has a significant impact on the overall costs. Table ES-5 presents the opinion of
probable capital, operation and maintenance (O&M), and present worth costs for each source based on the
selected treatment technologies and the additional costs associated with calcium hardness reduction.
Further, if calcium hardness treatment goals are changed, any potential impacts on the member
government corrosion control strategy would need to be further evaluated.
Table ES-5: Opinion of Probable Capital and O&M Costs
Scenario
Treatment Cost Calcium Hardness Only
Capital
Cost
($)
Annual
O&M Cost
($)
Present
Worth Cost
($) (1)
Capital
Cost
($)
Annual
O&M Cost
($)
Present
Worth Cost
($)
A $126 M $5.0 M $198 M
$92 M $8.0 M
$198 M
B $166 M $10 M $305 M $198 M
C $192 M $11 M $360 M $198 M
D $208 M $13 M $405 M $198 M
1. Present worth costs were calculated assuming 30-year period at 6 percent interest.
A summary of the estimated annualized costs, potential waste streams from the identified treatment
processes, and the potential impacts on member government flushing volumes and costs are included in
Table ES-6.

Tampa Bay Water
Evaluation of Exhibit D Water Quality
Final Report
| Executive Summary xi
Table ES-6: Summary of Estimated Costs and Impacts on Waste Stream Generation & Flushing S
ce
na
rio
Estimated Amortized Total
Treatment Cost (1)
($/yr)
Estimated Waste Stream
Generation
(MG/yr)
Potential Benefit
Reduced Flushing
Parameters
(except Ca+) (2)
Calcium
Hardness Only (3)
Parameters
(except Ca+) (2)
Calcium
Hardness
Only (3)
Volume
Reduction
(MG/yr)
Cost
Savings
($/yr)
A $14 M $15 M 600 580 450 $1.1 M
B $22 M $15 M 720 580 580 $1.4 M
C $25 M $15 M 950 580 760 $1.9 M
D $29 M $15 M 1,130 580 900 $2.3 M
1. Amortized costs represent the summation of capital and operation and maintenance costs spread over a 30-
year period at 6 percent interest.
2. Treatment for all water goals with the exception of calcium hardness
3. Additional costs to incorporate calcium hardness treatment.
4. Additional waste stream volume generation due to calcium hardness treatment.
Recommendation and Next Steps
Table ES-7 summarizes the overall potential water quality benefits for each scenario as TOC levels are
reduced.
Table ES-7: Summary of Potential Water Quality Benefits
Scenario
Potential Water Quality Benefits (1)
Residual
Stability THM Formation Taste & Odor (2)
Nitrification
Potential Hardness
A
B
C
D
1. Full green circle represents maximum benefit and quarter green circle represents minimum benefit. 2. Taste and odor impacts are not exclusively tied to TOC reduction; however, some TOC removal processes
also address sources of taste and odor.
Tampa Bay Water
Evaluation of Exhibit D Water Quality
Final Report
| Executive Summary xii
While ES-7 describes benefits qualitatively, results which demonstrate quantitative benefits are shown in
the main report. Figure 2-11 and Figure 2-12 illustrate quantitative benefits related to chlorine and
chloramine decay rates, while Figure 2-13 and Figure 2-14 illustrate quantitative benefits related to THM
formation potential.
In general, the following are the potential overall water quality benefits based on the findings from the
study:
• Reducing TOC is expected to improve water quality and provide a more consistent supply
throughout the region, reducing the need for additional treatment (i.e. disinfection boost) by each
member government in response to TOC and other water quality variables.
• Improving regional water quality should help the member governments manage water quality in
their distribution systems by increasing the residual stability and reducing potential for taste and
odor, while decreasing flushing due to both TOC and nitrification.
• Lower TOC levels will reduce DBP formation during free chlorine burns or if a free chlorine
residual is maintained within the system.
• The extent of water quality improvements increases as the TOC level is reduced.
Based on the findings of this study and the overall approach, the following are the recommended next
steps:
• Collect additional water quality data needed to update the system model and assumptions.
• Confirm residence times in member government distribution systems to verify potential impacts
on trihalomethane formation.
• Continue to refine the model by collecting additional water quality data to confirm basic
assumptions.
• Perform bench/pilot studies on the potential treatment technologies to confirm the design criteria
and costs.
• Further evaluate ability to phase the level of treatment and impact on required timing of
treatment.
• Further evaluate any potential impacts on member government corrosion control strategies.
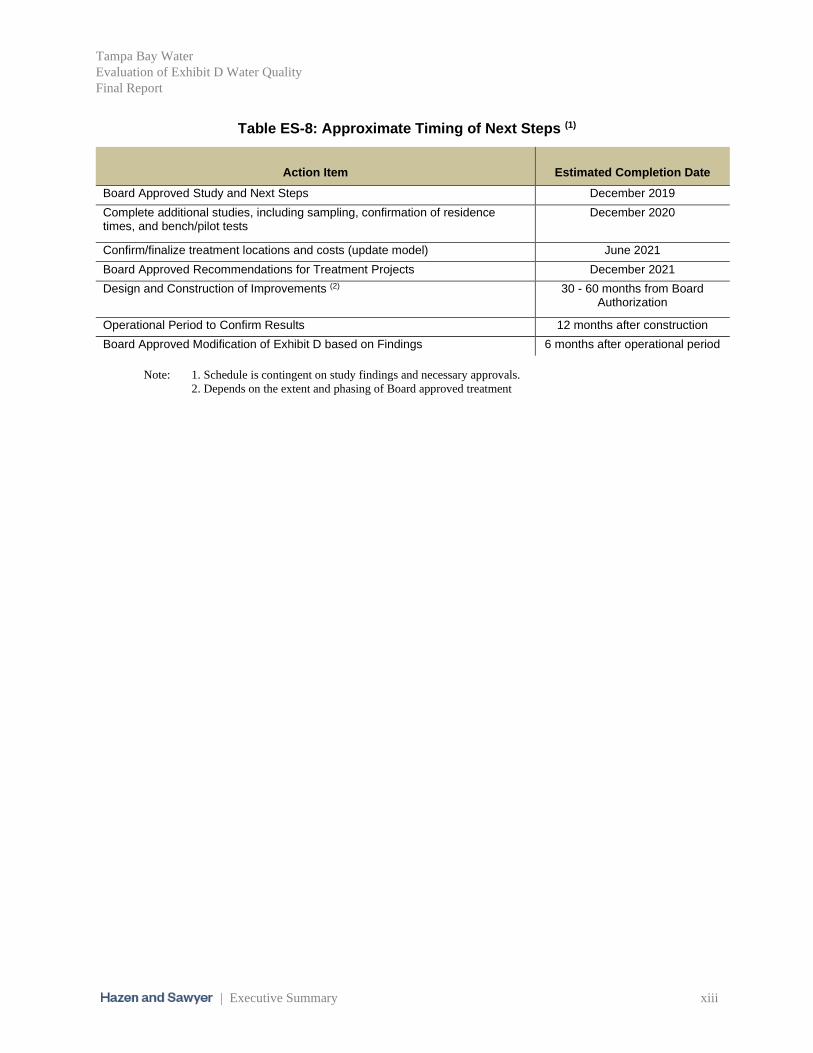
It is recommended that these next steps be completed before finalizing treatment locations and
technologies. Once finalized and approved, treatment would be installed in phases at the recommended
locations to demonstrate success under various source water conditions before modifying Exhibit D.
Table ES-8 summarizes the anticipated activities and approximate timing of these future activities.
Tampa Bay Water
Evaluation of Exhibit D Water Quality
Final Report
| Executive Summary xiii
Table ES-8: Approximate Timing of Next Steps (1)
Action Item Estimated Completion Date
Board Approved Study and Next Steps December 2019
Complete additional studies, including sampling, confirmation of residence times, and bench/pilot tests
December 2020
Confirm/finalize treatment locations and costs (update model) June 2021
Board Approved Recommendations for Treatment Projects December 2021
Design and Construction of Improvements (2) 30 - 60 months from Board Authorization
Operational Period to Confirm Results 12 months after construction
Board Approved Modification of Exhibit D based on Findings 6 months after operational period
Note: 1. Schedule is contingent on study findings and necessary approvals.
2. Depends on the extent and phasing of Board approved treatment
Tampa Bay Water
Evaluation of Exhibit D Water Quality
Final Report
| Introduction 1-1
1. Introduction
1.1 Background
Tampa Bay Water is a regional wholesale water provider that delivers supply to its six member
governments: Hillsborough County, Pinellas County, Pasco County, and the Cities of Tampa, St.
Petersburg, and New Port Richey. Each delivery location or point of connection (POC) has requirements
for water quality per the Master Water Supply Contract. Tampa Bay Water is also required to maintain
service to meet projected demands at these POCs. Tampa Bay Water utilizes groundwater, surface water,
and seawater sources and various treatment locations and technologies to consistently meet the Master
Water Supply Contract requirements.
In 1998, the six member governments approved an amended version of the contract after more than a year
of negotiations, which included the attachment of Exhibit D. Exhibit D, modified in 2004, states the
criteria for Quality Water and provides avenues for revisions to address new regulatory guidelines or
customer demands.
Quality Water is drinking water that meets primary and secondary drinking water standards as defined by
the United States Environmental Protection Agency Safe Drinking Water Act (SWDA) promulgated in
Florida by the Department of Environment (FDEP), plus additional requirements and limitations not
included in the SDWA-based regulations. For example, the fluoride limit in Exhibit D has more stringent
numeric limit than the SDWA-based regulations, also referred as maximum contaminant limits (MCLs).
Exhibit D also requires more frequent monitoring/testing than the SDWA-based regulations. This is
because the concentration limits for each parameter are assessed against the analytical results from a
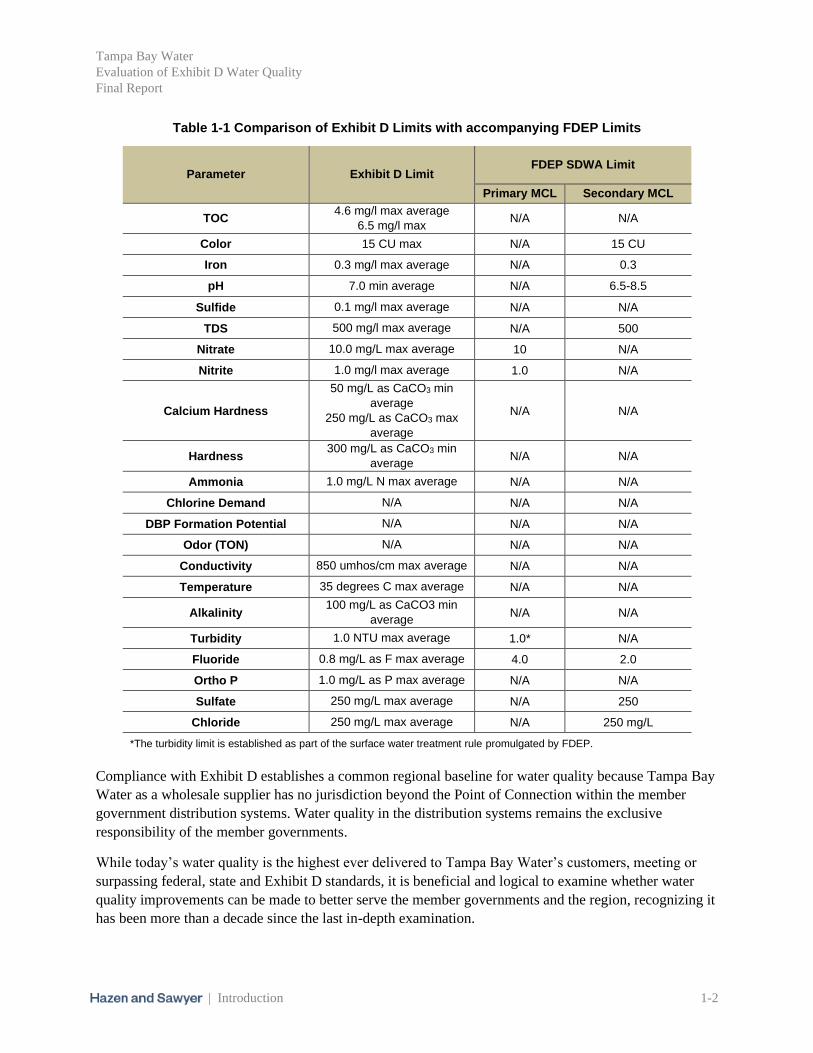
twelve-month running annual average sampling program. Exhibit D also includes additional parameters
with numeric limits, which are not required by the SDWA, including conductivity, temperature, total
sulfide, ammonia, alkalinity, total hardness, calcium hardness, orthophosphate, and total organic carbon.
A comparison of SDWA limits as applied by the Florida Department of Environment (FDEP) and Exhibit
D limits are shown in Table 1-1.
Tampa Bay Water
Evaluation of Exhibit D Water Quality
Final Report
| Introduction 1-2
Table 1-1 Comparison of Exhibit D Limits with accompanying FDEP Limits
Parameter Exhibit D Limit FDEP SDWA Limit
Primary MCL Secondary MCL
TOC 4.6 mg/l max average
6.5 mg/l max N/A N/A
Color 15 CU max N/A 15 CU
Iron 0.3 mg/l max average N/A 0.3
pH 7.0 min average N/A 6.5-8.5
Sulfide 0.1 mg/l max average N/A N/A
TDS 500 mg/l max average N/A 500
Nitrate 10.0 mg/L max average 10 N/A
Nitrite 1.0 mg/l max average 1.0 N/A
Calcium Hardness
50 mg/L as CaCO3 min
average
250 mg/L as CaCO3 max
average
N/A N/A
Hardness 300 mg/L as CaCO3 min
average N/A N/A
Ammonia 1.0 mg/L N max average N/A N/A
Chlorine Demand N/A N/A N/A
DBP Formation Potential N/A N/A N/A
Odor (TON) N/A N/A N/A
Conductivity 850 umhos/cm max average N/A N/A
Temperature 35 degrees C max average N/A N/A
Alkalinity 100 mg/L as CaCO3 min
average N/A N/A
Turbidity 1.0 NTU max average 1.0* N/A
Fluoride 0.8 mg/L as F max average 4.0 2.0
Ortho P 1.0 mg/L as P max average N/A N/A
Sulfate 250 mg/L max average N/A 250
Chloride 250 mg/L max average N/A 250 mg/L
*The turbidity limit is established as part of the surface water treatment rule promulgated by FDEP.
Compliance with Exhibit D establishes a common regional baseline for water quality because Tampa Bay
Water as a wholesale supplier has no jurisdiction beyond the Point of Connection within the member
government distribution systems. Water quality in the distribution systems remains the exclusive
responsibility of the member governments.
While today’s water quality is the highest ever delivered to Tampa Bay Water’s customers, meeting or
surpassing federal, state and Exhibit D standards, it is beneficial and logical to examine whether water
quality improvements can be made to better serve the member governments and the region, recognizing it
has been more than a decade since the last in-depth examination.
Tampa Bay Water
Evaluation of Exhibit D Water Quality
Final Report
| Introduction 1-3
In 2017, the member governments requested that Tampa Bay Water evaluate several of the water quality
parameters within Exhibit D to improve water quality, which may enhance water quality within the
member governments’ distribution systems. The motivation for the potential changes is based on a more
consistent delivery of a higher quality water that would lead to improving the stability of the disinfectant
residual and further reducing disinfection byproduct formation (DBPs) in the member government
distribution systems. Additional benefits of enhanced water quality include potential reductions in
nitrification events, flushing volumes within the distribution systems, and potential taste and odor events.
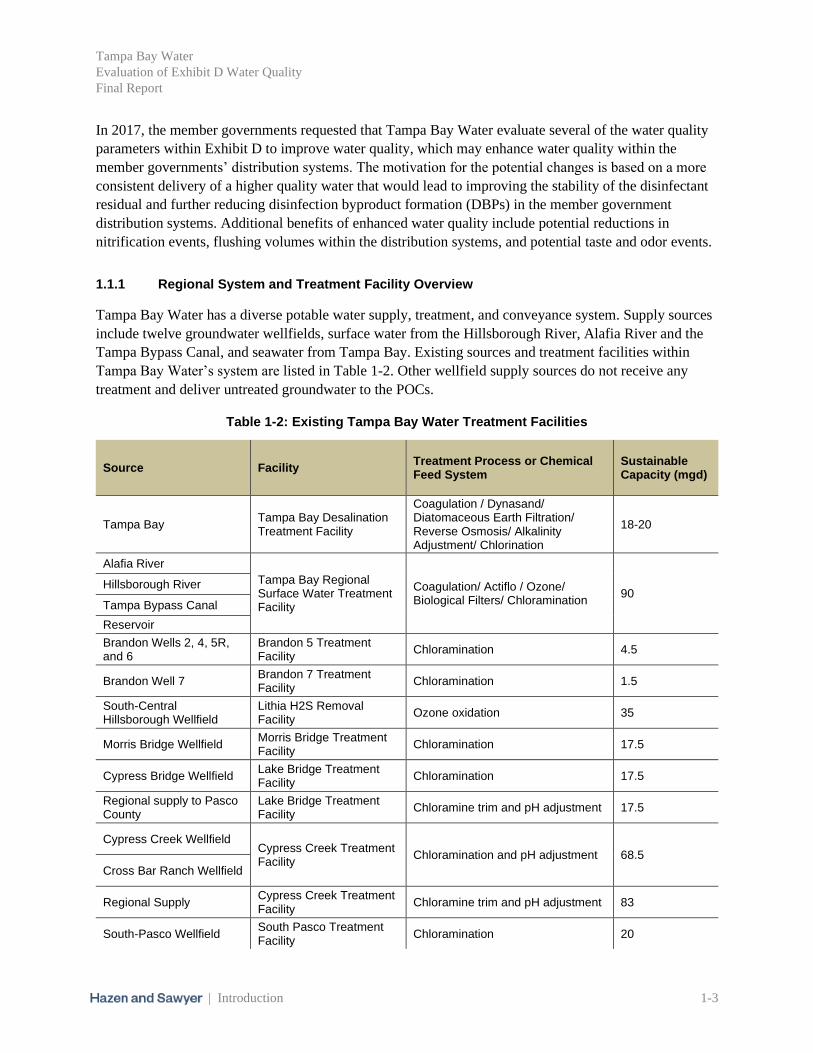
1.1.1 Regional System and Treatment Facility Overview
Tampa Bay Water has a diverse potable water supply, treatment, and conveyance system. Supply sources
include twelve groundwater wellfields, surface water from the Hillsborough River, Alafia River and the
Tampa Bypass Canal, and seawater from Tampa Bay. Existing sources and treatment facilities within
Tampa Bay Water’s system are listed in Table 1-2. Other wellfield supply sources do not receive any
treatment and deliver untreated groundwater to the POCs.
Table 1-2: Existing Tampa Bay Water Treatment Facilities
Source Facility Treatment Process or Chemical Feed System
Sustainable Capacity (mgd)
Tampa Bay Tampa Bay Desalination Treatment Facility
Coagulation / Dynasand/ Diatomaceous Earth Filtration/ Reverse Osmosis/ Alkalinity Adjustment/ Chlorination
18-20
Alafia River
Tampa Bay Regional Surface Water Treatment Facility
Coagulation/ Actiflo / Ozone/ Biological Filters/ Chloramination
90 Hillsborough River
Tampa Bypass Canal
Reservoir
Brandon Wells 2, 4, 5R, and 6
Brandon 5 Treatment Facility
Chloramination 4.5
Brandon Well 7 Brandon 7 Treatment Facility
Chloramination 1.5
South-Central Hillsborough Wellfield
Lithia H2S Removal Facility
Ozone oxidation 35
Morris Bridge Wellfield Morris Bridge Treatment Facility
Chloramination 17.5
Cypress Bridge Wellfield Lake Bridge Treatment Facility
Chloramination 17.5
Regional supply to Pasco County
Lake Bridge Treatment Facility
Chloramine trim and pH adjustment 17.5
Cypress Creek Wellfield Cypress Creek Treatment Facility
Chloramination and pH adjustment 68.5
Cross Bar Ranch Wellfield
Regional Supply Cypress Creek Treatment Facility
Chloramine trim and pH adjustment 83
South-Pasco Wellfield South Pasco Treatment Facility
Chloramination 20
Tampa Bay Water
Evaluation of Exhibit D Water Quality
Final Report
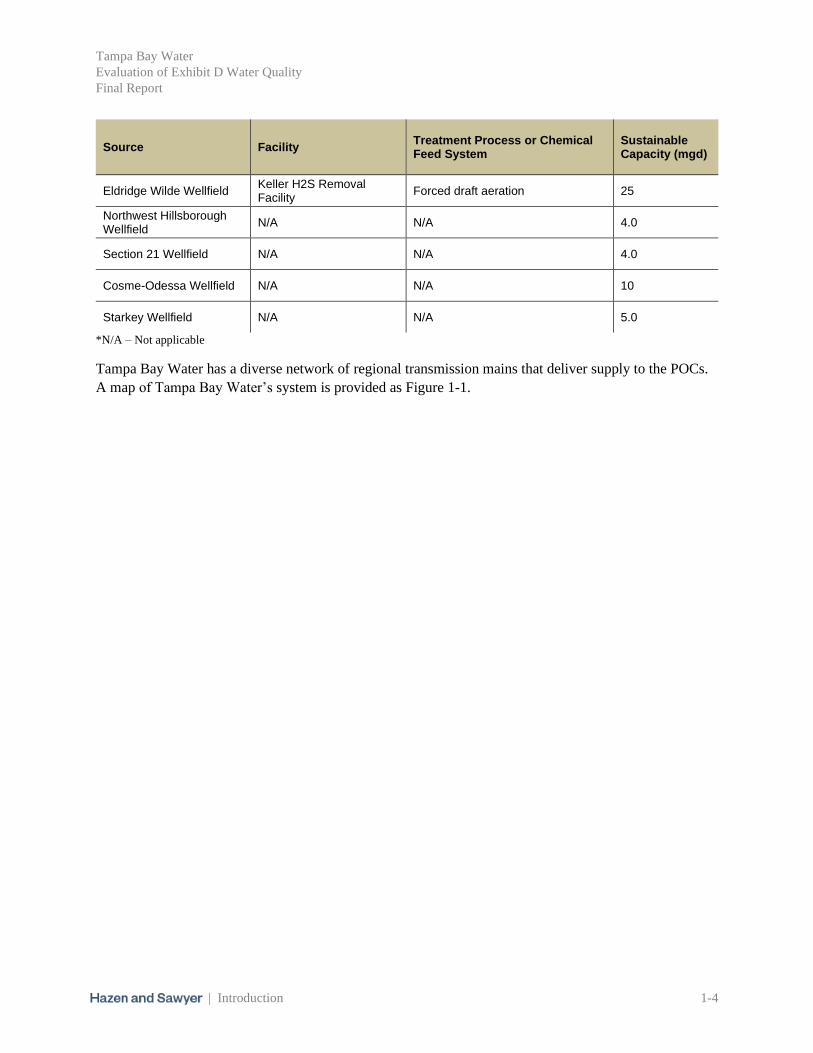
| Introduction 1-4
Source Facility Treatment Process or Chemical Feed System
Sustainable Capacity (mgd)
Eldridge Wilde Wellfield Keller H2S Removal Facility
Forced draft aeration 25
Northwest Hillsborough Wellfield
N/A N/A 4.0
Section 21 Wellfield N/A N/A 4.0
Cosme-Odessa Wellfield N/A N/A 10
Starkey Wellfield N/A N/A 5.0
*N/A – Not applicable
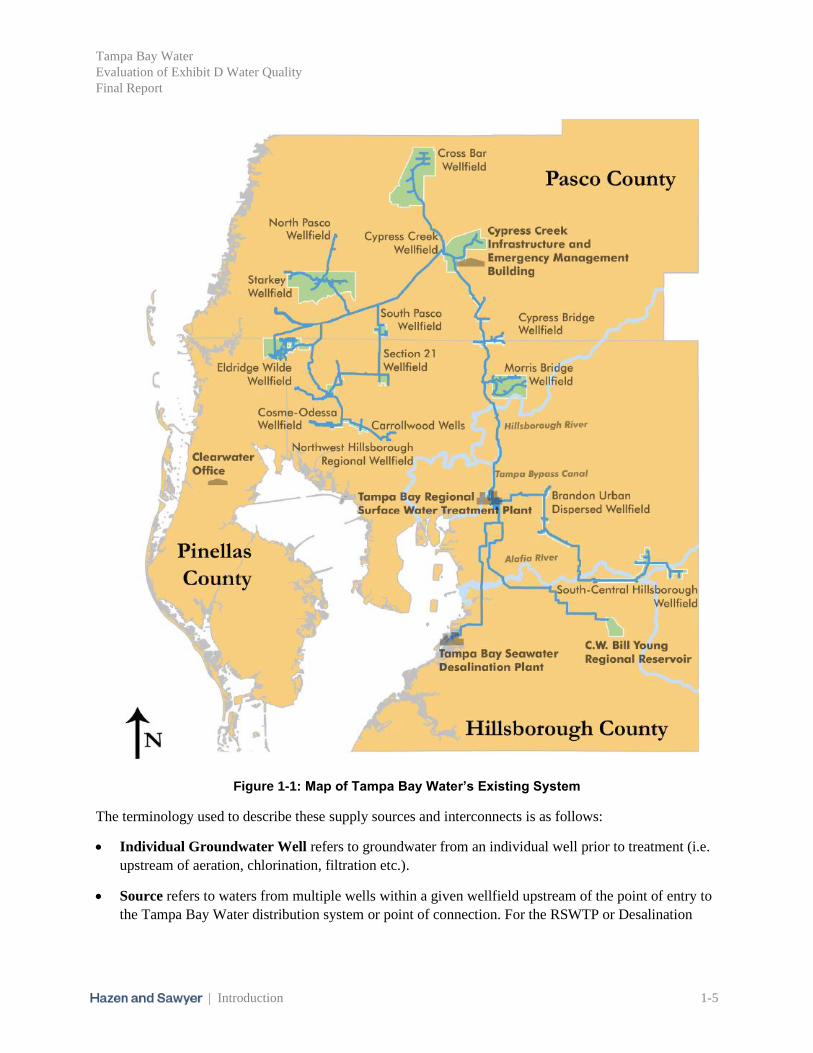
Tampa Bay Water has a diverse network of regional transmission mains that deliver supply to the POCs.
A map of Tampa Bay Water’s system is provided as Figure 1-1.
Tampa Bay Water
Evaluation of Exhibit D Water Quality
Final Report
| Introduction 1-5
Figure 1-1: Map of Tampa Bay Water’s Existing System
The terminology used to describe these supply sources and interconnects is as follows:
• Individual Groundwater Well refers to groundwater from an individual well prior to treatment (i.e.
upstream of aeration, chlorination, filtration etc.).
• Source refers to waters from multiple wells within a given wellfield upstream of the point of entry to
the Tampa Bay Water distribution system or point of connection. For the RSWTP or Desalination
Tampa Bay Water
Evaluation of Exhibit D Water Quality
Final Report
| Introduction 1-6
Plant, this point would be represented as the treated surface or desalinated water leaving the leaving
the facilities.
• Regional Point of Entry (RPOE) refers to the point at which a single source water enters the Tampa
Bay Water regional transmission system or blends with other sources.
• Regional Water refers to finished, potable water being conveyed through the Tampa Bay Water
Regional System.
• Point of Connection (POC) refers to the point at which system water is conveyed to a member
government.
Figure 1-2 presents two generic examples of how water is blended from source(s) to each POC.

Tampa Bay Water
Evaluation of Exhibit D Water Quality
Final Report
| Introduction 1-7
Figure 1-2: Conceptual System Diagram
Tampa Bay Water
Evaluation of Exhibit D Water Quality
Final Report
| Introduction 1-8
1.1.2 Exhibit D Water Quality Criteria Background
Exhibit D is an attachment to the Master Water Supply Contract, which was approved in 1998 along with
the agency’s Amended and Restated Interlocal Agreement. At that time, the six member governments and
their administrative heads and counsel negotiated Exhibit D to allow for periodic review of water quality
limits to address changes in regulations or customer demands. Water that meets these criteria is referred
to as Quality Water, which Tampa Bay Water consistently meets at each POC. Quality Water is defined
as drinking water that meets primary and secondary drinking water standards as defined by the United
States Environmental Protection Agency, plus three additional parameters for sulfides, total hardness and
alkalinity. The concentration limits for each parameter are assessed against the analytical results from a
twelve-month running annual average sampling program.
With the selection of alternative water supplies in the 1998 Master Water Plan, Tampa Bay Water
investigated the best way to maintain a disinfectant residual in the system while meeting new, more
stringent federal drinking water standards. Following a series of workshops with the Board and utility
directors, chloramines were selected in 2001 as the preferred disinfectant and in May 2002, Tampa Bay
Water changed its secondary disinfection to chloramines. Chloramines reduces the formation of
disinfection byproducts, provides a cost-effective way to maintain regulatory compliance, reduces
chlorine taste and smell, and provides a more stable, long-lasting disinfectant residual in the regional
distribution system.
In 2004, after about two years operating the system with chloramines and after more than a year of
operating with new surface water sources in the regional system, Tampa Bay Water and the member
governments revised Exhibit D, adding and deleting some parameters, changing some parameter limits
and adding a running annual average calculation from monthly sampling for parameter compliance. These
Exhibit D changes were evaluated in detail as part of the Water Research Foundation Tailored
Collaboration study, which looked at the effects of the new water sources on member government
distribution systems.
1.1.3 Potential Exhibit D Changes
While today’s water quality is the highest ever delivered to Tampa Bay Water’s customers, meeting or
surpassing federal, state and Exhibit D standards, it is beneficial and logical to examine whether water
quality improvements can be made to better serve the member governments and the region, recognizing it
has been more than a decade since the last in-depth examination. In 2017, the member governments
requested that Tampa Bay Water evaluate several of the water quality parameters within Exhibit D to
improve water quality, which may enhance water quality within the member governments’ distribution
systems. The motivation for the potential changes is based on a more consistent delivery of a higher
quality water that would lead to improving the stability of the disinfectant residual and further reducing
disinfection byproduct formation (DBPs) in the member government distribution systems. Additional
benefits of enhanced water quality include potential reductions in nitrification events, flushing volumes
within the distribution systems, and potential taste and odor events. Improved residual stability, which
would reduce flushing volumes, is an anticipated benefit of operating with lower TOC. Both bulk chlorine
decay would likely improve along with reduced nitrification. Operation under free chlorine would
eliminate the potential for nitrification events.

Tampa Bay Water
Evaluation of Exhibit D Water Quality
Final Report
| Introduction 1-9
The table in Appendix A lists the existing criteria, the requests from each member government, and the
agreed upon “for study” values that were considered as part of this evaluation. Table 1-3 summarizes the
prioritized water quality parameters that are addressed as part of this report.
Table 1-3: Existing and Proposed Exhibit D Water Quality Parameter limits
Parameter
Member
Government
Priority
Existing Limit Proposed Goal
TOC 1 4.6 mg/l max average
6.5 mg/l max
1.0 mg/L max average 2.0 mg/L max
Color 2 15 CU max 5 CU max
Iron 3 0.3 mg/l max average 0.05 mg/l max average
pH 4 7.0 min average 7.8 - 8.3
Sulfide 4 0.1 mg/l max average 0.02 mg/l max average
TDS 4 500 mg/l max average 400 mg/l max average
Nitrate 4 10.0 mg/L max average 0.4 mg/L max average
Nitrite 4 1.0 mg/l max average 0.05 mg/l max average
Calcium Hardness 4
50 mg/L as CaCO3 min
average
250 mg/L as CaCO3 max
average
100 mg/L as CaCO3 max average
Hardness 4 300 mg/L as CaCO3 min
average 150 mg/L as CaCO3 min
average
Ammonia 4 1.0 mg/L N max average 0.02 mg/L N max average
Chlorine Demand 5 N/A Add
DBP Formation Potential 5 N/A Add
Odor (TON) 5 N/A 3
Conductivity N/A 850 umhos/cm max average 850 umhos/cm max average
Temperature N/A 35 degrees C max average 35 degrees C max average
Alkalinity N/A 100 mg/L as CaCO3 min
average 100 mg/L as CaCO3 min
average
Turbidity N/A 1.0 NTU max average 1.0 NTU max average
Fluoride N/A 0.8 mg/L as F max average 0.8 mg/L as F max average
Ortho P N/A 1.0 mg/L as P max average 1.0 mg/L as P max average
Sulfate N/A 250 mg/L max average 250 mg/L max average
Chloride N/A 250 mg/L max average 250 mg/L max average
1.2 Objectives
The objective of this study was to characterize source water quality, prioritize treatment locations,
identify potential treatment approaches, benefits, and the associated costs for treatment to meet the
proposed water quality changes, which will begin to inform Tampa Bay Water and the member
governments on the implications of changing the Exhibit D requirements and identify next steps to further
refine the implications. Each of the parameters listed in Table 1-3 were evaluated during this study;
Tampa Bay Water
Evaluation of Exhibit D Water Quality
Final Report
| Introduction 1-10
however, a significant focus of the study was the evaluation of the proposed TOC goal since this goal was
the highest priority of the member governments and was expected to drive the need for most of the
proposed treatment and associated cost.
1.3 Scope of Work
The overall scope of work for this project includes:
• Evaluation of the desired, prioritized water quality parameters as summarized in Table 1-3.
• Identification and prioritization of source waters that require the highest level of treatment by
considering both concentrations and characterization of the source water quality.
• Estimation of the benefits of various reduced TOC levels and the approach to treating TOC that
could achieve those benefits.
• Development of planning level capital and operating costs using currently available,
conventional treatment technologies for the identified alternative TOC levels as well as other
proposed Exhibit D changes as referenced in Table 1-3.
The approach focused on providing Quality Water at each POC by applying either specific treatment as
required at the source water or abandoning/replacing existing water sources where practical. This was in
lieu of assessing the water quality requirements directly to the source waters.
The major tasks within the scope of work include the following:
Data Evaluation:
• Data Review and Analysis: The purpose of this task was to summarize existing relevant data,
identify data gaps, and screen source waters for additional testing.
• Water Quality Characterization and Source Water Prioritization: The purpose of this task
was to characterize the source water quality (TOC and other water quality parameters) of the
screened sources to determine the sources that are considered to have the most impact on water
quality. This is especially important with TOC since TOC reacts differently to form
disinfection byproducts (DBPs) depending on the TOC character and bromide levels.
System Model Development:
• Blend Scenarios and Estimated Travel Time Development: The purpose of this task was to
determine the potential blend scenarios at each POC, to determine the potential impacts on
blending on the source waters. Blending could improve the overall water quality at the POC.
• TOC Model Development and Target TOC Evaluation: The purpose of this task was to
develop a preliminary TOC model that can be used to develop a relationship and DBP
formation and disinfectant decay, which can then be used to determine the target TOC levels.
The model was based on the water quality testing and blending scenario developed in the
previous tasks. Due to the limited schedule, the developed model was designed to be a

Tampa Bay Water
Evaluation of Exhibit D Water Quality
Final Report
| Introduction 1-11
preliminary model and it was assumed that the model would be further refined based on
additional testing and analysis collected in the future.
Estimated Treatment Requirements:
• Treatment Evaluation: The purpose of this task was to identify the currently available
treatment technologies and the planning level capital and operating cost estimates to treat the
identified sources water to meet the potential new target water quality parameters.
Tampa Bay Water
Evaluation of Exhibit D Water Quality
Final Report
| Data Evaluation 2-1
2. Data Evaluation
2.1 Approach
The purpose of the data evaluation was to accomplish the following three objectives:
1) Compile the necessary data to construct a system-wide water quality model - A
systemwide model was necessary to simultaneously predict the resultant water quality
conditions at the POCs while simulating various combinations of treatment at the sources. The
data compiled to support this effort included historical water quality data, new sampling to fill
gaps in historical data, and new sampling to collect data on factors which impact DBP
formation and residual decay. This section describes the data compilation, while the model
development and application are described in Section 3.
2) Collect and analyze the data necessary to estimate benefits of operating at reduced TOC
- Bench-testing studies were conducted to simulate the formation of trihalomethanes (THMs)
and the bulk decay of chlorine in a distribution system. These studies were conducted with
both raw water and with water which had been diluted to simulate treatment. This work
generated the data needed to estimate benefits of operating the Regional system at lower TOC
concentrations. Haloacetic acids (HAAs) were excluded from the study as these DBPs were
not expected to drive treatment needs for the Tampa Bay Water System given the raw water
pH and historical data.
3) Identify target TOC levels leveraging the results of objective 2 - The TOC target levels
were established by interpreting the results of objective 2 using the system model described in
Section 3.
In order to model the Tampa Bay Water system, it was necessary that the concentration of each “priority”
Exhibit D parameters be assumed for each source, with the exception of color and odor since these are not
conservative parameters that can easily be modeled. Although not included in Exhibit D, water quality
parameters such as bromide were of interest since bromide can impact the speciation of Total THMs
(TTHMs). Given the size and complexity of the Tampa Bay Water system, efforts were made to complete
the data evaluation efficiently and with an appropriate level of detail and accuracy for developing
planning-level cost estimates.
Several simplifying assumptions were made to achieve the desired level of detail and are listed below:
1. Each individual groundwater well has a fixed water quality.
2. The treated water output from the RSWTP and from the Desalination Facility were modeled as
fixed sources to the system rather than modeling the raw water being processed through the
RSWTP and Desal treatment process.
3. The treated water output from the RSWTP and Desal has a fixed water quality based on a
combination of historical average conditions and new water quality sampling included with this
study.
Tampa Bay Water
Evaluation of Exhibit D Water Quality
Final Report
| Data Evaluation 2-2
In order to establish the assumed water quality for each source, the last 10 years of historical water quality
data were summarized. Data gaps were then identified for each source and a sampling plan was developed
to fill gaps. To reduce the effort required in taking new samples to fill data gaps, a further simplifying
assumption was established:
4. Wells within the same wellfield, containing similar historical water quality data, drilled to similar
depths, with similar constructed age, have the same water quality.
This fourth simplifying assumption formed the basis of the “Level-1” groups, which reduced the number
of wells that were sampled for this study. Determination of Level-1 groups was a subjective process based
on comparing certain major water quality parameters including TOC, chloride, sulfate, sulfide, iron, and
ammonia. When the criteria of “Assumption 4” were met, those wells were assigned to a “Level-1
group,” and data gaps were filled by pooling and averaging the last five years of data for a given group
and parameter. If there were no historical data available within a group, a field sample was required from
at least one well from each Level-1 group. The detailed Level-1 well sampling protocol is included in
Appendix B.
One group of parameters which is not included in Exhibit D but is of particular interest is trihalomethanes
(THMs). THMs are a group of disinfection byproducts that are formed over time through the reaction of
chlorine and TOC. The summation of chloroform, bromodichloromethane, dibromochloromethane, and
bromoform represent the regulated group of THMs referred to as total THMs (TTHMs). One way to
assess the potential for TOC to convert to THMs is to measure the THM formation potential (THMFP),
which is a test where a sample is incubated with excess chlorine to drive the formation reaction to
completion. By design, THMFP tests typically yield THM results which are significantly higher than in
the actual system since the sample is incubated with very high chlorine residual levels. While less
representative of THM levels in the distribution system, the results are useful in serving as a basis of
relative comparison from source to source. Being a more costly and time-consuming analytical test,
THMFP was not run on Level-1 samples as it was further assumed that the number of THMFP samples
could be reduced if another simplifying assumption was made:
5. Level-1 groups of the same wellfield containing similar TOC (both in concentration and in
character), and bromide levels could be grouped and assumed to have the same THMFP.
This simplifying assumption was based on the knowledge that TOC concentration, TOC character, and
concentration of bromide were the main variables within the Tampa Bay Water regional system that
influence THMFP. Other parameters which impact formation potential such as pH and temperature have
minimal variation across the groundwater sources and were therefore not included in Assumption 5. To
capture the data needed to assess Assumption 5, it was decided that each Level-1 sample would also
include analysis for bromide, TOC, UV-254 absorbance, and fluorescent-excitation-emission-matrices
(FEEM). This is important since depending on the nature of the organic material, the formation of DBPs
may vary even though the TOC concentration is the same between two water sources.
FEEM can describe the class of the organic material (i.e. humic-like, fulvic-like microbiological, etc.). An
example FEEM result is shown in Figure 2-1.

Tampa Bay Water
Evaluation of Exhibit D Water Quality
Final Report
| Data Evaluation 2-3
Figure 2-1: Example FEEM showing Region I, II, and III
The peaks observed in Region I, II, III are correlated to the presence and concentration of microbial-like,
fulvic acid-like, and humic acid-like organic compounds respectfully. For the purpose of analyzing these
results, the peaks were resolved to regional values using the fluorescent regional integration method
described by Chen et. al (2003) 1.
UV-254 absorbance is another useful measurement (when compared against TOC concentration) since it
describes the overall aromaticity of the organic matter. Both the class and aromaticity are known to
impact THMFP. Level-1 results were then analyzed and compared to assign groups which met the criteria
of Assumption 5.
When the criteria of Assumption 5 were met, those wells were assigned to a “Level-2 group”, which
reduced the number of wells sampled for THMFP. A single well from each Level-2 group was then
sampled for THMFP, TOC, and UV-254 absorbance. The THMFP and TOC values were then populated
for each well within a Level-2 group. A more detailed protocol describing the Level-2 sampling is
included in Appendix C. A graphical representation of the Level-1 and Level-2 grouping process is shown
in Figure 2-2.
1 Chen, W., Westerhoff, P., Leenheer, J. A., & Booksh, K. (2003). Fluorescence Excitation−Emission Matrix
Regional Integration to Quantify Spectra for Dissolved Organic Matter. Environmental Science & Technology,
37(24), 5701-5710. doi:10.1021/es034354c

Tampa Bay Water
Evaluation of Exhibit D Water Quality
Final Report
| Data Evaluation 2-4
Figure 2-2: Graphic Representation of Well Grouping Process
Upon completion of the Level 2 sampling, water quality assumptions for each potential new Exhibit D
parameter and THMFP could be modeled throughout the entire system. Water quality assumptions for
each well were selected using the basis illustrated in Figure 2-3.
Figure 2-3: Basis for determining the modeled water quality for each source
Data Transfer
• Identify groundwater wells with historical data
Review Production Data
• Identify active vs inactive production wells
Review Water Quality & well construction
• Identified and sample Level-1 Well Groups for data gap filling and TOC Characterization
Reviewed Level-1 TOC Characterization
Data
• Identified and sampled from Level-2 Well Groups for TTHM Formation Potential
Was the well sampled for this parameter during this study?
Yes
The model assumes the average
concentration of the samples collected during this study
(Option 1)
No
Is there historical data for this well available from within the
last five years?
Yes
The model assumes the average of the last five years of historical data.
(Option 2)
No
The model assumes the Level-1 or Level-2 "group" value for this parameter.
(Option 3)

Tampa Bay Water
Evaluation of Exhibit D Water Quality
Final Report
| Data Evaluation 2-5
Table 2-1 is an example of the percentage of wells, for two water quality parameters, that fell into each
data group described in Figure 2-3.
Table 2-1: Example Breakdown Showing Percentage of Wells Using Option 1, 2, or 3 for Modeled
Water Quality
TDS Bromide
Option 1 70% 80%
Option 2 1% 11%
Option 3 29% 9%
In order to relate THMFP to more reasonable THM levels that may simulate the level of formation within
a distribution system, a different THM formation test was required, namely simulated distribution system
(SDS) testing. A subset of locations was selected for SDS testing and chlorine/chloramine decay testing.
The basis and assumptions used to identify this subset were based on the results of the Level-2 testing and
is described in Section 2.2. The protocol for this testing is contained in Appendix D. These locations were
referred to as “Level-3” locations and were selected to establish a relationship between TOC, residual
decay, and THMs, at sites likely requiring treatment to meet potential new standards. To determine how
much the impact the TOC concentration had on decay and THMs, the TOC at these sites were tested
under both undiluted and diluted conditions. Dilution with deionized water was used to simulate treatment
at various levels. Including the raw sample, three levels of dilution were tested per site leading to 15
samples tested during Level-3 testing. These data could then be used along with system-wide knowledge
to extrapolate how treatment at any source throughout the system may impact the water quality conditions
at the POCs.
TOC target levels were established by comparing the predicted benefits associated with THM formation
and residual decay to the TOC levels to determine what TOC concentration(s) would be appropriate for
further analysis within this report. This process was subjective and is described in Section 2.2.
2.2 Data Summary
2.2.1 Existing Data
Water quality data from October 2008 until October 2018 were reviewed for 180 groundwater wells,
RSWTP finished water, and Desalination WTP finished water. Of the 180 groundwater wells, 23 wells
were excluded from the system model: 15 were classified as abandoned and 8 were indefinitely offline.
This left 157 wells, which were grouped into Level-1 groups. Table 2-2 shows the number of groundwater
wells included at each sampling effort and the level of analytical effort associated with each level. A list
of well grouping designations is provided in Appendix F.
Tampa Bay Water
Evaluation of Exhibit D Water Quality
Final Report
| Data Evaluation 2-6
Table 2-2: Sampling Analysis
Number of Samples Analytical Work Level of Analytical
Effort
Historical Data 180 (157 active) N/A No analytical work
Level-1 Group Samples
106 Exhibit D parameter gaps, bromide, TOC, UV-254,
FEEM
Standard analytical work
Level-2 Group Samples
67 TOC, UV-254, THMFP Basic laboratory
study
Level-3 Locations 5 (15 when counting
dilutions) TOC, UV-254, SDS
Advanced laboratory study
2.2.2 Level-1 Grouping
Level-1 groups were selected by analyzing the past five years of historical water quality focusing on
Exhibit D parameters. Groundwater wells located in the same wellfield with similar construction age and
depth where then identified before reviewing concentration results for the Exhibit D parameters. Groups
were formed subjectively, but conservatively, based on water quality. All the groundwater wells in each
respective group, no matter how large or small the group, had similar water quality to the rest of the
group.
For example, Figure 2-4 shows the historical TOC concentrations of a potential grouping in the Cross Bar
Wellfield and also shows the historical chloride concentrations of the potential grouping. The TOC and
chloride results suggest similar water quality within these wells, which can potentially be grouped
together. However, all water quality parameters needed to be examined before grouping the wells to have
the greatest confidence with similar water quality in each group. Figure 2-5 shows the historical iron
concentrations for this potential grouping. The iron concentrations within well CB1 have been historically
higher than the other wells within that grouping. In this scenario, assuming all other parameters are
similar, CB1 was placed into its own group or potentially grouped with other wells.

Tampa Bay Water
Evaluation of Exhibit D Water Quality
Final Report
| Data Evaluation 2-7
Figure 2-4: Well Grouping Analysis Total Organic Carbon (mg/L) & Chloride (mg/L)
Figure 2-5: Well Grouping Analysis Iron (mg/L)
From the initial analysis it was determined that in order to accurately group wells for the Level-2
sampling, gaps in data would need to be filled as part of the Level-1 sampling effort. Thus, along with
fluorescence and TOC, bromide and total dissolved solids (TDS) analyses were run for each of the 106
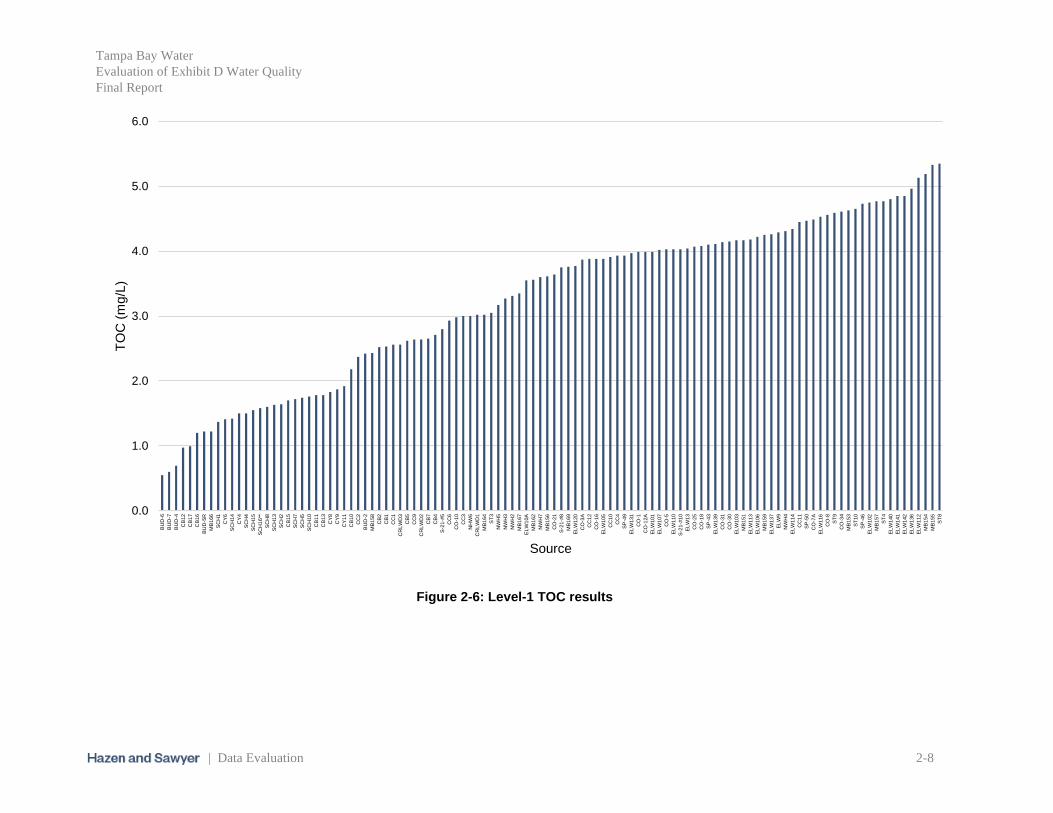
groups. The data gathered from the Level-1 sampling effort showed a relatively wide distribution of
results across FEEM, UV-254, and TOC. The TOC results are shown in Figure 2-6. Specific UV-254
absorbance (SUVA) was also calculated for each sample. Additional water quality sample results are
provided in Appendix J.
0.0
0.5
1.0
1.5
2.0
2.5
3.0
3.5
TO
C (
mg/L
)
Date
CB1 CB4 CB6
CB8 CB5 CB9
0
1
2
3
4
5
6
7
8
Chlo
ride (
mg/L
)
Date
CB1 CB4 CB5
CB6 CB8 CB9
0.00
0.20
0.40
0.60
0.80
1.00
1.20
1.40
7/15/2013 7/15/2014 7/15/2015 7/15/2016 7/15/2017
Iron (
mg/L
)
Date
CB1 CB4 CB6 CB8 CB5 CB9
Tampa Bay Water
Evaluation of Exhibit D Water Quality
Final Report
| Data Evaluation 2-8
Figure 2-6: Level-1 TOC results
0.0
1.0
2.0
3.0
4.0
5.0
6.0
BU
D-6
BU
D-7
BU
D-4
CB
12
CB
17
CB
16
BU
D-5
R
MB
166
SC
H1
CY
6
SC
H1
4
CY
4
SC
H4
SC
H1
5
SC
H1
6**
SC
H8
SC
H1
3
SC
H2
CB
15
SC
H7
SC
H5
SC
H1
0
CB
11
CB
13
CY
8
CY
9
CY
11
CB
10
CC
2
BU
D-2
MB
158
CB
2
CB
1
CC
1
CR
LW
D3
CB
5
CC
9
CR
LW
D2
CB
7
CB
4
S-2
1-#
5
CC
6
CO
-10
CC
3
NH
W6
CR
LW
D1
MB
164
ST
3
NW
H5
NW
H3
NW
H2
MB
167
EL
W1
0A
MB
162
NW
H7
MB
156
CO
-21
S-2
1-#
8
MB
169
EL
W1
20
CO
-3A
CC
12
CO
-16
EL
W1
05
CC
10
CC
4
SP
-49
EL
W1
31
CO
-1
CO
-12A
EL
W1
01
EL
W1
07
CO
-5
EL
W1
10
S-2
1-#
10
EL
W1
3
CO
-25
CO
-18
SP
-43
EL
W1
39
CO
-31
CO
-30
EL
W1
03
MB
151
EL
W1
13
EL
W1
06
MB
159
EL
W1
37
EL
W9
NW
H4
EL
W1
14
CC
11
SP
-50
CO
-7A
EL
W1
16
CO
-8
ST
9
CO
-34
MB
153
ST
10
SP
-46
EL
W1
02
MB
157
ST
4
EL
W1
40
EL
W1
41
EL
W1
42
EL
W1
36
EL
W1
12
MB
154
MB
155
ST
8
TO
C (
mg/L
)
Source

Tampa Bay Water
Evaluation of Exhibit D Water Quality
Final Report
| Data Evaluation 2-9
2.2.3 Level-2 Grouping
By combining select Level-1 groups together, 67 Level-2 groups were formed. An example comparison
of two Level-1 results are shown in Table 2-3 and Figure 2-7.
Table 2-3: Level-2 Grouping Comparison for ELW103 and ELW116 Level-1 results
Sample TOC
(mg/L)
Region I
Fluorescence
(au)
Region II
Fluorescence
(au)
Region III
Fluorescence
(au)
Bromide
(mg/L)
SUVA
(L/mg-m)
ELW103 4.2 2431 12908 15674 0.043 2.46
ELW116 4.5 2347 16168 19750 0.103 3.26
A: B:
Figure 2-7: Comparison on FEEM for (A) ELW103 and (B) ELW116
In this example, significant differences in fluorescence, bromide, and SUVA are apparent as shown in
Table 2-3. Comparison of the FEEMs show a distinctive peak in Region I for ELW103, which is not
present in ELW116. This difference is reflected in a higher overall Region I fluorescence shown in Table
2-3. Conversely, Region II and III fluorescence was higher in ELW116 along with higher overall
aromaticity as measured by SUVA. As a result, these Level-1 samples were not merged into a single
Level-2 group.
After regrouping, at least one well from each of the 67 Level-2 groups was then sampled for THMFP,
TOC, and UV-254 absorbance. The results of this testing showed a strong linear correlation between TOC
and THMFP as shown in Figure 2-8.

Tampa Bay Water
Evaluation of Exhibit D Water Quality
Final Report
| Data Evaluation 2-10
Figure 2-8: Level-2 Results Showing Strong Linear Correlation Between TOC and THMFP
This correlation also appeared to adequately describe the single sampled collected from the RSWTP as
identified in Figure 2-8. However, the correlation of the data appeared stronger for samples with TOC less
than 2.0 mg/L. This variation was further assessed by calculating the specific THMFP, which is the
THMFP divided by the paired TOC. The specific THMFP results are shown in Figure 2-9, which shows
that the RSWTP had the highest specific THMFP.
Figure 2-9: Level-2 Specific THMFP (ppb THMFP per mg/L TOC)
RSWTP
y = 66.39x - 7.03R² = 0.95
0
100
200
300
400
0.0 1.0 2.0 3.0 4.0 5.0 6.0
TH
MF
P (
ppb)
TOC (ppm)
0
10
20
30
40
50
60
70
80
90
BU
D-6
BU
D-7
CB
12
MB
15
1
CB
1
CB
17
MB
15
8
SC
H7
CC
6
CB
16
CC
11
CB
7
CB
11
CC
10
SC
H5
ST
9
CC
2
S-2
1-#
5
CB
15
EL
W1
35
SC
H14
NW
H5
CY
6
EL
W1
13
ST
10
EL
W1
31
NW
H3
EL
W1
34
CY
8
EL
W1
16
NW
H2
EL
W1
36
MB
15
6
ST
6
CO
-31
NW
H1
SP
-50
CO
-25
EL
W1
3
MB
15
7
EL
W1
21
CO
-5
EL
W1
42
SP
-49
CY
4
CO
-16
NW
H6
BU
D-2
CC
1
CR
LW
D2
CO
-8
SC
H13
S-2
1-#
8
EL
W1
07
EL
W1
0A
EL
W9
BU
D-5
R
RS
WT
PSpecific
TH
MF
P (
ppb T
HM
FP
per
mg/L
TO
C)
Source

Tampa Bay Water
Evaluation of Exhibit D Water Quality
Final Report
| Data Evaluation 2-11
Figure 2-10: Level-2 Specific UV-254 Absorbance (L/mg-m)
Two conclusions can be drawn from the specific THMFP and SUVA results:
• There is variability in the THMFP which is independent of TOC: This is explained in the
range of specific THMFP potential, which goes from approximately 30 to 80 ppb THMFP per
mg/L TOC. The regional surface water treatment plant has the highest specific THMFP, which is
expected since the surface water TOC typically has a significantly different nature compared to
the groundwater sources.
• A 1 mg/L goal for TOC at each POC would likely be excessively conservative: The specific
THMFP suggests that for 1 mg/L of TOC, only the most reactive samples would likely exceed the
maximum contaminant limit (MCL) of 80 ppb under exaggerated conditions with excess free
chlorine and reaction time.
The results shown in Figure 2-8 and Figure 2-9 suggested that a further simplifying assumption could be
made:
6. There is a sufficiently linear correlation between THMFP and TOC to assume that TTHM levels
can be predicted from TOC alone, ignoring variations explained by TOC nature and bromide for
the initial planning level cost estimation.
It is important to emphasize that simplifying “Assumption 6” is justified for purposes of this study and
developing a planning level cost estimate, but it is not recommended that this assumption be carried
forward into future detailed iterations of cost estimation, design, or simulation of the regional system.
Variations in TOC characteristics by source do exist and were observed through SUVA and FEEM
analysis. Therefore, a refined model that captures these variations would help further refine the estimated
treatment requirements and costs.
0.0
1.0
2.0
3.0
4.0
5.0
6.0
7.0
8.0
BU
D-6
BU
D-4
CB
17
BU
D-5
R
SC
H1
SC
H14
SC
H4
SC
H13
CB
15
SC
H5
CB
11
CY
8
CY
11
CC
2
MB
15
8
CB
1
CR
LW
D3
CC
9
CB
7
S-2
1-#
5
CO
-10
NH
W6
MB
16
4
NW
H5
NW
H2
EL
W1
0A
NW
H7
CO
-21
MB
16
9
CO
-3A
CO
-16
CC
10
SP
-49
CO
-1
EL
W1
01
CO
-5
S-2
1-#
10
CO
-25
SP
-43
CO
-31
EL
W1
03
EL
W1
13
MB
15
9
EL
W9
EL
W1
14
SP
-50
EL
W1
16
ST
9
MB
15
3
SP
-46
MB
15
7
EL
W1
40
EL
W1
42
EL
W1
12
MB
15
5
RS
WT
P
SU
VA
(L/m
g-m
)
Source
Tampa Bay Water
Evaluation of Exhibit D Water Quality
Final Report
| Data Evaluation 2-12
2.2.4 Level-3 Test Locations
Five locations were selected for Level-3 testing. These locations represented “sources” as depicted in
Figure 1-2 and included Eldridge Wilde Wellfield (ELW), Morris Bridge Wellfield (MB), South Pasco
Wellfield (SP), Starkey Wellfield (MAY), and Cosme-Odessa Wellfield (CO). These sites were selected
based on a preliminary indication that treatment would be necessary at these locations to meet the
proposed water quality goals. This preliminary indication was the result of using the system model
(described further in Section 3) assuming a goal of 1 mg/L TOC at each POC. The selected sources had
significant influence on POC water quality and had TOC levels that exceeded 1 mg/L. To simulate
treatment, samples from these sites were diluted with deionized water and tested following the SDS
protocol described in Appendix D. By running SDS tests on diluted samples, data could be generated
representing a wide range of TOC which facilitated assessment of potential benefits of operating the
Tampa Bay Water system at lower TOC concentrations.
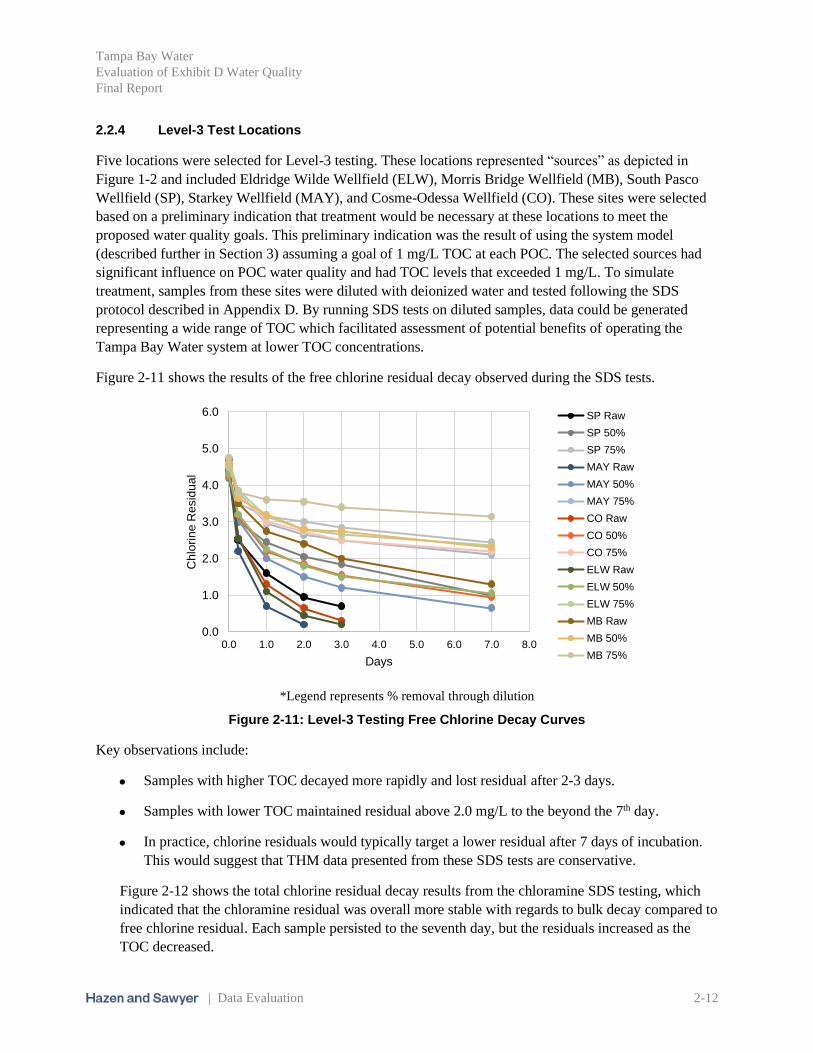
Figure 2-11 shows the results of the free chlorine residual decay observed during the SDS tests.
*Legend represents % removal through dilution
Figure 2-11: Level-3 Testing Free Chlorine Decay Curves
Key observations include:
• Samples with higher TOC decayed more rapidly and lost residual after 2-3 days.
• Samples with lower TOC maintained residual above 2.0 mg/L to the beyond the 7th day.
• In practice, chlorine residuals would typically target a lower residual after 7 days of incubation.
This would suggest that THM data presented from these SDS tests are conservative.
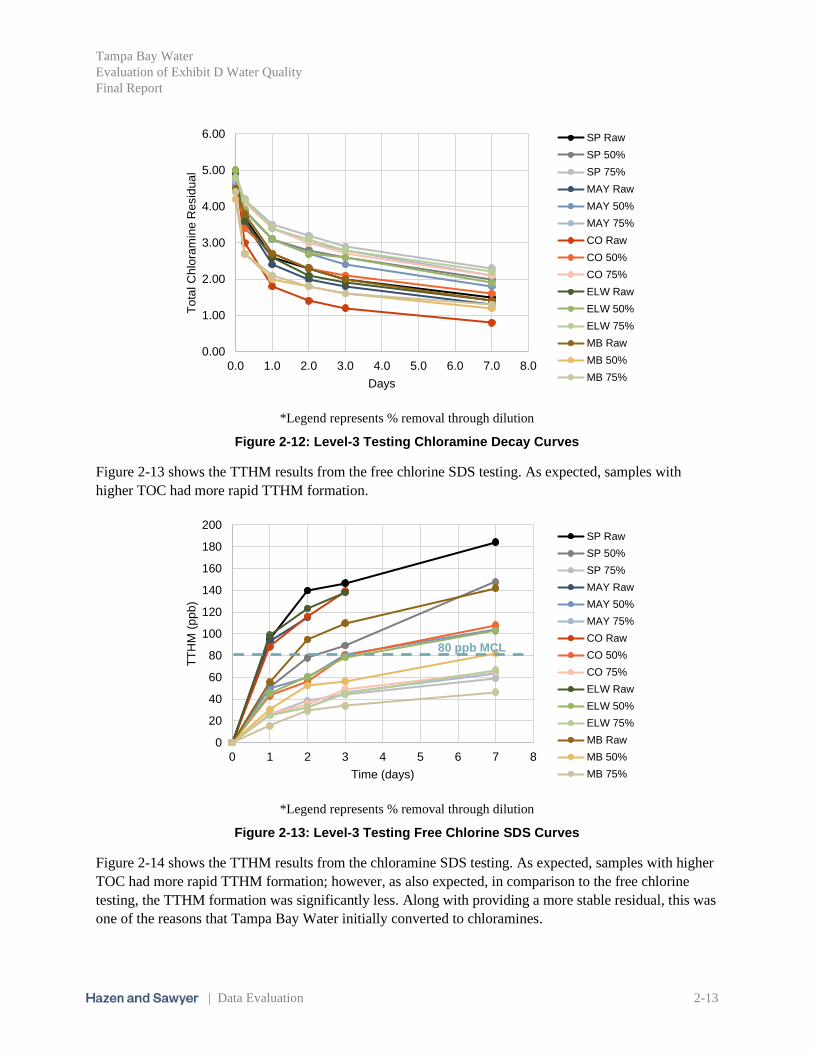
Figure 2-12 shows the total chlorine residual decay results from the chloramine SDS testing, which
indicated that the chloramine residual was overall more stable with regards to bulk decay compared to
free chlorine residual. Each sample persisted to the seventh day, but the residuals increased as the
TOC decreased.
0.0
1.0
2.0
3.0
4.0
5.0
6.0
0.0 1.0 2.0 3.0 4.0 5.0 6.0 7.0 8.0
Chlo
rin
e R
esid
ua
l
Days
SP Raw
SP 50%
SP 75%
MAY Raw
MAY 50%
MAY 75%
CO Raw
CO 50%
CO 75%
ELW Raw
ELW 50%
ELW 75%
MB Raw
MB 50%
MB 75%
Tampa Bay Water
Evaluation of Exhibit D Water Quality
Final Report
| Data Evaluation 2-13
*Legend represents % removal through dilution
Figure 2-12: Level-3 Testing Chloramine Decay Curves
Figure 2-13 shows the TTHM results from the free chlorine SDS testing. As expected, samples with
higher TOC had more rapid TTHM formation.
*Legend represents % removal through dilution
Figure 2-13: Level-3 Testing Free Chlorine SDS Curves
Figure 2-14 shows the TTHM results from the chloramine SDS testing. As expected, samples with higher
TOC had more rapid TTHM formation; however, as also expected, in comparison to the free chlorine
testing, the TTHM formation was significantly less. Along with providing a more stable residual, this was
one of the reasons that Tampa Bay Water initially converted to chloramines.
0.00
1.00
2.00
3.00
4.00
5.00
6.00
0.0 1.0 2.0 3.0 4.0 5.0 6.0 7.0 8.0
To
tal C
hlo
ram
ine
Re
sid
ua
l
Days
SP Raw
SP 50%
SP 75%
MAY Raw
MAY 50%
MAY 75%
CO Raw
CO 50%
CO 75%
ELW Raw
ELW 50%
ELW 75%
MB Raw
MB 50%
MB 75%
0
20
40
60
80
100
120
140
160
180
200
0 1 2 3 4 5 6 7 8
TT
HM
(p
pb
)
Time (days)
SP Raw
SP 50%
SP 75%
MAY Raw
MAY 50%
MAY 75%
CO Raw
CO 50%
CO 75%
ELW Raw
ELW 50%
ELW 75%
MB Raw
MB 50%
MB 75%
80 ppb MCL

Tampa Bay Water
Evaluation of Exhibit D Water Quality
Final Report
| Data Evaluation 2-14
*Legend represents % removal through dilution
Figure 2-14: Level-3 Testing Chloramine SDS Curves
2.3 Data Analysis
To determine the TOC target based on a free chlorine residual, a relationship between TOC and SDS
TTHM values was established. This was accomplished by correlating the SDS TTHM values for a given
incubation time back to the initial sample TOC. This analysis resulted in three strong linear correlations
shown in Figure 2-15. These linear regressions appeared to follow a trend such that a 5-day SDS
regression could be estimated and leveraged when estimating TOC targets.
0
20
40
60
80
100
120
140
160
180
200
0 2 4 6 8
TT
HM
(p
pb
)
Time (Days)
SP Raw
SP 50%
SP 75%
MAY Raw
MAY 50%
MAY 75%
CO Raw
CO 50%
CO 75%
ELW Raw
ELW 50%
ELW 75%
MB Raw
MB 50%
MB 75%
80 ppb MCL

Tampa Bay Water
Evaluation of Exhibit D Water Quality
Final Report
| Data Evaluation 2-15
Figure 2-15: Relationship between Level-3 TOC, Incubation Time, and SDS TTHM based on free
chlorine residual
From Figure 2-15, four TOC targets were identified based on the following criteria shown in Table 2-4.
Table 2-4: Identified Annual Average TOC Targets
TOC Target (mg/L)
Basis for Target(1)
Approx.
TTHM Concentration
Approx. Residence Time in
Distribution System
2.00 < 80 ppb < 3 days
1.50 < 80 ppb 3 to 5 days
1.25 < 80 ppb 5 to 7 days
1.00(3) < 80 ppb > 7 days
1. Predicted TTHM concentration for a given incubation time based on analyzed SDS data using free
chlorine residual.
2. TTHM or Total Trihalomethanes is a class of disinfection byproducts (DBPs)
3. Member government requested max average proposed goal.
The timeline for these targets was based on capturing a range of estimated average residence times within
the member government’s distribution system and the assumption that the maximum time to each POC
from Tampa Bay Water’s source is less than 1.5 days. These targets are based on maintaining the
7-day SDSy = 44.985x + 23.601
R² = 0.89
3-day SDSy = 35.463x + 12.913
R² = 0.98
2-day SDSy = 31.444x + 6.0415
R² = 0.95
0
20
40
60
80
100
120
140
160
180
200
220
0.0 0.5 1.0 1.5 2.0 2.5 3.0 3.5 4.0 4.5 5.0 5.5 6.0
TT
HM
(ppb)
TOC (ppm)
5-day SDS (estimate)
Target TOC level located at the intersection of the 80 ppb
MCL and the various SDS regressions
80 ppb MCL
Tampa Bay Water
Evaluation of Exhibit D Water Quality
Final Report
| Data Evaluation 2-16
maximum annual average of TOC at each POC no greater than these levels. The actual residence time
within the member government systems and impact on DBP formation will need to be confirmed in future
studies.
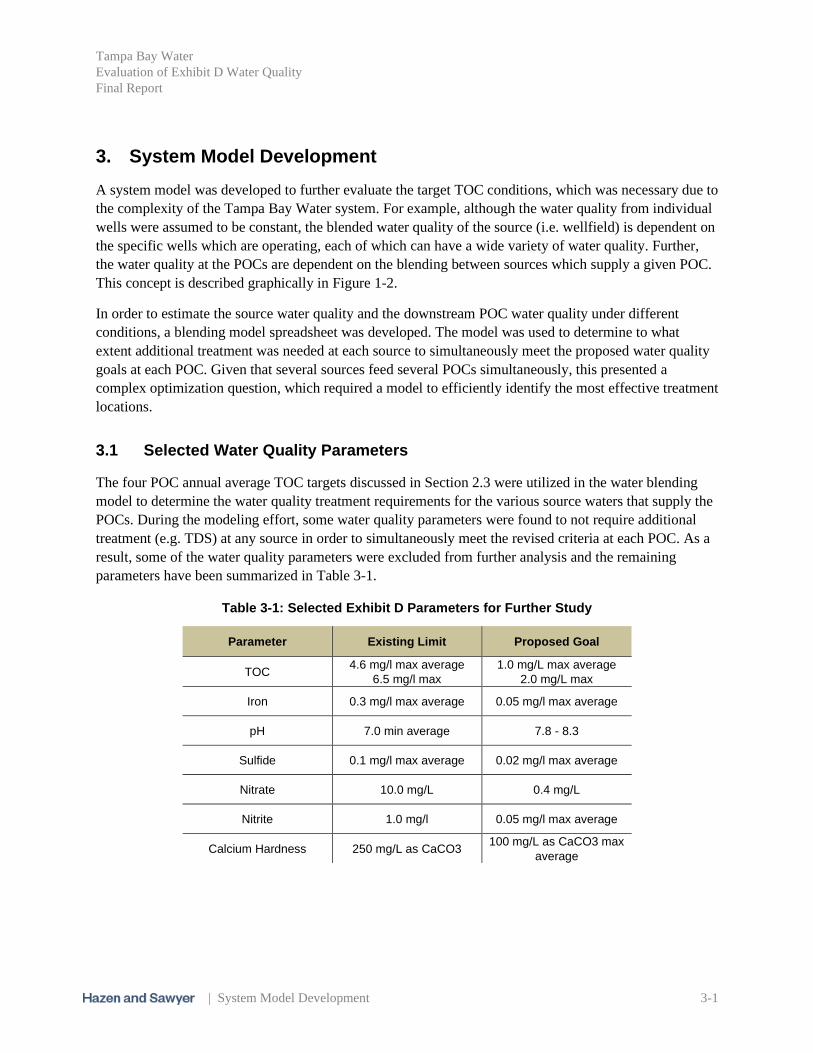
Tampa Bay Water
Evaluation of Exhibit D Water Quality
Final Report
| System Model Development 3-1
3. System Model Development
A system model was developed to further evaluate the target TOC conditions, which was necessary due to
the complexity of the Tampa Bay Water system. For example, although the water quality from individual
wells were assumed to be constant, the blended water quality of the source (i.e. wellfield) is dependent on
the specific wells which are operating, each of which can have a wide variety of water quality. Further,
the water quality at the POCs are dependent on the blending between sources which supply a given POC.
This concept is described graphically in Figure 1-2.
In order to estimate the source water quality and the downstream POC water quality under different
conditions, a blending model spreadsheet was developed. The model was used to determine to what
extent additional treatment was needed at each source to simultaneously meet the proposed water quality
goals at each POC. Given that several sources feed several POCs simultaneously, this presented a
complex optimization question, which required a model to efficiently identify the most effective treatment
locations.
3.1 Selected Water Quality Parameters
The four POC annual average TOC targets discussed in Section 2.3 were utilized in the water blending
model to determine the water quality treatment requirements for the various source waters that supply the
POCs. During the modeling effort, some water quality parameters were found to not require additional
treatment (e.g. TDS) at any source in order to simultaneously meet the revised criteria at each POC. As a
result, some of the water quality parameters were excluded from further analysis and the remaining
parameters have been summarized in Table 3-1.
Table 3-1: Selected Exhibit D Parameters for Further Study
Parameter Existing Limit Proposed Goal
TOC 4.6 mg/l max average
6.5 mg/l max
1.0 mg/L max average
2.0 mg/L max
Iron 0.3 mg/l max average 0.05 mg/l max average
pH 7.0 min average 7.8 - 8.3
Sulfide 0.1 mg/l max average 0.02 mg/l max average
Nitrate 10.0 mg/L 0.4 mg/L
Nitrite 1.0 mg/l 0.05 mg/l max average
Calcium Hardness 250 mg/L as CaCO3 100 mg/L as CaCO3 max
average

Tampa Bay Water
Evaluation of Exhibit D Water Quality
Final Report
| System Model Development 3-2
3.2 Source Water Quality Variability
The historical water quality data compiled per the approach described in Section 2, provided
representative water quality values for 22 parameters at each of Tampa Bay Water’s 157 active supply
wells, the Desalination Facility, and Surface Water Treatment Plant. These assumed concentrations are
provided in Appendix G. Water quality from each of the wellfields vary depending on which wells are in
operation, and how much total flow is being supplied. When depicting average conditions, the source
water quality assumed by the model was equivalent to the average water quality of all wells within a
wellfield considering the flow contribution from each well. When depicting the “maximum”
concentrations, the model assumed water quality equivalent to the well providing the “worst” water
quality for a given parameter. The model also takes into account changes in water quality due to existing
treatment (e.g. chloramination, hydrogen sulfide removal, and pH adjustment). Graphs of water quality
variation are included in Appendix E.
3.3 POC Water Quality Variability
Water quality variability at the source can translate into water quality variability at the Points of
Connection (POCs). Some POCs are supplied from a combination of regional sources, and others are
supplied by a dedicated source. This study evaluated the additional treatment that would be needed to
meet the proposed water quality goals at all POCs.
The spreadsheet simulation model was used to determine what treatment would be needed at each source
to achieve the proposed water quality at the POCs. The tool also calculates the variability in
concentrations that could occur at each POC based on the best and worst case blends from the regional
system RPOEs. This variability is calculated as a flow weighted average of sources from the RPOEs as
the supply travels through the system, combining additional RPOEs and delivering supply to POCs.
Table 3-2 lists the flow assumptions that were used for this evaluation, and the estimated percentage of
each source that reaches each POC based on historical data. These flows can vary, depending on what
supply sources are prioritized by Tampa Bay Water’s Optimized Rotational Operation Program, and
seasonal fluctuations in demands. It is important to note that the flow assumptions used in this model
were not based on design maximum or sustainable maximum flows from each source, but rather from
typical historical average usage. As demands in the system increase, the actual blend of sources utilized
will likely change and potential impacts on the model will need to be re-assessed based on the water
quality of the increased sources. Using the source water quality and blending described in Table 3-2,
maximum, minimum and average concentration could be estimated for each POC.
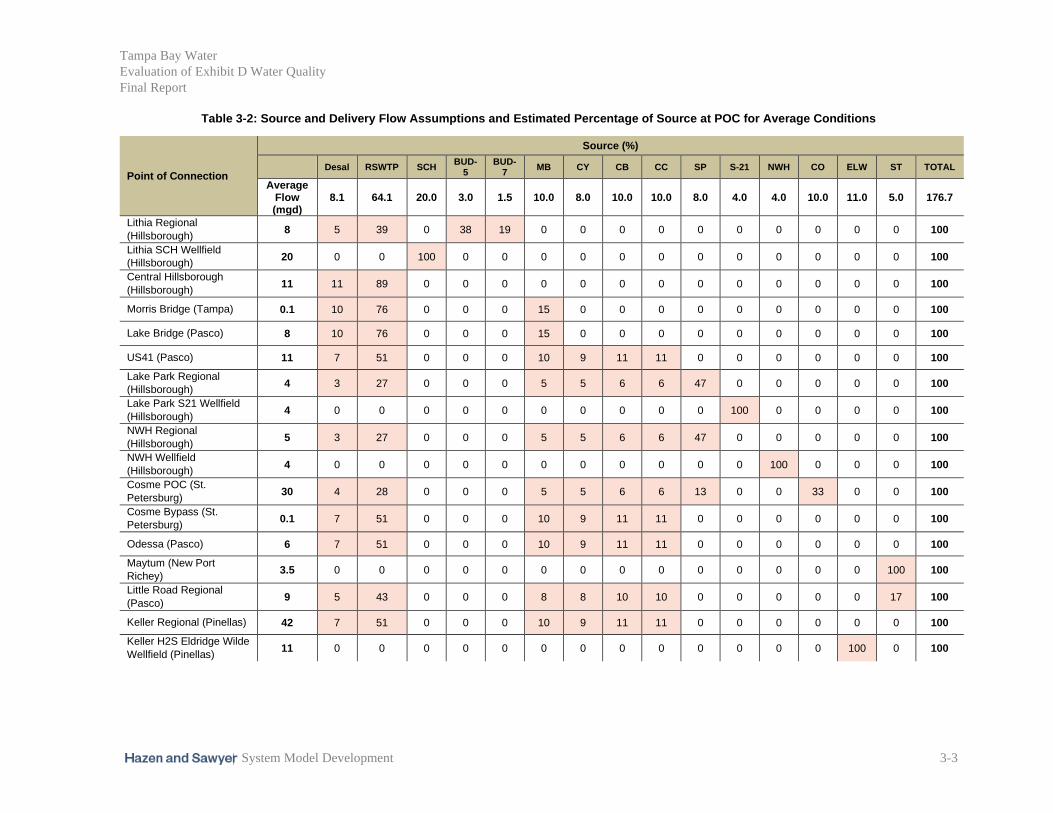
Tampa Bay Water
Evaluation of Exhibit D Water Quality
Final Report
| System Model Development 3-3
Table 3-2: Source and Delivery Flow Assumptions and Estimated Percentage of Source at POC for Average Conditions
Point of Connection
Source (%)
Desal RSWTP SCH BUD-
5 BUD-
7 MB CY CB CC SP S-21 NWH CO ELW ST TOTAL
Average Flow (mgd)
8.1 64.1 20.0 3.0 1.5 10.0 8.0 10.0 10.0 8.0 4.0 4.0 10.0 11.0 5.0 176.7
Lithia Regional
(Hillsborough) 8 5 39 0 38 19 0 0 0 0 0 0 0 0 0 0 100
Lithia SCH Wellfield
(Hillsborough) 20 0 0 100 0 0 0 0 0 0 0 0 0 0 0 0 100
Central Hillsborough
(Hillsborough) 11 11 89 0 0 0 0 0 0 0 0 0 0 0 0 0 100
Morris Bridge (Tampa) 0.1 10 76 0 0 0 15 0 0 0 0 0 0 0 0 0 100
Lake Bridge (Pasco) 8 10 76 0 0 0 15 0 0 0 0 0 0 0 0 0 100
US41 (Pasco) 11 7 51 0 0 0 10 9 11 11 0 0 0 0 0 0 100
Lake Park Regional
(Hillsborough) 4 3 27 0 0 0 5 5 6 6 47 0 0 0 0 0 100
Lake Park S21 Wellfield
(Hillsborough) 4 0 0 0 0 0 0 0 0 0 0 100 0 0 0 0 100
NWH Regional
(Hillsborough) 5 3 27 0 0 0 5 5 6 6 47 0 0 0 0 0 100
NWH Wellfield
(Hillsborough) 4 0 0 0 0 0 0 0 0 0 0 0 100 0 0 0 100
Cosme POC (St.
Petersburg) 30 4 28 0 0 0 5 5 6 6 13 0 0 33 0 0 100
Cosme Bypass (St.
Petersburg) 0.1 7 51 0 0 0 10 9 11 11 0 0 0 0 0 0 100
Odessa (Pasco) 6 7 51 0 0 0 10 9 11 11 0 0 0 0 0 0 100
Maytum (New Port
Richey) 3.5 0 0 0 0 0 0 0 0 0 0 0 0 0 0 100 100
Little Road Regional
(Pasco) 9 5 43 0 0 0 8 8 10 10 0 0 0 0 0 17 100
Keller Regional (Pinellas) 42 7 51 0 0 0 10 9 11 11 0 0 0 0 0 0 100
Keller H2S Eldridge Wilde
Wellfield (Pinellas) 11 0 0 0 0 0 0 0 0 0 0 0 0 0 100 0 100

Tampa Bay Water
Evaluation of Exhibit D Water Quality
Final Report
| System Model Development 3-4
To simulate the application of a new treatment technology at a given source, the treatment percent
removal (or percent increase for pH) at each source was adjusted within the model and the resulting
changes in delivery water quality for that parameter was predicted at each of the POCs. To predict how
much of a parameter needs to be removed from the source, these treatment percentages were adjusted to
achieve the potential new target water quality goal at each POC. Where practical, no treatment was also
applied at certain sources to take advantage of blending with other lower concentration sources before
reaching a delivery POC. Other sources where treatment would be required, the treatment percentage
could be increased to reduce the total number of sources that require treatment. POCs with dedicated
sources required treatment to meet the water quality goals since blending is not available. Note, existing
treatment (e.g. chloramination, hydrogen sulfide removal, and pH adjustment) were applied at the source
within the model to account for existing treatment that already addressed some of the water quality goals.
The overall intent of the modeling effort was to optimize placement of treatment technologies in the
system to achieve the desired water quality goals at all POCs in a cost-effective manner, as well as to
understand where the highest return on investment relative to cost versus water quality improvement
exists. The tool can also be used for assessing the prioritization and phasing of water quality improvement
projects.
The model also includes the ability to simulate the application of treatment technologies at individual
wells or to remove wells from service in the future. Table 3-3 lists the wells that are still currently
operating but were removed from service for future scenarios based on future wellfield right-sizing
efforts.
Table 3-3: Wells Removed in Future Scenarios
Wellfield Wells
Morris Bridge 152, 157, 161, 162, 163
Starkey Wellfield 9
Eldridge Wilde Wellfield 13, 114, 134, 139
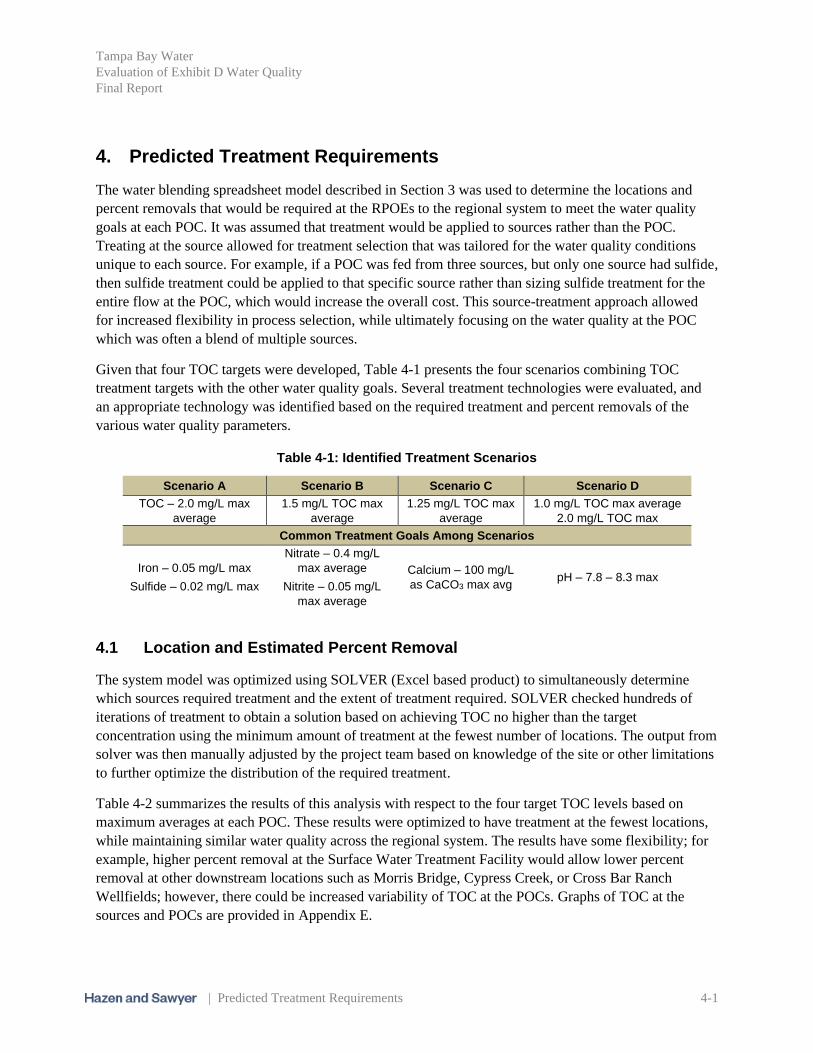
Tampa Bay Water
Evaluation of Exhibit D Water Quality
Final Report
| Predicted Treatment Requirements 4-1
4. Predicted Treatment Requirements
The water blending spreadsheet model described in Section 3 was used to determine the locations and
percent removals that would be required at the RPOEs to the regional system to meet the water quality
goals at each POC. It was assumed that treatment would be applied to sources rather than the POC.
Treating at the source allowed for treatment selection that was tailored for the water quality conditions
unique to each source. For example, if a POC was fed from three sources, but only one source had sulfide,
then sulfide treatment could be applied to that specific source rather than sizing sulfide treatment for the
entire flow at the POC, which would increase the overall cost. This source-treatment approach allowed
for increased flexibility in process selection, while ultimately focusing on the water quality at the POC
which was often a blend of multiple sources.
Given that four TOC targets were developed, Table 4-1 presents the four scenarios combining TOC
treatment targets with the other water quality goals. Several treatment technologies were evaluated, and
an appropriate technology was identified based on the required treatment and percent removals of the
various water quality parameters.
Table 4-1: Identified Treatment Scenarios
Scenario A Scenario B Scenario C Scenario D
TOC – 2.0 mg/L max
average
1.5 mg/L TOC max
average
1.25 mg/L TOC max
average
1.0 mg/L TOC max average
2.0 mg/L TOC max
Common Treatment Goals Among Scenarios
Iron – 0.05 mg/L max
Sulfide – 0.02 mg/L max
Nitrate – 0.4 mg/L
max average
Nitrite – 0.05 mg/L
max average
Calcium – 100 mg/L
as CaCO3 max avg pH – 7.8 – 8.3 max
4.1 Location and Estimated Percent Removal
The system model was optimized using SOLVER (Excel based product) to simultaneously determine
which sources required treatment and the extent of treatment required. SOLVER checked hundreds of
iterations of treatment to obtain a solution based on achieving TOC no higher than the target
concentration using the minimum amount of treatment at the fewest number of locations. The output from
solver was then manually adjusted by the project team based on knowledge of the site or other limitations
to further optimize the distribution of the required treatment.
Table 4-2 summarizes the results of this analysis with respect to the four target TOC levels based on
maximum averages at each POC. These results were optimized to have treatment at the fewest locations,
while maintaining similar water quality across the regional system. The results have some flexibility; for
example, higher percent removal at the Surface Water Treatment Facility would allow lower percent
removal at other downstream locations such as Morris Bridge, Cypress Creek, or Cross Bar Ranch
Wellfields; however, there could be increased variability of TOC at the POCs. Graphs of TOC at the
sources and POCs are provided in Appendix E.
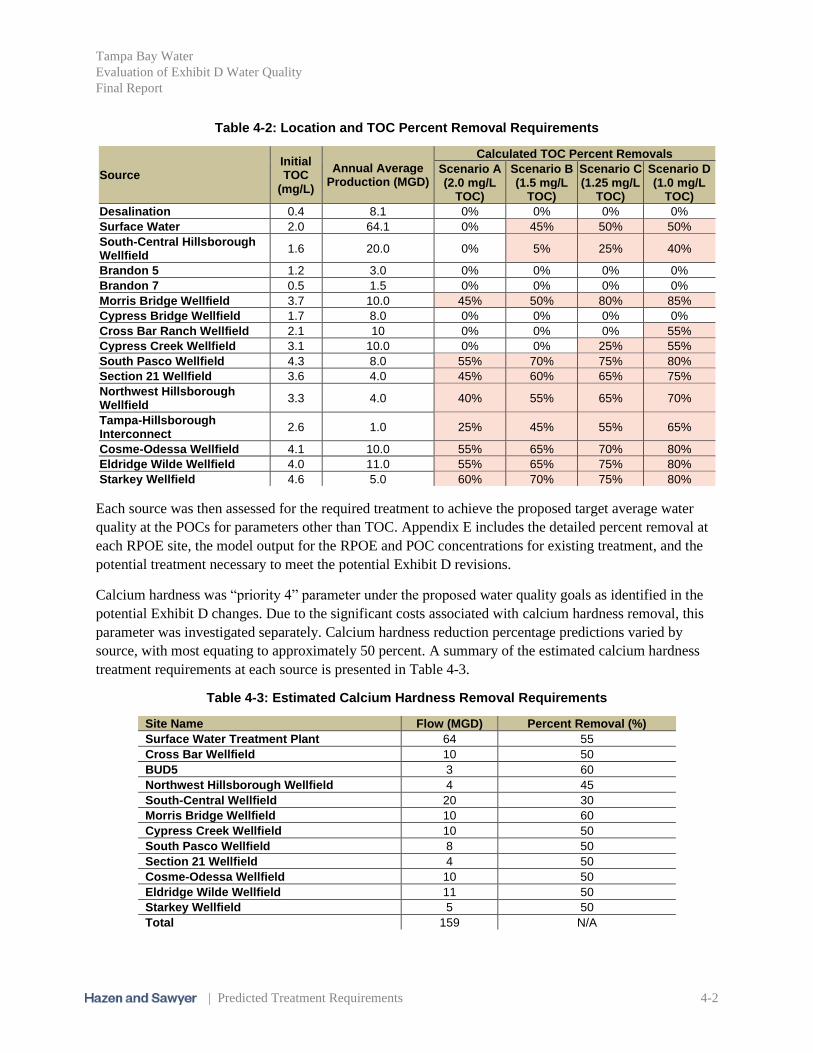
Tampa Bay Water
Evaluation of Exhibit D Water Quality
Final Report
| Predicted Treatment Requirements 4-2
Table 4-2: Location and TOC Percent Removal Requirements
Source Initial TOC
(mg/L)
Annual Average Production (MGD)
Calculated TOC Percent Removals
Scenario A (2.0 mg/L
TOC)
Scenario B (1.5 mg/L
TOC)
Scenario C (1.25 mg/L
TOC)
Scenario D (1.0 mg/L
TOC)
Desalination 0.4 8.1 0% 0% 0% 0%
Surface Water 2.0 64.1 0% 45% 50% 50%
South-Central Hillsborough Wellfield
1.6 20.0 0% 5% 25% 40%
Brandon 5 1.2 3.0 0% 0% 0% 0%
Brandon 7 0.5 1.5 0% 0% 0% 0%
Morris Bridge Wellfield 3.7 10.0 45% 50% 80% 85%
Cypress Bridge Wellfield 1.7 8.0 0% 0% 0% 0%
Cross Bar Ranch Wellfield 2.1 10 0% 0% 0% 55%
Cypress Creek Wellfield 3.1 10.0 0% 0% 25% 55%
South Pasco Wellfield 4.3 8.0 55% 70% 75% 80%
Section 21 Wellfield 3.6 4.0 45% 60% 65% 75%
Northwest Hillsborough Wellfield
3.3 4.0 40% 55% 65% 70%
Tampa-Hillsborough Interconnect
2.6 1.0 25% 45% 55% 65%
Cosme-Odessa Wellfield 4.1 10.0 55% 65% 70% 80%
Eldridge Wilde Wellfield 4.0 11.0 55% 65% 75% 80%
Starkey Wellfield 4.6 5.0 60% 70% 75% 80%
Each source was then assessed for the required treatment to achieve the proposed target average water
quality at the POCs for parameters other than TOC. Appendix E includes the detailed percent removal at
each RPOE site, the model output for the RPOE and POC concentrations for existing treatment, and the
potential treatment necessary to meet the potential Exhibit D revisions.
Calcium hardness was “priority 4” parameter under the proposed water quality goals as identified in the
potential Exhibit D changes. Due to the significant costs associated with calcium hardness removal, this
parameter was investigated separately. Calcium hardness reduction percentage predictions varied by
source, with most equating to approximately 50 percent. A summary of the estimated calcium hardness
treatment requirements at each source is presented in Table 4-3.
Table 4-3: Estimated Calcium Hardness Removal Requirements
Site Name Flow (MGD) Percent Removal (%)
Surface Water Treatment Plant 64 55
Cross Bar Wellfield 10 50
BUD5 3 60
Northwest Hillsborough Wellfield 4 45
South-Central Wellfield 20 30
Morris Bridge Wellfield 10 60
Cypress Creek Wellfield 10 50
South Pasco Wellfield 8 50
Section 21 Wellfield 4 50
Cosme-Odessa Wellfield 10 50
Eldridge Wilde Wellfield 11 50
Starkey Wellfield 5 50
Total 159 N/A
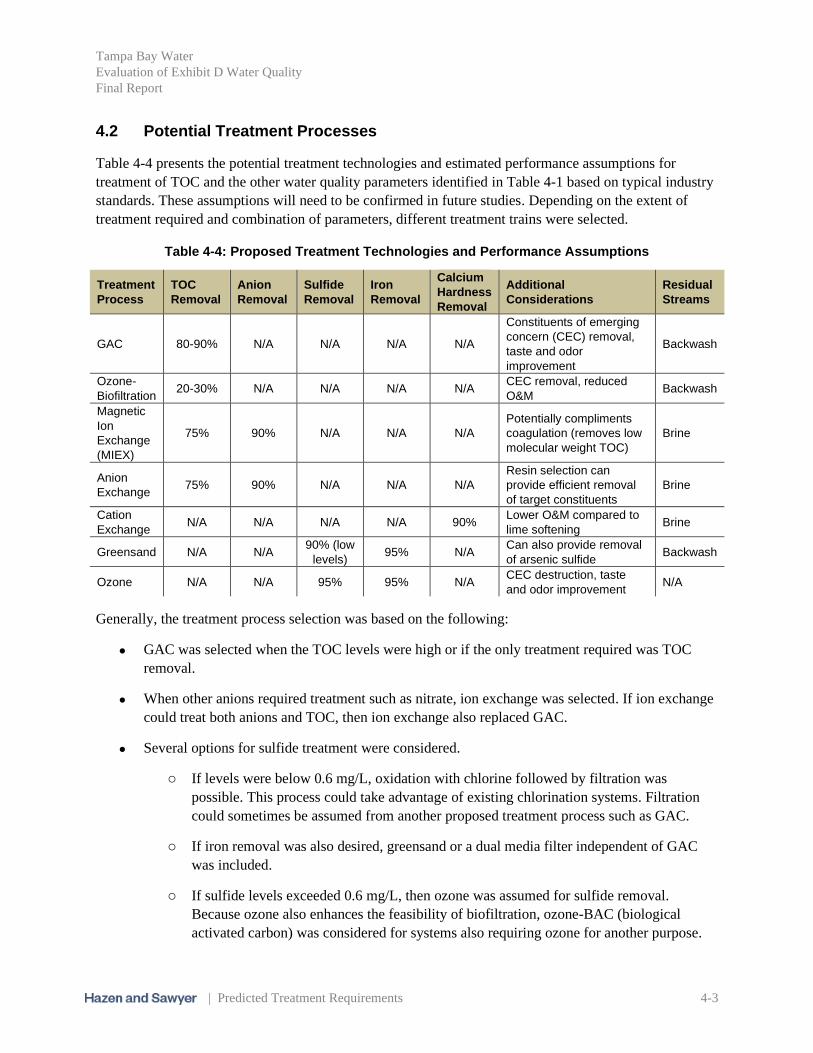
Tampa Bay Water
Evaluation of Exhibit D Water Quality
Final Report
| Predicted Treatment Requirements 4-3
4.2 Potential Treatment Processes
Table 4-4 presents the potential treatment technologies and estimated performance assumptions for
treatment of TOC and the other water quality parameters identified in Table 4-1 based on typical industry
standards. These assumptions will need to be confirmed in future studies. Depending on the extent of
treatment required and combination of parameters, different treatment trains were selected.
Table 4-4: Proposed Treatment Technologies and Performance Assumptions
Treatment
Process
TOC
Removal
Anion
Removal
Sulfide
Removal
Iron
Removal
Calcium
Hardness
Removal
Additional
Considerations
Residual
Streams
GAC 80-90% N/A N/A N/A N/A
Constituents of emerging
concern (CEC) removal,
taste and odor
improvement
Backwash
Ozone-
Biofiltration 20-30% N/A N/A N/A N/A
CEC removal, reduced
O&M Backwash
Magnetic
Ion
Exchange
(MIEX)
75% 90% N/A N/A N/A
Potentially compliments
coagulation (removes low
molecular weight TOC)
Brine
Anion
Exchange 75% 90% N/A N/A N/A
Resin selection can
provide efficient removal
of target constituents
Brine
Cation
Exchange N/A N/A N/A N/A 90%
Lower O&M compared to
lime softening Brine
Greensand N/A N/A 90% (low
levels) 95% N/A
Can also provide removal
of arsenic sulfide Backwash
Ozone N/A N/A 95% 95% N/A CEC destruction, taste
and odor improvement N/A
Generally, the treatment process selection was based on the following:
• GAC was selected when the TOC levels were high or if the only treatment required was TOC
removal.
• When other anions required treatment such as nitrate, ion exchange was selected. If ion exchange
could treat both anions and TOC, then ion exchange also replaced GAC.
• Several options for sulfide treatment were considered.
o If levels were below 0.6 mg/L, oxidation with chlorine followed by filtration was
possible. This process could take advantage of existing chlorination systems. Filtration
could sometimes be assumed from another proposed treatment process such as GAC.
o If iron removal was also desired, greensand or a dual media filter independent of GAC
was included.
o If sulfide levels exceeded 0.6 mg/L, then ozone was assumed for sulfide removal.
Because ozone also enhances the feasibility of biofiltration, ozone-BAC (biological
activated carbon) was considered for systems also requiring ozone for another purpose.
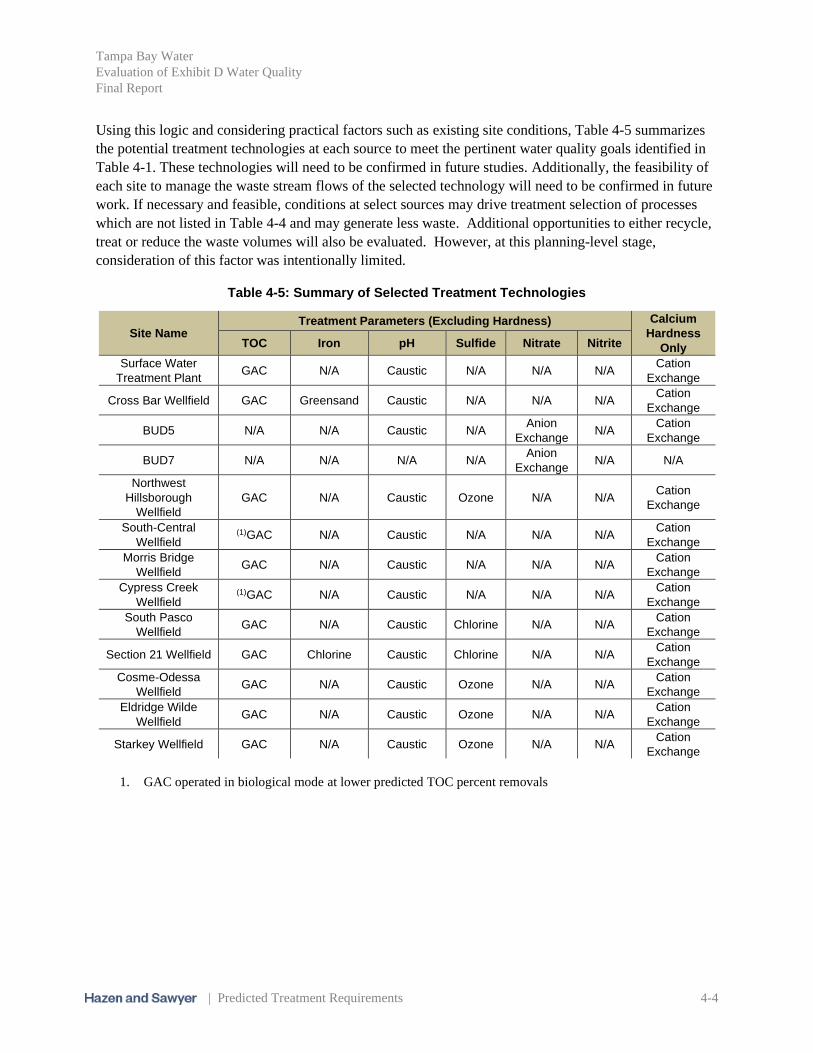
Tampa Bay Water
Evaluation of Exhibit D Water Quality
Final Report
| Predicted Treatment Requirements 4-4
Using this logic and considering practical factors such as existing site conditions, Table 4-5 summarizes
the potential treatment technologies at each source to meet the pertinent water quality goals identified in
Table 4-1. These technologies will need to be confirmed in future studies. Additionally, the feasibility of
each site to manage the waste stream flows of the selected technology will need to be confirmed in future
work. If necessary and feasible, conditions at select sources may drive treatment selection of processes
which are not listed in Table 4-4 and may generate less waste. Additional opportunities to either recycle,
treat or reduce the waste volumes will also be evaluated. However, at this planning-level stage,
consideration of this factor was intentionally limited.
Table 4-5: Summary of Selected Treatment Technologies
Site Name Treatment Parameters (Excluding Hardness) Calcium
Hardness
Only TOC Iron pH Sulfide Nitrate Nitrite
Surface Water
Treatment Plant GAC N/A Caustic N/A N/A N/A
Cation
Exchange
Cross Bar Wellfield GAC Greensand Caustic N/A N/A N/A Cation
Exchange
BUD5 N/A N/A Caustic N/A Anion
Exchange N/A
Cation
Exchange
BUD7 N/A N/A N/A N/A Anion
Exchange N/A N/A
Northwest
Hillsborough
Wellfield
GAC N/A Caustic Ozone N/A N/A Cation
Exchange
South-Central
Wellfield (1)GAC N/A Caustic N/A N/A N/A
Cation
Exchange
Morris Bridge
Wellfield GAC N/A Caustic N/A N/A N/A
Cation
Exchange
Cypress Creek
Wellfield (1)GAC N/A Caustic N/A N/A N/A
Cation
Exchange
South Pasco
Wellfield GAC N/A Caustic Chlorine N/A N/A
Cation
Exchange
Section 21 Wellfield GAC Chlorine Caustic Chlorine N/A N/A Cation
Exchange
Cosme-Odessa
Wellfield GAC N/A Caustic Ozone N/A N/A
Cation
Exchange
Eldridge Wilde
Wellfield GAC N/A Caustic Ozone N/A N/A
Cation
Exchange
Starkey Wellfield GAC N/A Caustic Ozone N/A N/A Cation
Exchange
1. GAC operated in biological mode at lower predicted TOC percent removals
Tampa Bay Water
Evaluation of Exhibit D Water Quality
Final Report
| Opinion of Probable Construction Costs and Phasing Considerations 5-1
5. Opinion of Probable Construction Costs and Phasing
Considerations
The opinion of probable capital and operating costs were based on Association for the Advancement of
Cost Engineering (AACE) Class V (+50%/-20%) estimates. Using a Class V estimate is appropriate for
screening alternatives and making high-level decisions.
5.1 Assumptions
General and site-specific assumptions were utilized to develop the engineer’s opinion of probable
construction cost (EOPCC) for the treatment process improvements to meet the target water quality and to
compare the various technologies, which include:
• Annual average production at each source as indicated in Table 4-2 were used to develop the
costs for TOC removal rather than the sustainable capacity of the entire source water. As a result,
bypass flow was considered for each technology. In cases where removal of other water quality
parameters was necessary, treatment was applied to the entire sustainable capacity.
• Major capital and O&M costs were obtained from vendors based on site capacity (MGD), water
quality, and treatment goals.
• Each site was evaluated to determine if land acquisition was required. A unit cost per acre was
assumed for land acquisition needs ($/acre).
• Additional intermediate pumping for pressurized systems was not included in the planning level
costs estimates.
• Waste stream flow generation was calculated as a percentage of treatment flow, where waste
stream encompasses backwash and brine water for disposal. A flow dependent ($/gpd) fee was
utilized for a wastewater force main connection for disposal of backwash or brine streams. In
addition to the connection fee, pipeline capital and operation and maintenance (O&M) costs were
included.
• Due to the range in capacities and technologies, chemical dosing and costs were estimated on a
site by site case.
• Capital costs associated with system redundancy were not included.
• O&M costs included chemical and power costs only.
• The costs for interconnecting piping, electrical, and instrumentation and control (I&C) were
estimated as a percentage of equipment capital cost for each site.
• Historical flushing data was averaged and used alongside a cost of $2.56 per 1,000 gal to estimate
cost savings from reduced flushing volumes. The water rate was the unitary rate obtained from
the Master Plan 2020 Budget.
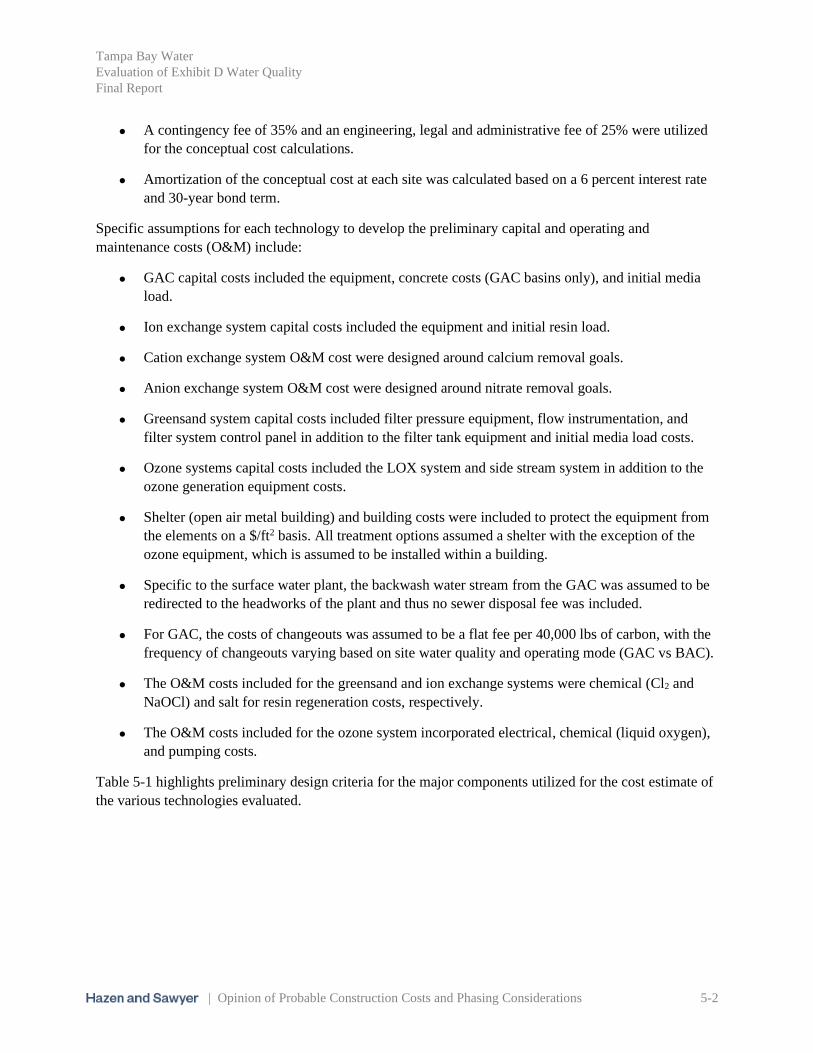
Tampa Bay Water
Evaluation of Exhibit D Water Quality
Final Report
| Opinion of Probable Construction Costs and Phasing Considerations 5-2
• A contingency fee of 35% and an engineering, legal and administrative fee of 25% were utilized
for the conceptual cost calculations.
• Amortization of the conceptual cost at each site was calculated based on a 6 percent interest rate
and 30-year bond term.
Specific assumptions for each technology to develop the preliminary capital and operating and
maintenance costs (O&M) include:
• GAC capital costs included the equipment, concrete costs (GAC basins only), and initial media
load.
• Ion exchange system capital costs included the equipment and initial resin load.
• Cation exchange system O&M cost were designed around calcium removal goals.
• Anion exchange system O&M cost were designed around nitrate removal goals.
• Greensand system capital costs included filter pressure equipment, flow instrumentation, and
filter system control panel in addition to the filter tank equipment and initial media load costs.
• Ozone systems capital costs included the LOX system and side stream system in addition to the
ozone generation equipment costs.
• Shelter (open air metal building) and building costs were included to protect the equipment from
the elements on a $/ft2 basis. All treatment options assumed a shelter with the exception of the
ozone equipment, which is assumed to be installed within a building.
• Specific to the surface water plant, the backwash water stream from the GAC was assumed to be
redirected to the headworks of the plant and thus no sewer disposal fee was included.
• For GAC, the costs of changeouts was assumed to be a flat fee per 40,000 lbs of carbon, with the
frequency of changeouts varying based on site water quality and operating mode (GAC vs BAC).
• The O&M costs included for the greensand and ion exchange systems were chemical (Cl2 and
NaOCl) and salt for resin regeneration costs, respectively.
• The O&M costs included for the ozone system incorporated electrical, chemical (liquid oxygen),
and pumping costs.
Table 5-1 highlights preliminary design criteria for the major components utilized for the cost estimate of
the various technologies evaluated.
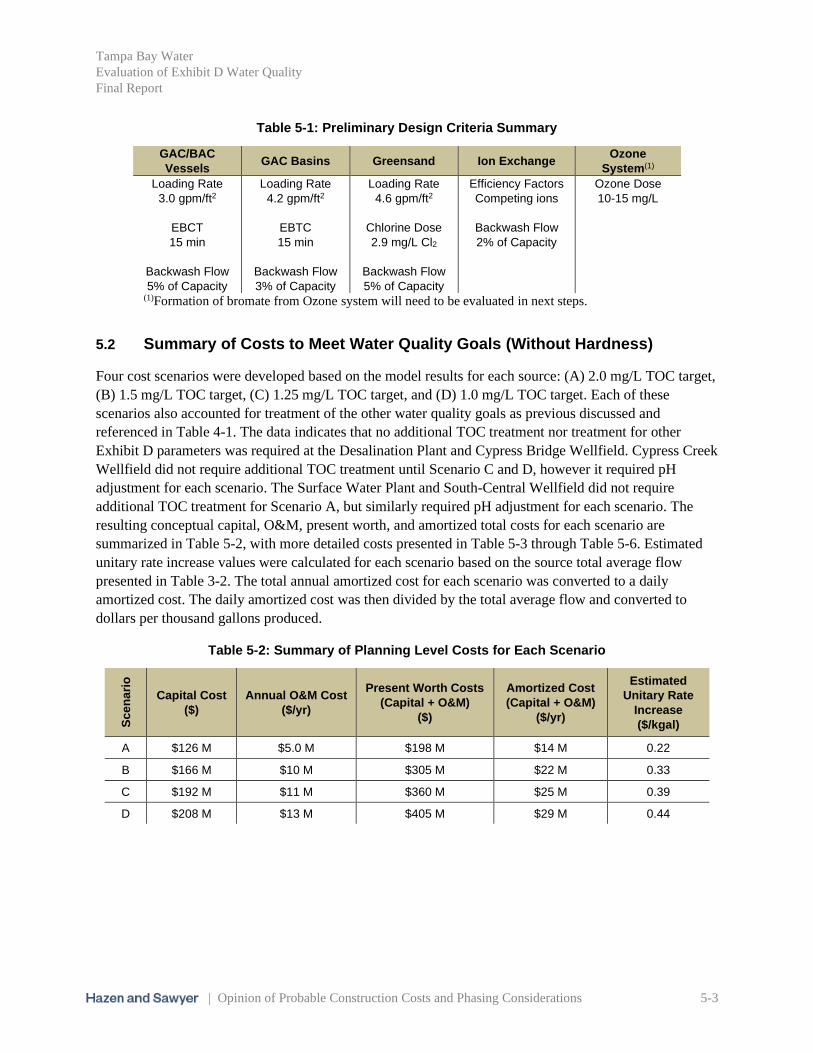
Tampa Bay Water
Evaluation of Exhibit D Water Quality
Final Report
| Opinion of Probable Construction Costs and Phasing Considerations 5-3
Table 5-1: Preliminary Design Criteria Summary
GAC/BAC
Vessels GAC Basins Greensand Ion Exchange
Ozone
System(1)
Loading Rate
3.0 gpm/ft2
EBCT
15 min
Backwash Flow
5% of Capacity
Loading Rate
4.2 gpm/ft2
EBTC
15 min
Backwash Flow
3% of Capacity
Loading Rate
4.6 gpm/ft2
Chlorine Dose
2.9 mg/L Cl2
Backwash Flow
5% of Capacity
Efficiency Factors
Competing ions
Backwash Flow
2% of Capacity
Ozone Dose
10-15 mg/L
(1)Formation of bromate from Ozone system will need to be evaluated in next steps.
5.2 Summary of Costs to Meet Water Quality Goals (Without Hardness)
Four cost scenarios were developed based on the model results for each source: (A) 2.0 mg/L TOC target,
(B) 1.5 mg/L TOC target, (C) 1.25 mg/L TOC target, and (D) 1.0 mg/L TOC target. Each of these
scenarios also accounted for treatment of the other water quality goals as previous discussed and
referenced in Table 4-1. The data indicates that no additional TOC treatment nor treatment for other
Exhibit D parameters was required at the Desalination Plant and Cypress Bridge Wellfield. Cypress Creek
Wellfield did not require additional TOC treatment until Scenario C and D, however it required pH
adjustment for each scenario. The Surface Water Plant and South-Central Wellfield did not require
additional TOC treatment for Scenario A, but similarly required pH adjustment for each scenario. The
resulting conceptual capital, O&M, present worth, and amortized total costs for each scenario are
summarized in Table 5-2, with more detailed costs presented in Table 5-3 through Table 5-6. Estimated
unitary rate increase values were calculated for each scenario based on the source total average flow
presented in Table 3-2. The total annual amortized cost for each scenario was converted to a daily
amortized cost. The daily amortized cost was then divided by the total average flow and converted to
dollars per thousand gallons produced.
Table 5-2: Summary of Planning Level Costs for Each Scenario
Sc
en
ari
o
Capital Cost
($)
Annual O&M Cost
($/yr)
Present Worth Costs
(Capital + O&M)
($)
Amortized Cost
(Capital + O&M)
($/yr)
Estimated
Unitary Rate
Increase
($/kgal)
A $126 M $5.0 M $198 M $14 M 0.22
B $166 M $10 M $305 M $22 M 0.33
C $192 M $11 M $360 M $25 M 0.39
D $208 M $13 M $405 M $29 M 0.44
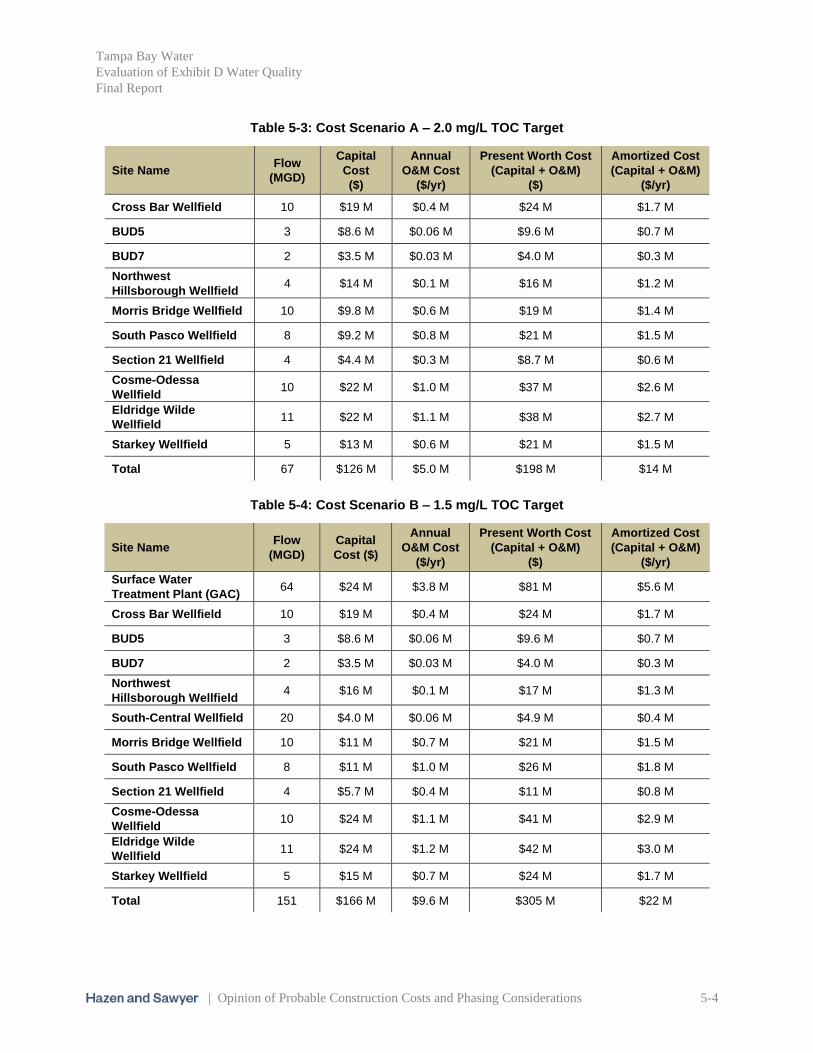
Tampa Bay Water
Evaluation of Exhibit D Water Quality
Final Report
| Opinion of Probable Construction Costs and Phasing Considerations 5-4
Table 5-3: Cost Scenario A – 2.0 mg/L TOC Target
Site Name Flow
(MGD)
Capital
Cost
($)
Annual
O&M Cost
($/yr)
Present Worth Cost
(Capital + O&M)
($)
Amortized Cost
(Capital + O&M)
($/yr)
Cross Bar Wellfield 10 $19 M $0.4 M $24 M $1.7 M
BUD5 3 $8.6 M $0.06 M $9.6 M $0.7 M
BUD7 2 $3.5 M $0.03 M $4.0 M $0.3 M
Northwest
Hillsborough Wellfield 4 $14 M $0.1 M $16 M $1.2 M
Morris Bridge Wellfield 10 $9.8 M $0.6 M $19 M $1.4 M
South Pasco Wellfield 8 $9.2 M $0.8 M $21 M $1.5 M
Section 21 Wellfield 4 $4.4 M $0.3 M $8.7 M $0.6 M
Cosme-Odessa
Wellfield 10 $22 M $1.0 M $37 M $2.6 M
Eldridge Wilde
Wellfield 11 $22 M $1.1 M $38 M $2.7 M
Starkey Wellfield 5 $13 M $0.6 M $21 M $1.5 M
Total 67 $126 M $5.0 M $198 M $14 M
Table 5-4: Cost Scenario B – 1.5 mg/L TOC Target
Site Name Flow
(MGD)
Capital
Cost ($)
Annual
O&M Cost
($/yr)
Present Worth Cost
(Capital + O&M)
($)
Amortized Cost
(Capital + O&M)
($/yr)
Surface Water
Treatment Plant (GAC) 64 $24 M $3.8 M $81 M $5.6 M
Cross Bar Wellfield 10 $19 M $0.4 M $24 M $1.7 M
BUD5 3 $8.6 M $0.06 M $9.6 M $0.7 M
BUD7 2 $3.5 M $0.03 M $4.0 M $0.3 M
Northwest
Hillsborough Wellfield 4 $16 M $0.1 M $17 M $1.3 M
South-Central Wellfield 20 $4.0 M $0.06 M $4.9 M $0.4 M
Morris Bridge Wellfield 10 $11 M $0.7 M $21 M $1.5 M
South Pasco Wellfield 8 $11 M $1.0 M $26 M $1.8 M
Section 21 Wellfield 4 $5.7 M $0.4 M $11 M $0.8 M
Cosme-Odessa
Wellfield 10 $24 M $1.1 M $41 M $2.9 M
Eldridge Wilde
Wellfield 11 $24 M $1.2 M $42 M $3.0 M
Starkey Wellfield 5 $15 M $0.7 M $24 M $1.7 M
Total 151 $166 M $9.6 M $305 M $22 M

Tampa Bay Water
Evaluation of Exhibit D Water Quality
Final Report
| Opinion of Probable Construction Costs and Phasing Considerations 5-5
Table 5-5: Cost Scenario C – 1.25 mg/L TOC Target
Site Name Flow
(MGD)
Capital
Cost ($)
Annual
O&M Cost
($/yr)
Present Worth Cost
(Capital + O&M)
($)
Amortized Cost
(Capital + O&M)
($/yr)
Surface Water
Treatment Plant (GAC) 64 $26 M $4.7 M $95 M $6.5 M
Cross Bar Wellfield 10 $19 M $0.4 M $24 M $1.7 M
BUD5 3 $8.6 M $0.06 M $9.6 M $0.7 M
BUD7 2 $3.5 M $0.03 M $4.0 M $0.3 M
Northwest
Hillsborough Wellfield 4 $17 M $0.1 M $18 M $1.3 M
South-Central Wellfield 20 $10 M $0.1 M $12 M $0.9 M
Morris Bridge Wellfield 10 $16 M $1.1 M $32 M $2.3 M
Cypress Creek
Wellfield 10 $9.0 M $0.1 M $11 M $0.8 M
South Pasco Wellfield 8 $12 M $1.1 M $28 M $1.9 M
Section 21 Wellfield 4 $6.1 M $0.4 M $12 M $0.8 M
Cosme-Odessa
Wellfield 10 $24 M $1.2 M $42 M $3.0 M
Eldridge Wilde
Wellfield 11 $26 M $1.4 M $46 M $3.3 M
Starkey Wellfield 5 $15 M $0.7 M $25 M $1.8 M
Total 161 $192 M $11 M $360 M $25 M
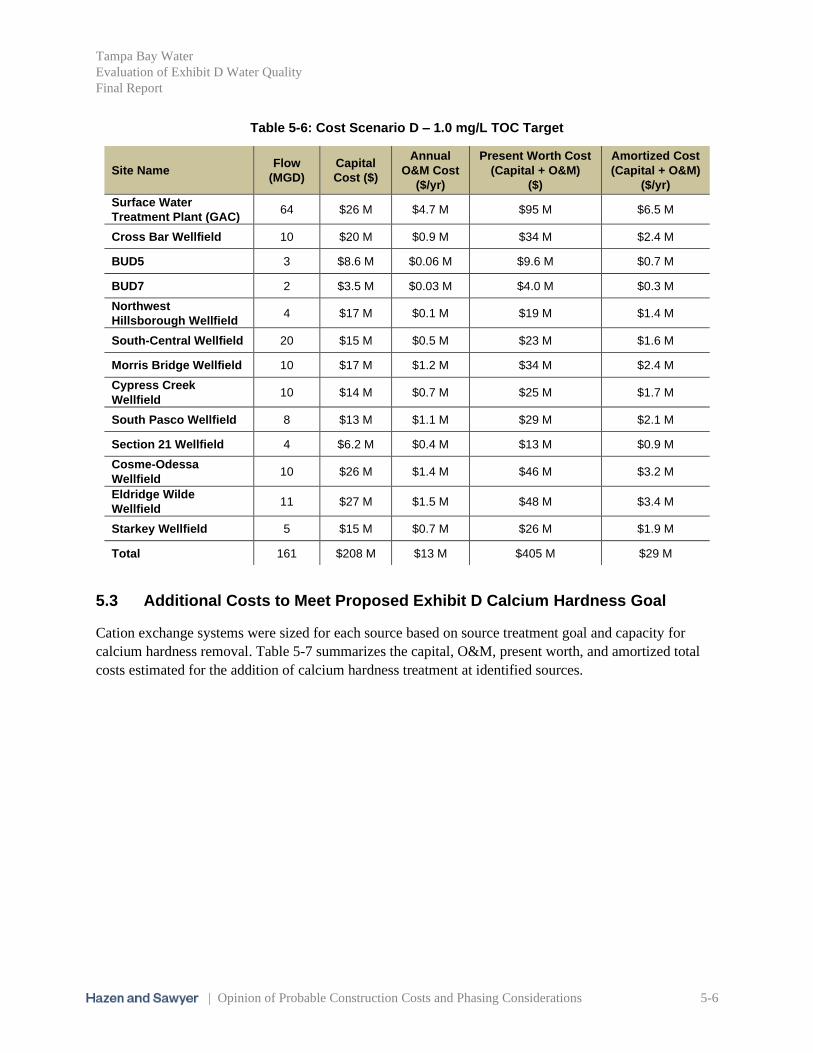
Tampa Bay Water
Evaluation of Exhibit D Water Quality
Final Report
| Opinion of Probable Construction Costs and Phasing Considerations 5-6
Table 5-6: Cost Scenario D – 1.0 mg/L TOC Target
Site Name Flow
(MGD)
Capital
Cost ($)
Annual
O&M Cost
($/yr)
Present Worth Cost
(Capital + O&M)
($)
Amortized Cost
(Capital + O&M)
($/yr)
Surface Water
Treatment Plant (GAC) 64 $26 M $4.7 M $95 M $6.5 M
Cross Bar Wellfield 10 $20 M $0.9 M $34 M $2.4 M
BUD5 3 $8.6 M $0.06 M $9.6 M $0.7 M
BUD7 2 $3.5 M $0.03 M $4.0 M $0.3 M
Northwest
Hillsborough Wellfield 4 $17 M $0.1 M $19 M $1.4 M
South-Central Wellfield 20 $15 M $0.5 M $23 M $1.6 M
Morris Bridge Wellfield 10 $17 M $1.2 M $34 M $2.4 M
Cypress Creek
Wellfield 10 $14 M $0.7 M $25 M $1.7 M
South Pasco Wellfield 8 $13 M $1.1 M $29 M $2.1 M
Section 21 Wellfield 4 $6.2 M $0.4 M $13 M $0.9 M
Cosme-Odessa
Wellfield 10 $26 M $1.4 M $46 M $3.2 M
Eldridge Wilde
Wellfield 11 $27 M $1.5 M $48 M $3.4 M
Starkey Wellfield 5 $15 M $0.7 M $26 M $1.9 M
Total 161 $208 M $13 M $405 M $29 M
5.3 Additional Costs to Meet Proposed Exhibit D Calcium Hardness Goal
Cation exchange systems were sized for each source based on source treatment goal and capacity for
calcium hardness removal. Table 5-7 summarizes the capital, O&M, present worth, and amortized total
costs estimated for the addition of calcium hardness treatment at identified sources.

Tampa Bay Water
Evaluation of Exhibit D Water Quality
Final Report
| Opinion of Probable Construction Costs and Phasing Considerations 5-7
Table 5-7: Summary of Estimated Calcium Removal Costs
Site Name Flow
(MGD)
Capital
Cost ($)
Annual
O&M Cost
($/yr)
Present Worth Cost
(Capital + O&M)
Amortized Cost
(Capital + O&M)
($/yr)
Surface Water Treatment
Plant (GAC) 64 $32 M $3.2 M $77 M $5.6 M
Cross Bar Wellfield 10 $6.1 M $0.48 M $13 M $0.9 M
BUD5 3 $2.5 M $0.16 M $4.7 M $0.4 M
Northwest Hillsborough
Wellfield 4 $2.9 M $0.18 M0 $5.4 M $0.4 M
South-Central Wellfield 20 $7.7 M $0.77 M $18 M $1.3 M
Morris Bridge Wellfield 10 $8.1 M $0.53 M $15 M $1.1 M
Cypress Creek Wellfield 10 $6.9 M $0.48 M $13 M $1.0 M
South Pasco Wellfield 8 $5.6 M $0.38 M $11 M $0.8 M
Section 21 Wellfield 4 $3.1 M $0.19 M $5.8 M $0.4 M
Cosme-Odessa Wellfield 10 $6.5 M $0.48 M $13 M $1.0 M
Eldridge Wilde Wellfield 11 $7.1 M $0.53 M $14 M $1.1 M
Starkey Wellfield 5 $3.9 M $0.24 M $7.2 M $0.5 M
Total 159 $92 M $7.6 M $198 M $15 M
5.4 Phasing Consideration
One consideration, based on the required treatment and costs, is the ability to phase-in further TOC
reductions in the future. Treatment systems incorporated to meet a treatment goal of 2.0 mg/L of TOC
could be designed to account for future upgrades to achieve lower TOC levels in the future. Table 5-8
summarizes the incremental cost increase as the TOC levels are reduced for each scenario. For example, a
1 MGD BAC system could be initially installed at the South-Central Wellfield to achieve the 1.5 mg/L
TOC target, which can be later expanded to an 8 MGD GAC system to achieve the 1.0 mg/L TOC target.
This can be accomplished by installing more GAC vessels and switching the operating mode from
biological to adsorption. Similarly, the Cross Bar Wellfield could initially install a 5 MGD greensand
system to meet a TOC target of 1.25 mg/L, and later install a 5.5 MGD GAC system along with an
additional 0.5 MGD of greensand capacity to meet the 1.0 mg/L TOC target.
Another approach could be initially installing full treatment at a specific location and potentially delaying
treatment at another location since it may be more cost effective to install the infrastructure to treat to a
higher-level up front. Phasing provides Tampa Bay Water and the member governments the opportunity
to distribute the capital costs while reducing TOC levels in the system over time. Specific phasing
concepts can be further evaluated as part of the next steps.
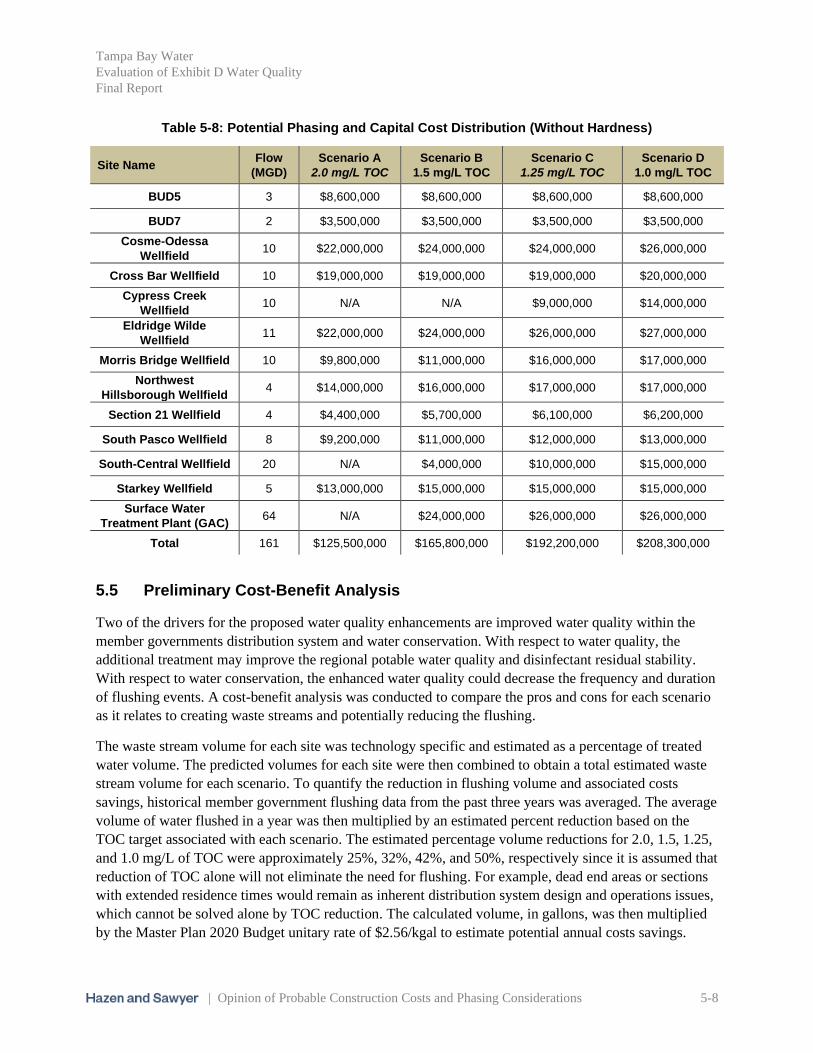
Tampa Bay Water
Evaluation of Exhibit D Water Quality
Final Report
| Opinion of Probable Construction Costs and Phasing Considerations 5-8
Table 5-8: Potential Phasing and Capital Cost Distribution (Without Hardness)
Site Name Flow
(MGD) Scenario A
2.0 mg/L TOC Scenario B
1.5 mg/L TOC
Scenario C
1.25 mg/L TOC Scenario D
1.0 mg/L TOC
BUD5 3 $8,600,000 $8,600,000 $8,600,000 $8,600,000
BUD7 2 $3,500,000 $3,500,000 $3,500,000 $3,500,000
Cosme-Odessa
Wellfield 10 $22,000,000 $24,000,000 $24,000,000 $26,000,000
Cross Bar Wellfield 10 $19,000,000 $19,000,000 $19,000,000 $20,000,000
Cypress Creek
Wellfield 10 N/A N/A $9,000,000 $14,000,000
Eldridge Wilde
Wellfield 11 $22,000,000 $24,000,000 $26,000,000 $27,000,000
Morris Bridge Wellfield 10 $9,800,000 $11,000,000 $16,000,000 $17,000,000
Northwest
Hillsborough Wellfield 4 $14,000,000 $16,000,000 $17,000,000 $17,000,000
Section 21 Wellfield 4 $4,400,000 $5,700,000 $6,100,000 $6,200,000
South Pasco Wellfield 8 $9,200,000 $11,000,000 $12,000,000 $13,000,000
South-Central Wellfield 20 N/A $4,000,000 $10,000,000 $15,000,000
Starkey Wellfield 5 $13,000,000 $15,000,000 $15,000,000 $15,000,000
Surface Water
Treatment Plant (GAC) 64 N/A $24,000,000 $26,000,000 $26,000,000
Total 161 $125,500,000 $165,800,000 $192,200,000 $208,300,000
5.5 Preliminary Cost-Benefit Analysis
Two of the drivers for the proposed water quality enhancements are improved water quality within the
member governments distribution system and water conservation. With respect to water quality, the
additional treatment may improve the regional potable water quality and disinfectant residual stability.
With respect to water conservation, the enhanced water quality could decrease the frequency and duration
of flushing events. A cost-benefit analysis was conducted to compare the pros and cons for each scenario
as it relates to creating waste streams and potentially reducing the flushing.
The waste stream volume for each site was technology specific and estimated as a percentage of treated
water volume. The predicted volumes for each site were then combined to obtain a total estimated waste
stream volume for each scenario. To quantify the reduction in flushing volume and associated costs
savings, historical member government flushing data from the past three years was averaged. The average
volume of water flushed in a year was then multiplied by an estimated percent reduction based on the
TOC target associated with each scenario. The estimated percentage volume reductions for 2.0, 1.5, 1.25,
and 1.0 mg/L of TOC were approximately 25%, 32%, 42%, and 50%, respectively since it is assumed that
reduction of TOC alone will not eliminate the need for flushing. For example, dead end areas or sections
with extended residence times would remain as inherent distribution system design and operations issues,
which cannot be solved alone by TOC reduction. The calculated volume, in gallons, was then multiplied
by the Master Plan 2020 Budget unitary rate of $2.56/kgal to estimate potential annual costs savings.
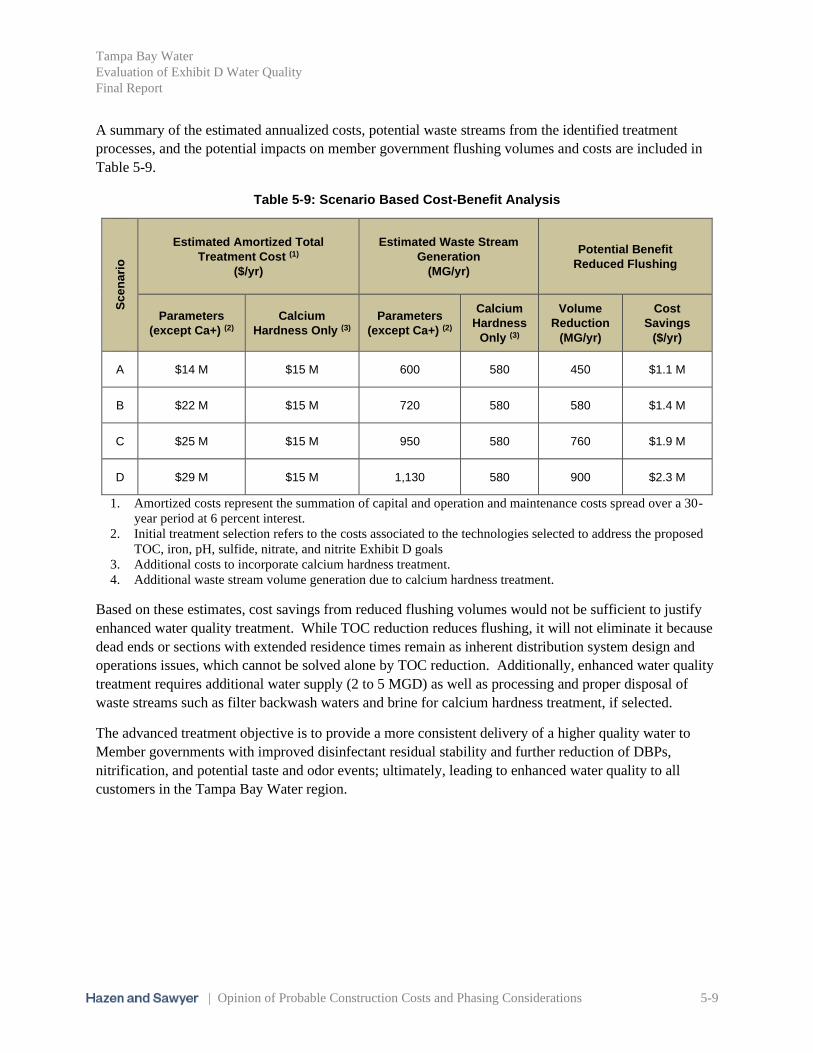
Tampa Bay Water
Evaluation of Exhibit D Water Quality
Final Report
| Opinion of Probable Construction Costs and Phasing Considerations 5-9
A summary of the estimated annualized costs, potential waste streams from the identified treatment
processes, and the potential impacts on member government flushing volumes and costs are included in
Table 5-9.
Table 5-9: Scenario Based Cost-Benefit Analysis
Sc
en
ari
o
Estimated Amortized Total
Treatment Cost (1)
($/yr)
Estimated Waste Stream
Generation
(MG/yr)
Potential Benefit
Reduced Flushing
Parameters
(except Ca+) (2)
Calcium
Hardness Only (3)
Parameters
(except Ca+) (2)
Calcium
Hardness
Only (3)
Volume
Reduction
(MG/yr)
Cost
Savings
($/yr)
A $14 M $15 M 600 580 450 $1.1 M
B $22 M $15 M 720 580 580 $1.4 M
C $25 M $15 M 950 580 760 $1.9 M
D $29 M $15 M 1,130 580 900 $2.3 M
1. Amortized costs represent the summation of capital and operation and maintenance costs spread over a 30-
year period at 6 percent interest.
2. Initial treatment selection refers to the costs associated to the technologies selected to address the proposed
TOC, iron, pH, sulfide, nitrate, and nitrite Exhibit D goals
3. Additional costs to incorporate calcium hardness treatment.
4. Additional waste stream volume generation due to calcium hardness treatment.
Based on these estimates, cost savings from reduced flushing volumes would not be sufficient to justify
enhanced water quality treatment. While TOC reduction reduces flushing, it will not eliminate it because
dead ends or sections with extended residence times remain as inherent distribution system design and
operations issues, which cannot be solved alone by TOC reduction. Additionally, enhanced water quality
treatment requires additional water supply (2 to 5 MGD) as well as processing and proper disposal of
waste streams such as filter backwash waters and brine for calcium hardness treatment, if selected.
The advanced treatment objective is to provide a more consistent delivery of a higher quality water to
Member governments with improved disinfectant residual stability and further reduction of DBPs,
nitrification, and potential taste and odor events; ultimately, leading to enhanced water quality to all
customers in the Tampa Bay Water region.

Tampa Bay Water
Evaluation of Exhibit D Water Quality
Final Report
| Summary of Findings and Next Steps 6-10
6. Summary of Findings and Next Steps
Table 6-1 summarizes the overall potential water quality benefits for each scenario as TOC and other
water quality parameters are reduced. In addition to reduced flushing, each scenario should positively
impact water quality at each POC. The stability of the disinfectant residual and TTHM formation improve
as TOC concentration is reduced, with the most significant improvement predicted for Scenario D.
Although the most benefit is estimated for Scenario D, Scenario A is also estimated to reduce the
disinfectant residual decay rate and THM formation potential. Additional water quality improvements that
could be observed include reduced taste and odor events, reduction in the potential for nitrification, and a
reduction in water hardness.
Table 6-1: Summary of Water Quality Benefits
Scenario
Potential Water Quality Benefits (1)
Residual
Stability THM Formation Taste & Odor (2)
Nitrification
Potential Hardness
A
B
C
D
1. Full circle represents maximum benefit and quarter circle represents minimum benefit. 2. Taste and odor impacts are not exclusively tied to TOC reduction; however, some TOC removal processes
also address sources of taste and odor.
In general, the following are the potential overall water quality benefits based on the findings from the
study:
• Reducing TOC is expected to improve water quality and provide a more consistent supply
throughout the region, reducing the need for additional treatment (i.e. disinfection boost) by each
member government in response to TOC and other water quality variables.
• Improving regional water quality should help the member governments manage water quality in
their distribution systems by increasing the residual stability and reducing potential for taste and
odor, while decreasing flushing.
• Lower TOC levels will reduce DBP formation during free chlorine burns or if a free chlorine
residual is maintained within the system.
• The extent of water quality improvements increases as the TOC level is reduced.
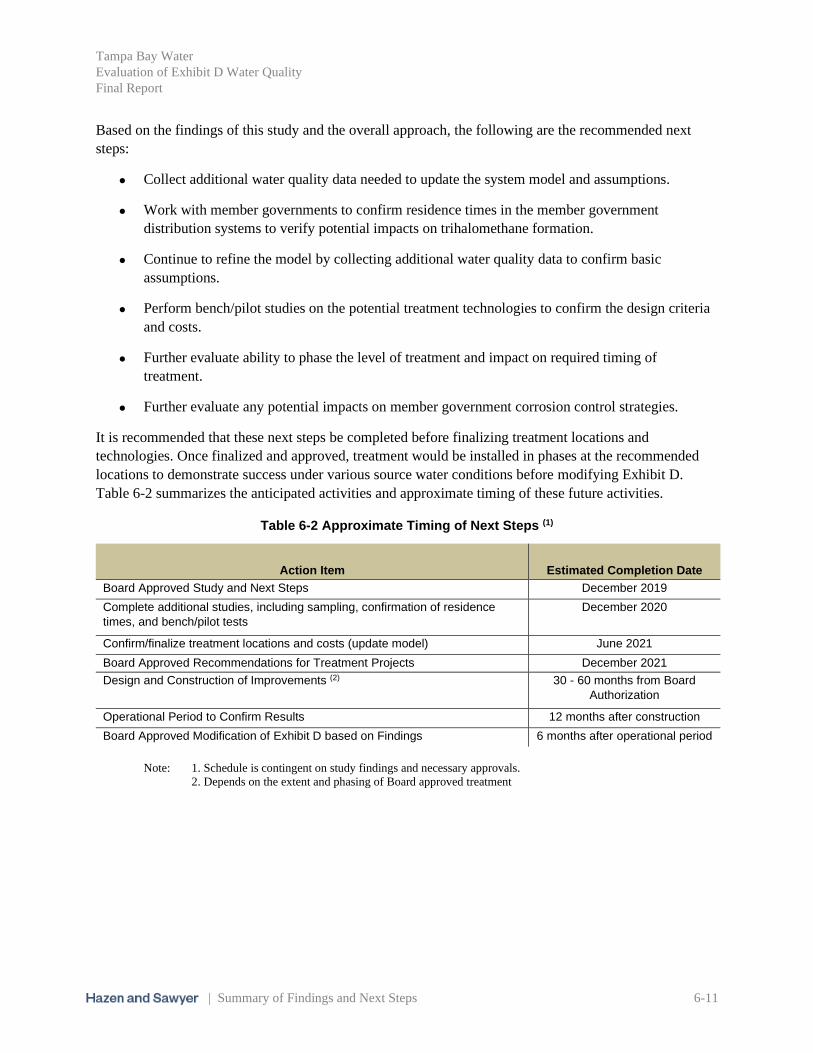
Tampa Bay Water
Evaluation of Exhibit D Water Quality
Final Report
| Summary of Findings and Next Steps 6-11
Based on the findings of this study and the overall approach, the following are the recommended next
steps:
• Collect additional water quality data needed to update the system model and assumptions.
• Work with member governments to confirm residence times in the member government
distribution systems to verify potential impacts on trihalomethane formation.
• Continue to refine the model by collecting additional water quality data to confirm basic
assumptions.
• Perform bench/pilot studies on the potential treatment technologies to confirm the design criteria
and costs.
• Further evaluate ability to phase the level of treatment and impact on required timing of
treatment.
• Further evaluate any potential impacts on member government corrosion control strategies.
It is recommended that these next steps be completed before finalizing treatment locations and
technologies. Once finalized and approved, treatment would be installed in phases at the recommended
locations to demonstrate success under various source water conditions before modifying Exhibit D.
Table 6-2 summarizes the anticipated activities and approximate timing of these future activities.
Table 6-2 Approximate Timing of Next Steps (1)
Action Item Estimated Completion Date
Board Approved Study and Next Steps December 2019
Complete additional studies, including sampling, confirmation of residence
times, and bench/pilot tests
December 2020
Confirm/finalize treatment locations and costs (update model) June 2021
Board Approved Recommendations for Treatment Projects December 2021
Design and Construction of Improvements (2) 30 - 60 months from Board
Authorization
Operational Period to Confirm Results 12 months after construction
Board Approved Modification of Exhibit D based on Findings 6 months after operational period
Note: 1. Schedule is contingent on study findings and necessary approvals.
2. Depends on the extent and phasing of Board approved treatment

Tampa Bay Water
Evaluation of Exhibit D Water Quality
Final Report
| Appendix A: 2017 Member Government Recommendations A-1
Appendix A: 2017 Member Government Recommendations
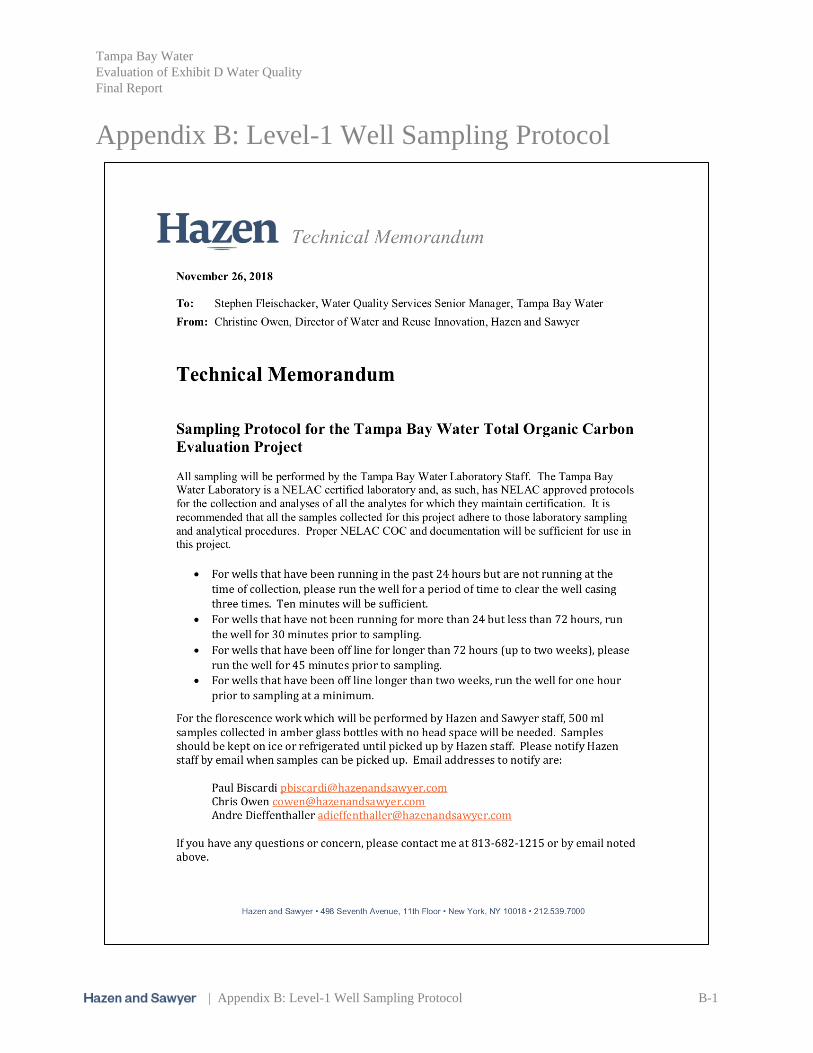
Tampa Bay Water
Evaluation of Exhibit D Water Quality
Final Report
| Appendix B: Level-1 Well Sampling Protocol B-1
Appendix B: Level-1 Well Sampling Protocol
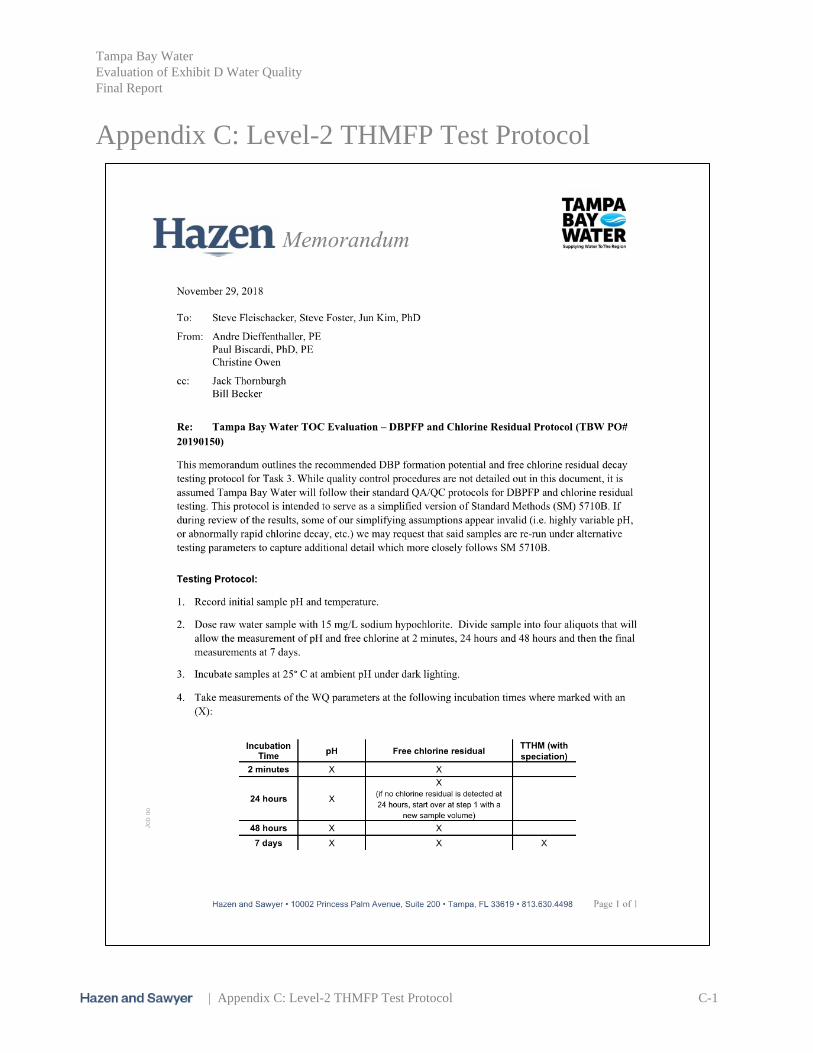
Tampa Bay Water
Evaluation of Exhibit D Water Quality
Final Report
| Appendix C: Level-2 THMFP Test Protocol C-1
Appendix C: Level-2 THMFP Test Protocol

Tampa Bay Water
Evaluation of Exhibit D Water Quality
Final Report
| Appendix D: Level-3 SDS Test Protocol D-1
Appendix D: Level-3 SDS Test Protocol

Tampa Bay Water
Evaluation of Exhibit D Water Quality
Final Report
| Appendix D: Level-3 SDS Test Protocol D-2

Tampa Bay Water
Evaluation of Exhibit D Water Quality
Final Report
| Appendix E: System Model ResultsAppendix E: System Model Results E-1
Appendix E: System Model Results
Summary of Proposed Treatment at each Source - % Removal
Source
Parameter and Exhibit D Potential Revision
TOC TOC TOC TOC Iron Sulfide pH Nitrate Nitrite Calcium Hardness
<1.0 mg/l <1.25 mg/l <1.5 mg/l <2 mg/l <0.05 mg/l <0.02 mg/l 7.8 < 8.3 <0.4 mg/l <0.05 mg/l <100 mg/l CaCO3
Desalination 0% 0% 0% 0% 0% 0%* 2% increase 0% 0% 0%
Surface Water 50% 50% 45% 0% 0% 0%* 2% increase 0% 0% 55%
South-Central Hillsborough Wellfield
40% 25% 5% 0% 0% 99%** 6% increase 0% 0% 50%
Brandon 5 0% 0% 0% 0% 0% 0%* 9% increase 60% at
BUD4 and BUD 6
0% 60%
Brandon 7 0% 0% 0% 0% 0% 0%* 0% 87% 0% 0%
Morris Bridge Wellfield
85% 80% 50% 45% 0% 0%* 11%
increase 0% 0% 60%
Cypress Bridge Wellfield
0% 0% 0% 0% 0% 0%* 0%* 0% 0% 0%
Cross Bar Ranch Wellfield
55% 0% 0% 0% 50% 0%* 10%
increase 0% 0% 50%
Cypress Creek Wellfield
55% 25% 0% 0% 0% 0%* 10%
increase 0% 0% 50%
South Pasco Wellfield
80% 75% 70% 55% 0% 90%** 8% increase 0% 0% 50%
Section 21 Wellfield
75% 65% 60% 45% 35% 81% 8% increase 0% 50% at NWH7
and S215 50%
Northwest Hillsborough Wellfield
70% 65% 55% 40% 0% 97% 10%
increase 0% 0% 45%
Cosme-Odessa Wellfield
80% 70% 65% 55% 0% 96% 10%
increase 0% 0% 50%
Eldridge Wilde Wellfield
80% 75% 65% 55% 0% 98%*** 8% increase 0% 0% 50%
Starkey Wellfield 80% 75% 70% 60% 0% 98% 10%
increase 0% 0% 50%
*existing treatment is already sufficient
**existing treatment will be enhanced
***existing treatment will be replaced
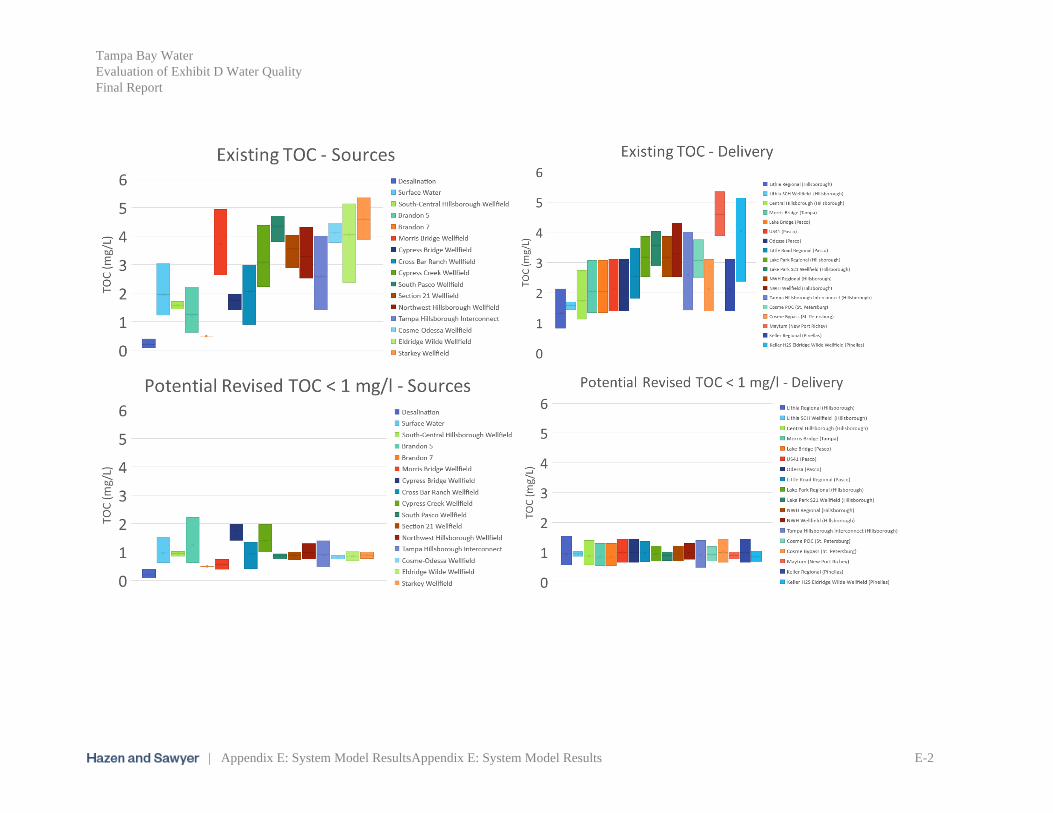
Tampa Bay Water
Evaluation of Exhibit D Water Quality
Final Report
| Appendix E: System Model ResultsAppendix E: System Model Results E-2
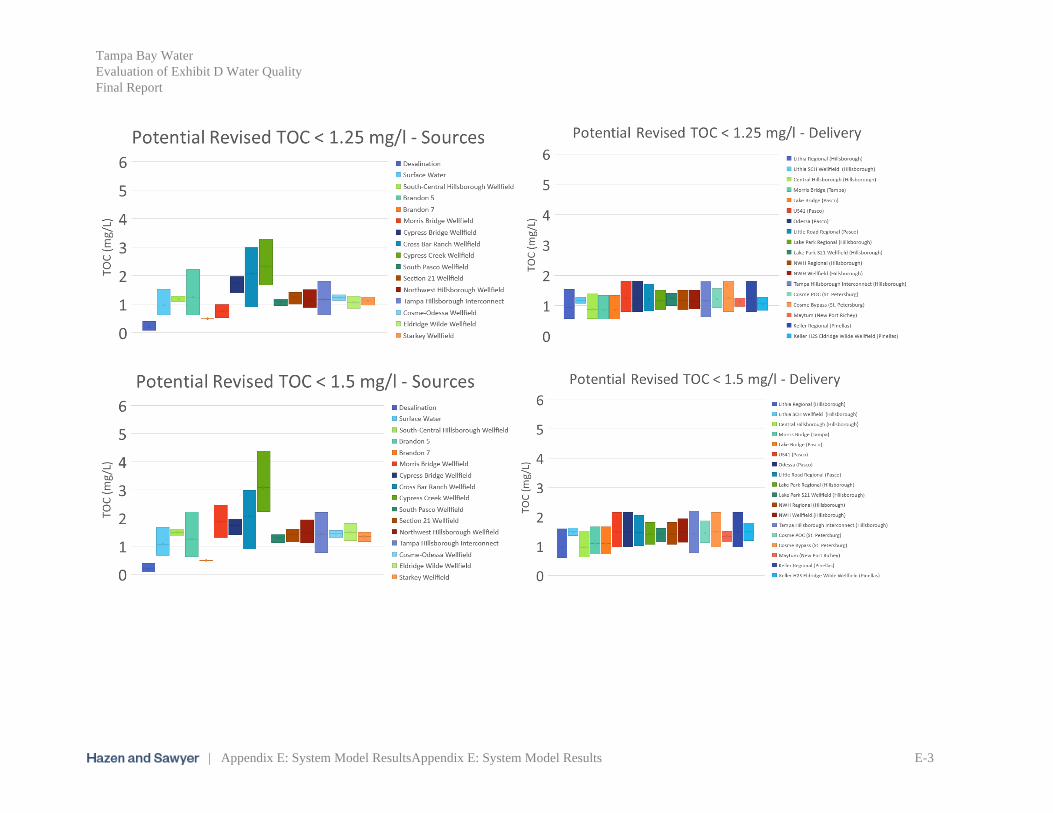
Tampa Bay Water
Evaluation of Exhibit D Water Quality
Final Report
| Appendix E: System Model ResultsAppendix E: System Model Results E-3
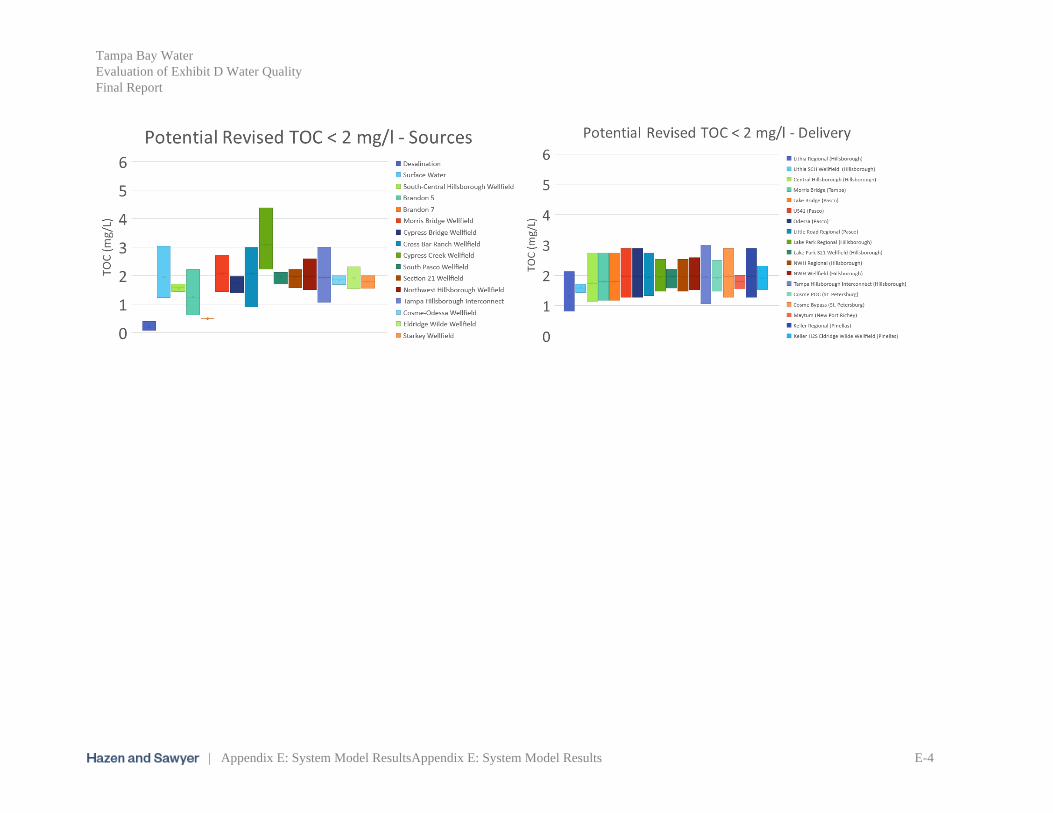
Tampa Bay Water
Evaluation of Exhibit D Water Quality
Final Report
| Appendix E: System Model ResultsAppendix E: System Model Results E-4
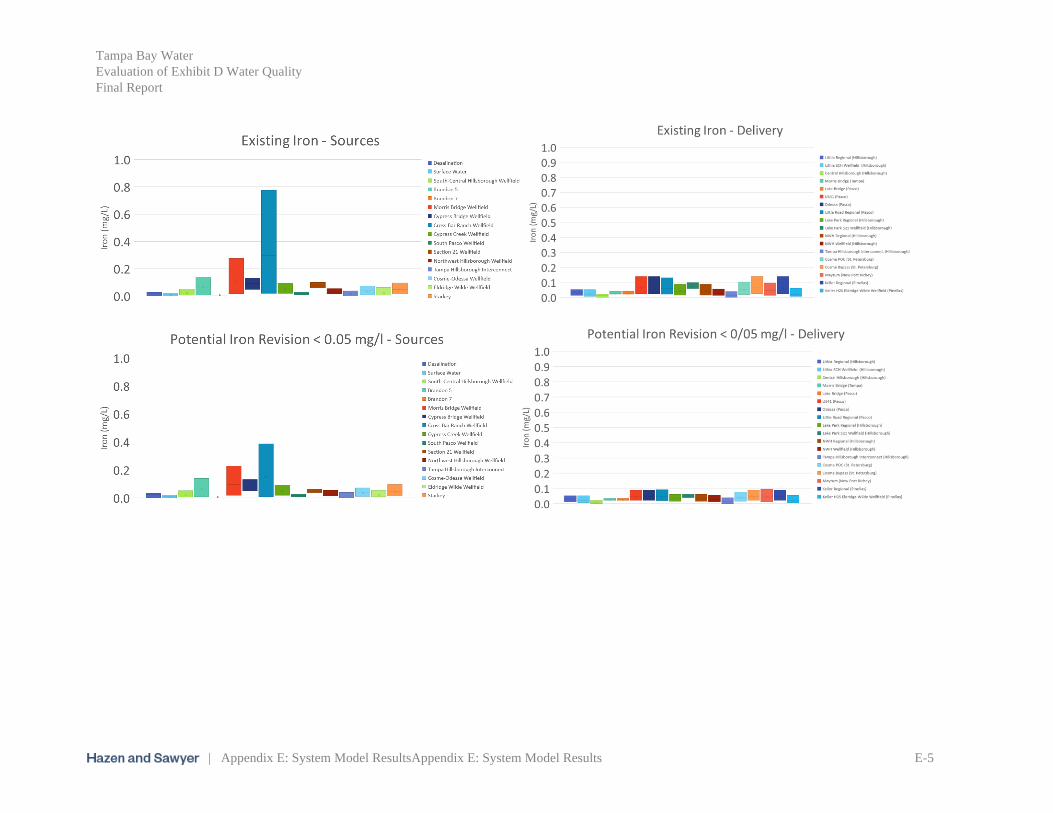
Tampa Bay Water
Evaluation of Exhibit D Water Quality
Final Report
| Appendix E: System Model ResultsAppendix E: System Model Results E-5

Tampa Bay Water
Evaluation of Exhibit D Water Quality
Final Report
| Appendix E: System Model ResultsAppendix E: System Model Results E-6
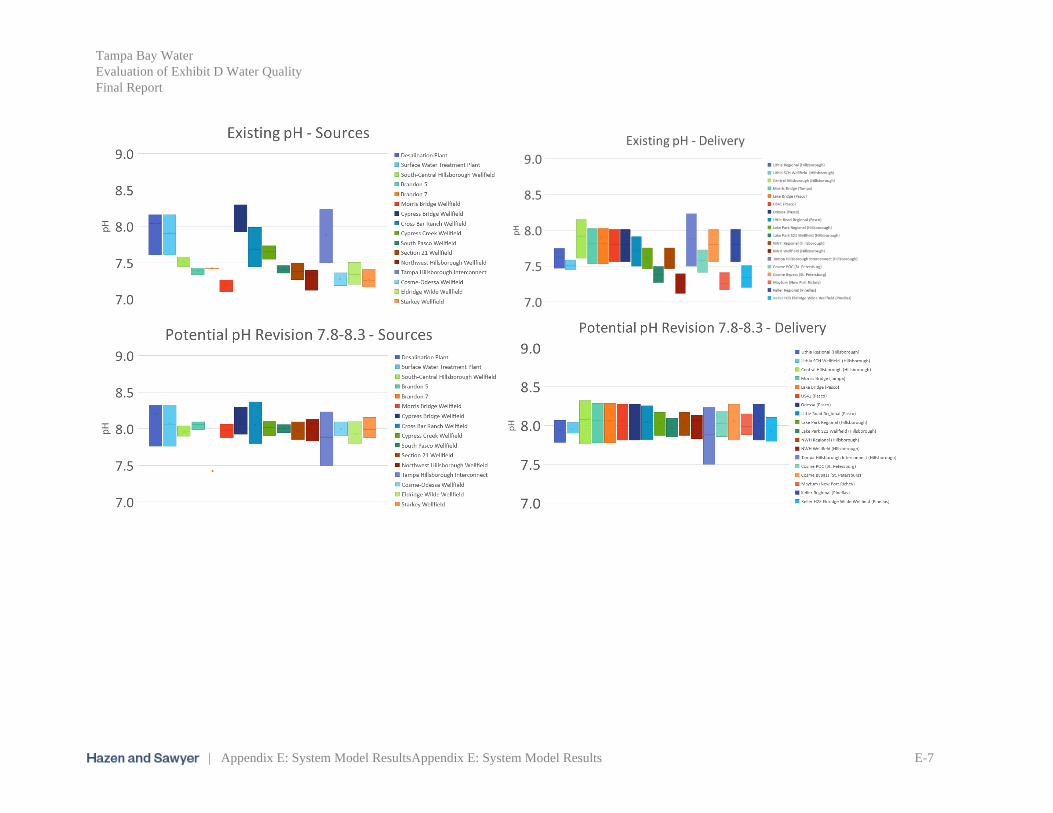
Tampa Bay Water
Evaluation of Exhibit D Water Quality
Final Report
| Appendix E: System Model ResultsAppendix E: System Model Results E-7
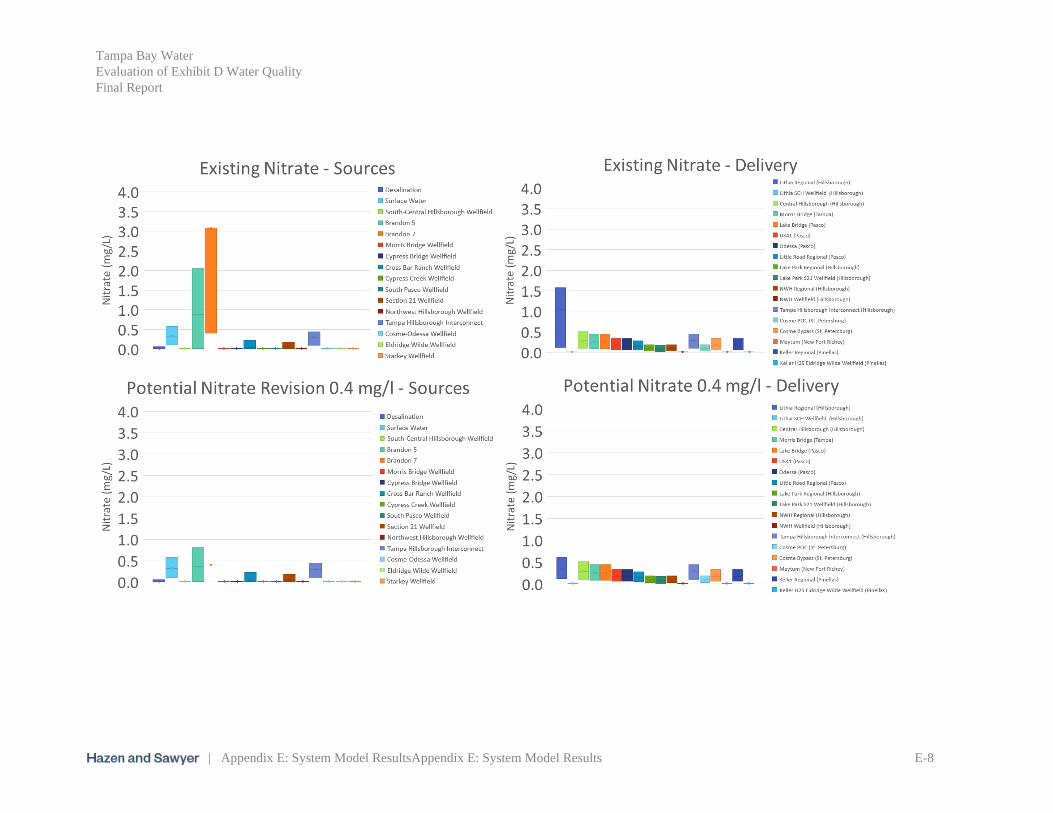
Tampa Bay Water
Evaluation of Exhibit D Water Quality
Final Report
| Appendix E: System Model ResultsAppendix E: System Model Results E-8
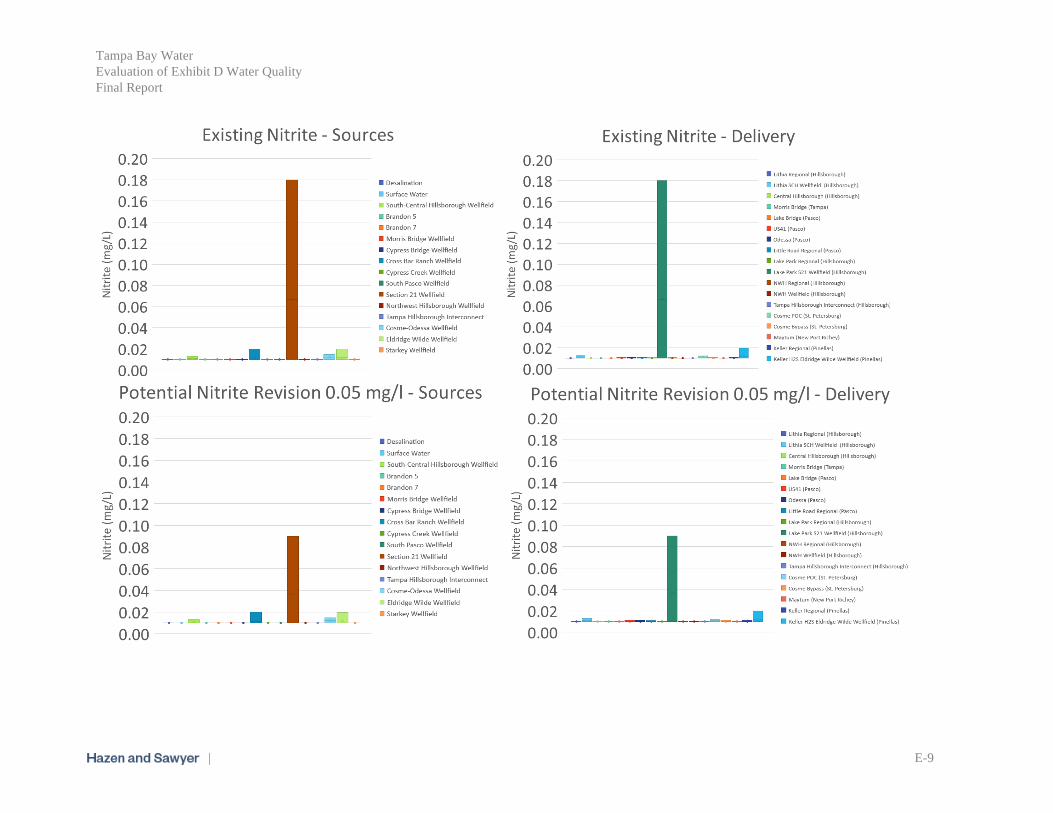
Tampa Bay Water
Evaluation of Exhibit D Water Quality
Final Report
| E-9
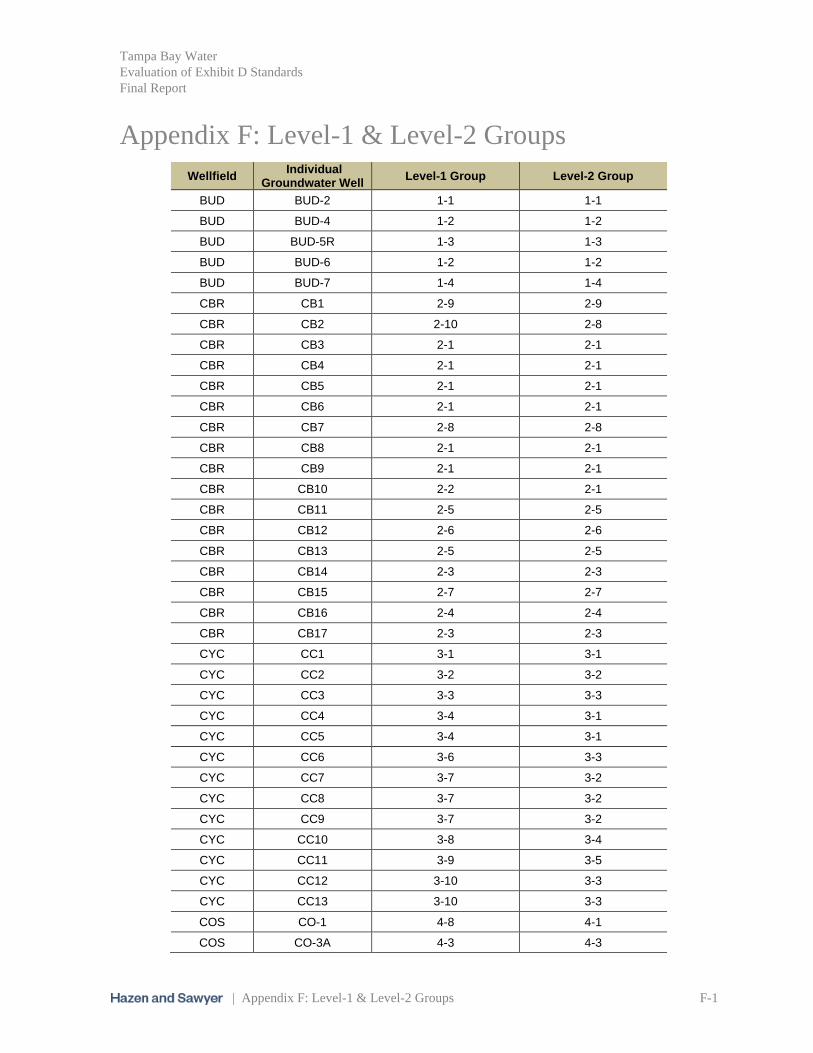
Tampa Bay Water
Evaluation of Exhibit D Standards
Final Report
| Appendix F: Level-1 & Level-2 Groups F-1
Appendix F: Level-1 & Level-2 Groups
Wellfield Individual
Groundwater Well Level-1 Group Level-2 Group
BUD BUD-2 1-1 1-1
BUD BUD-4 1-2 1-2
BUD BUD-5R 1-3 1-3
BUD BUD-6 1-2 1-2
BUD BUD-7 1-4 1-4
CBR CB1 2-9 2-9
CBR CB2 2-10 2-8
CBR CB3 2-1 2-1
CBR CB4 2-1 2-1
CBR CB5 2-1 2-1
CBR CB6 2-1 2-1
CBR CB7 2-8 2-8
CBR CB8 2-1 2-1
CBR CB9 2-1 2-1
CBR CB10 2-2 2-1
CBR CB11 2-5 2-5
CBR CB12 2-6 2-6
CBR CB13 2-5 2-5
CBR CB14 2-3 2-3
CBR CB15 2-7 2-7
CBR CB16 2-4 2-4
CBR CB17 2-3 2-3
CYC CC1 3-1 3-1
CYC CC2 3-2 3-2
CYC CC3 3-3 3-3
CYC CC4 3-4 3-1
CYC CC5 3-4 3-1
CYC CC6 3-6 3-3
CYC CC7 3-7 3-2
CYC CC8 3-7 3-2
CYC CC9 3-7 3-2
CYC CC10 3-8 3-4
CYC CC11 3-9 3-5
CYC CC12 3-10 3-3
CYC CC13 3-10 3-3
COS CO-1 4-8 4-1
COS CO-3A 4-3 4-3

Tampa Bay Water
Evaluation of Exhibit D Standards
Final Report
| Appendix F: Level-1 & Level-2 Groups F-2
Wellfield Individual
Groundwater Well Level-1 Group Level-2 Group
COS CO-5 4-3 4-3
COS CO-6A 4-9 4-3
COS CO-7A 4-1 4-1
COS CO-8 4-4 4-1
COS CO-9 4-3 4-3
COS CO-10 4-10 4-5
COS CO-12A 4-9 4-3
COS CO-16 4-6 4-2
COS CO-18 4-8 4-1
COS CO-20 4-3 4-3
COS CO-21 4-2 4-2
COS CO-24 4-9 4-3
COS CO-25 4-5 4-5
COS CO-30 4-12 4-5
COS CO-31 4-7 4-4
COS CO-32 4-4 4-1
COS CO-34 4-11 4-1
CWD CRLWD1 5-1 5-1
CWD CRLWD2 5-2 5-1
CWD CRLWD3 5-3 5-1
CYB CY1 Offline Offline
CYB CY2 6-1 6-1
CYB CY4 6-1 6-1
CYB CY5 6-1 6-1
CYB CY6 6-5 6-3
CYB CY7 6-5 6-3
CYB CY8 6-2 6-2
CYB CY9 6-3 6-1
CYB CY10 6-5 6-3
CYB CY11 6-4 6-1
ELW ELW9 7-18 7-2
ELW ELW10A 7-19 7-4
ELW ELW11A Offline Offline
ELW ELW12 Offline Offline
ELW ELW13 7-20 7-5
ELW ELW101 7-2 7-1
ELW ELW102 7-3 7-3
ELW ELW103 7-4 7-1
ELW ELW104 7-5 7-1
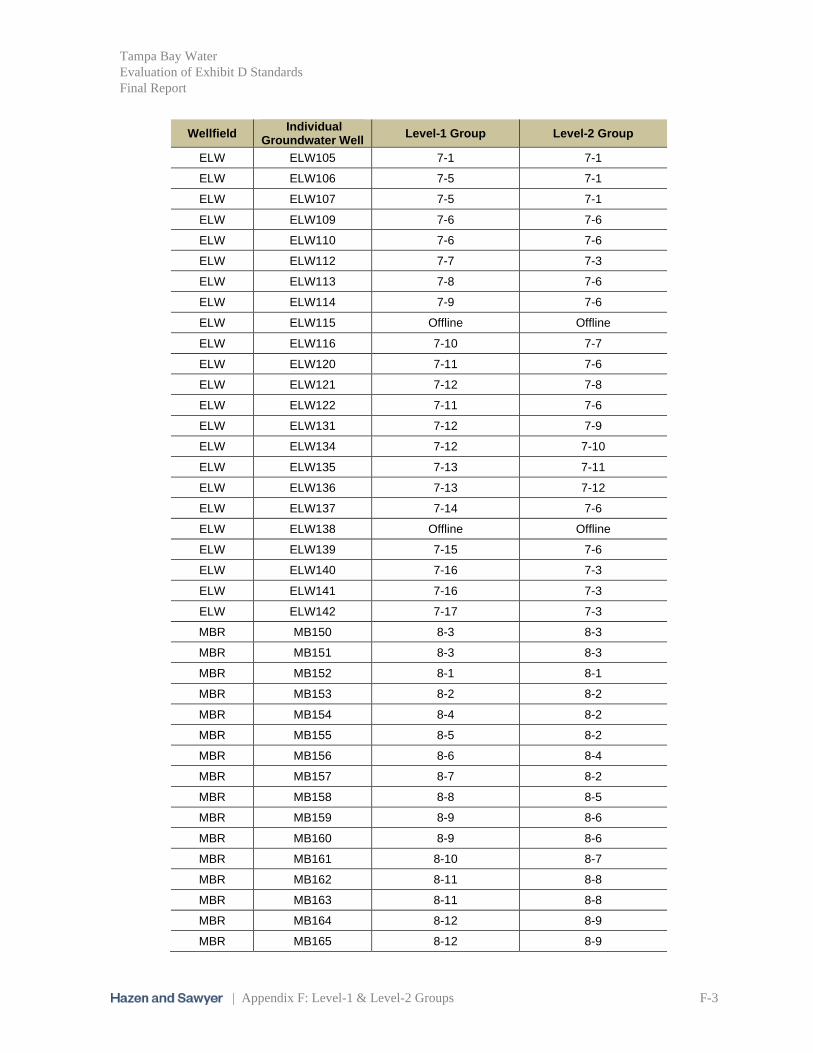
Tampa Bay Water
Evaluation of Exhibit D Standards
Final Report
| Appendix F: Level-1 & Level-2 Groups F-3
Wellfield Individual
Groundwater Well Level-1 Group Level-2 Group
ELW ELW105 7-1 7-1
ELW ELW106 7-5 7-1
ELW ELW107 7-5 7-1
ELW ELW109 7-6 7-6
ELW ELW110 7-6 7-6
ELW ELW112 7-7 7-3
ELW ELW113 7-8 7-6
ELW ELW114 7-9 7-6
ELW ELW115 Offline Offline
ELW ELW116 7-10 7-7
ELW ELW120 7-11 7-6
ELW ELW121 7-12 7-8
ELW ELW122 7-11 7-6
ELW ELW131 7-12 7-9
ELW ELW134 7-12 7-10
ELW ELW135 7-13 7-11
ELW ELW136 7-13 7-12
ELW ELW137 7-14 7-6
ELW ELW138 Offline Offline
ELW ELW139 7-15 7-6
ELW ELW140 7-16 7-3
ELW ELW141 7-16 7-3
ELW ELW142 7-17 7-3
MBR MB150 8-3 8-3
MBR MB151 8-3 8-3
MBR MB152 8-1 8-1
MBR MB153 8-2 8-2
MBR MB154 8-4 8-2
MBR MB155 8-5 8-2
MBR MB156 8-6 8-4
MBR MB157 8-7 8-2
MBR MB158 8-8 8-5
MBR MB159 8-9 8-6
MBR MB160 8-9 8-6
MBR MB161 8-10 8-7
MBR MB162 8-11 8-8
MBR MB163 8-11 8-8
MBR MB164 8-12 8-9
MBR MB165 8-12 8-9
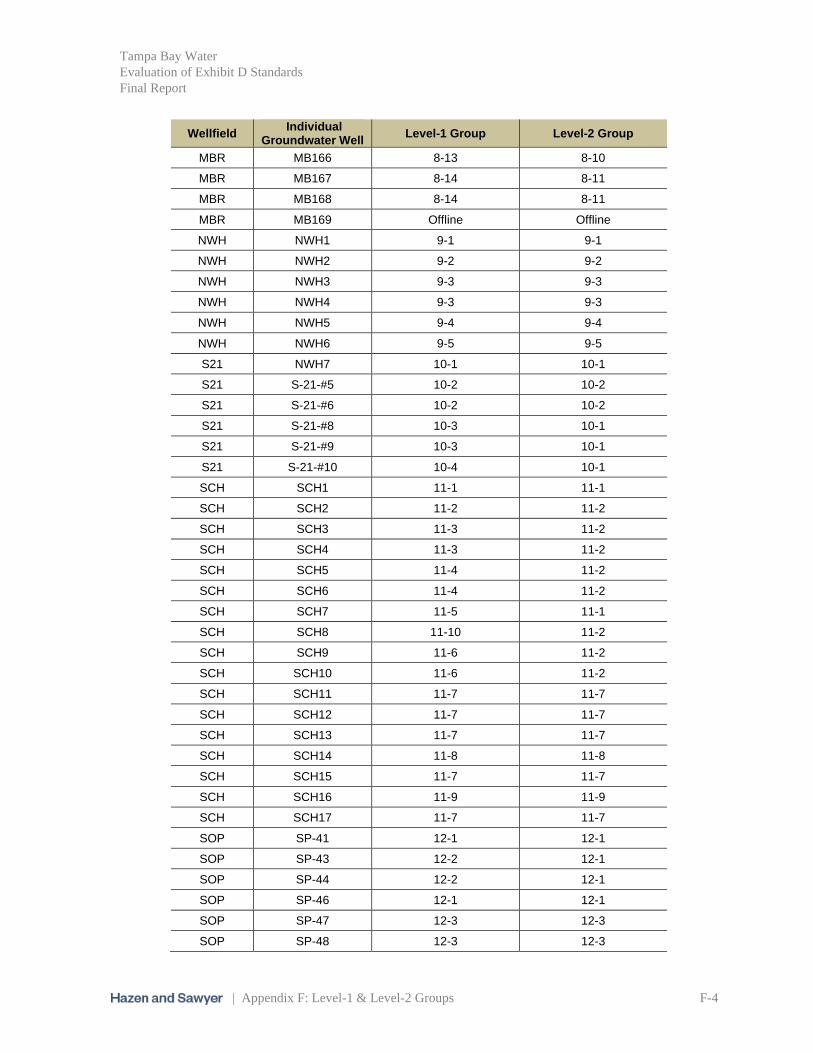
Tampa Bay Water
Evaluation of Exhibit D Standards
Final Report
| Appendix F: Level-1 & Level-2 Groups F-4
Wellfield Individual
Groundwater Well Level-1 Group Level-2 Group
MBR MB166 8-13 8-10
MBR MB167 8-14 8-11
MBR MB168 8-14 8-11
MBR MB169 Offline Offline
NWH NWH1 9-1 9-1
NWH NWH2 9-2 9-2
NWH NWH3 9-3 9-3
NWH NWH4 9-3 9-3
NWH NWH5 9-4 9-4
NWH NWH6 9-5 9-5
S21 NWH7 10-1 10-1
S21 S-21-#5 10-2 10-2
S21 S-21-#6 10-2 10-2
S21 S-21-#8 10-3 10-1
S21 S-21-#9 10-3 10-1
S21 S-21-#10 10-4 10-1
SCH SCH1 11-1 11-1
SCH SCH2 11-2 11-2
SCH SCH3 11-3 11-2
SCH SCH4 11-3 11-2
SCH SCH5 11-4 11-2
SCH SCH6 11-4 11-2
SCH SCH7 11-5 11-1
SCH SCH8 11-10 11-2
SCH SCH9 11-6 11-2
SCH SCH10 11-6 11-2
SCH SCH11 11-7 11-7
SCH SCH12 11-7 11-7
SCH SCH13 11-7 11-7
SCH SCH14 11-8 11-8
SCH SCH15 11-7 11-7
SCH SCH16 11-9 11-9
SCH SCH17 11-7 11-7
SOP SP-41 12-1 12-1
SOP SP-43 12-2 12-1
SOP SP-44 12-2 12-1
SOP SP-46 12-1 12-1
SOP SP-47 12-3 12-3
SOP SP-48 12-3 12-3

Tampa Bay Water
Evaluation of Exhibit D Standards
Final Report
| Appendix F: Level-1 & Level-2 Groups F-5
Wellfield Individual
Groundwater Well Level-1 Group Level-2 Group
SOP SP-49 12-3 12-3
SOP SP-50 12-4 12-1
STK ST3 13-1 13-1
STK ST4 13-6 13-4
STK ST6 13-3 13-3
STK ST7 13-7 13-4
STK ST8 13-4 13-4
STK ST9 13-5 13-5
STK ST10 13-4 13-4
STK ST12 Offline Offline
STK ST15 Offline Offline
ELW ELW-1S Abandoned Abandoned
ELW ELW-8S Abandoned Abandoned
NOP NOP-04 Abandoned Abandoned
NOP NOP-06 Abandoned Abandoned
NWH NWH-CL-01 Abandoned Abandoned
NWH NWH-CL-02 Abandoned Abandoned
COS COS-19 Abandoned Abandoned
S21 S21-02 Abandoned Abandoned
STK STK-01 Abandoned Abandoned
STK STK-02 Abandoned Abandoned
STK STK-11 Abandoned Abandoned
STK STK-13 Abandoned Abandoned
STK STK-14 Abandoned Abandoned
EAG EAG-Eagles 1 Abandoned Abandoned
EAG EAG-Eagles 2 Abandoned Abandoned

Tampa Bay Water
Evaluation of Exhibit D Standards
Final Report
| Appendix G: System Model Water Quality Assumptions G-1
Appendix G: System Model Water Quality Assumptions
Source Well Level
1 Group
Level 2
Group
Ammonia (mg/L)
Arsenic (mg/L)
Bromide (mg/L)
Chloride (mg/L)
Fluoride (mg/L)
Iron (mg/L)
Nitrate (mg/L)
Nitrite (mg/L)
Ortho P
(mg/L) pH
Sulfate (mg/L)
TDS (mg/L)
(TOC) (mg/L)
Total Sulfide (mg/L)
Turbidity (NTU)
FEEM Reg I (au)
FEEM Reg II (au)
FEEM Reg III
(au)
UV254 (cm-1)
SUVA (L/mg-m)
THMFP (ppb)
Ca Hardness (CaCO3)
BUD-2 1-1 1-1 0.51 0.0030 0.04 11.30 0.21 0.07 0.01 0.01 0.02 7.43 125 383 2.2 0.68 0.09 1227 6894 8792 0.048 2.1 142 191
BUD-4 1-2 1-2 0.05 0.0030 0.02 22.30 0.18 0.01 2.33 0.01 0.02 7.40 60 286 0.7 0.01 0.23 186 497 630 0.005 0.7 35 191
BUD-5R 1-3 1-3 0.12 0.0000 0.12 11.36 0.23 0.14 0.05 0.01 0.12 7.33 7 175 1.2 0.01 0.28 676 3525 4456 0.033 1.7 90 191
BUD-6 1-2 1-2 0.05 0.0030 0.07 20.50 0.17 0.01 1.48 0.01 0.02 7.42 54 272 0.5 0.01 0.13 437 560 638 0.006 1.2 15 191
BUD-7 1-4 1-4 0.18 0.0035 0.09 26.60 0.15 0.01 3.08 0.01 0.02 7.42 31 252 0.5 0.01 0.15 199 456 564 0.011 0.7 15 157
CB1 2-9 2-9 0.42 0.0030 0.03 6.87 0.01 0.95 0.01 0.01 0.01 7.00 0 221 2.5 0.04 0.91 1744 7441 9686 0.065 2.1 122 189
CB10 2-2 2-1 0.29 0.0035 0.03 7.06 0.04 0.26 0.04 0.01 0.01 7.31 1 200 2.2 0.03 0.48 899 5102 6641 0.037 1.7 132 189
CB11 2-5 2-5 0.19 0.0035 0.03 6.53 0.06 0.12 0.01 0.01 0.01 7.42 1 191 1.7 0.06 0.09 754 3951 5223 0.028 1.4 92 189
CB12 2-6 2-6 0.09 0.0035 0.02 5.67 0.04 0.28 0.01 0.01 0.02 7.35 1 186 0.9 0.02 0.34 283 1378 1884 0.008 0.7 36 189
CB13 2-5 2-5 0.22 0.0030 0.03 6.23 0.05 0.22 0.06 0.01 0.01 7.36 1 190 1.8 0.03 0.23 732 3895 5126 0.024 1.4 106 189
CB14 2-3 2-3 0.11 0.0035 0.02 5.45 0.05 0.02 0.07 0.01 0.02 7.58 2 187 0.9 0.03 0.14 376 1738 2287 0.010 0.8 49 189
CB15 2-7 2-7 0.17 0.0035 0.03 6.40 0.06 0.03 0.01 0.01 0.01 7.58 3 190 1.6 0.18 0.12 912 4671 5903 0.035 1.8 89 189
CB16 2-4 2-4 0.10 0.0035 0.02 6.20 0.08 0.10 0.39 0.03 0.04 7.44 7 182 1.1 0.04 0.17 484 2795 3622 0.041 1.3 59 189
CB17 2-3 2-3 0.09 0.0035 0.02 5.44 0.06 0.01 0.01 0.01 0.02 7.63 3 187 0.9 0.07 0.09 376 1738 2287 0.010 0.8 42 189
CB2 2-10 2-8 0.38 0.0035 0.03 6.93 0.04 0.59 0.01 0.01 0.01 7.24 0 205 2.5 0.03 0.27 1609 6961 9116 0.047 1.9 154 189
CB3 2-1 2-1 0.47 0.0035 0.02 7.14 0.05 0.27 0.01 0.01 0.01 7.31 0 213 3.0 0.08 0.09 1170 6268 8168 0.042 1.6 184 189
CB4 2-1 2-1 0.37 0.0035 0.03 6.95 0.05 0.33 0.01 0.01 0.01 7.23 0 216 2.7 0.05 0.25 1205 6484 8429 0.043 1.6 166 189
CB5 2-1 2-1 0.32 0.0035 0.03 7.06 0.06 0.30 0.01 0.01 0.01 7.27 0 209 2.4 0.06 0.13 1134 6051 7907 0.226 1.6 145 189
CB6 2-1 2-1 0.33 0.0035 0.03 7.34 0.05 0.30 0.01 0.01 0.01 7.33 0 213 2.5 0.05 0.15 1170 6268 8168 0.042 1.6 153 189
CB7 2-8 2-8 0.40 0.0035 0.03 6.89 0.01 0.43 0.01 0.01 0.01 7.21 0 211 2.6 0.06 0.18 1702 7679 9981 0.077 2.0 145 189
CB8 2-1 2-1 0.38 0.0035 0.03 6.85 0.05 0.41 0.01 0.01 0.06 7.30 0 213 3.0 0.05 0.23 1170 6268 8168 0.042 1.6 184 189
CB9 2-1 2-1 0.36 0.0035 0.07 6.97 0.06 0.38 0.01 0.01 0.01 7.33 0 213 2.8 0.03 0.15 1170 6268 8168 0.042 1.6 170 189
CC1 3-1 3-1 0.20 0.0035 0.04 8.72 0.07 0.05 0.01 0.01 0.02 7.31 3 227 2.5 0.04 0.09 1538 7156 9168 0.074 2.4 172 189
CC10 3-8 3-4 0.13 0.0035 0.04 9.17 0.01 0.10 0.01 0.01 0.01 7.19 27 298 3.8 0.19 0.11 1733 10965 13561 0.085 2.5 210 189
CC11 3-9 3-5 0.17 0.0035 0.04 8.93 0.01 0.08 0.01 0.01 0.02 7.23 18 280 4.8 0.13 0.11 2137 14030 17333 0.162 3.0 290 189
CC12 3-10 3-3 0.12 0.0035 0.04 9.90 0.01 0.09 0.01 0.01 0.01 7.19 24 283 3.9 0.06 0.15 1297 8668 11195 0.082 2.1 242 189
CC13 3-10 3-3 0.14 0.0035 0.03 9.03 0.21 0.08 0.01 0.01 0.01 7.32 27 283 3.0 0.13 0.10 1297 8668 11195 0.082 2.1 184 189
CC2 3-2 3-2 0.18 0.0030 0.03 7.96 0.07 0.02 0.01 0.01 0.02 7.40 6 234 2.4 0.17 0.10 1470 6668 8502 0.057 2.4 147 189
CC3 3-3 3-3 0.21 0.0035 0.04 8.67 0.11 0.06 0.01 0.01 0.01 7.27 21 275 3.0 0.16 0.13 1782 7844 10114 0.067 2.2 185 189
CC4 3-4 3-1 0.13 0.0035 0.06 8.93 0.07 0.02 0.01 0.01 0.02 7.28 26 297 3.6 0.24 0.11 1303 6797 8765 0.069 1.9 223 189
CC5 3-4 3-1 0.14 0.0035 0.04 8.40 0.01 0.02 0.01 0.01 0.02 7.28 25 297 2.8 0.35 0.08 1303 6797 8765 0.069 1.9 173 189
CC6 3-6 3-3 0.20 0.0035 0.04 8.30 0.01 0.02 0.01 0.01 0.04 7.33 11 258 3.0 0.44 0.20 1775 8112 10406 0.069 2.3 156 189
CC7 3-7 3-2 0.22 0.0035 0.07 7.92 0.12 0.02 0.01 0.01 0.03 7.33 19 277 2.8 0.27 0.09 1253 7449 9271 0.057 2.2 170 189
CC8 3-7 3-2 0.11 0.0035 0.03 8.24 0.01 0.05 0.01 0.01 0.02 7.35 38 277 2.1 0.17 0.10 1253 7449 9271 0.057 2.2 128 189
CC9 3-7 3-2 0.10 0.0035 0.04 9.15 0.01 0.04 0.01 0.01 0.01 7.31 28 277 2.5 0.10 0.09 1253 7449 9271 0.057 2.2 155 189
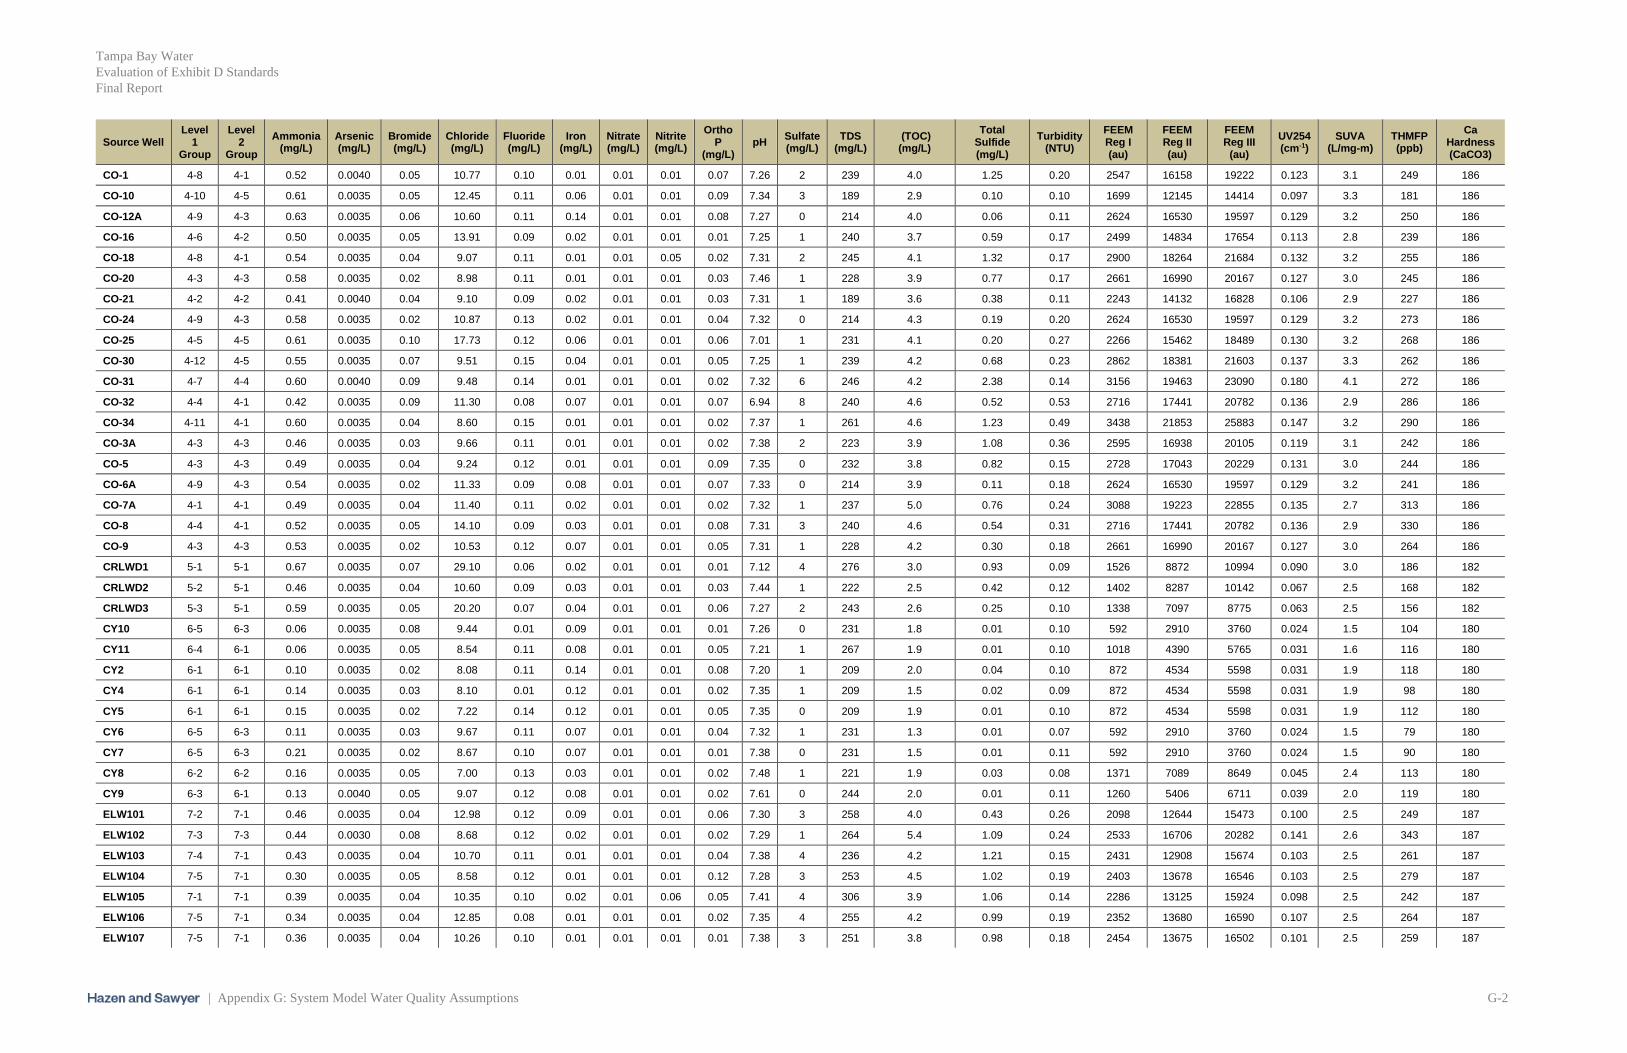
Tampa Bay Water
Evaluation of Exhibit D Standards
Final Report
| Appendix G: System Model Water Quality Assumptions G-2
Source Well Level
1 Group
Level 2
Group
Ammonia (mg/L)
Arsenic (mg/L)
Bromide (mg/L)
Chloride (mg/L)
Fluoride (mg/L)
Iron (mg/L)
Nitrate (mg/L)
Nitrite (mg/L)
Ortho P
(mg/L) pH
Sulfate (mg/L)
TDS (mg/L)
(TOC) (mg/L)
Total Sulfide (mg/L)
Turbidity (NTU)
FEEM Reg I (au)
FEEM Reg II (au)
FEEM Reg III
(au)
UV254 (cm-1)
SUVA (L/mg-m)
THMFP (ppb)
Ca Hardness (CaCO3)
CO-1 4-8 4-1 0.52 0.0040 0.05 10.77 0.10 0.01 0.01 0.01 0.07 7.26 2 239 4.0 1.25 0.20 2547 16158 19222 0.123 3.1 249 186
CO-10 4-10 4-5 0.61 0.0035 0.05 12.45 0.11 0.06 0.01 0.01 0.09 7.34 3 189 2.9 0.10 0.10 1699 12145 14414 0.097 3.3 181 186
CO-12A 4-9 4-3 0.63 0.0035 0.06 10.60 0.11 0.14 0.01 0.01 0.08 7.27 0 214 4.0 0.06 0.11 2624 16530 19597 0.129 3.2 250 186
CO-16 4-6 4-2 0.50 0.0035 0.05 13.91 0.09 0.02 0.01 0.01 0.01 7.25 1 240 3.7 0.59 0.17 2499 14834 17654 0.113 2.8 239 186
CO-18 4-8 4-1 0.54 0.0035 0.04 9.07 0.11 0.01 0.01 0.05 0.02 7.31 2 245 4.1 1.32 0.17 2900 18264 21684 0.132 3.2 255 186
CO-20 4-3 4-3 0.58 0.0035 0.02 8.98 0.11 0.01 0.01 0.01 0.03 7.46 1 228 3.9 0.77 0.17 2661 16990 20167 0.127 3.0 245 186
CO-21 4-2 4-2 0.41 0.0040 0.04 9.10 0.09 0.02 0.01 0.01 0.03 7.31 1 189 3.6 0.38 0.11 2243 14132 16828 0.106 2.9 227 186
CO-24 4-9 4-3 0.58 0.0035 0.02 10.87 0.13 0.02 0.01 0.01 0.04 7.32 0 214 4.3 0.19 0.20 2624 16530 19597 0.129 3.2 273 186
CO-25 4-5 4-5 0.61 0.0035 0.10 17.73 0.12 0.06 0.01 0.01 0.06 7.01 1 231 4.1 0.20 0.27 2266 15462 18489 0.130 3.2 268 186
CO-30 4-12 4-5 0.55 0.0035 0.07 9.51 0.15 0.04 0.01 0.01 0.05 7.25 1 239 4.2 0.68 0.23 2862 18381 21603 0.137 3.3 262 186
CO-31 4-7 4-4 0.60 0.0040 0.09 9.48 0.14 0.01 0.01 0.01 0.02 7.32 6 246 4.2 2.38 0.14 3156 19463 23090 0.180 4.1 272 186
CO-32 4-4 4-1 0.42 0.0035 0.09 11.30 0.08 0.07 0.01 0.01 0.07 6.94 8 240 4.6 0.52 0.53 2716 17441 20782 0.136 2.9 286 186
CO-34 4-11 4-1 0.60 0.0035 0.04 8.60 0.15 0.01 0.01 0.01 0.02 7.37 1 261 4.6 1.23 0.49 3438 21853 25883 0.147 3.2 290 186
CO-3A 4-3 4-3 0.46 0.0035 0.03 9.66 0.11 0.01 0.01 0.01 0.02 7.38 2 223 3.9 1.08 0.36 2595 16938 20105 0.119 3.1 242 186
CO-5 4-3 4-3 0.49 0.0035 0.04 9.24 0.12 0.01 0.01 0.01 0.09 7.35 0 232 3.8 0.82 0.15 2728 17043 20229 0.131 3.0 244 186
CO-6A 4-9 4-3 0.54 0.0035 0.02 11.33 0.09 0.08 0.01 0.01 0.07 7.33 0 214 3.9 0.11 0.18 2624 16530 19597 0.129 3.2 241 186
CO-7A 4-1 4-1 0.49 0.0035 0.04 11.40 0.11 0.02 0.01 0.01 0.02 7.32 1 237 5.0 0.76 0.24 3088 19223 22855 0.135 2.7 313 186
CO-8 4-4 4-1 0.52 0.0035 0.05 14.10 0.09 0.03 0.01 0.01 0.08 7.31 3 240 4.6 0.54 0.31 2716 17441 20782 0.136 2.9 330 186
CO-9 4-3 4-3 0.53 0.0035 0.02 10.53 0.12 0.07 0.01 0.01 0.05 7.31 1 228 4.2 0.30 0.18 2661 16990 20167 0.127 3.0 264 186
CRLWD1 5-1 5-1 0.67 0.0035 0.07 29.10 0.06 0.02 0.01 0.01 0.01 7.12 4 276 3.0 0.93 0.09 1526 8872 10994 0.090 3.0 186 182
CRLWD2 5-2 5-1 0.46 0.0035 0.04 10.60 0.09 0.03 0.01 0.01 0.03 7.44 1 222 2.5 0.42 0.12 1402 8287 10142 0.067 2.5 168 182
CRLWD3 5-3 5-1 0.59 0.0035 0.05 20.20 0.07 0.04 0.01 0.01 0.06 7.27 2 243 2.6 0.25 0.10 1338 7097 8775 0.063 2.5 156 182
CY10 6-5 6-3 0.06 0.0035 0.08 9.44 0.01 0.09 0.01 0.01 0.01 7.26 0 231 1.8 0.01 0.10 592 2910 3760 0.024 1.5 104 180
CY11 6-4 6-1 0.06 0.0035 0.05 8.54 0.11 0.08 0.01 0.01 0.05 7.21 1 267 1.9 0.01 0.10 1018 4390 5765 0.031 1.6 116 180
CY2 6-1 6-1 0.10 0.0035 0.02 8.08 0.11 0.14 0.01 0.01 0.08 7.20 1 209 2.0 0.04 0.10 872 4534 5598 0.031 1.9 118 180
CY4 6-1 6-1 0.14 0.0035 0.03 8.10 0.01 0.12 0.01 0.01 0.02 7.35 1 209 1.5 0.02 0.09 872 4534 5598 0.031 1.9 98 180
CY5 6-1 6-1 0.15 0.0035 0.02 7.22 0.14 0.12 0.01 0.01 0.05 7.35 0 209 1.9 0.01 0.10 872 4534 5598 0.031 1.9 112 180
CY6 6-5 6-3 0.11 0.0035 0.03 9.67 0.11 0.07 0.01 0.01 0.04 7.32 1 231 1.3 0.01 0.07 592 2910 3760 0.024 1.5 79 180
CY7 6-5 6-3 0.21 0.0035 0.02 8.67 0.10 0.07 0.01 0.01 0.01 7.38 0 231 1.5 0.01 0.11 592 2910 3760 0.024 1.5 90 180
CY8 6-2 6-2 0.16 0.0035 0.05 7.00 0.13 0.03 0.01 0.01 0.02 7.48 1 221 1.9 0.03 0.08 1371 7089 8649 0.045 2.4 113 180
CY9 6-3 6-1 0.13 0.0040 0.05 9.07 0.12 0.08 0.01 0.01 0.02 7.61 0 244 2.0 0.01 0.11 1260 5406 6711 0.039 2.0 119 180
ELW101 7-2 7-1 0.46 0.0035 0.04 12.98 0.12 0.09 0.01 0.01 0.06 7.30 3 258 4.0 0.43 0.26 2098 12644 15473 0.100 2.5 249 187
ELW102 7-3 7-3 0.44 0.0030 0.08 8.68 0.12 0.02 0.01 0.01 0.02 7.29 1 264 5.4 1.09 0.24 2533 16706 20282 0.141 2.6 343 187
ELW103 7-4 7-1 0.43 0.0035 0.04 10.70 0.11 0.01 0.01 0.01 0.04 7.38 4 236 4.2 1.21 0.15 2431 12908 15674 0.103 2.5 261 187
ELW104 7-5 7-1 0.30 0.0035 0.05 8.58 0.12 0.01 0.01 0.01 0.12 7.28 3 253 4.5 1.02 0.19 2403 13678 16546 0.103 2.5 279 187
ELW105 7-1 7-1 0.39 0.0035 0.04 10.35 0.10 0.02 0.01 0.06 0.05 7.41 4 306 3.9 1.06 0.14 2286 13125 15924 0.098 2.5 242 187
ELW106 7-5 7-1 0.34 0.0035 0.04 12.85 0.08 0.01 0.01 0.01 0.02 7.35 4 255 4.2 0.99 0.19 2352 13680 16590 0.107 2.5 264 187
ELW107 7-5 7-1 0.36 0.0035 0.04 10.26 0.10 0.01 0.01 0.01 0.01 7.38 3 251 3.8 0.98 0.18 2454 13675 16502 0.101 2.5 259 187
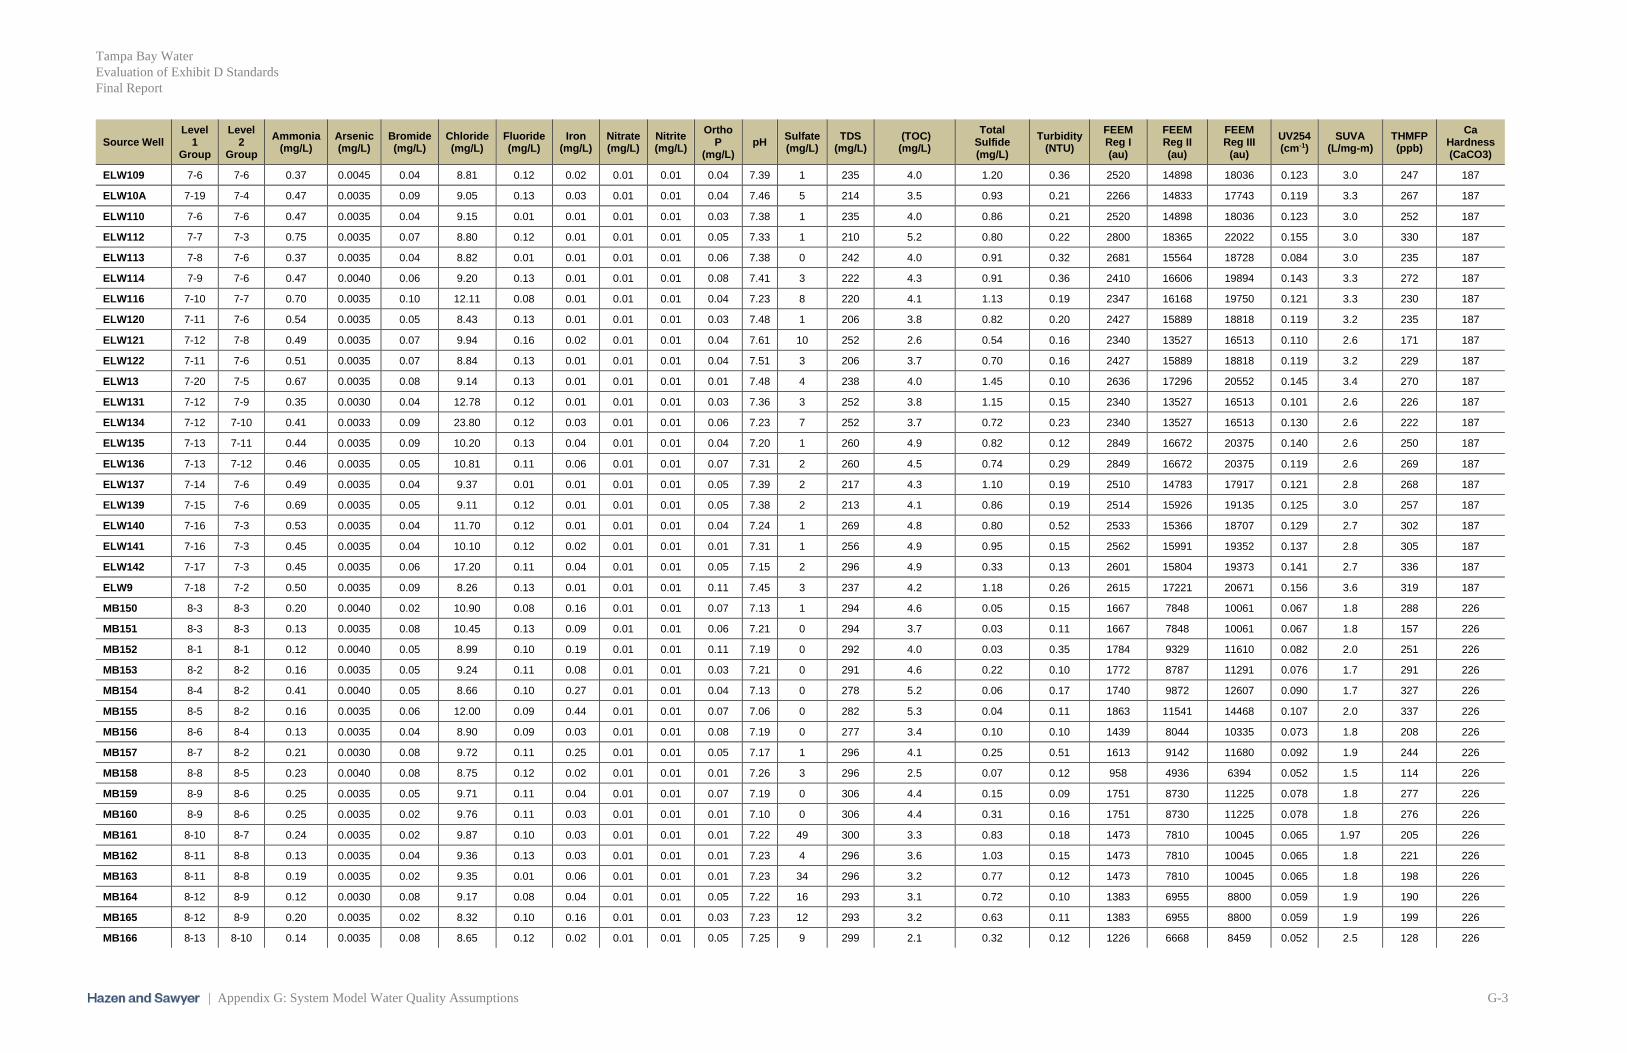
Tampa Bay Water
Evaluation of Exhibit D Standards
Final Report
| Appendix G: System Model Water Quality Assumptions G-3
Source Well Level
1 Group
Level 2
Group
Ammonia (mg/L)
Arsenic (mg/L)
Bromide (mg/L)
Chloride (mg/L)
Fluoride (mg/L)
Iron (mg/L)
Nitrate (mg/L)
Nitrite (mg/L)
Ortho P
(mg/L) pH
Sulfate (mg/L)
TDS (mg/L)
(TOC) (mg/L)
Total Sulfide (mg/L)
Turbidity (NTU)
FEEM Reg I (au)
FEEM Reg II (au)
FEEM Reg III
(au)
UV254 (cm-1)
SUVA (L/mg-m)
THMFP (ppb)
Ca Hardness (CaCO3)
ELW109 7-6 7-6 0.37 0.0045 0.04 8.81 0.12 0.02 0.01 0.01 0.04 7.39 1 235 4.0 1.20 0.36 2520 14898 18036 0.123 3.0 247 187
ELW10A 7-19 7-4 0.47 0.0035 0.09 9.05 0.13 0.03 0.01 0.01 0.04 7.46 5 214 3.5 0.93 0.21 2266 14833 17743 0.119 3.3 267 187
ELW110 7-6 7-6 0.47 0.0035 0.04 9.15 0.01 0.01 0.01 0.01 0.03 7.38 1 235 4.0 0.86 0.21 2520 14898 18036 0.123 3.0 252 187
ELW112 7-7 7-3 0.75 0.0035 0.07 8.80 0.12 0.01 0.01 0.01 0.05 7.33 1 210 5.2 0.80 0.22 2800 18365 22022 0.155 3.0 330 187
ELW113 7-8 7-6 0.37 0.0035 0.04 8.82 0.01 0.01 0.01 0.01 0.06 7.38 0 242 4.0 0.91 0.32 2681 15564 18728 0.084 3.0 235 187
ELW114 7-9 7-6 0.47 0.0040 0.06 9.20 0.13 0.01 0.01 0.01 0.08 7.41 3 222 4.3 0.91 0.36 2410 16606 19894 0.143 3.3 272 187
ELW116 7-10 7-7 0.70 0.0035 0.10 12.11 0.08 0.01 0.01 0.01 0.04 7.23 8 220 4.1 1.13 0.19 2347 16168 19750 0.121 3.3 230 187
ELW120 7-11 7-6 0.54 0.0035 0.05 8.43 0.13 0.01 0.01 0.01 0.03 7.48 1 206 3.8 0.82 0.20 2427 15889 18818 0.119 3.2 235 187
ELW121 7-12 7-8 0.49 0.0035 0.07 9.94 0.16 0.02 0.01 0.01 0.04 7.61 10 252 2.6 0.54 0.16 2340 13527 16513 0.110 2.6 171 187
ELW122 7-11 7-6 0.51 0.0035 0.07 8.84 0.13 0.01 0.01 0.01 0.04 7.51 3 206 3.7 0.70 0.16 2427 15889 18818 0.119 3.2 229 187
ELW13 7-20 7-5 0.67 0.0035 0.08 9.14 0.13 0.01 0.01 0.01 0.01 7.48 4 238 4.0 1.45 0.10 2636 17296 20552 0.145 3.4 270 187
ELW131 7-12 7-9 0.35 0.0030 0.04 12.78 0.12 0.01 0.01 0.01 0.03 7.36 3 252 3.8 1.15 0.15 2340 13527 16513 0.101 2.6 226 187
ELW134 7-12 7-10 0.41 0.0033 0.09 23.80 0.12 0.03 0.01 0.01 0.06 7.23 7 252 3.7 0.72 0.23 2340 13527 16513 0.130 2.6 222 187
ELW135 7-13 7-11 0.44 0.0035 0.09 10.20 0.13 0.04 0.01 0.01 0.04 7.20 1 260 4.9 0.82 0.12 2849 16672 20375 0.140 2.6 250 187
ELW136 7-13 7-12 0.46 0.0035 0.05 10.81 0.11 0.06 0.01 0.01 0.07 7.31 2 260 4.5 0.74 0.29 2849 16672 20375 0.119 2.6 269 187
ELW137 7-14 7-6 0.49 0.0035 0.04 9.37 0.01 0.01 0.01 0.01 0.05 7.39 2 217 4.3 1.10 0.19 2510 14783 17917 0.121 2.8 268 187
ELW139 7-15 7-6 0.69 0.0035 0.05 9.11 0.12 0.01 0.01 0.01 0.05 7.38 2 213 4.1 0.86 0.19 2514 15926 19135 0.125 3.0 257 187
ELW140 7-16 7-3 0.53 0.0035 0.04 11.70 0.12 0.01 0.01 0.01 0.04 7.24 1 269 4.8 0.80 0.52 2533 15366 18707 0.129 2.7 302 187
ELW141 7-16 7-3 0.45 0.0035 0.04 10.10 0.12 0.02 0.01 0.01 0.01 7.31 1 256 4.9 0.95 0.15 2562 15991 19352 0.137 2.8 305 187
ELW142 7-17 7-3 0.45 0.0035 0.06 17.20 0.11 0.04 0.01 0.01 0.05 7.15 2 296 4.9 0.33 0.13 2601 15804 19373 0.141 2.7 336 187
ELW9 7-18 7-2 0.50 0.0035 0.09 8.26 0.13 0.01 0.01 0.01 0.11 7.45 3 237 4.2 1.18 0.26 2615 17221 20671 0.156 3.6 319 187
MB150 8-3 8-3 0.20 0.0040 0.02 10.90 0.08 0.16 0.01 0.01 0.07 7.13 1 294 4.6 0.05 0.15 1667 7848 10061 0.067 1.8 288 226
MB151 8-3 8-3 0.13 0.0035 0.08 10.45 0.13 0.09 0.01 0.01 0.06 7.21 0 294 3.7 0.03 0.11 1667 7848 10061 0.067 1.8 157 226
MB152 8-1 8-1 0.12 0.0040 0.05 8.99 0.10 0.19 0.01 0.01 0.11 7.19 0 292 4.0 0.03 0.35 1784 9329 11610 0.082 2.0 251 226
MB153 8-2 8-2 0.16 0.0035 0.05 9.24 0.11 0.08 0.01 0.01 0.03 7.21 0 291 4.6 0.22 0.10 1772 8787 11291 0.076 1.7 291 226
MB154 8-4 8-2 0.41 0.0040 0.05 8.66 0.10 0.27 0.01 0.01 0.04 7.13 0 278 5.2 0.06 0.17 1740 9872 12607 0.090 1.7 327 226
MB155 8-5 8-2 0.16 0.0035 0.06 12.00 0.09 0.44 0.01 0.01 0.07 7.06 0 282 5.3 0.04 0.11 1863 11541 14468 0.107 2.0 337 226
MB156 8-6 8-4 0.13 0.0035 0.04 8.90 0.09 0.03 0.01 0.01 0.08 7.19 0 277 3.4 0.10 0.10 1439 8044 10335 0.073 1.8 208 226
MB157 8-7 8-2 0.21 0.0030 0.08 9.72 0.11 0.25 0.01 0.01 0.05 7.17 1 296 4.1 0.25 0.51 1613 9142 11680 0.092 1.9 244 226
MB158 8-8 8-5 0.23 0.0040 0.08 8.75 0.12 0.02 0.01 0.01 0.01 7.26 3 296 2.5 0.07 0.12 958 4936 6394 0.052 1.5 114 226
MB159 8-9 8-6 0.25 0.0035 0.05 9.71 0.11 0.04 0.01 0.01 0.07 7.19 0 306 4.4 0.15 0.09 1751 8730 11225 0.078 1.8 277 226
MB160 8-9 8-6 0.25 0.0035 0.02 9.76 0.11 0.03 0.01 0.01 0.01 7.10 0 306 4.4 0.31 0.16 1751 8730 11225 0.078 1.8 276 226
MB161 8-10 8-7 0.24 0.0035 0.02 9.87 0.10 0.03 0.01 0.01 0.01 7.22 49 300 3.3 0.83 0.18 1473 7810 10045 0.065 1.97 205 226
MB162 8-11 8-8 0.13 0.0035 0.04 9.36 0.13 0.03 0.01 0.01 0.01 7.23 4 296 3.6 1.03 0.15 1473 7810 10045 0.065 1.8 221 226
MB163 8-11 8-8 0.19 0.0035 0.02 9.35 0.01 0.06 0.01 0.01 0.01 7.23 34 296 3.2 0.77 0.12 1473 7810 10045 0.065 1.8 198 226
MB164 8-12 8-9 0.12 0.0030 0.08 9.17 0.08 0.04 0.01 0.01 0.05 7.22 16 293 3.1 0.72 0.10 1383 6955 8800 0.059 1.9 190 226
MB165 8-12 8-9 0.20 0.0035 0.02 8.32 0.10 0.16 0.01 0.01 0.03 7.23 12 293 3.2 0.63 0.11 1383 6955 8800 0.059 1.9 199 226
MB166 8-13 8-10 0.14 0.0035 0.08 8.65 0.12 0.02 0.01 0.01 0.05 7.25 9 299 2.1 0.32 0.12 1226 6668 8459 0.052 2.5 128 226
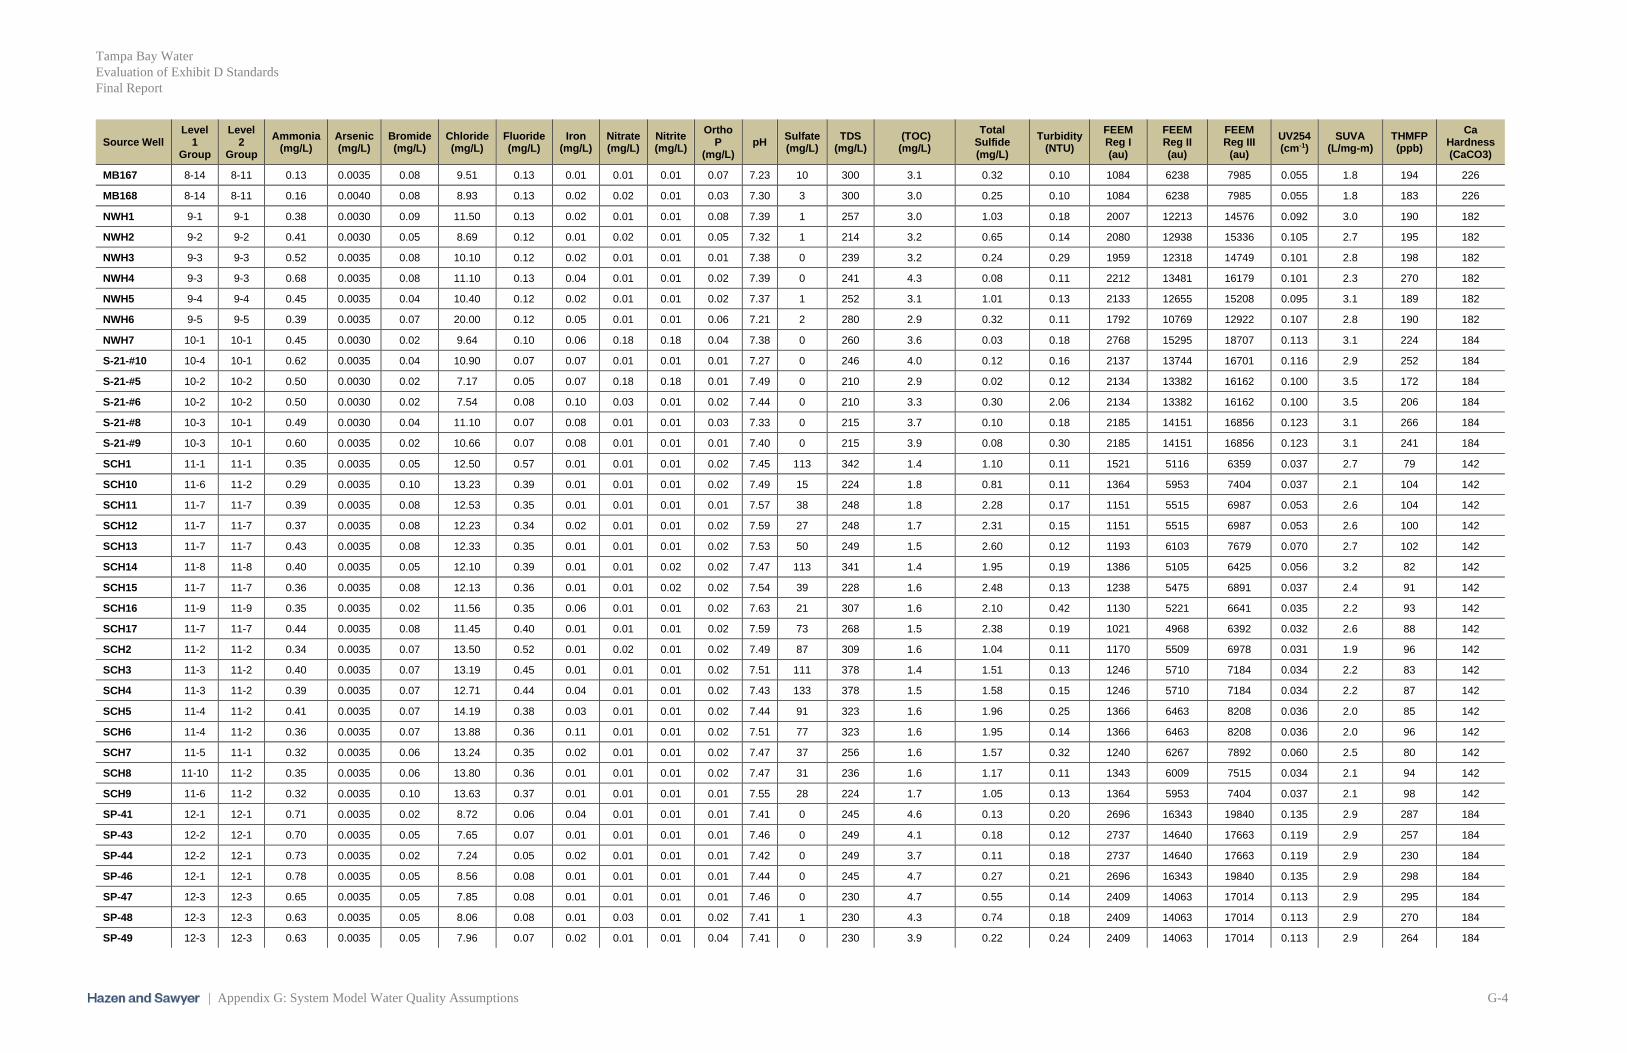
Tampa Bay Water
Evaluation of Exhibit D Standards
Final Report
| Appendix G: System Model Water Quality Assumptions G-4
Source Well Level
1 Group
Level 2
Group
Ammonia (mg/L)
Arsenic (mg/L)
Bromide (mg/L)
Chloride (mg/L)
Fluoride (mg/L)
Iron (mg/L)
Nitrate (mg/L)
Nitrite (mg/L)
Ortho P
(mg/L) pH
Sulfate (mg/L)
TDS (mg/L)
(TOC) (mg/L)
Total Sulfide (mg/L)
Turbidity (NTU)
FEEM Reg I (au)
FEEM Reg II (au)
FEEM Reg III
(au)
UV254 (cm-1)
SUVA (L/mg-m)
THMFP (ppb)
Ca Hardness (CaCO3)
MB167 8-14 8-11 0.13 0.0035 0.08 9.51 0.13 0.01 0.01 0.01 0.07 7.23 10 300 3.1 0.32 0.10 1084 6238 7985 0.055 1.8 194 226
MB168 8-14 8-11 0.16 0.0040 0.08 8.93 0.13 0.02 0.02 0.01 0.03 7.30 3 300 3.0 0.25 0.10 1084 6238 7985 0.055 1.8 183 226
NWH1 9-1 9-1 0.38 0.0030 0.09 11.50 0.13 0.02 0.01 0.01 0.08 7.39 1 257 3.0 1.03 0.18 2007 12213 14576 0.092 3.0 190 182
NWH2 9-2 9-2 0.41 0.0030 0.05 8.69 0.12 0.01 0.02 0.01 0.05 7.32 1 214 3.2 0.65 0.14 2080 12938 15336 0.105 2.7 195 182
NWH3 9-3 9-3 0.52 0.0035 0.08 10.10 0.12 0.02 0.01 0.01 0.01 7.38 0 239 3.2 0.24 0.29 1959 12318 14749 0.101 2.8 198 182
NWH4 9-3 9-3 0.68 0.0035 0.08 11.10 0.13 0.04 0.01 0.01 0.02 7.39 0 241 4.3 0.08 0.11 2212 13481 16179 0.101 2.3 270 182
NWH5 9-4 9-4 0.45 0.0035 0.04 10.40 0.12 0.02 0.01 0.01 0.02 7.37 1 252 3.1 1.01 0.13 2133 12655 15208 0.095 3.1 189 182
NWH6 9-5 9-5 0.39 0.0035 0.07 20.00 0.12 0.05 0.01 0.01 0.06 7.21 2 280 2.9 0.32 0.11 1792 10769 12922 0.107 2.8 190 182
NWH7 10-1 10-1 0.45 0.0030 0.02 9.64 0.10 0.06 0.18 0.18 0.04 7.38 0 260 3.6 0.03 0.18 2768 15295 18707 0.113 3.1 224 184
S-21-#10 10-4 10-1 0.62 0.0035 0.04 10.90 0.07 0.07 0.01 0.01 0.01 7.27 0 246 4.0 0.12 0.16 2137 13744 16701 0.116 2.9 252 184
S-21-#5 10-2 10-2 0.50 0.0030 0.02 7.17 0.05 0.07 0.18 0.18 0.01 7.49 0 210 2.9 0.02 0.12 2134 13382 16162 0.100 3.5 172 184
S-21-#6 10-2 10-2 0.50 0.0030 0.02 7.54 0.08 0.10 0.03 0.01 0.02 7.44 0 210 3.3 0.30 2.06 2134 13382 16162 0.100 3.5 206 184
S-21-#8 10-3 10-1 0.49 0.0030 0.04 11.10 0.07 0.08 0.01 0.01 0.03 7.33 0 215 3.7 0.10 0.18 2185 14151 16856 0.123 3.1 266 184
S-21-#9 10-3 10-1 0.60 0.0035 0.02 10.66 0.07 0.08 0.01 0.01 0.01 7.40 0 215 3.9 0.08 0.30 2185 14151 16856 0.123 3.1 241 184
SCH1 11-1 11-1 0.35 0.0035 0.05 12.50 0.57 0.01 0.01 0.01 0.02 7.45 113 342 1.4 1.10 0.11 1521 5116 6359 0.037 2.7 79 142
SCH10 11-6 11-2 0.29 0.0035 0.10 13.23 0.39 0.01 0.01 0.01 0.02 7.49 15 224 1.8 0.81 0.11 1364 5953 7404 0.037 2.1 104 142
SCH11 11-7 11-7 0.39 0.0035 0.08 12.53 0.35 0.01 0.01 0.01 0.01 7.57 38 248 1.8 2.28 0.17 1151 5515 6987 0.053 2.6 104 142
SCH12 11-7 11-7 0.37 0.0035 0.08 12.23 0.34 0.02 0.01 0.01 0.02 7.59 27 248 1.7 2.31 0.15 1151 5515 6987 0.053 2.6 100 142
SCH13 11-7 11-7 0.43 0.0035 0.08 12.33 0.35 0.01 0.01 0.01 0.02 7.53 50 249 1.5 2.60 0.12 1193 6103 7679 0.070 2.7 102 142
SCH14 11-8 11-8 0.40 0.0035 0.05 12.10 0.39 0.01 0.01 0.02 0.02 7.47 113 341 1.4 1.95 0.19 1386 5105 6425 0.056 3.2 82 142
SCH15 11-7 11-7 0.36 0.0035 0.08 12.13 0.36 0.01 0.01 0.02 0.02 7.54 39 228 1.6 2.48 0.13 1238 5475 6891 0.037 2.4 91 142
SCH16 11-9 11-9 0.35 0.0035 0.02 11.56 0.35 0.06 0.01 0.01 0.02 7.63 21 307 1.6 2.10 0.42 1130 5221 6641 0.035 2.2 93 142
SCH17 11-7 11-7 0.44 0.0035 0.08 11.45 0.40 0.01 0.01 0.01 0.02 7.59 73 268 1.5 2.38 0.19 1021 4968 6392 0.032 2.6 88 142
SCH2 11-2 11-2 0.34 0.0035 0.07 13.50 0.52 0.01 0.02 0.01 0.02 7.49 87 309 1.6 1.04 0.11 1170 5509 6978 0.031 1.9 96 142
SCH3 11-3 11-2 0.40 0.0035 0.07 13.19 0.45 0.01 0.01 0.01 0.02 7.51 111 378 1.4 1.51 0.13 1246 5710 7184 0.034 2.2 83 142
SCH4 11-3 11-2 0.39 0.0035 0.07 12.71 0.44 0.04 0.01 0.01 0.02 7.43 133 378 1.5 1.58 0.15 1246 5710 7184 0.034 2.2 87 142
SCH5 11-4 11-2 0.41 0.0035 0.07 14.19 0.38 0.03 0.01 0.01 0.02 7.44 91 323 1.6 1.96 0.25 1366 6463 8208 0.036 2.0 85 142
SCH6 11-4 11-2 0.36 0.0035 0.07 13.88 0.36 0.11 0.01 0.01 0.02 7.51 77 323 1.6 1.95 0.14 1366 6463 8208 0.036 2.0 96 142
SCH7 11-5 11-1 0.32 0.0035 0.06 13.24 0.35 0.02 0.01 0.01 0.02 7.47 37 256 1.6 1.57 0.32 1240 6267 7892 0.060 2.5 80 142
SCH8 11-10 11-2 0.35 0.0035 0.06 13.80 0.36 0.01 0.01 0.01 0.02 7.47 31 236 1.6 1.17 0.11 1343 6009 7515 0.034 2.1 94 142
SCH9 11-6 11-2 0.32 0.0035 0.10 13.63 0.37 0.01 0.01 0.01 0.01 7.55 28 224 1.7 1.05 0.13 1364 5953 7404 0.037 2.1 98 142
SP-41 12-1 12-1 0.71 0.0035 0.02 8.72 0.06 0.04 0.01 0.01 0.01 7.41 0 245 4.6 0.13 0.20 2696 16343 19840 0.135 2.9 287 184
SP-43 12-2 12-1 0.70 0.0035 0.05 7.65 0.07 0.01 0.01 0.01 0.01 7.46 0 249 4.1 0.18 0.12 2737 14640 17663 0.119 2.9 257 184
SP-44 12-2 12-1 0.73 0.0035 0.02 7.24 0.05 0.02 0.01 0.01 0.01 7.42 0 249 3.7 0.11 0.18 2737 14640 17663 0.119 2.9 230 184
SP-46 12-1 12-1 0.78 0.0035 0.05 8.56 0.08 0.01 0.01 0.01 0.01 7.44 0 245 4.7 0.27 0.21 2696 16343 19840 0.135 2.9 298 184
SP-47 12-3 12-3 0.65 0.0035 0.05 7.85 0.08 0.01 0.01 0.01 0.01 7.46 0 230 4.7 0.55 0.14 2409 14063 17014 0.113 2.9 295 184
SP-48 12-3 12-3 0.63 0.0035 0.05 8.06 0.08 0.01 0.03 0.01 0.02 7.41 1 230 4.3 0.74 0.18 2409 14063 17014 0.113 2.9 270 184
SP-49 12-3 12-3 0.63 0.0035 0.05 7.96 0.07 0.02 0.01 0.01 0.04 7.41 0 230 3.9 0.22 0.24 2409 14063 17014 0.113 2.9 264 184
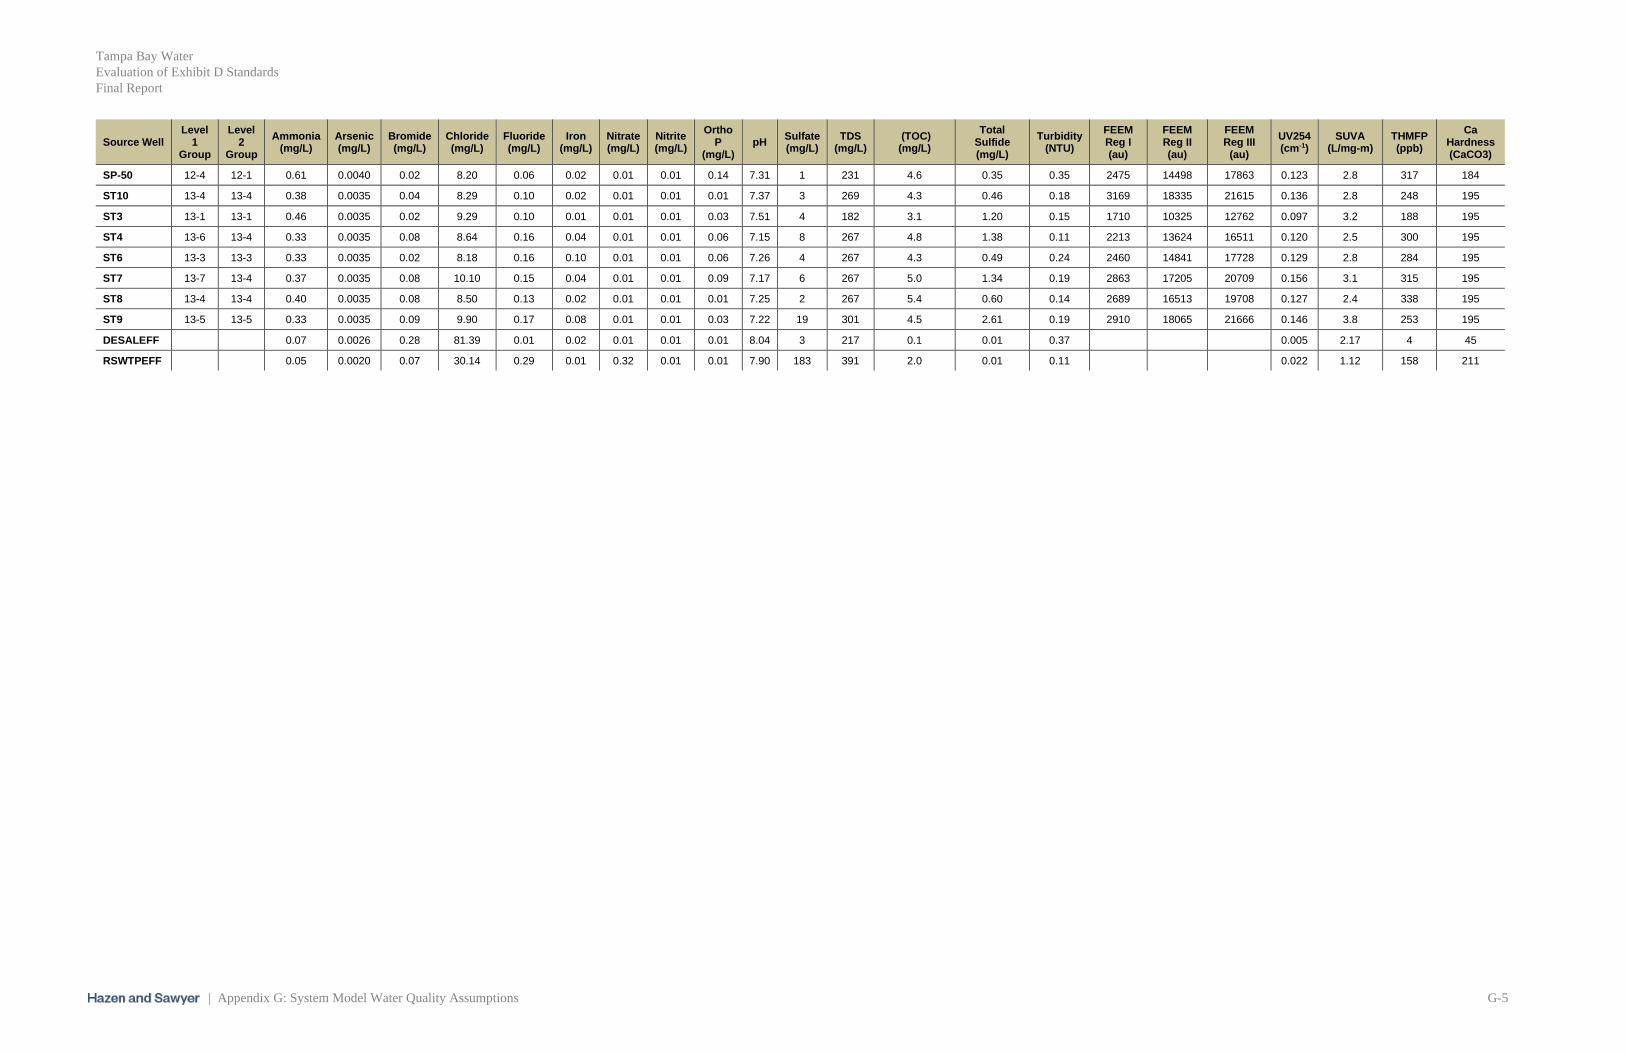
Tampa Bay Water
Evaluation of Exhibit D Standards
Final Report
| Appendix G: System Model Water Quality Assumptions G-5
Source Well Level
1 Group
Level 2
Group
Ammonia (mg/L)
Arsenic (mg/L)
Bromide (mg/L)
Chloride (mg/L)
Fluoride (mg/L)
Iron (mg/L)
Nitrate (mg/L)
Nitrite (mg/L)
Ortho P
(mg/L) pH
Sulfate (mg/L)
TDS (mg/L)
(TOC) (mg/L)
Total Sulfide (mg/L)
Turbidity (NTU)
FEEM Reg I (au)
FEEM Reg II (au)
FEEM Reg III
(au)
UV254 (cm-1)
SUVA (L/mg-m)
THMFP (ppb)
Ca Hardness (CaCO3)
SP-50 12-4 12-1 0.61 0.0040 0.02 8.20 0.06 0.02 0.01 0.01 0.14 7.31 1 231 4.6 0.35 0.35 2475 14498 17863 0.123 2.8 317 184
ST10 13-4 13-4 0.38 0.0035 0.04 8.29 0.10 0.02 0.01 0.01 0.01 7.37 3 269 4.3 0.46 0.18 3169 18335 21615 0.136 2.8 248 195
ST3 13-1 13-1 0.46 0.0035 0.02 9.29 0.10 0.01 0.01 0.01 0.03 7.51 4 182 3.1 1.20 0.15 1710 10325 12762 0.097 3.2 188 195
ST4 13-6 13-4 0.33 0.0035 0.08 8.64 0.16 0.04 0.01 0.01 0.06 7.15 8 267 4.8 1.38 0.11 2213 13624 16511 0.120 2.5 300 195
ST6 13-3 13-3 0.33 0.0035 0.02 8.18 0.16 0.10 0.01 0.01 0.06 7.26 4 267 4.3 0.49 0.24 2460 14841 17728 0.129 2.8 284 195
ST7 13-7 13-4 0.37 0.0035 0.08 10.10 0.15 0.04 0.01 0.01 0.09 7.17 6 267 5.0 1.34 0.19 2863 17205 20709 0.156 3.1 315 195
ST8 13-4 13-4 0.40 0.0035 0.08 8.50 0.13 0.02 0.01 0.01 0.01 7.25 2 267 5.4 0.60 0.14 2689 16513 19708 0.127 2.4 338 195
ST9 13-5 13-5 0.33 0.0035 0.09 9.90 0.17 0.08 0.01 0.01 0.03 7.22 19 301 4.5 2.61 0.19 2910 18065 21666 0.146 3.8 253 195
DESALEFF 0.07 0.0026 0.28 81.39 0.01 0.02 0.01 0.01 0.01 8.04 3 217 0.1 0.01 0.37 0.005 2.17 4 45
RSWTPEFF 0.05 0.0020 0.07 30.14 0.29 0.01 0.32 0.01 0.01 7.90 183 391 2.0 0.01 0.11 0.022 1.12 158 211

Tampa Bay Water
Evaluation of Exhibit D Standards
Final Report
| Appendix H: Water Supply Contract H-1
Appendix H: Water Supply Contract


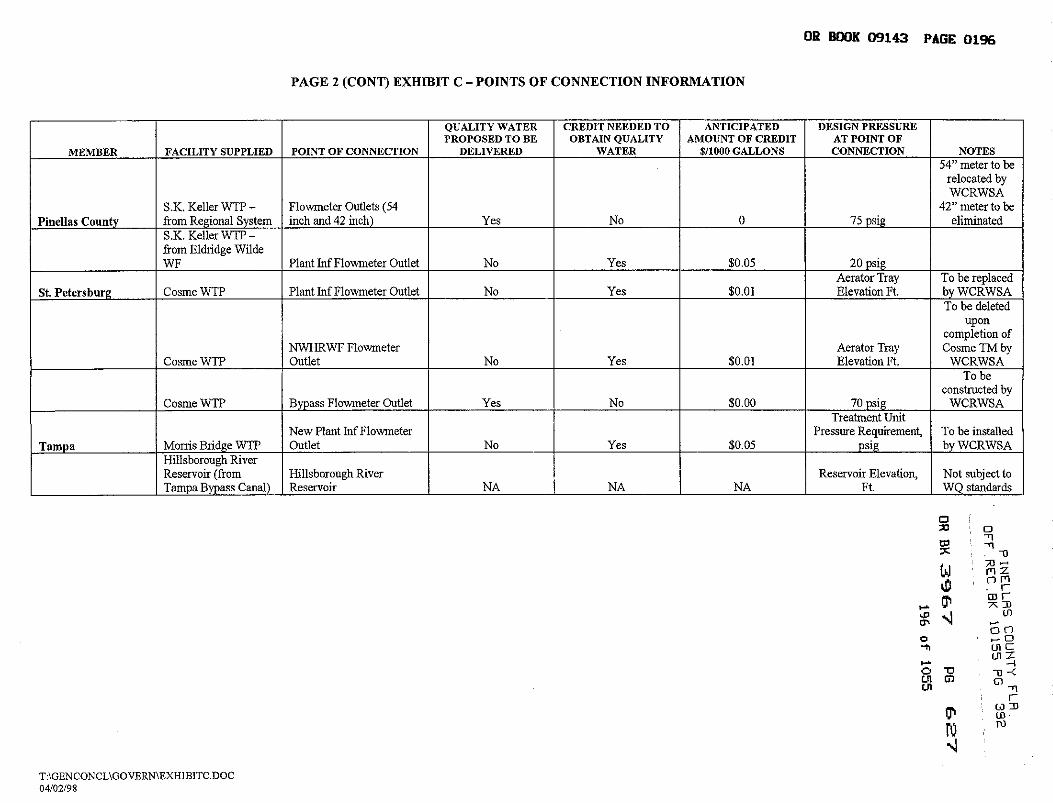
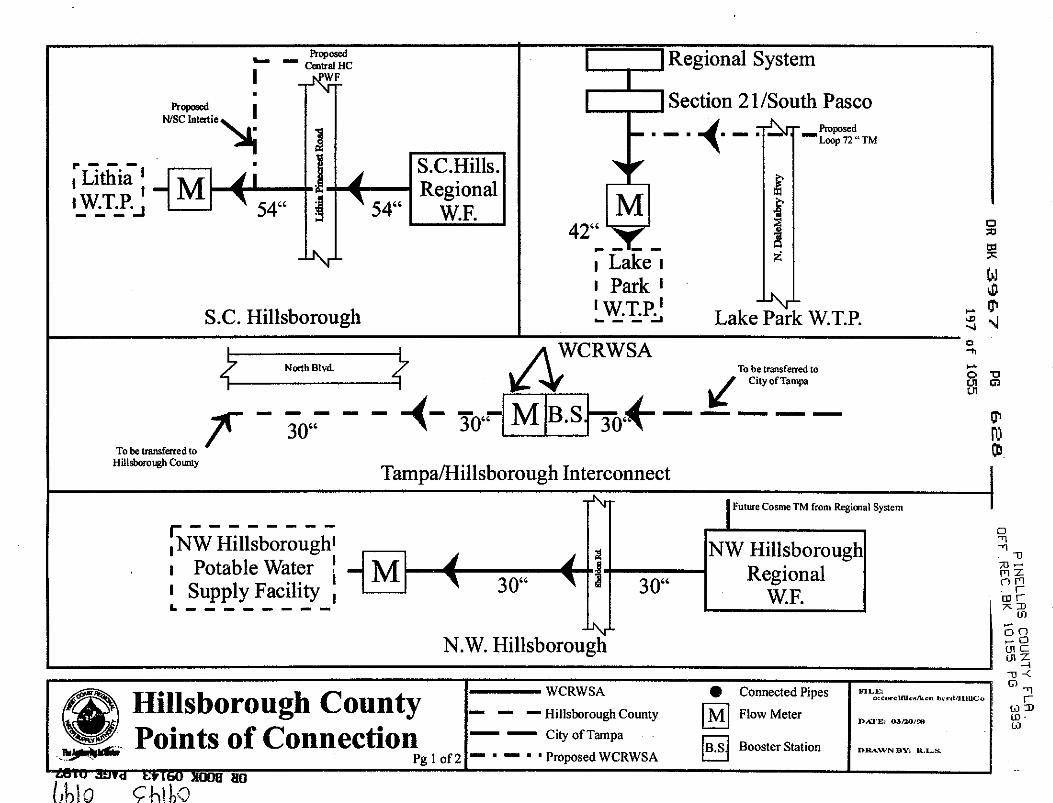

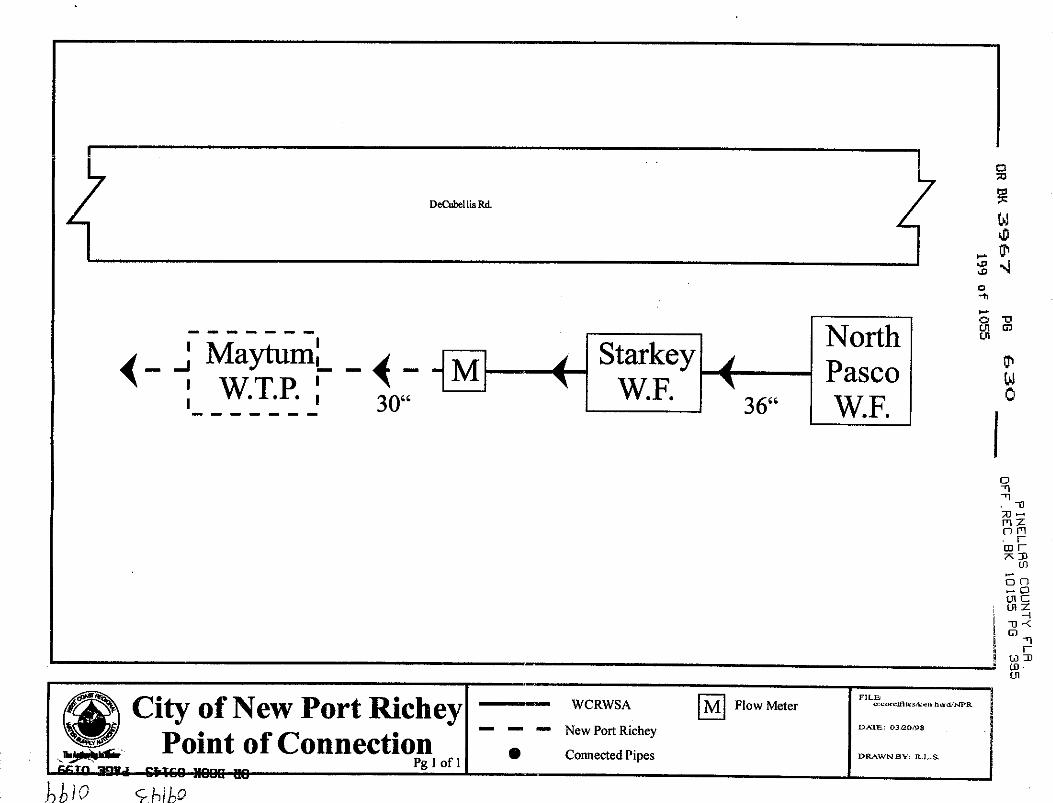
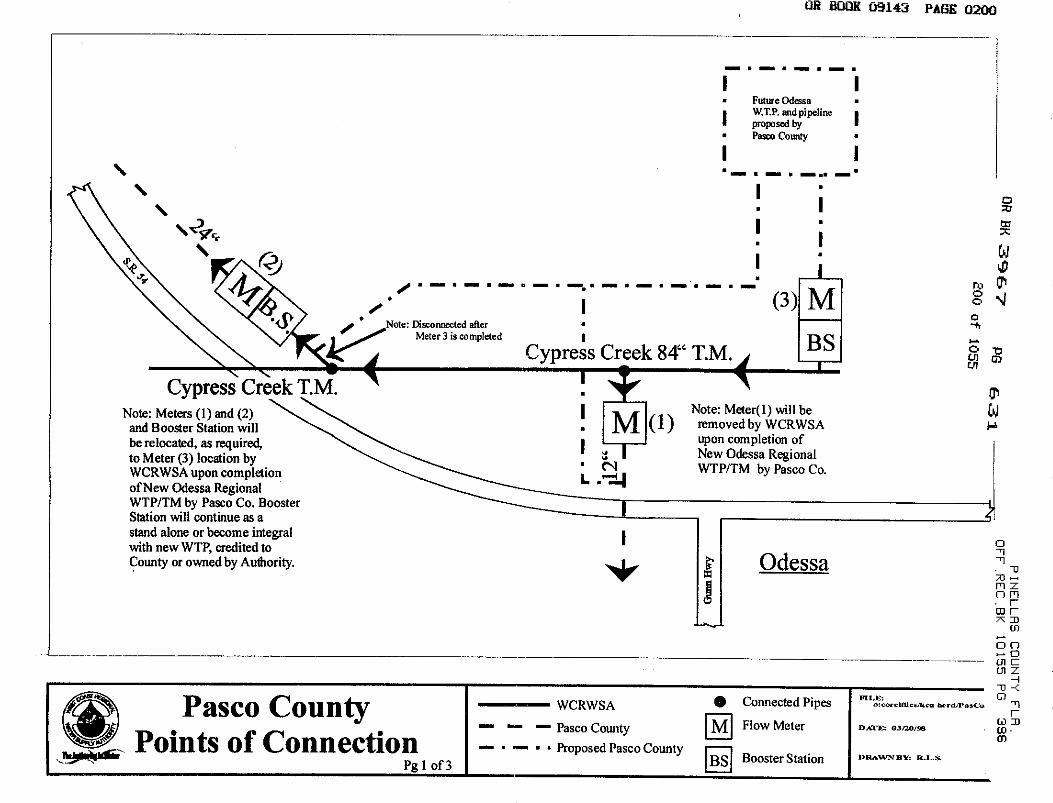
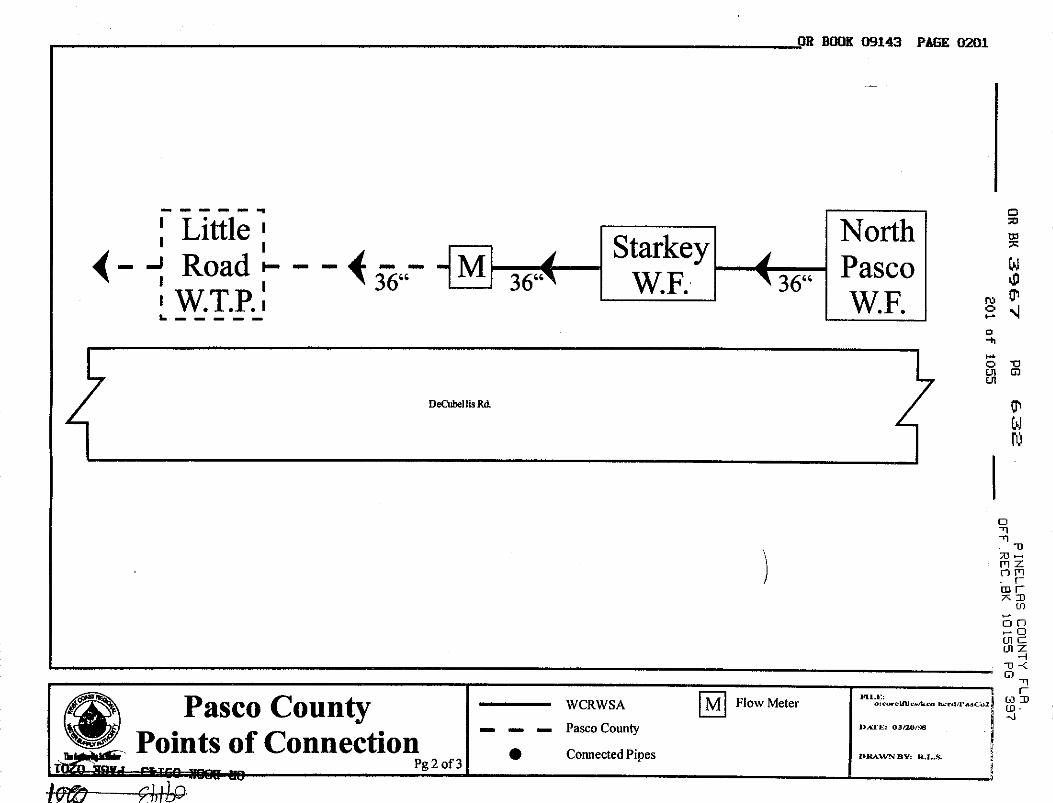
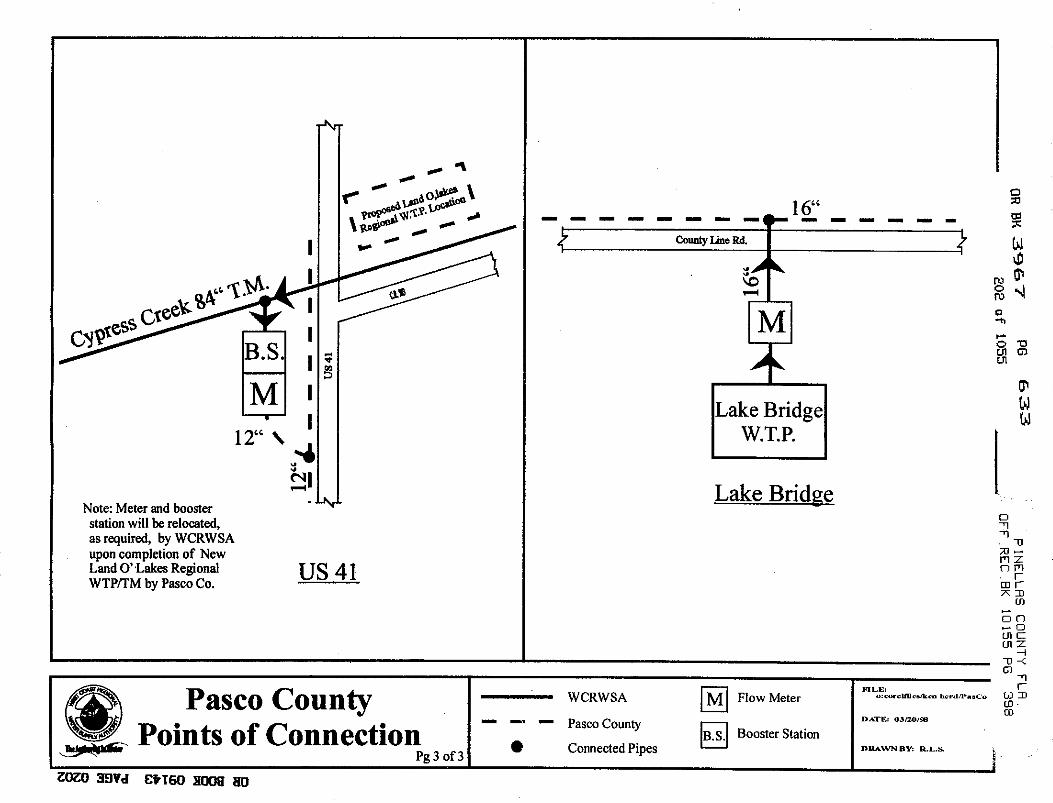
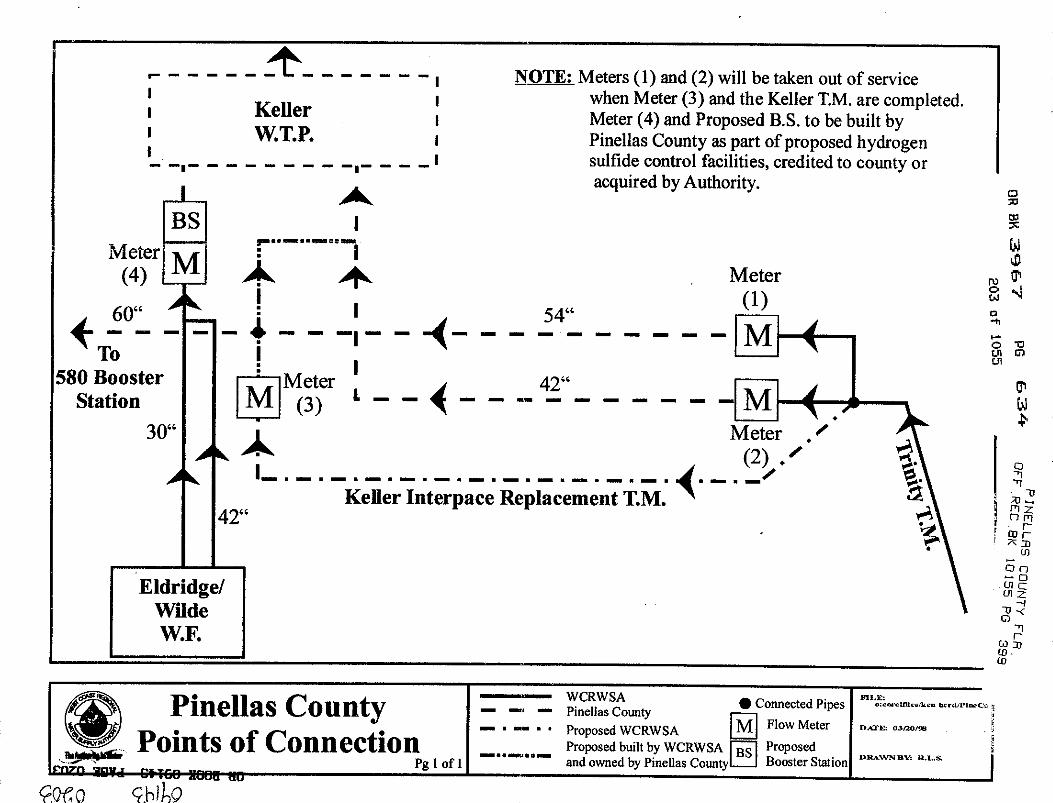
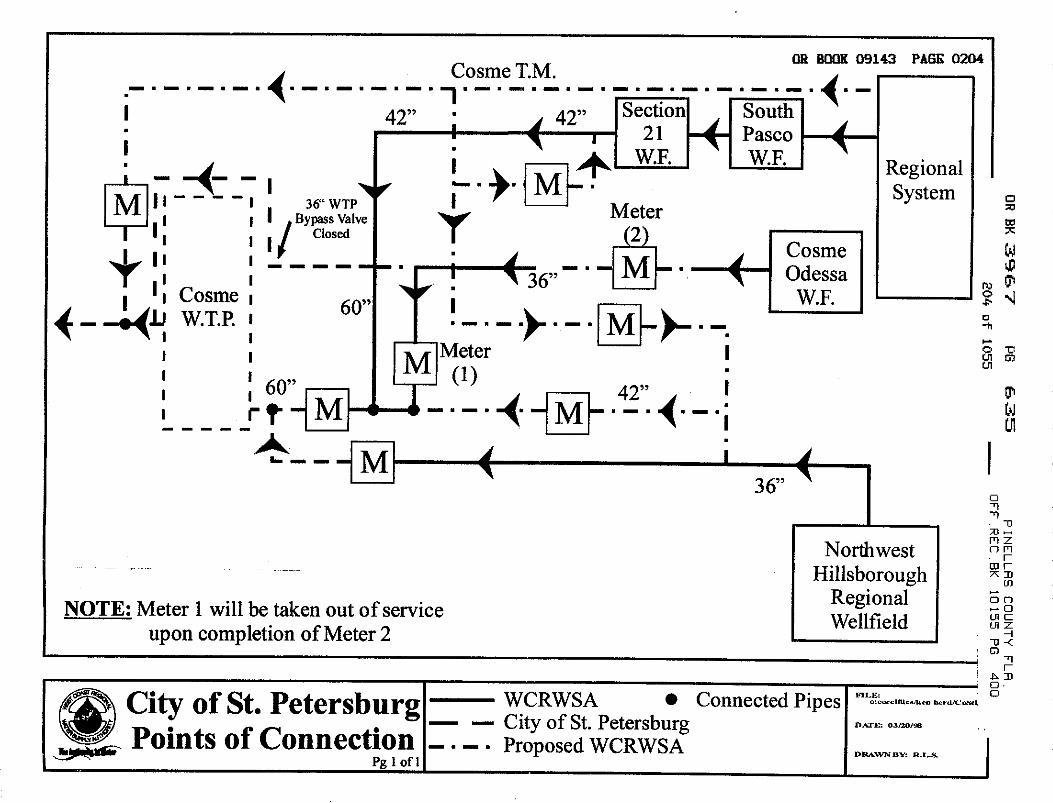
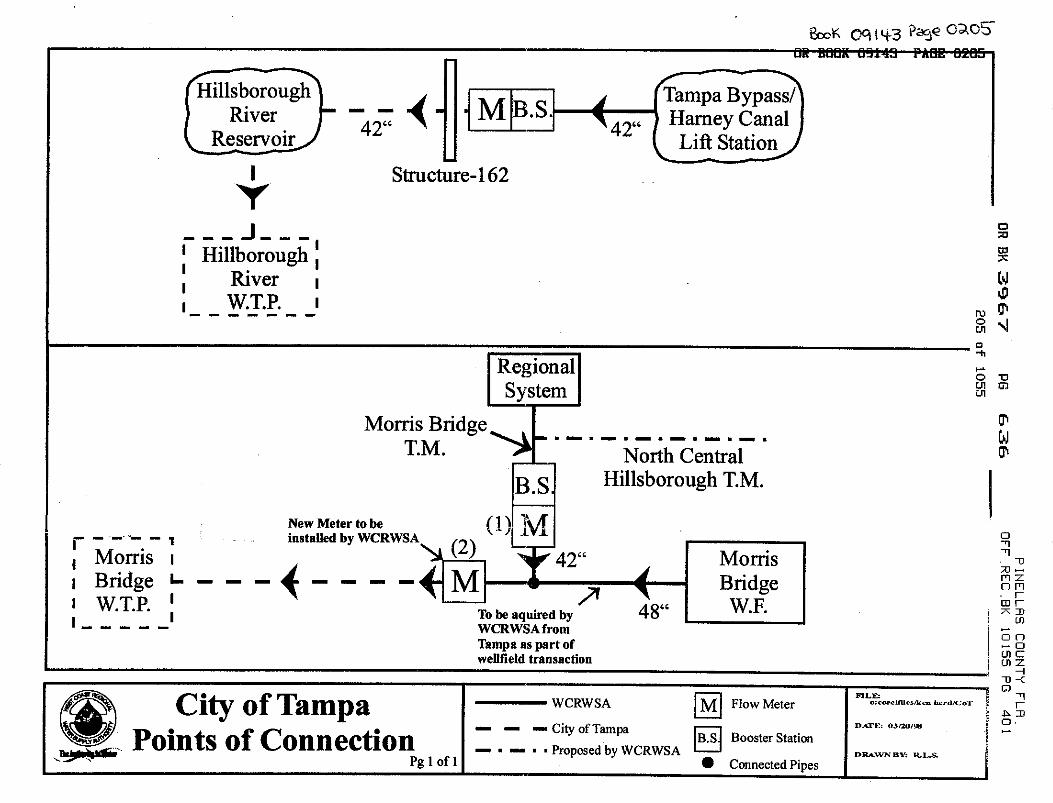
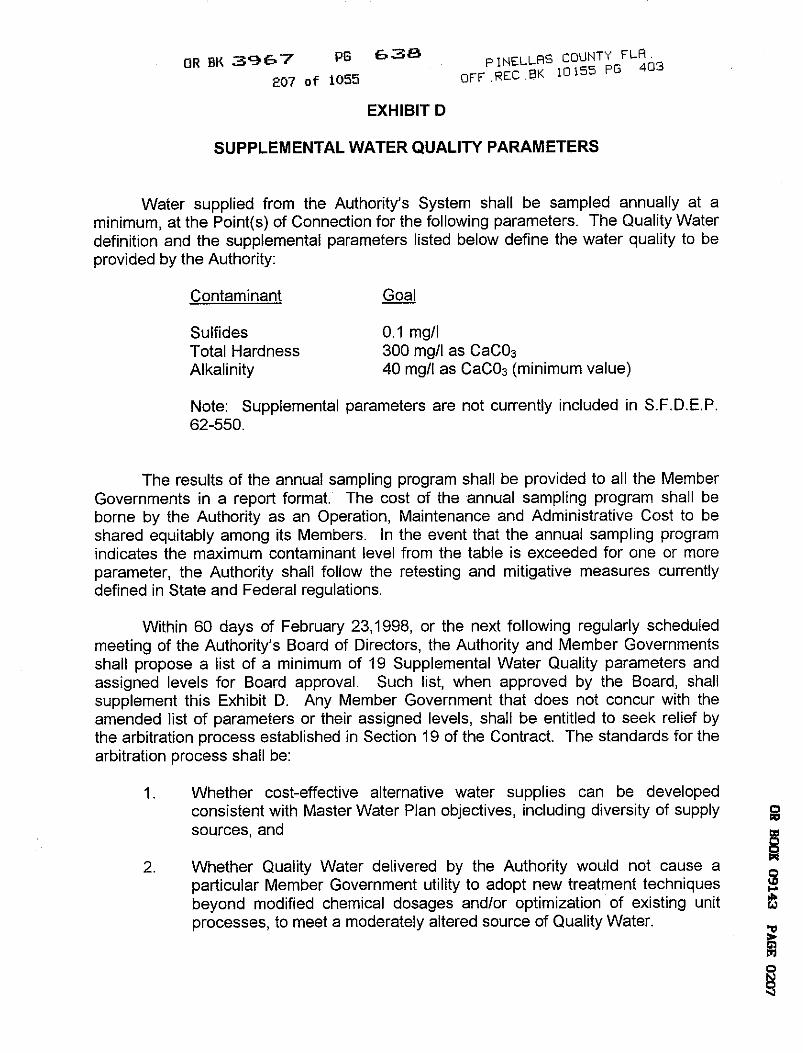

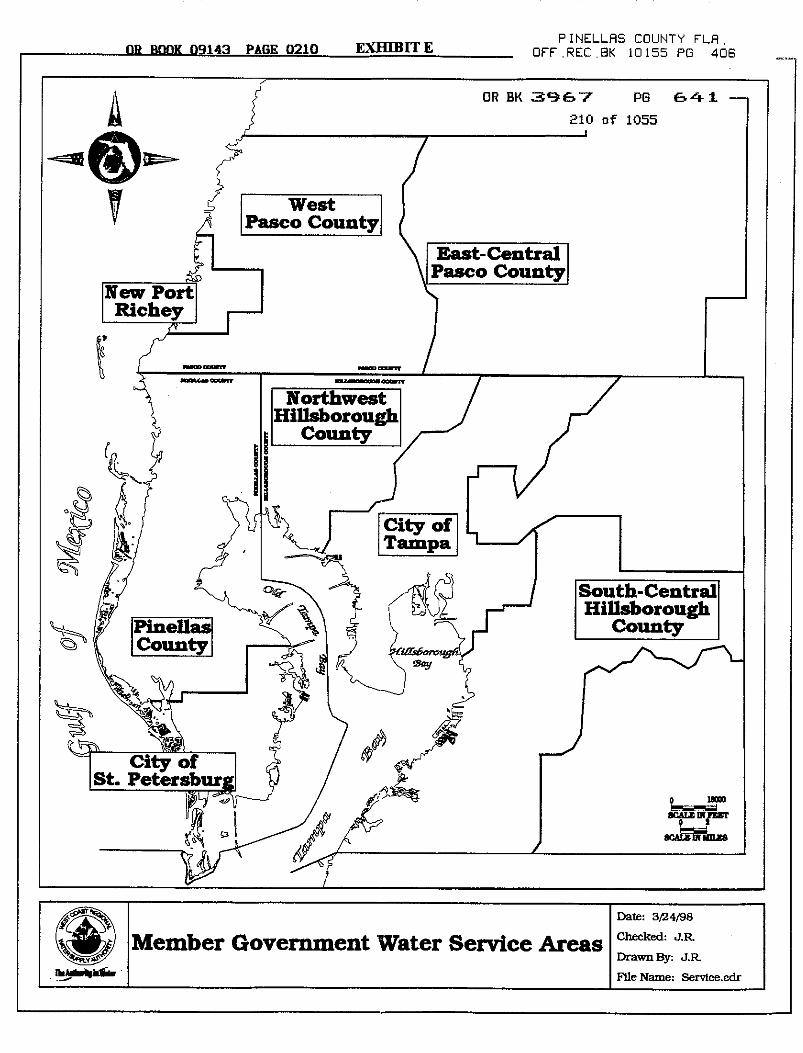
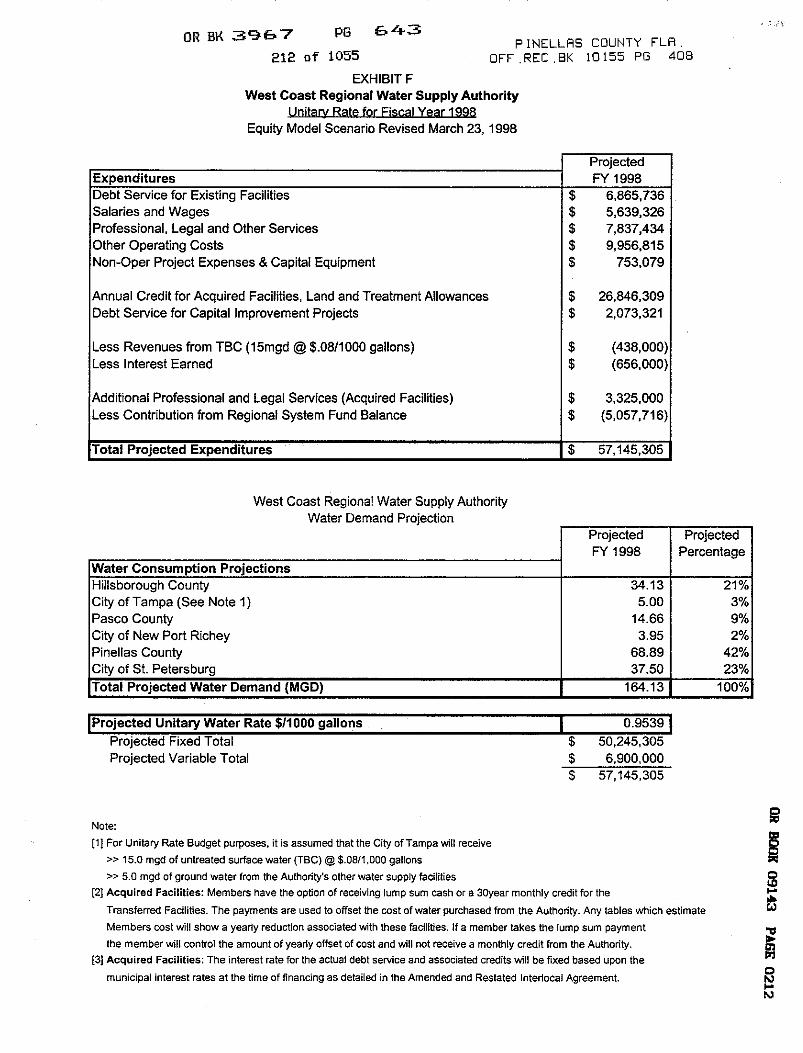


Tampa Bay Water
Evaluation of Exhibit D Standards
Final Report
| Appendix I: Summary of Study Water Quality Results I-1
Appendix I: Summary of Study Water Quality Results

Tampa Bay Water Evaluation of Exhibit D Standards Final Report
Level Analyte Date Final Unit Qualifier Type Sample Name MDL Result Group
Level-1 Bromide 12/26/2018 mg/L I Source Well MB153 0.02 0.05 8-2
Level-1 Bromide 12/26/2018 mg/L I Source Well MB154 0.02 0.05 8-2
Level-1 Bromide 12/26/2018 mg/L I Source Well MB159 0.02 0.05 8-6
Level-1 Fluoride 12/26/2018 mg/L I Source Well CB8 0.01 0.052 2-1
Level-1 Fluoride 12/26/2018 mg/L I Source Well CB9 0.01 0.059 2-1
Level-1 Bromide 12/26/2018 mg/L I Source Well CB9 0.02 0.071 2-1
Level-1 Bromide 12/26/2018 mg/L I Source Well MB158 0.02 0.074 8-5
Level-1 Bromide 12/26/2018 mg/L I Source Well MB169 0.02 0.075 8-0
Level-1 Bromide 12/26/2018 mg/L I Source Well ST4 0.02 0.075 13-4
Level-1 Bromide 12/26/2018 mg/L I Source Well ST8 0.02 0.075 13-4
Level-1 Bromide 12/26/2018 mg/L I Source Well MB167 0.02 0.076 8-11
Level-1 Bromide 12/26/2018 mg/L I Source Well MB157 0.02 0.078 8-2
Level-1 Bromide 12/26/2018 mg/L I Source Well MB151 0.02 0.079 8-3
Level-1 Bromide 12/26/2018 mg/L I Source Well ST7 0.02 0.08 13-4
Level-1 Bromide 12/26/2018 mg/L I Source Well ELW102 0.02 0.081 7-3
Level-1 Bromide 12/26/2018 mg/L I Source Well ELW135 0.02 0.086 7-11
Level-1 Fluoride 12/26/2018 mg/L I Source Well MB154 0.01 0.1 8-2
Level-1 Fluoride 12/26/2018 mg/L I Source Well MB157 0.01 0.109 8-2
Level-1 Fluoride 12/26/2018 mg/L I Source Well MB153 0.01 0.11 8-2
Level-1 Fluoride 12/26/2018 mg/L I Source Well MB159 0.01 0.11 8-6
Level-1 Fluoride 12/26/2018 mg/L I Source Well ELW102 0.01 0.118 7-3
Level-1 Fluoride 12/26/2018 mg/L I Source Well MB158 0.01 0.12 8-5
Level-1 Fluoride 12/26/2018 mg/L I Source Well ELW135 0.01 0.125 7-11
Level-1 Fluoride 12/26/2018 mg/L I Source Well MB151 0.01 0.125 8-3
Level-1 Fluoride 12/26/2018 mg/L I Source Well MB169 0.01 0.126 8-0
Level-1 Fluoride 12/26/2018 mg/L I Source Well ST8 0.01 0.131 13-4
Level-1 Fluoride 12/26/2018 mg/L I Source Well MB167 0.01 0.135 8-11
Level-1 Fluoride 12/26/2018 mg/L I Source Well ST7 0.01 0.15 13-4
Level-1 Sulfate 12/26/2018 mg/L I Source Well MB154 0.06 0.15 8-2
Level-1 Fluoride 12/26/2018 mg/L I Source Well ST4 0.01 0.161 13-4
Level-1 Sulfate 12/26/2018 mg/L I Source Well MB153 0.06 0.18 8-2
Level-1 Sulfate 12/26/2018 mg/L I Source Well CB9 0.06 0.258 2-1
Level-1 Sulfate 12/26/2018 mg/L I Source Well MB151 0.06 0.261 8-3
Level-1 Sulfate 12/26/2018 mg/L I Source Well CB8 0.06 0.265 2-1
Level-1 Sulfate 12/26/2018 mg/L I Source Well MB159 0.06 0.35 8-6
Level-1 Sulfate 12/26/2018 mg/L Source Well ELW135 0.06 1.01 7-11
Level-1 Sulfate 12/26/2018 mg/L Source Well MB157 0.06 1.18 8-2
Level-1 Sulfate 12/26/2018 mg/L Source Well ELW102 0.06 1.43 7-3
Level-1 Sulfate 12/26/2018 mg/L Source Well MB169 0.06 1.72 8-0
Level-1 Chloride 12/26/2018 mg/L Source Well ST7 0.04 10.1 13-4
Level-1 Chloride 12/26/2018 mg/L Source Well ELW135 0.04 10.2 7-11
Level-1 Chloride 12/26/2018 mg/L Source Well MB151 0.04 10.5 8-3
Level-1 Sulfate 12/26/2018 mg/L Source Well MB167 0.06 11.1 8-11
Level-1 Sulfate 12/26/2018 mg/L Source Well ST8 0.06 2.29 13-4
Level-1Total Organic Carbon
(TOC)12/26/2018 mg/L Source Well CB9 0.09 2.77 2-1
Level-1Total Organic Carbon
(TOC)12/26/2018 mg/L Source Well MB158 0.09 2.94 8-5
Level-1Total Organic Carbon
(TOC)12/26/2018 mg/L Source Well CB8 0.09 2.98 2-1
Level-1 Temperature 12/26/2018 oC Source Well MB154 0.1 24 8-2
Level-1 Temperature 12/26/2018 oC Source Well MB157 0.1 24 8-2
Level-1 Temperature 12/26/2018 oC Source Well MB167 0.1 24.2 8-11
Level-1 Temperature 12/26/2018 oC Source Well MB169 0.1 24.3 8-0
Level-1 Temperature 12/26/2018 oC Source Well MB153 0.1 24.7 8-2
Level-1 Temperature 12/26/2018 oC Source Well MB159 0.1 24.7 8-6
Level-1 Temperature 12/26/2018 oC Source Well MB158 0.1 24.9 8-5
Level-1 Temperature 12/26/2018 oC Source Well MB151 0.1 25.1 8-3
Level-1 Temperature 12/26/2018 oC Source Well ST8 0.1 25.5 13-4
Level-1 TDS 12/26/2018 mg/L Source Well ST4 10 267 13-4
Level-1 TDS 12/26/2018 mg/L Source Well ST8 10 267 13-4
Appendix I: Water Supply Contract I-2
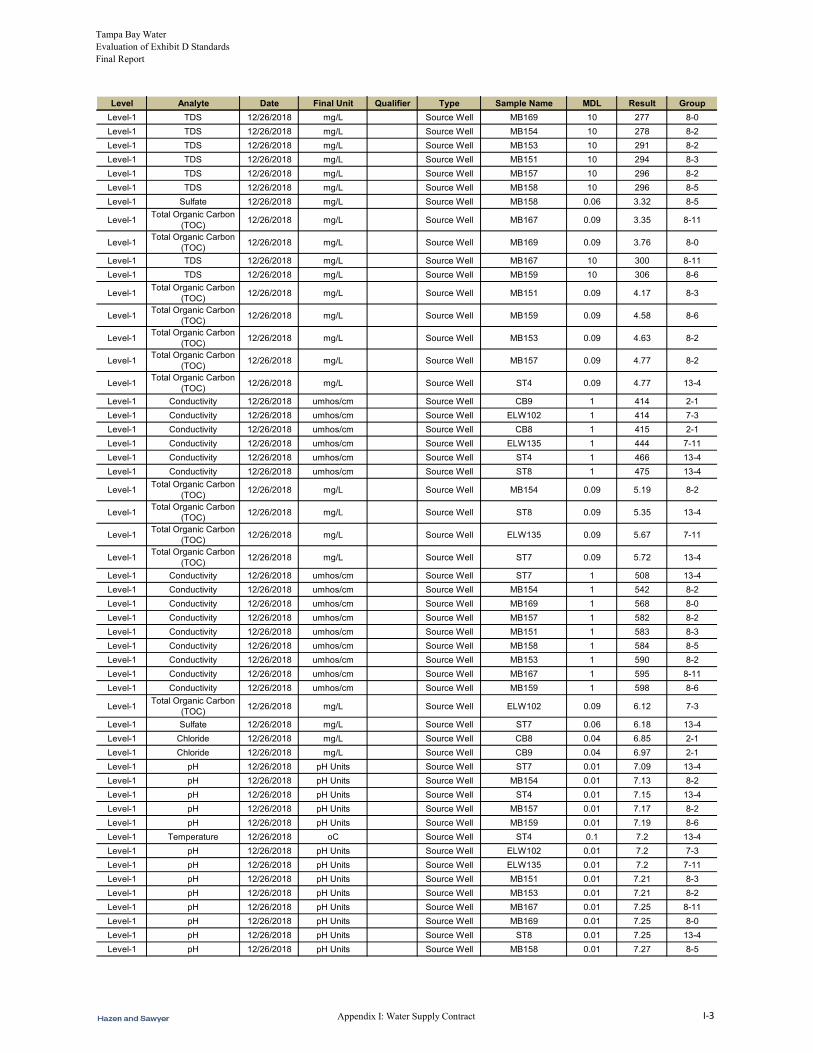
Tampa Bay Water Evaluation of Exhibit D Standards Final Report
Level Analyte Date Final Unit Qualifier Type Sample Name MDL Result Group
Level-1 TDS 12/26/2018 mg/L Source Well MB169 10 277 8-0
Level-1 TDS 12/26/2018 mg/L Source Well MB154 10 278 8-2
Level-1 TDS 12/26/2018 mg/L Source Well MB153 10 291 8-2
Level-1 TDS 12/26/2018 mg/L Source Well MB151 10 294 8-3
Level-1 TDS 12/26/2018 mg/L Source Well MB157 10 296 8-2
Level-1 TDS 12/26/2018 mg/L Source Well MB158 10 296 8-5
Level-1 Sulfate 12/26/2018 mg/L Source Well MB158 0.06 3.32 8-5
Level-1Total Organic Carbon
(TOC)12/26/2018 mg/L Source Well MB167 0.09 3.35 8-11
Level-1Total Organic Carbon
(TOC)12/26/2018 mg/L Source Well MB169 0.09 3.76 8-0
Level-1 TDS 12/26/2018 mg/L Source Well MB167 10 300 8-11
Level-1 TDS 12/26/2018 mg/L Source Well MB159 10 306 8-6
Level-1Total Organic Carbon
(TOC)12/26/2018 mg/L Source Well MB151 0.09 4.17 8-3
Level-1Total Organic Carbon
(TOC)12/26/2018 mg/L Source Well MB159 0.09 4.58 8-6
Level-1Total Organic Carbon
(TOC)12/26/2018 mg/L Source Well MB153 0.09 4.63 8-2
Level-1Total Organic Carbon
(TOC)12/26/2018 mg/L Source Well MB157 0.09 4.77 8-2
Level-1Total Organic Carbon
(TOC)12/26/2018 mg/L Source Well ST4 0.09 4.77 13-4
Level-1 Conductivity 12/26/2018 umhos/cm Source Well CB9 1 414 2-1
Level-1 Conductivity 12/26/2018 umhos/cm Source Well ELW102 1 414 7-3
Level-1 Conductivity 12/26/2018 umhos/cm Source Well CB8 1 415 2-1
Level-1 Conductivity 12/26/2018 umhos/cm Source Well ELW135 1 444 7-11
Level-1 Conductivity 12/26/2018 umhos/cm Source Well ST4 1 466 13-4
Level-1 Conductivity 12/26/2018 umhos/cm Source Well ST8 1 475 13-4
Level-1Total Organic Carbon
(TOC)12/26/2018 mg/L Source Well MB154 0.09 5.19 8-2
Level-1Total Organic Carbon
(TOC)12/26/2018 mg/L Source Well ST8 0.09 5.35 13-4
Level-1Total Organic Carbon
(TOC)12/26/2018 mg/L Source Well ELW135 0.09 5.67 7-11
Level-1Total Organic Carbon
(TOC)12/26/2018 mg/L Source Well ST7 0.09 5.72 13-4
Level-1 Conductivity 12/26/2018 umhos/cm Source Well ST7 1 508 13-4
Level-1 Conductivity 12/26/2018 umhos/cm Source Well MB154 1 542 8-2
Level-1 Conductivity 12/26/2018 umhos/cm Source Well MB169 1 568 8-0
Level-1 Conductivity 12/26/2018 umhos/cm Source Well MB157 1 582 8-2
Level-1 Conductivity 12/26/2018 umhos/cm Source Well MB151 1 583 8-3
Level-1 Conductivity 12/26/2018 umhos/cm Source Well MB158 1 584 8-5
Level-1 Conductivity 12/26/2018 umhos/cm Source Well MB153 1 590 8-2
Level-1 Conductivity 12/26/2018 umhos/cm Source Well MB167 1 595 8-11
Level-1 Conductivity 12/26/2018 umhos/cm Source Well MB159 1 598 8-6
Level-1Total Organic Carbon
(TOC)12/26/2018 mg/L Source Well ELW102 0.09 6.12 7-3
Level-1 Sulfate 12/26/2018 mg/L Source Well ST7 0.06 6.18 13-4
Level-1 Chloride 12/26/2018 mg/L Source Well CB8 0.04 6.85 2-1
Level-1 Chloride 12/26/2018 mg/L Source Well CB9 0.04 6.97 2-1
Level-1 pH 12/26/2018 pH Units Source Well ST7 0.01 7.09 13-4
Level-1 pH 12/26/2018 pH Units Source Well MB154 0.01 7.13 8-2
Level-1 pH 12/26/2018 pH Units Source Well ST4 0.01 7.15 13-4
Level-1 pH 12/26/2018 pH Units Source Well MB157 0.01 7.17 8-2
Level-1 pH 12/26/2018 pH Units Source Well MB159 0.01 7.19 8-6
Level-1 Temperature 12/26/2018 oC Source Well ST4 0.1 7.2 13-4
Level-1 pH 12/26/2018 pH Units Source Well ELW102 0.01 7.2 7-3
Level-1 pH 12/26/2018 pH Units Source Well ELW135 0.01 7.2 7-11
Level-1 pH 12/26/2018 pH Units Source Well MB151 0.01 7.21 8-3
Level-1 pH 12/26/2018 pH Units Source Well MB153 0.01 7.21 8-2
Level-1 pH 12/26/2018 pH Units Source Well MB167 0.01 7.25 8-11
Level-1 pH 12/26/2018 pH Units Source Well MB169 0.01 7.25 8-0
Level-1 pH 12/26/2018 pH Units Source Well ST8 0.01 7.25 13-4
Level-1 pH 12/26/2018 pH Units Source Well MB158 0.01 7.27 8-5
Appendix I: Water Supply Contract I-3
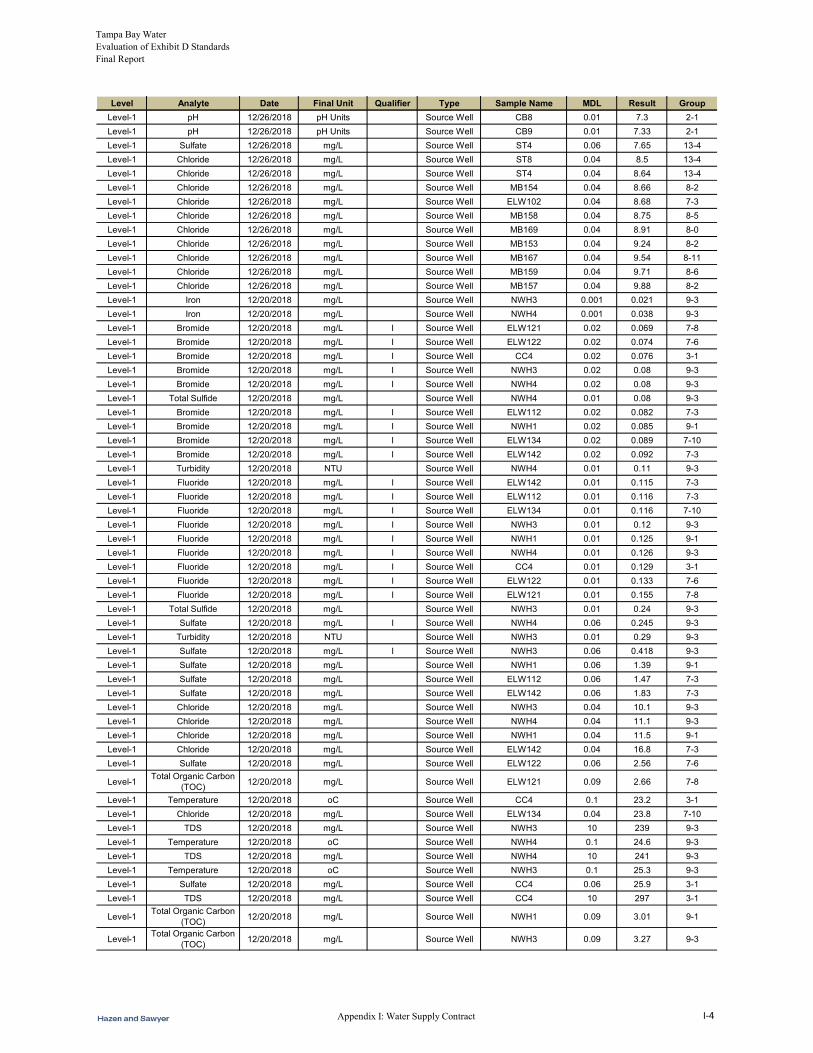
Tampa Bay Water Evaluation of Exhibit D Standards Final Report
Level Analyte Date Final Unit Qualifier Type Sample Name MDL Result Group
Level-1 pH 12/26/2018 pH Units Source Well CB8 0.01 7.3 2-1
Level-1 pH 12/26/2018 pH Units Source Well CB9 0.01 7.33 2-1
Level-1 Sulfate 12/26/2018 mg/L Source Well ST4 0.06 7.65 13-4
Level-1 Chloride 12/26/2018 mg/L Source Well ST8 0.04 8.5 13-4
Level-1 Chloride 12/26/2018 mg/L Source Well ST4 0.04 8.64 13-4
Level-1 Chloride 12/26/2018 mg/L Source Well MB154 0.04 8.66 8-2
Level-1 Chloride 12/26/2018 mg/L Source Well ELW102 0.04 8.68 7-3
Level-1 Chloride 12/26/2018 mg/L Source Well MB158 0.04 8.75 8-5
Level-1 Chloride 12/26/2018 mg/L Source Well MB169 0.04 8.91 8-0
Level-1 Chloride 12/26/2018 mg/L Source Well MB153 0.04 9.24 8-2
Level-1 Chloride 12/26/2018 mg/L Source Well MB167 0.04 9.54 8-11
Level-1 Chloride 12/26/2018 mg/L Source Well MB159 0.04 9.71 8-6
Level-1 Chloride 12/26/2018 mg/L Source Well MB157 0.04 9.88 8-2
Level-1 Iron 12/20/2018 mg/L Source Well NWH3 0.001 0.021 9-3
Level-1 Iron 12/20/2018 mg/L Source Well NWH4 0.001 0.038 9-3
Level-1 Bromide 12/20/2018 mg/L I Source Well ELW121 0.02 0.069 7-8
Level-1 Bromide 12/20/2018 mg/L I Source Well ELW122 0.02 0.074 7-6
Level-1 Bromide 12/20/2018 mg/L I Source Well CC4 0.02 0.076 3-1
Level-1 Bromide 12/20/2018 mg/L I Source Well NWH3 0.02 0.08 9-3
Level-1 Bromide 12/20/2018 mg/L I Source Well NWH4 0.02 0.08 9-3
Level-1 Total Sulfide 12/20/2018 mg/L Source Well NWH4 0.01 0.08 9-3
Level-1 Bromide 12/20/2018 mg/L I Source Well ELW112 0.02 0.082 7-3
Level-1 Bromide 12/20/2018 mg/L I Source Well NWH1 0.02 0.085 9-1
Level-1 Bromide 12/20/2018 mg/L I Source Well ELW134 0.02 0.089 7-10
Level-1 Bromide 12/20/2018 mg/L I Source Well ELW142 0.02 0.092 7-3
Level-1 Turbidity 12/20/2018 NTU Source Well NWH4 0.01 0.11 9-3
Level-1 Fluoride 12/20/2018 mg/L I Source Well ELW142 0.01 0.115 7-3
Level-1 Fluoride 12/20/2018 mg/L I Source Well ELW112 0.01 0.116 7-3
Level-1 Fluoride 12/20/2018 mg/L I Source Well ELW134 0.01 0.116 7-10
Level-1 Fluoride 12/20/2018 mg/L I Source Well NWH3 0.01 0.12 9-3
Level-1 Fluoride 12/20/2018 mg/L I Source Well NWH1 0.01 0.125 9-1
Level-1 Fluoride 12/20/2018 mg/L I Source Well NWH4 0.01 0.126 9-3
Level-1 Fluoride 12/20/2018 mg/L I Source Well CC4 0.01 0.129 3-1
Level-1 Fluoride 12/20/2018 mg/L I Source Well ELW122 0.01 0.133 7-6
Level-1 Fluoride 12/20/2018 mg/L I Source Well ELW121 0.01 0.155 7-8
Level-1 Total Sulfide 12/20/2018 mg/L Source Well NWH3 0.01 0.24 9-3
Level-1 Sulfate 12/20/2018 mg/L I Source Well NWH4 0.06 0.245 9-3
Level-1 Turbidity 12/20/2018 NTU Source Well NWH3 0.01 0.29 9-3
Level-1 Sulfate 12/20/2018 mg/L I Source Well NWH3 0.06 0.418 9-3
Level-1 Sulfate 12/20/2018 mg/L Source Well NWH1 0.06 1.39 9-1
Level-1 Sulfate 12/20/2018 mg/L Source Well ELW112 0.06 1.47 7-3
Level-1 Sulfate 12/20/2018 mg/L Source Well ELW142 0.06 1.83 7-3
Level-1 Chloride 12/20/2018 mg/L Source Well NWH3 0.04 10.1 9-3
Level-1 Chloride 12/20/2018 mg/L Source Well NWH4 0.04 11.1 9-3
Level-1 Chloride 12/20/2018 mg/L Source Well NWH1 0.04 11.5 9-1
Level-1 Chloride 12/20/2018 mg/L Source Well ELW142 0.04 16.8 7-3
Level-1 Sulfate 12/20/2018 mg/L Source Well ELW122 0.06 2.56 7-6
Level-1Total Organic Carbon
(TOC)12/20/2018 mg/L Source Well ELW121 0.09 2.66 7-8
Level-1 Temperature 12/20/2018 oC Source Well CC4 0.1 23.2 3-1
Level-1 Chloride 12/20/2018 mg/L Source Well ELW134 0.04 23.8 7-10
Level-1 TDS 12/20/2018 mg/L Source Well NWH3 10 239 9-3
Level-1 Temperature 12/20/2018 oC Source Well NWH4 0.1 24.6 9-3
Level-1 TDS 12/20/2018 mg/L Source Well NWH4 10 241 9-3
Level-1 Temperature 12/20/2018 oC Source Well NWH3 0.1 25.3 9-3
Level-1 Sulfate 12/20/2018 mg/L Source Well CC4 0.06 25.9 3-1
Level-1 TDS 12/20/2018 mg/L Source Well CC4 10 297 3-1
Level-1Total Organic Carbon
(TOC)12/20/2018 mg/L Source Well NWH1 0.09 3.01 9-1
Level-1Total Organic Carbon
(TOC)12/20/2018 mg/L Source Well NWH3 0.09 3.27 9-3
Appendix I: Water Supply Contract I-4

Tampa Bay Water Evaluation of Exhibit D Standards Final Report
Level Analyte Date Final Unit Qualifier Type Sample Name MDL Result Group
Level-1Total Organic Carbon
(TOC)12/20/2018 mg/L Source Well ELW122 0.09 3.68 7-6
Level-1Total Organic Carbon
(TOC)12/20/2018 mg/L Source Well ELW134 0.09 3.86 7-10
Level-1Total Organic Carbon
(TOC)12/20/2018 mg/L Source Well CC4 0.09 3.93 3-1
Level-1 Conductivity 12/20/2018 umhos/cm Source Well ELW121 1 341 7-8
Level-1 Conductivity 12/20/2018 umhos/cm Source Well NWH1 1 392 9-1
Level-1Total Organic Carbon
(TOC)12/20/2018 mg/L Source Well NWH4 0.09 4.31 9-3
Level-1Total Organic Carbon
(TOC)12/20/2018 mg/L Source Well ELW142 0.09 4.85 7-3
Level-1 Conductivity 12/20/2018 umhos/cm Source Well ELW122 1 405 7-6
Level-1 Conductivity 12/20/2018 umhos/cm Source Well ELW112 1 413 7-3
Level-1 Conductivity 12/20/2018 umhos/cm Source Well NWH3 1 417 9-3
Level-1 Conductivity 12/20/2018 umhos/cm Source Well NWH4 1 437 9-3
Level-1Total Organic Carbon
(TOC)12/20/2018 mg/L Source Well ELW112 0.09 5.33 7-3
Level-1 Conductivity 12/20/2018 umhos/cm Source Well ELW142 1 510 7-3
Level-1 Conductivity 12/20/2018 umhos/cm Source Well ELW134 1 512 7-10
Level-1 Conductivity 12/20/2018 umhos/cm Source Well CC4 1 567 3-1
Level-1 Sulfate 12/20/2018 mg/L Source Well ELW134 0.06 6.66 7-10
Level-1 pH 12/20/2018 pH Units Source Well ELW142 0.01 7.17 7-3
Level-1 pH 12/20/2018 pH Units Source Well ELW134 0.01 7.23 7-10
Level-1 pH 12/20/2018 pH Units Source Well CC4 0.01 7.29 3-1
Level-1 pH 12/20/2018 pH Units Source Well ELW112 0.01 7.36 7-3
Level-1 pH 12/20/2018 pH Units Source Well NWH3 0.01 7.38 9-3
Level-1 pH 12/20/2018 pH Units Source Well NWH4 0.01 7.39 9-3
Level-1 pH 12/20/2018 pH Units Source Well NWH1 0.01 7.42 9-1
Level-1 pH 12/20/2018 pH Units Source Well ELW122 0.01 7.51 7-6
Level-1 pH 12/20/2018 pH Units Source Well ELW121 0.01 7.61 7-8
Level-1 Chloride 12/20/2018 mg/L Source Well ELW112 0.04 8.8 7-3
Level-1 Chloride 12/20/2018 mg/L Source Well ELW122 0.04 8.84 7-6
Level-1 Chloride 12/20/2018 mg/L Source Well CC4 0.04 8.95 3-1
Level-1 Sulfate 12/20/2018 mg/L Source Well ELW121 0.06 9.84 7-8
Level-1 Chloride 12/20/2018 mg/L Source Well ELW121 0.04 9.94 7-8
Level-1 Nitrate 12/19/2018 mg/L as N U Source Well S-21-#10 0.01 0.01 10-1
Level-1 Nitrite 12/19/2018 mg/L as N U Source Well S-21-#10 0.01 0.01 10-1
Level-1 Bromide 12/19/2018 mg/L I Source Well CO-10 0.02 0.04 4-5
Level-1 Bromide 12/19/2018 mg/L I Source Well CO-12A 0.02 0.04 4-3
Level-1 Bromide 12/19/2018 mg/L I Source Well CO-30 0.02 0.04 4-5
Level-1 Bromide 12/19/2018 mg/L I Source Well CO-7A 0.02 0.04 4-1
Level-1 Bromide 12/19/2018 mg/L I Source Well CRLWD2 0.02 0.04 5-1
Level-1 Bromide 12/19/2018 mg/L I Source Well NWH5 0.02 0.04 9-4
Level-1 Bromide 12/19/2018 mg/L I Source Well S-21-#10 0.02 0.04 10-1
Level-1 Bromide 12/19/2018 mg/L I Source Well S-21-#8 0.02 0.04 10-1
Level-1 Bromide 12/19/2018 mg/L I Source Well CRLWD3 0.02 0.05 5-1
Level-1 Bromide 12/19/2018 mg/L I Source Well NWH6 0.02 0.05 9-5
Level-1 Fluoride 12/19/2018 mg/L I Source Well CRLWD1 0.01 0.06 5-1
Level-1 Sulfate 12/19/2018 mg/L U Source Well CO-12A 0.06 0.06 4-3
Level-1 Bromide 12/19/2018 mg/L I Source Well CRLWD1 0.02 0.07 5-1
Level-1 Fluoride 12/19/2018 mg/L I Source Well CRLWD3 0.01 0.07 5-1
Level-1 Fluoride 12/19/2018 mg/L I Source Well S-21-#10 0.01 0.07 10-1
Level-1 Fluoride 12/19/2018 mg/L I Source Well S-21-#8 0.01 0.07 10-1
Level-1 Bromide 12/19/2018 mg/L I Source Well CO-31 0.02 0.081 4-4
Level-1 Fluoride 12/19/2018 mg/L I Source Well CO-32 0.01 0.084 4-1
Level-1 Bromide 12/19/2018 mg/L I Source Well CO-32 0.02 0.089 4-1
Level-1 Fluoride 12/19/2018 mg/L I Source Well CRLWD2 0.01 0.09 5-1
Level-1 Fluoride 12/19/2018 mg/L I Source Well CO-10 0.01 0.1 4-5
Level-1 Fluoride 12/19/2018 mg/L I Source Well CO-12A 0.01 0.1 4-3
Level-1 Fluoride 12/19/2018 mg/L I Source Well CO-7A 0.01 0.11 4-1
Level-1 Fluoride 12/19/2018 mg/L I Source Well NWH6 0.01 0.11 9-5
Appendix I: Water Supply Contract I-5

Tampa Bay Water Evaluation of Exhibit D Standards Final Report
Level Analyte Date Final Unit Qualifier Type Sample Name MDL Result Group
Level-1 Fluoride 12/19/2018 mg/L I Source Well NWH5 0.01 0.12 9-4
Level-1 Fluoride 12/19/2018 mg/L I Source Well CO-31 0.01 0.138 4-4
Level-1 Fluoride 12/19/2018 mg/L I Source Well CO-30 0.01 0.14 4-5
Level-1 Sulfate 12/19/2018 mg/L I Source Well S-21-#10 0.06 0.15 10-1
Level-1 Sulfate 12/19/2018 mg/L I Source Well S-21-#8 0.06 0.15 10-1
Level-1 Sulfate 12/19/2018 mg/L I Source Well CO-7A 0.06 0.58 4-1
Level-1 Sulfate 12/19/2018 mg/L I Source Well CRLWD2 0.06 0.89 5-1
Level-1 Sulfate 12/19/2018 mg/L Source Well CO-30 0.06 1.29 4-5
Level-1 Sulfate 12/19/2018 mg/L Source Well NWH5 0.06 1.3 9-4
Level-1 Chloride 12/19/2018 mg/L Source Well NWH5 0.04 10.4 9-4
Level-1 Chloride 12/19/2018 mg/L Source Well CO-12A 0.04 10.6 4-3
Level-1 Chloride 12/19/2018 mg/L Source Well CRLWD2 0.04 10.6 5-1
Level-1 Chloride 12/19/2018 mg/L Source Well S-21-#10 0.04 10.9 10-1
Level-1 Chloride 12/19/2018 mg/L Source Well S-21-#8 0.04 11.1 10-1
Level-1 Chloride 12/19/2018 mg/L Source Well CO-32 0.04 11.3 4-1
Level-1 Chloride 12/19/2018 mg/L Source Well CO-7A 0.04 11.4 4-1
Level-1 Chloride 12/19/2018 mg/L Source Well CO-10 0.04 12.5 4-5
Level-1 Sulfate 12/19/2018 mg/L Source Well CRLWD3 0.06 2.39 5-1
Level-1 Sulfate 12/19/2018 mg/L Source Well NWH6 0.06 2.39 9-5
Level-1Total Organic Carbon
(TOC)12/19/2018 mg/L Source Well CRLWD3 0.09 2.56 5-1
Level-1 Sulfate 12/19/2018 mg/L Source Well CO-10 0.06 2.64 4-5
Level-1Total Organic Carbon
(TOC)12/19/2018 mg/L Source Well CRLWD2 0.09 2.64 5-1
Level-1Total Organic Carbon
(TOC)12/19/2018 mg/L Source Well CO-10 0.09 2.9 4-5
Level-1 Chloride 12/19/2018 mg/L Source Well CRLWD3 0.04 20.2 5-1
Level-1 Chloride 12/19/2018 mg/L Source Well NWH6 0.04 20.4 9-5
Level-1 TDS 12/19/2018 mg/L Source Well S-21-#8 10 215 10-1
Level-1 TDS 12/19/2018 mg/L Source Well CRLWD2 10 222 5-1
Level-1 Temperature 12/19/2018 oC Source Well CRLWD1 0.1 23.8 5-1
Level-1 Temperature 12/19/2018 oC Source Well CRLWD3 0.1 23.9 5-1
Level-1 Temperature 12/19/2018 oC Source Well CRLWD2 0.1 24.4 5-1
Level-1 Temperature 12/19/2018 oC Source Well S-21-#10 0.1 24.6 10-1
Level-1 Temperature 12/19/2018 oC Source Well NWH5 0.1 24.7 9-4
Level-1 TDS 12/19/2018 mg/L Source Well CRLWD3 10 243 5-1
Level-1 TDS 12/19/2018 mg/L Source Well S-21-#10 10 246 10-1
Level-1 Temperature 12/19/2018 oC Source Well S-21-#8 0.1 25.2 10-1
Level-1 TDS 12/19/2018 mg/L Source Well NWH5 10 252 9-4
Level-1 TDS 12/19/2018 mg/L Source Well CRLWD1 10 276 5-1
Level-1 Chloride 12/19/2018 mg/L Source Well CRLWD1 0.04 29.1 5-1
Level-1Total Organic Carbon
(TOC)12/19/2018 mg/L Source Well CRLWD1 0.09 3.02 5-1
Level-1Total Organic Carbon
(TOC)12/19/2018 mg/L Source Well NWH6 0.09 3.02 9-5
Level-1Total Organic Carbon
(TOC)12/19/2018 mg/L Source Well NWH5 0.09 3.17 9-4
Level-1Total Organic Carbon
(TOC)12/19/2018 mg/L Source Well S-21-#8 0.09 3.75 10-1
Level-1 Conductivity 12/19/2018 umhos/cm Source Well CO-10 1 355 4-5
Level-1 Conductivity 12/19/2018 umhos/cm Source Well CO-32 1 396 4-1
Level-1 Conductivity 12/19/2018 umhos/cm Source Well CO-7A 1 399 4-1
Level-1Total Organic Carbon
(TOC)12/19/2018 mg/L Source Well CO-12A 0.09 4 4-3
Level-1Total Organic Carbon
(TOC)12/19/2018 mg/L Source Well S-21-#10 0.09 4.03 10-1
Level-1Total Organic Carbon
(TOC)12/19/2018 mg/L Source Well CO-31 0.09 4.19 4-4
Level-1Total Organic Carbon
(TOC)12/19/2018 mg/L Source Well CO-30 0.09 4.21 4-5
Level-1 Sulfate 12/19/2018 mg/L Source Well CRLWD1 0.06 4.33 5-1
Level-1Total Organic Carbon
(TOC)12/19/2018 mg/L Source Well CO-32 0.09 4.56 4-1
Level-1 Conductivity 12/19/2018 umhos/cm Source Well S-21-#8 1 403 10-1
Level-1 Conductivity 12/19/2018 umhos/cm Source Well CRLWD2 1 411 5-1
Appendix I: Water Supply Contract I-6
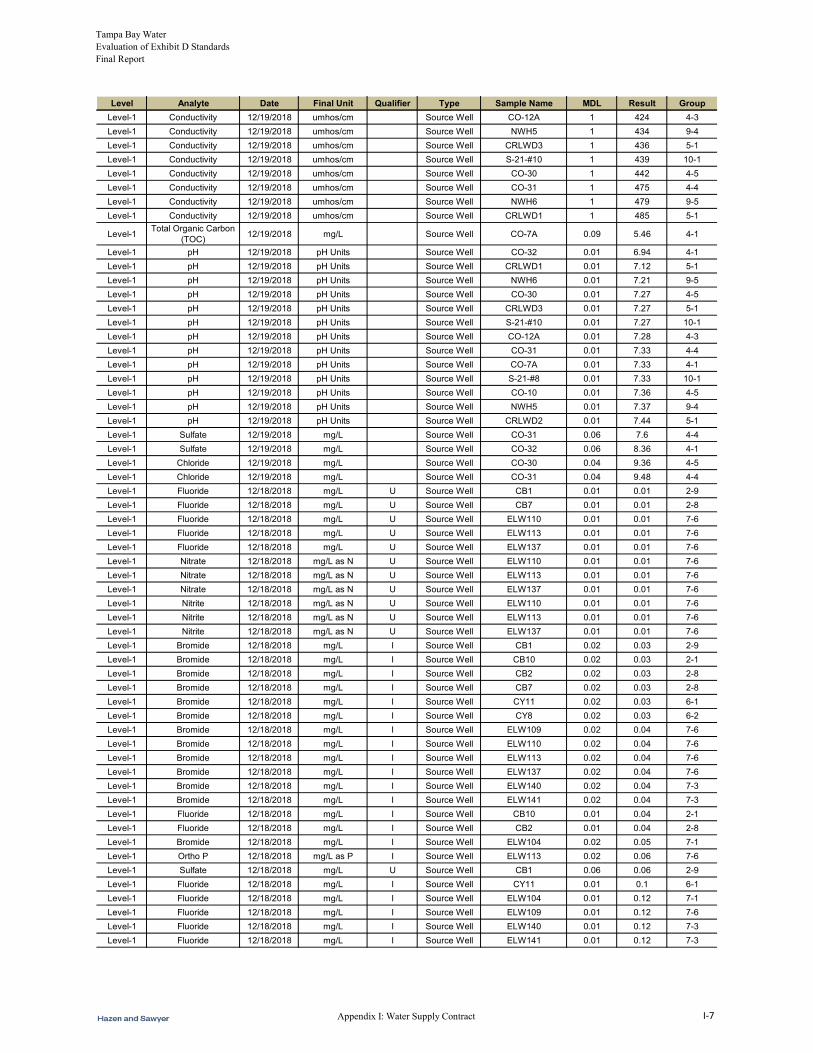
Tampa Bay Water Evaluation of Exhibit D Standards Final Report
Level Analyte Date Final Unit Qualifier Type Sample Name MDL Result Group
Level-1 Conductivity 12/19/2018 umhos/cm Source Well CO-12A 1 424 4-3
Level-1 Conductivity 12/19/2018 umhos/cm Source Well NWH5 1 434 9-4
Level-1 Conductivity 12/19/2018 umhos/cm Source Well CRLWD3 1 436 5-1
Level-1 Conductivity 12/19/2018 umhos/cm Source Well S-21-#10 1 439 10-1
Level-1 Conductivity 12/19/2018 umhos/cm Source Well CO-30 1 442 4-5
Level-1 Conductivity 12/19/2018 umhos/cm Source Well CO-31 1 475 4-4
Level-1 Conductivity 12/19/2018 umhos/cm Source Well NWH6 1 479 9-5
Level-1 Conductivity 12/19/2018 umhos/cm Source Well CRLWD1 1 485 5-1
Level-1Total Organic Carbon
(TOC)12/19/2018 mg/L Source Well CO-7A 0.09 5.46 4-1
Level-1 pH 12/19/2018 pH Units Source Well CO-32 0.01 6.94 4-1
Level-1 pH 12/19/2018 pH Units Source Well CRLWD1 0.01 7.12 5-1
Level-1 pH 12/19/2018 pH Units Source Well NWH6 0.01 7.21 9-5
Level-1 pH 12/19/2018 pH Units Source Well CO-30 0.01 7.27 4-5
Level-1 pH 12/19/2018 pH Units Source Well CRLWD3 0.01 7.27 5-1
Level-1 pH 12/19/2018 pH Units Source Well S-21-#10 0.01 7.27 10-1
Level-1 pH 12/19/2018 pH Units Source Well CO-12A 0.01 7.28 4-3
Level-1 pH 12/19/2018 pH Units Source Well CO-31 0.01 7.33 4-4
Level-1 pH 12/19/2018 pH Units Source Well CO-7A 0.01 7.33 4-1
Level-1 pH 12/19/2018 pH Units Source Well S-21-#8 0.01 7.33 10-1
Level-1 pH 12/19/2018 pH Units Source Well CO-10 0.01 7.36 4-5
Level-1 pH 12/19/2018 pH Units Source Well NWH5 0.01 7.37 9-4
Level-1 pH 12/19/2018 pH Units Source Well CRLWD2 0.01 7.44 5-1
Level-1 Sulfate 12/19/2018 mg/L Source Well CO-31 0.06 7.6 4-4
Level-1 Sulfate 12/19/2018 mg/L Source Well CO-32 0.06 8.36 4-1
Level-1 Chloride 12/19/2018 mg/L Source Well CO-30 0.04 9.36 4-5
Level-1 Chloride 12/19/2018 mg/L Source Well CO-31 0.04 9.48 4-4
Level-1 Fluoride 12/18/2018 mg/L U Source Well CB1 0.01 0.01 2-9
Level-1 Fluoride 12/18/2018 mg/L U Source Well CB7 0.01 0.01 2-8
Level-1 Fluoride 12/18/2018 mg/L U Source Well ELW110 0.01 0.01 7-6
Level-1 Fluoride 12/18/2018 mg/L U Source Well ELW113 0.01 0.01 7-6
Level-1 Fluoride 12/18/2018 mg/L U Source Well ELW137 0.01 0.01 7-6
Level-1 Nitrate 12/18/2018 mg/L as N U Source Well ELW110 0.01 0.01 7-6
Level-1 Nitrate 12/18/2018 mg/L as N U Source Well ELW113 0.01 0.01 7-6
Level-1 Nitrate 12/18/2018 mg/L as N U Source Well ELW137 0.01 0.01 7-6
Level-1 Nitrite 12/18/2018 mg/L as N U Source Well ELW110 0.01 0.01 7-6
Level-1 Nitrite 12/18/2018 mg/L as N U Source Well ELW113 0.01 0.01 7-6
Level-1 Nitrite 12/18/2018 mg/L as N U Source Well ELW137 0.01 0.01 7-6
Level-1 Bromide 12/18/2018 mg/L I Source Well CB1 0.02 0.03 2-9
Level-1 Bromide 12/18/2018 mg/L I Source Well CB10 0.02 0.03 2-1
Level-1 Bromide 12/18/2018 mg/L I Source Well CB2 0.02 0.03 2-8
Level-1 Bromide 12/18/2018 mg/L I Source Well CB7 0.02 0.03 2-8
Level-1 Bromide 12/18/2018 mg/L I Source Well CY11 0.02 0.03 6-1
Level-1 Bromide 12/18/2018 mg/L I Source Well CY8 0.02 0.03 6-2
Level-1 Bromide 12/18/2018 mg/L I Source Well ELW109 0.02 0.04 7-6
Level-1 Bromide 12/18/2018 mg/L I Source Well ELW110 0.02 0.04 7-6
Level-1 Bromide 12/18/2018 mg/L I Source Well ELW113 0.02 0.04 7-6
Level-1 Bromide 12/18/2018 mg/L I Source Well ELW137 0.02 0.04 7-6
Level-1 Bromide 12/18/2018 mg/L I Source Well ELW140 0.02 0.04 7-3
Level-1 Bromide 12/18/2018 mg/L I Source Well ELW141 0.02 0.04 7-3
Level-1 Fluoride 12/18/2018 mg/L I Source Well CB10 0.01 0.04 2-1
Level-1 Fluoride 12/18/2018 mg/L I Source Well CB2 0.01 0.04 2-8
Level-1 Bromide 12/18/2018 mg/L I Source Well ELW104 0.02 0.05 7-1
Level-1 Ortho P 12/18/2018 mg/L as P I Source Well ELW113 0.02 0.06 7-6
Level-1 Sulfate 12/18/2018 mg/L U Source Well CB1 0.06 0.06 2-9
Level-1 Fluoride 12/18/2018 mg/L I Source Well CY11 0.01 0.1 6-1
Level-1 Fluoride 12/18/2018 mg/L I Source Well ELW104 0.01 0.12 7-1
Level-1 Fluoride 12/18/2018 mg/L I Source Well ELW109 0.01 0.12 7-6
Level-1 Fluoride 12/18/2018 mg/L I Source Well ELW140 0.01 0.12 7-3
Level-1 Fluoride 12/18/2018 mg/L I Source Well ELW141 0.01 0.12 7-3
Appendix I: Water Supply Contract I-7

Tampa Bay Water Evaluation of Exhibit D Standards Final Report
Level Analyte Date Final Unit Qualifier Type Sample Name MDL Result Group
Level-1 Fluoride 12/18/2018 mg/L I Source Well CY8 0.01 0.13 6-2
Level-1 Sulfate 12/18/2018 mg/L I Source Well CB2 0.06 0.19 2-8
Level-1 Sulfate 12/18/2018 mg/L I Source Well ELW113 0.06 0.36 7-6
Level-1 Sulfate 12/18/2018 mg/L I Source Well CB7 0.06 0.44 2-8
Level-1 Sulfate 12/18/2018 mg/L I Source Well CY11 0.06 0.75 6-1
Level-1 Sulfate 12/18/2018 mg/L I Source Well ELW110 0.06 0.81 7-6
Level-1 Sulfate 12/18/2018 mg/L I Source Well CB10 0.06 0.91 2-1
Level-1 Sulfate 12/18/2018 mg/L Source Well CY8 0.06 1.01 6-2
Level-1 Sulfate 12/18/2018 mg/L Source Well ELW140 0.06 1.04 7-3
Level-1 Sulfate 12/18/2018 mg/L Source Well ELW141 0.06 1.05 7-3
Level-1 Sulfate 12/18/2018 mg/L Source Well ELW109 0.06 1.39 7-6
Level-1 Sulfate 12/18/2018 mg/L Source Well ELW137 0.06 1.7 7-6
Level-1Total Organic Carbon
(TOC)12/18/2018 mg/L Source Well CY8 0.09 1.83 6-2
Level-1Total Organic Carbon
(TOC)12/18/2018 mg/L Source Well CY11 0.09 1.92 6-1
Level-1 Chloride 12/18/2018 mg/L Source Well ELW141 0.04 10.1 7-3
Level-1 Chloride 12/18/2018 mg/L Source Well ELW140 0.04 11.7 7-3
Level-1Total Organic Carbon
(TOC)12/18/2018 mg/L Source Well CB10 0.09 2.18 2-1
Level-1Total Organic Carbon
(TOC)12/18/2018 mg/L Source Well CB2 0.09 2.52 2-8
Level-1Total Organic Carbon
(TOC)12/18/2018 mg/L Source Well CB1 0.09 2.53 2-9
Level-1Total Organic Carbon
(TOC)12/18/2018 mg/L Source Well CB7 0.09 2.65 2-8
Level-1 TDS 12/18/2018 mg/L Source Well CB10 10 200 2-1
Level-1 TDS 12/18/2018 mg/L Source Well CB2 10 205 2-8
Level-1 TDS 12/18/2018 mg/L Source Well CB7 10 211 2-8
Level-1 TDS 12/18/2018 mg/L Source Well ELW137 10 217 7-6
Level-1 TDS 12/18/2018 mg/L Source Well CB1 10 221 2-9
Level-1 TDS 12/18/2018 mg/L Source Well CY8 10 221 6-2
Level-1 Temperature 12/18/2018 oC Source Well CB7 0.1 23.4 2-8
Level-1 Temperature 12/18/2018 oC Source Well CB1 0.1 23.6 2-9
Level-1 TDS 12/18/2018 mg/L Source Well ELW110 10 235 7-6
Level-1 Temperature 12/18/2018 oC Source Well CB10 0.1 24.1 2-1
Level-1 Temperature 12/18/2018 oC Source Well CB2 0.1 24.2 2-8
Level-1 TDS 12/18/2018 mg/L Source Well ELW113 10 242 7-6
Level-1 Temperature 12/18/2018 oC Source Well CY11 0.1 25 6-1
Level-1 Temperature 12/18/2018 oC Source Well CY8 0.1 25.9 6-2
Level-1 TDS 12/18/2018 mg/L Source Well ELW141 10 256 7-3
Level-1 TDS 12/18/2018 mg/L Source Well CY11 10 267 6-1
Level-1 TDS 12/18/2018 mg/L Source Well ELW140 10 269 7-3
Level-1 Sulfate 12/18/2018 mg/L Source Well ELW104 0.06 3.2 7-1
Level-1Total Organic Carbon
(TOC)12/18/2018 mg/L Source Well ELW109 0.09 3.96 7-6
Level-1Total Organic Carbon
(TOC)12/18/2018 mg/L Source Well ELW110 0.09 4.03 7-6
Level-1Total Organic Carbon
(TOC)12/18/2018 mg/L Source Well ELW113 0.09 4.18 7-6
Level-1Total Organic Carbon
(TOC)12/18/2018 mg/L Source Well ELW137 0.09 4.26 7-6
Level-1Total Organic Carbon
(TOC)12/18/2018 mg/L Source Well ELW104 0.09 4.45 7-1
Level-1Total Organic Carbon
(TOC)12/18/2018 mg/L Source Well ELW140 0.09 4.8 7-3
Level-1Total Organic Carbon
(TOC)12/18/2018 mg/L Source Well ELW141 0.09 4.85 7-3
Level-1 Conductivity 12/18/2018 umhos/cm Source Well CB10 1 408 2-1
Level-1 Conductivity 12/18/2018 umhos/cm Source Well ELW104 1 408 7-1
Level-1 Conductivity 12/18/2018 umhos/cm Source Well CY8 1 420 6-2
Level-1 Conductivity 12/18/2018 umhos/cm Source Well CB7 1 421 2-8
Level-1 Conductivity 12/18/2018 umhos/cm Source Well ELW109 1 429 7-6
Level-1 Conductivity 12/18/2018 umhos/cm Source Well ELW110 1 430 7-6
Level-1 Conductivity 12/18/2018 umhos/cm Source Well ELW113 1 430 7-6
Appendix I: Water Supply Contract I-8
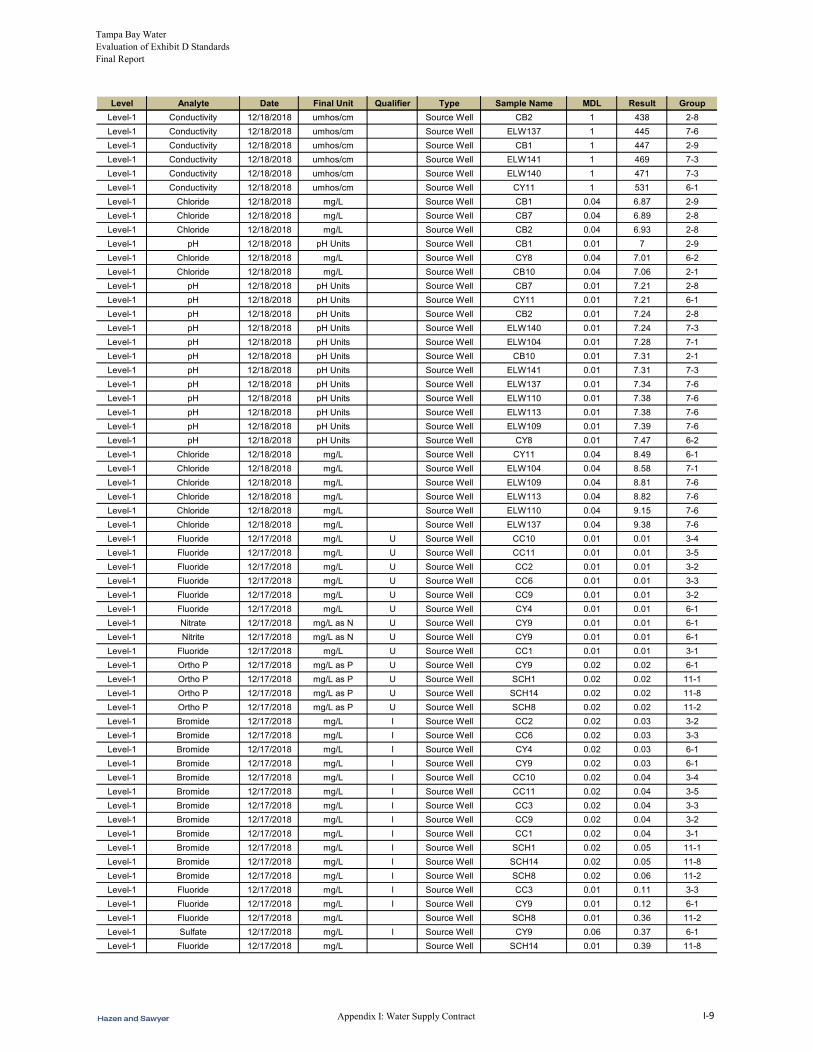
Tampa Bay Water Evaluation of Exhibit D Standards Final Report
Level Analyte Date Final Unit Qualifier Type Sample Name MDL Result Group
Level-1 Conductivity 12/18/2018 umhos/cm Source Well CB2 1 438 2-8
Level-1 Conductivity 12/18/2018 umhos/cm Source Well ELW137 1 445 7-6
Level-1 Conductivity 12/18/2018 umhos/cm Source Well CB1 1 447 2-9
Level-1 Conductivity 12/18/2018 umhos/cm Source Well ELW141 1 469 7-3
Level-1 Conductivity 12/18/2018 umhos/cm Source Well ELW140 1 471 7-3
Level-1 Conductivity 12/18/2018 umhos/cm Source Well CY11 1 531 6-1
Level-1 Chloride 12/18/2018 mg/L Source Well CB1 0.04 6.87 2-9
Level-1 Chloride 12/18/2018 mg/L Source Well CB7 0.04 6.89 2-8
Level-1 Chloride 12/18/2018 mg/L Source Well CB2 0.04 6.93 2-8
Level-1 pH 12/18/2018 pH Units Source Well CB1 0.01 7 2-9
Level-1 Chloride 12/18/2018 mg/L Source Well CY8 0.04 7.01 6-2
Level-1 Chloride 12/18/2018 mg/L Source Well CB10 0.04 7.06 2-1
Level-1 pH 12/18/2018 pH Units Source Well CB7 0.01 7.21 2-8
Level-1 pH 12/18/2018 pH Units Source Well CY11 0.01 7.21 6-1
Level-1 pH 12/18/2018 pH Units Source Well CB2 0.01 7.24 2-8
Level-1 pH 12/18/2018 pH Units Source Well ELW140 0.01 7.24 7-3
Level-1 pH 12/18/2018 pH Units Source Well ELW104 0.01 7.28 7-1
Level-1 pH 12/18/2018 pH Units Source Well CB10 0.01 7.31 2-1
Level-1 pH 12/18/2018 pH Units Source Well ELW141 0.01 7.31 7-3
Level-1 pH 12/18/2018 pH Units Source Well ELW137 0.01 7.34 7-6
Level-1 pH 12/18/2018 pH Units Source Well ELW110 0.01 7.38 7-6
Level-1 pH 12/18/2018 pH Units Source Well ELW113 0.01 7.38 7-6
Level-1 pH 12/18/2018 pH Units Source Well ELW109 0.01 7.39 7-6
Level-1 pH 12/18/2018 pH Units Source Well CY8 0.01 7.47 6-2
Level-1 Chloride 12/18/2018 mg/L Source Well CY11 0.04 8.49 6-1
Level-1 Chloride 12/18/2018 mg/L Source Well ELW104 0.04 8.58 7-1
Level-1 Chloride 12/18/2018 mg/L Source Well ELW109 0.04 8.81 7-6
Level-1 Chloride 12/18/2018 mg/L Source Well ELW113 0.04 8.82 7-6
Level-1 Chloride 12/18/2018 mg/L Source Well ELW110 0.04 9.15 7-6
Level-1 Chloride 12/18/2018 mg/L Source Well ELW137 0.04 9.38 7-6
Level-1 Fluoride 12/17/2018 mg/L U Source Well CC10 0.01 0.01 3-4
Level-1 Fluoride 12/17/2018 mg/L U Source Well CC11 0.01 0.01 3-5
Level-1 Fluoride 12/17/2018 mg/L U Source Well CC2 0.01 0.01 3-2
Level-1 Fluoride 12/17/2018 mg/L U Source Well CC6 0.01 0.01 3-3
Level-1 Fluoride 12/17/2018 mg/L U Source Well CC9 0.01 0.01 3-2
Level-1 Fluoride 12/17/2018 mg/L U Source Well CY4 0.01 0.01 6-1
Level-1 Nitrate 12/17/2018 mg/L as N U Source Well CY9 0.01 0.01 6-1
Level-1 Nitrite 12/17/2018 mg/L as N U Source Well CY9 0.01 0.01 6-1
Level-1 Fluoride 12/17/2018 mg/L U Source Well CC1 0.01 0.01 3-1
Level-1 Ortho P 12/17/2018 mg/L as P U Source Well CY9 0.02 0.02 6-1
Level-1 Ortho P 12/17/2018 mg/L as P U Source Well SCH1 0.02 0.02 11-1
Level-1 Ortho P 12/17/2018 mg/L as P U Source Well SCH14 0.02 0.02 11-8
Level-1 Ortho P 12/17/2018 mg/L as P U Source Well SCH8 0.02 0.02 11-2
Level-1 Bromide 12/17/2018 mg/L I Source Well CC2 0.02 0.03 3-2
Level-1 Bromide 12/17/2018 mg/L I Source Well CC6 0.02 0.03 3-3
Level-1 Bromide 12/17/2018 mg/L I Source Well CY4 0.02 0.03 6-1
Level-1 Bromide 12/17/2018 mg/L I Source Well CY9 0.02 0.03 6-1
Level-1 Bromide 12/17/2018 mg/L I Source Well CC10 0.02 0.04 3-4
Level-1 Bromide 12/17/2018 mg/L I Source Well CC11 0.02 0.04 3-5
Level-1 Bromide 12/17/2018 mg/L I Source Well CC3 0.02 0.04 3-3
Level-1 Bromide 12/17/2018 mg/L I Source Well CC9 0.02 0.04 3-2
Level-1 Bromide 12/17/2018 mg/L I Source Well CC1 0.02 0.04 3-1
Level-1 Bromide 12/17/2018 mg/L I Source Well SCH1 0.02 0.05 11-1
Level-1 Bromide 12/17/2018 mg/L I Source Well SCH14 0.02 0.05 11-8
Level-1 Bromide 12/17/2018 mg/L I Source Well SCH8 0.02 0.06 11-2
Level-1 Fluoride 12/17/2018 mg/L I Source Well CC3 0.01 0.11 3-3
Level-1 Fluoride 12/17/2018 mg/L I Source Well CY9 0.01 0.12 6-1
Level-1 Fluoride 12/17/2018 mg/L Source Well SCH8 0.01 0.36 11-2
Level-1 Sulfate 12/17/2018 mg/L I Source Well CY9 0.06 0.37 6-1
Level-1 Fluoride 12/17/2018 mg/L Source Well SCH14 0.01 0.39 11-8
Appendix I: Water Supply Contract I-9
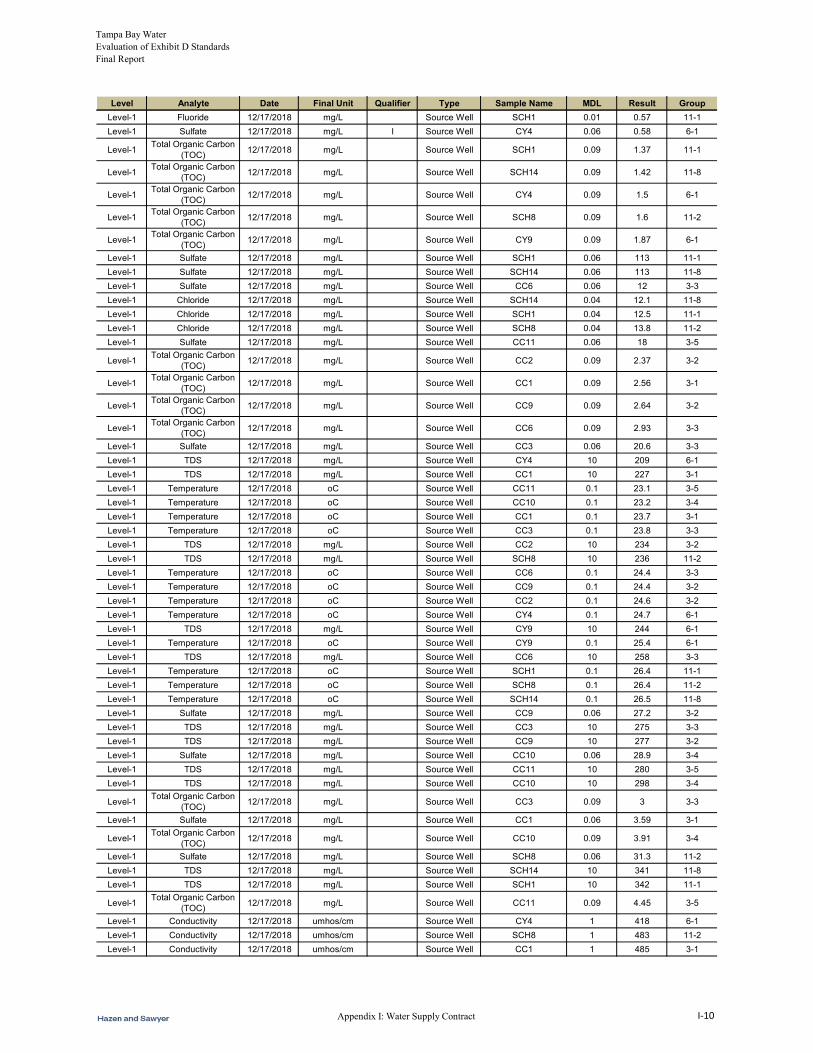
Tampa Bay Water Evaluation of Exhibit D Standards Final Report
Level Analyte Date Final Unit Qualifier Type Sample Name MDL Result Group
Level-1 Fluoride 12/17/2018 mg/L Source Well SCH1 0.01 0.57 11-1
Level-1 Sulfate 12/17/2018 mg/L I Source Well CY4 0.06 0.58 6-1
Level-1Total Organic Carbon
(TOC)12/17/2018 mg/L Source Well SCH1 0.09 1.37 11-1
Level-1Total Organic Carbon
(TOC)12/17/2018 mg/L Source Well SCH14 0.09 1.42 11-8
Level-1Total Organic Carbon
(TOC)12/17/2018 mg/L Source Well CY4 0.09 1.5 6-1
Level-1Total Organic Carbon
(TOC)12/17/2018 mg/L Source Well SCH8 0.09 1.6 11-2
Level-1Total Organic Carbon
(TOC)12/17/2018 mg/L Source Well CY9 0.09 1.87 6-1
Level-1 Sulfate 12/17/2018 mg/L Source Well SCH1 0.06 113 11-1
Level-1 Sulfate 12/17/2018 mg/L Source Well SCH14 0.06 113 11-8
Level-1 Sulfate 12/17/2018 mg/L Source Well CC6 0.06 12 3-3
Level-1 Chloride 12/17/2018 mg/L Source Well SCH14 0.04 12.1 11-8
Level-1 Chloride 12/17/2018 mg/L Source Well SCH1 0.04 12.5 11-1
Level-1 Chloride 12/17/2018 mg/L Source Well SCH8 0.04 13.8 11-2
Level-1 Sulfate 12/17/2018 mg/L Source Well CC11 0.06 18 3-5
Level-1Total Organic Carbon
(TOC)12/17/2018 mg/L Source Well CC2 0.09 2.37 3-2
Level-1Total Organic Carbon
(TOC)12/17/2018 mg/L Source Well CC1 0.09 2.56 3-1
Level-1Total Organic Carbon
(TOC)12/17/2018 mg/L Source Well CC9 0.09 2.64 3-2
Level-1Total Organic Carbon
(TOC)12/17/2018 mg/L Source Well CC6 0.09 2.93 3-3
Level-1 Sulfate 12/17/2018 mg/L Source Well CC3 0.06 20.6 3-3
Level-1 TDS 12/17/2018 mg/L Source Well CY4 10 209 6-1
Level-1 TDS 12/17/2018 mg/L Source Well CC1 10 227 3-1
Level-1 Temperature 12/17/2018 oC Source Well CC11 0.1 23.1 3-5
Level-1 Temperature 12/17/2018 oC Source Well CC10 0.1 23.2 3-4
Level-1 Temperature 12/17/2018 oC Source Well CC1 0.1 23.7 3-1
Level-1 Temperature 12/17/2018 oC Source Well CC3 0.1 23.8 3-3
Level-1 TDS 12/17/2018 mg/L Source Well CC2 10 234 3-2
Level-1 TDS 12/17/2018 mg/L Source Well SCH8 10 236 11-2
Level-1 Temperature 12/17/2018 oC Source Well CC6 0.1 24.4 3-3
Level-1 Temperature 12/17/2018 oC Source Well CC9 0.1 24.4 3-2
Level-1 Temperature 12/17/2018 oC Source Well CC2 0.1 24.6 3-2
Level-1 Temperature 12/17/2018 oC Source Well CY4 0.1 24.7 6-1
Level-1 TDS 12/17/2018 mg/L Source Well CY9 10 244 6-1
Level-1 Temperature 12/17/2018 oC Source Well CY9 0.1 25.4 6-1
Level-1 TDS 12/17/2018 mg/L Source Well CC6 10 258 3-3
Level-1 Temperature 12/17/2018 oC Source Well SCH1 0.1 26.4 11-1
Level-1 Temperature 12/17/2018 oC Source Well SCH8 0.1 26.4 11-2
Level-1 Temperature 12/17/2018 oC Source Well SCH14 0.1 26.5 11-8
Level-1 Sulfate 12/17/2018 mg/L Source Well CC9 0.06 27.2 3-2
Level-1 TDS 12/17/2018 mg/L Source Well CC3 10 275 3-3
Level-1 TDS 12/17/2018 mg/L Source Well CC9 10 277 3-2
Level-1 Sulfate 12/17/2018 mg/L Source Well CC10 0.06 28.9 3-4
Level-1 TDS 12/17/2018 mg/L Source Well CC11 10 280 3-5
Level-1 TDS 12/17/2018 mg/L Source Well CC10 10 298 3-4
Level-1Total Organic Carbon
(TOC)12/17/2018 mg/L Source Well CC3 0.09 3 3-3
Level-1 Sulfate 12/17/2018 mg/L Source Well CC1 0.06 3.59 3-1
Level-1Total Organic Carbon
(TOC)12/17/2018 mg/L Source Well CC10 0.09 3.91 3-4
Level-1 Sulfate 12/17/2018 mg/L Source Well SCH8 0.06 31.3 11-2
Level-1 TDS 12/17/2018 mg/L Source Well SCH14 10 341 11-8
Level-1 TDS 12/17/2018 mg/L Source Well SCH1 10 342 11-1
Level-1Total Organic Carbon
(TOC)12/17/2018 mg/L Source Well CC11 0.09 4.45 3-5
Level-1 Conductivity 12/17/2018 umhos/cm Source Well CY4 1 418 6-1
Level-1 Conductivity 12/17/2018 umhos/cm Source Well SCH8 1 483 11-2
Level-1 Conductivity 12/17/2018 umhos/cm Source Well CC1 1 485 3-1
Appendix I: Water Supply Contract I-10
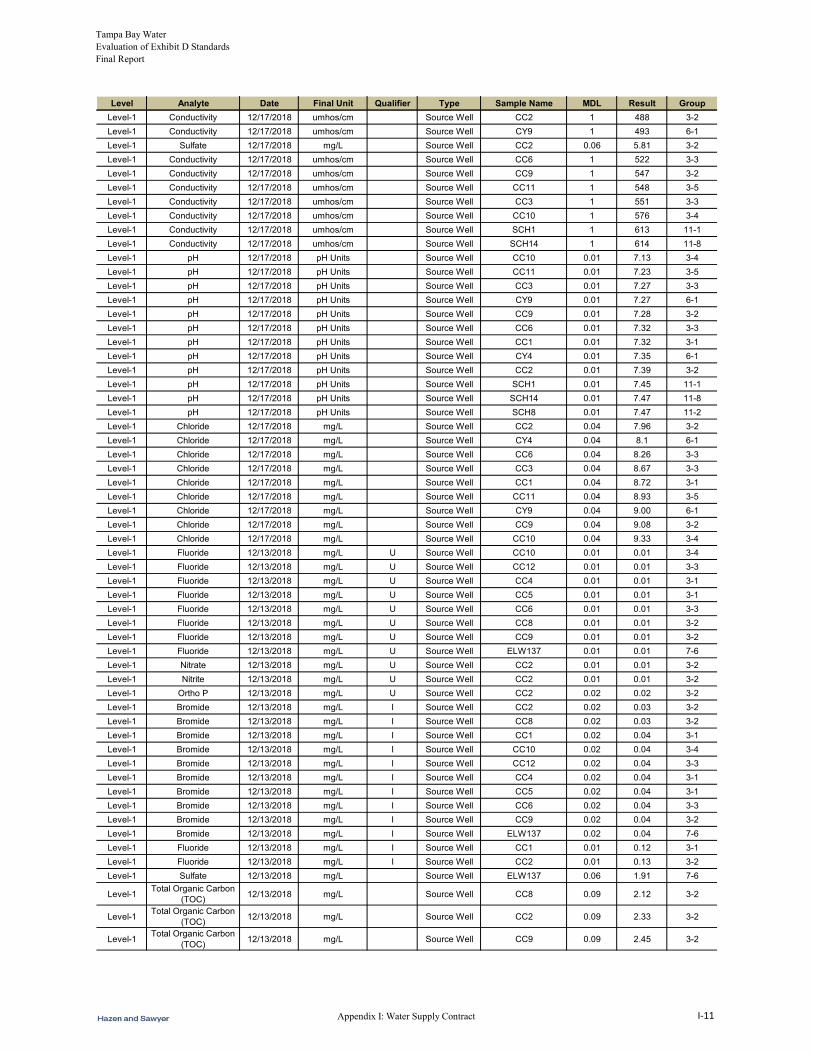
Tampa Bay Water Evaluation of Exhibit D Standards Final Report
Level Analyte Date Final Unit Qualifier Type Sample Name MDL Result Group
Level-1 Conductivity 12/17/2018 umhos/cm Source Well CC2 1 488 3-2
Level-1 Conductivity 12/17/2018 umhos/cm Source Well CY9 1 493 6-1
Level-1 Sulfate 12/17/2018 mg/L Source Well CC2 0.06 5.81 3-2
Level-1 Conductivity 12/17/2018 umhos/cm Source Well CC6 1 522 3-3
Level-1 Conductivity 12/17/2018 umhos/cm Source Well CC9 1 547 3-2
Level-1 Conductivity 12/17/2018 umhos/cm Source Well CC11 1 548 3-5
Level-1 Conductivity 12/17/2018 umhos/cm Source Well CC3 1 551 3-3
Level-1 Conductivity 12/17/2018 umhos/cm Source Well CC10 1 576 3-4
Level-1 Conductivity 12/17/2018 umhos/cm Source Well SCH1 1 613 11-1
Level-1 Conductivity 12/17/2018 umhos/cm Source Well SCH14 1 614 11-8
Level-1 pH 12/17/2018 pH Units Source Well CC10 0.01 7.13 3-4
Level-1 pH 12/17/2018 pH Units Source Well CC11 0.01 7.23 3-5
Level-1 pH 12/17/2018 pH Units Source Well CC3 0.01 7.27 3-3
Level-1 pH 12/17/2018 pH Units Source Well CY9 0.01 7.27 6-1
Level-1 pH 12/17/2018 pH Units Source Well CC9 0.01 7.28 3-2
Level-1 pH 12/17/2018 pH Units Source Well CC6 0.01 7.32 3-3
Level-1 pH 12/17/2018 pH Units Source Well CC1 0.01 7.32 3-1
Level-1 pH 12/17/2018 pH Units Source Well CY4 0.01 7.35 6-1
Level-1 pH 12/17/2018 pH Units Source Well CC2 0.01 7.39 3-2
Level-1 pH 12/17/2018 pH Units Source Well SCH1 0.01 7.45 11-1
Level-1 pH 12/17/2018 pH Units Source Well SCH14 0.01 7.47 11-8
Level-1 pH 12/17/2018 pH Units Source Well SCH8 0.01 7.47 11-2
Level-1 Chloride 12/17/2018 mg/L Source Well CC2 0.04 7.96 3-2
Level-1 Chloride 12/17/2018 mg/L Source Well CY4 0.04 8.1 6-1
Level-1 Chloride 12/17/2018 mg/L Source Well CC6 0.04 8.26 3-3
Level-1 Chloride 12/17/2018 mg/L Source Well CC3 0.04 8.67 3-3
Level-1 Chloride 12/17/2018 mg/L Source Well CC1 0.04 8.72 3-1
Level-1 Chloride 12/17/2018 mg/L Source Well CC11 0.04 8.93 3-5
Level-1 Chloride 12/17/2018 mg/L Source Well CY9 0.04 9.00 6-1
Level-1 Chloride 12/17/2018 mg/L Source Well CC9 0.04 9.08 3-2
Level-1 Chloride 12/17/2018 mg/L Source Well CC10 0.04 9.33 3-4
Level-1 Fluoride 12/13/2018 mg/L U Source Well CC10 0.01 0.01 3-4
Level-1 Fluoride 12/13/2018 mg/L U Source Well CC12 0.01 0.01 3-3
Level-1 Fluoride 12/13/2018 mg/L U Source Well CC4 0.01 0.01 3-1
Level-1 Fluoride 12/13/2018 mg/L U Source Well CC5 0.01 0.01 3-1
Level-1 Fluoride 12/13/2018 mg/L U Source Well CC6 0.01 0.01 3-3
Level-1 Fluoride 12/13/2018 mg/L U Source Well CC8 0.01 0.01 3-2
Level-1 Fluoride 12/13/2018 mg/L U Source Well CC9 0.01 0.01 3-2
Level-1 Fluoride 12/13/2018 mg/L U Source Well ELW137 0.01 0.01 7-6
Level-1 Nitrate 12/13/2018 mg/L U Source Well CC2 0.01 0.01 3-2
Level-1 Nitrite 12/13/2018 mg/L U Source Well CC2 0.01 0.01 3-2
Level-1 Ortho P 12/13/2018 mg/L U Source Well CC2 0.02 0.02 3-2
Level-1 Bromide 12/13/2018 mg/L I Source Well CC2 0.02 0.03 3-2
Level-1 Bromide 12/13/2018 mg/L I Source Well CC8 0.02 0.03 3-2
Level-1 Bromide 12/13/2018 mg/L I Source Well CC1 0.02 0.04 3-1
Level-1 Bromide 12/13/2018 mg/L I Source Well CC10 0.02 0.04 3-4
Level-1 Bromide 12/13/2018 mg/L I Source Well CC12 0.02 0.04 3-3
Level-1 Bromide 12/13/2018 mg/L I Source Well CC4 0.02 0.04 3-1
Level-1 Bromide 12/13/2018 mg/L I Source Well CC5 0.02 0.04 3-1
Level-1 Bromide 12/13/2018 mg/L I Source Well CC6 0.02 0.04 3-3
Level-1 Bromide 12/13/2018 mg/L I Source Well CC9 0.02 0.04 3-2
Level-1 Bromide 12/13/2018 mg/L I Source Well ELW137 0.02 0.04 7-6
Level-1 Fluoride 12/13/2018 mg/L I Source Well CC1 0.01 0.12 3-1
Level-1 Fluoride 12/13/2018 mg/L I Source Well CC2 0.01 0.13 3-2
Level-1 Sulfate 12/13/2018 mg/L Source Well ELW137 0.06 1.91 7-6
Level-1Total Organic Carbon
(TOC)12/13/2018 mg/L Source Well CC8 0.09 2.12 3-2
Level-1Total Organic Carbon
(TOC)12/13/2018 mg/L Source Well CC2 0.09 2.33 3-2
Level-1Total Organic Carbon
(TOC)12/13/2018 mg/L Source Well CC9 0.09 2.45 3-2
Appendix I: Water Supply Contract I-11

Tampa Bay Water Evaluation of Exhibit D Standards Final Report
Level Analyte Date Final Unit Qualifier Type Sample Name MDL Result Group
Level-1Total Organic Carbon
(TOC)12/13/2018 mg/L Source Well CC1 0.09 2.59 3-1
Level-1Total Organic Carbon
(TOC)12/13/2018 mg/L Source Well CC5 0.09 2.81 3-1
Level-1 Temperature 12/13/2018 oC Source Well CC12 0.1 23.2 3-3
Level-1 Sulfate 12/13/2018 mg/L Source Well CC12 0.06 24.4 3-3
Level-1 Sulfate 12/13/2018 mg/L Source Well CC5 0.06 24.9 3-1
Level-1 Sulfate 12/13/2018 mg/L Source Well CC10 0.06 25.7 3-4
Level-1 Sulfate 12/13/2018 mg/L Source Well CC4 0.06 25.9 3-1
Level-1 Sulfate 12/13/2018 mg/L Source Well CC9 0.06 28.4 3-2
Level-1 TDS 12/13/2018 mg/L Source Well CC12 10 283 3-3
Level-1Total Organic Carbon
(TOC)12/13/2018 mg/L Source Well CC6 0.09 3.1 3-3
Level-1Total Organic Carbon
(TOC)12/13/2018 mg/L Source Well CC4 0.09 3.25 3-1
Level-1 Sulfate 12/13/2018 mg/L Source Well CC1 0.06 3.31 3-1
Level-1Total Organic Carbon
(TOC)12/13/2018 mg/L Source Well CC10 0.09 3.71 3-4
Level-1Total Organic Carbon
(TOC)12/13/2018 mg/L Source Well CC12 0.09 3.88 3-3
Level-1 Sulfate 12/13/2018 mg/L Source Well CC8 0.06 38.4 3-2
Level-1Total Organic Carbon
(TOC)12/13/2018 mg/L Source Well ELW137 0.09 4.29 7-6
Level-1 Conductivity 12/13/2018 umhos/cm Source Well ELW137 1 440 7-6
Level-1 Conductivity 12/13/2018 umhos/cm Source Well CC1 1 487 3-1
Level-1 Conductivity 12/13/2018 umhos/cm Source Well CC2 1 491 3-2
Level-1 Sulfate 12/13/2018 mg/L Source Well CC2 0.06 5.99 3-2
Level-1 Conductivity 12/13/2018 umhos/cm Source Well CC6 1 525 3-3
Level-1 Conductivity 12/13/2018 umhos/cm Source Well CC5 1 552 3-1
Level-1 Conductivity 12/13/2018 umhos/cm Source Well CC9 1 554 3-2
Level-1 Conductivity 12/13/2018 umhos/cm Source Well CC8 1 562 3-2
Level-1 Conductivity 12/13/2018 umhos/cm Source Well CC10 1 564 3-4
Level-1 Conductivity 12/13/2018 umhos/cm Source Well CC4 1 573 3-1
Level-1 Conductivity 12/13/2018 umhos/cm Source Well CC12 1 589 3-3
Level-1 pH 12/13/2018 pH Units Source Well CC12 0.01 7.19 3-3
Level-1 pH 12/13/2018 pH Units Source Well CC10 0.01 7.25 3-4
Level-1 pH 12/13/2018 pH Units Source Well CC4 0.01 7.27 3-1
Level-1 pH 12/13/2018 pH Units Source Well CC5 0.01 7.28 3-1
Level-1 pH 12/13/2018 pH Units Source Well CC1 0.01 7.3 3-1
Level-1 pH 12/13/2018 pH Units Source Well CC6 0.01 7.34 3-3
Level-1 pH 12/13/2018 pH Units Source Well CC9 0.01 7.34 3-2
Level-1 pH 12/13/2018 pH Units Source Well CC8 0.01 7.35 3-2
Level-1 pH 12/13/2018 pH Units Source Well CC2 0.01 7.4 3-2
Level-1 pH 12/13/2018 pH Units Source Well ELW137 0.01 7.43 7-6
Level-1 Chloride 12/13/2018 mg/L Source Well CC2 0.04 7.96 3-2
Level-1 Chloride 12/13/2018 mg/L Source Well CC8 0.04 8.24 3-2
Level-1 Chloride 12/13/2018 mg/L Source Well CC6 0.04 8.33 3-3
Level-1 Chloride 12/13/2018 mg/L Source Well CC5 0.04 8.4 3-1
Level-1 Chloride 12/13/2018 mg/L Source Well CC1 0.04 8.72 3-1
Level-1 Chloride 12/13/2018 mg/L Source Well CC4 0.04 8.9 3-1
Level-1 Chloride 12/13/2018 mg/L Source Well CC10 0.04 9.00 3-4
Level-1 Chloride 12/13/2018 mg/L Source Well CC9 0.04 9.21 3-2
Level-1 Chloride 12/13/2018 mg/L Source Well ELW137 0.04 9.36 7-6
Level-1 Sulfate 12/13/2018 mg/L Source Well CC6 0.06 9.54 3-3
Level-1 Chloride 12/13/2018 mg/L Source Well CC12 0.04 9.9 3-3
Level-1 Bromide 12/12/2018 mg/L I Source Well CB12 0.02 0.02 2-6
Level-1 Bromide 12/12/2018 mg/L I Source Well CB16 0.02 0.02 2-4
Level-1 Bromide 12/12/2018 mg/L I Source Well CB17 0.02 0.02 2-3
Level-1 Bromide 12/12/2018 mg/L I Source Well CB11 0.02 0.03 2-5
Level-1 Bromide 12/12/2018 mg/L I Source Well CB13 0.02 0.03 2-5
Level-1 Bromide 12/12/2018 mg/L I Source Well CB15 0.02 0.03 2-7
Level-1 Bromide 12/12/2018 mg/L I Source Well CB4 0.02 0.03 2-1
Level-1 Bromide 12/12/2018 mg/L I Source Well CB5 0.02 0.03 2-1
Appendix I: Water Supply Contract I-12
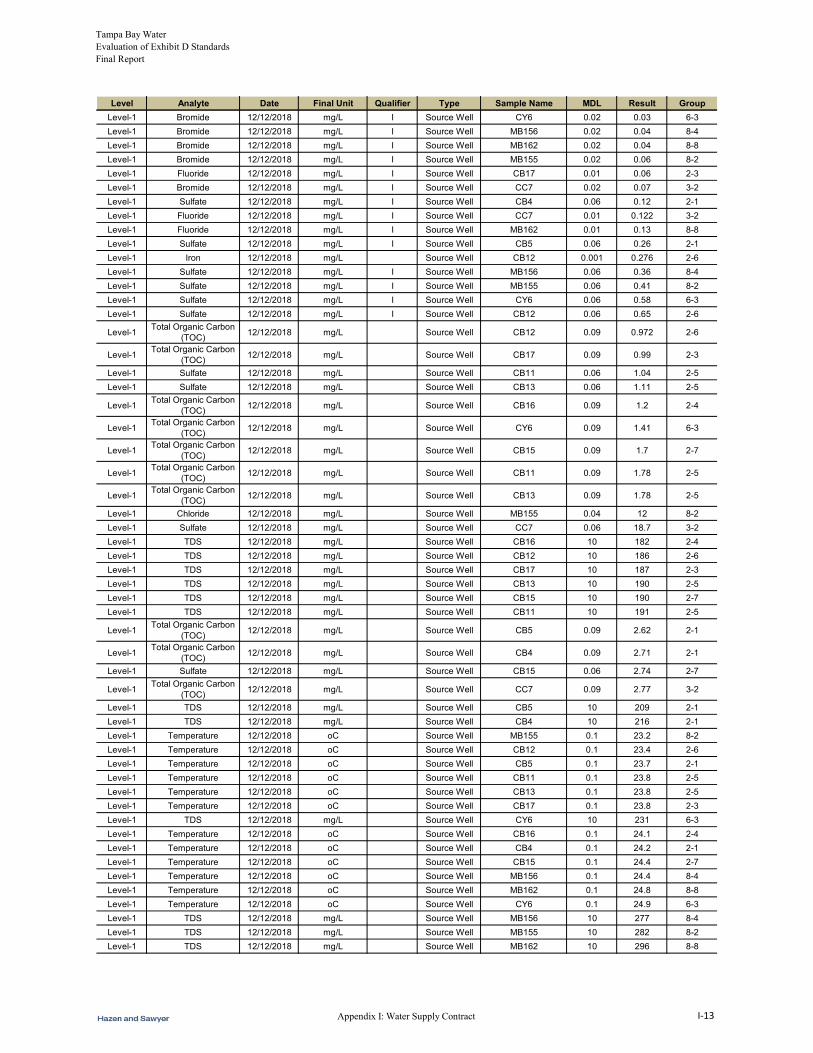
Tampa Bay Water Evaluation of Exhibit D Standards Final Report
Level Analyte Date Final Unit Qualifier Type Sample Name MDL Result Group
Level-1 Bromide 12/12/2018 mg/L I Source Well CY6 0.02 0.03 6-3
Level-1 Bromide 12/12/2018 mg/L I Source Well MB156 0.02 0.04 8-4
Level-1 Bromide 12/12/2018 mg/L I Source Well MB162 0.02 0.04 8-8
Level-1 Bromide 12/12/2018 mg/L I Source Well MB155 0.02 0.06 8-2
Level-1 Fluoride 12/12/2018 mg/L I Source Well CB17 0.01 0.06 2-3
Level-1 Bromide 12/12/2018 mg/L I Source Well CC7 0.02 0.07 3-2
Level-1 Sulfate 12/12/2018 mg/L I Source Well CB4 0.06 0.12 2-1
Level-1 Fluoride 12/12/2018 mg/L I Source Well CC7 0.01 0.122 3-2
Level-1 Fluoride 12/12/2018 mg/L I Source Well MB162 0.01 0.13 8-8
Level-1 Sulfate 12/12/2018 mg/L I Source Well CB5 0.06 0.26 2-1
Level-1 Iron 12/12/2018 mg/L Source Well CB12 0.001 0.276 2-6
Level-1 Sulfate 12/12/2018 mg/L I Source Well MB156 0.06 0.36 8-4
Level-1 Sulfate 12/12/2018 mg/L I Source Well MB155 0.06 0.41 8-2
Level-1 Sulfate 12/12/2018 mg/L I Source Well CY6 0.06 0.58 6-3
Level-1 Sulfate 12/12/2018 mg/L I Source Well CB12 0.06 0.65 2-6
Level-1Total Organic Carbon
(TOC)12/12/2018 mg/L Source Well CB12 0.09 0.972 2-6
Level-1Total Organic Carbon
(TOC)12/12/2018 mg/L Source Well CB17 0.09 0.99 2-3
Level-1 Sulfate 12/12/2018 mg/L Source Well CB11 0.06 1.04 2-5
Level-1 Sulfate 12/12/2018 mg/L Source Well CB13 0.06 1.11 2-5
Level-1Total Organic Carbon
(TOC)12/12/2018 mg/L Source Well CB16 0.09 1.2 2-4
Level-1Total Organic Carbon
(TOC)12/12/2018 mg/L Source Well CY6 0.09 1.41 6-3
Level-1Total Organic Carbon
(TOC)12/12/2018 mg/L Source Well CB15 0.09 1.7 2-7
Level-1Total Organic Carbon
(TOC)12/12/2018 mg/L Source Well CB11 0.09 1.78 2-5
Level-1Total Organic Carbon
(TOC)12/12/2018 mg/L Source Well CB13 0.09 1.78 2-5
Level-1 Chloride 12/12/2018 mg/L Source Well MB155 0.04 12 8-2
Level-1 Sulfate 12/12/2018 mg/L Source Well CC7 0.06 18.7 3-2
Level-1 TDS 12/12/2018 mg/L Source Well CB16 10 182 2-4
Level-1 TDS 12/12/2018 mg/L Source Well CB12 10 186 2-6
Level-1 TDS 12/12/2018 mg/L Source Well CB17 10 187 2-3
Level-1 TDS 12/12/2018 mg/L Source Well CB13 10 190 2-5
Level-1 TDS 12/12/2018 mg/L Source Well CB15 10 190 2-7
Level-1 TDS 12/12/2018 mg/L Source Well CB11 10 191 2-5
Level-1Total Organic Carbon
(TOC)12/12/2018 mg/L Source Well CB5 0.09 2.62 2-1
Level-1Total Organic Carbon
(TOC)12/12/2018 mg/L Source Well CB4 0.09 2.71 2-1
Level-1 Sulfate 12/12/2018 mg/L Source Well CB15 0.06 2.74 2-7
Level-1Total Organic Carbon
(TOC)12/12/2018 mg/L Source Well CC7 0.09 2.77 3-2
Level-1 TDS 12/12/2018 mg/L Source Well CB5 10 209 2-1
Level-1 TDS 12/12/2018 mg/L Source Well CB4 10 216 2-1
Level-1 Temperature 12/12/2018 oC Source Well MB155 0.1 23.2 8-2
Level-1 Temperature 12/12/2018 oC Source Well CB12 0.1 23.4 2-6
Level-1 Temperature 12/12/2018 oC Source Well CB5 0.1 23.7 2-1
Level-1 Temperature 12/12/2018 oC Source Well CB11 0.1 23.8 2-5
Level-1 Temperature 12/12/2018 oC Source Well CB13 0.1 23.8 2-5
Level-1 Temperature 12/12/2018 oC Source Well CB17 0.1 23.8 2-3
Level-1 TDS 12/12/2018 mg/L Source Well CY6 10 231 6-3
Level-1 Temperature 12/12/2018 oC Source Well CB16 0.1 24.1 2-4
Level-1 Temperature 12/12/2018 oC Source Well CB4 0.1 24.2 2-1
Level-1 Temperature 12/12/2018 oC Source Well CB15 0.1 24.4 2-7
Level-1 Temperature 12/12/2018 oC Source Well MB156 0.1 24.4 8-4
Level-1 Temperature 12/12/2018 oC Source Well MB162 0.1 24.8 8-8
Level-1 Temperature 12/12/2018 oC Source Well CY6 0.1 24.9 6-3
Level-1 TDS 12/12/2018 mg/L Source Well MB156 10 277 8-4
Level-1 TDS 12/12/2018 mg/L Source Well MB155 10 282 8-2
Level-1 TDS 12/12/2018 mg/L Source Well MB162 10 296 8-8
Appendix I: Water Supply Contract I-13

Tampa Bay Water Evaluation of Exhibit D Standards Final Report
Level Analyte Date Final Unit Qualifier Type Sample Name MDL Result Group
Level-1 Sulfate 12/12/2018 mg/L Source Well CB17 0.06 3.43 2-3
Level-1Total Organic Carbon
(TOC)12/12/2018 mg/L Source Well MB162 0.09 3.56 8-8
Level-1Total Organic Carbon
(TOC)12/12/2018 mg/L Source Well MB156 0.09 3.61 8-4
Level-1 Conductivity 12/12/2018 umhos/cm Source Well CB17 1 383 2-3
Level-1 Sulfate 12/12/2018 mg/L Source Well MB162 0.06 4.01 8-8
Level-1 Conductivity 12/12/2018 umhos/cm Source Well CB16 1 401 2-4
Level-1 Conductivity 12/12/2018 umhos/cm Source Well CB13 1 403 2-5
Level-1 Conductivity 12/12/2018 umhos/cm Source Well CB12 1 408 2-6
Level-1 Conductivity 12/12/2018 umhos/cm Source Well CB15 1 410 2-7
Level-1 Conductivity 12/12/2018 umhos/cm Source Well CB11 1 413 2-5
Level-1 Conductivity 12/12/2018 umhos/cm Source Well CB5 1 430 2-1
Level-1 Conductivity 12/12/2018 umhos/cm Source Well CB4 1 449 2-1
Level-1 Conductivity 12/12/2018 umhos/cm Source Well CY6 1 495 6-3
Level-1Total Organic Carbon
(TOC)12/12/2018 mg/L Source Well MB155 0.09 5.33 8-2
Level-1 Chloride 12/12/2018 mg/L Source Well CB17 0.04 5.44 2-3
Level-1 Chloride 12/12/2018 mg/L Source Well CB12 0.04 5.67 2-6
Level-1 Conductivity 12/12/2018 umhos/cm Source Well CC7 1 531 3-2
Level-1 Conductivity 12/12/2018 umhos/cm Source Well MB155 1 563 8-2
Level-1 Conductivity 12/12/2018 umhos/cm Source Well MB156 1 591 8-4
Level-1 Chloride 12/12/2018 mg/L Source Well CB16 0.04 6.2 2-4
Level-1 Chloride 12/12/2018 mg/L Source Well CB13 0.04 6.23 2-5
Level-1 Chloride 12/12/2018 mg/L Source Well CB15 0.04 6.4 2-7
Level-1 Chloride 12/12/2018 mg/L Source Well CB11 0.04 6.53 2-5
Level-1 Chloride 12/12/2018 mg/L Source Well CB4 0.04 6.95 2-1
Level-1 Sulfate 12/12/2018 mg/L Source Well CB16 0.06 6.99 2-4
Level-1 Conductivity 12/12/2018 umhos/cm Source Well MB162 1 615 8-8
Level-1 Chloride 12/12/2018 mg/L Source Well CB5 0.04 7.06 2-1
Level-1 pH 12/12/2018 pH Units Source Well MB155 0.01 7.06 8-2
Level-1 pH 12/12/2018 pH Units Source Well MB156 0.01 7.19 8-4
Level-1 pH 12/12/2018 pH Units Source Well CB4 0.01 7.23 2-1
Level-1 pH 12/12/2018 pH Units Source Well MB162 0.01 7.23 8-8
Level-1 pH 12/12/2018 pH Units Source Well CB5 0.01 7.27 2-1
Level-1 pH 12/12/2018 pH Units Source Well CY6 0.01 7.32 6-3
Level-1 pH 12/12/2018 pH Units Source Well CC7 0.01 7.33 3-2
Level-1 pH 12/12/2018 pH Units Source Well CB12 0.01 7.35 2-6
Level-1 pH 12/12/2018 pH Units Source Well CB13 0.01 7.36 2-5
Level-1 pH 12/12/2018 pH Units Source Well CB11 0.01 7.42 2-5
Level-1 pH 12/12/2018 pH Units Source Well CB16 0.01 7.44 2-4
Level-1 pH 12/12/2018 pH Units Source Well CB15 0.01 7.58 2-7
Level-1 pH 12/12/2018 pH Units Source Well CB17 0.01 7.63 2-3
Level-1 Chloride 12/12/2018 mg/L Source Well CC7 0.04 7.92 3-2
Level-1 Chloride 12/12/2018 mg/L Source Well MB156 0.04 8.9 8-4
Level-1 Chloride 12/12/2018 mg/L Source Well MB162 0.04 9.36 8-8
Level-1 Chloride 12/12/2018 mg/L Source Well CY6 0.04 9.67 6-3
Level-1 Bromide 12/11/2018 mg/L I Source Well MB158 0.02 0.08 8-5
Level-1 Bromide 12/11/2018 mg/L I Source Well MB167 0.02 0.08 8-11
Level-1 Fluoride 12/11/2018 mg/L I Source Well MB158 0.01 0.119 8-5
Level-1 Fluoride 12/11/2018 mg/L I Source Well MB167 0.01 0.133 8-11
Level-1Total Organic Carbon
(TOC)12/11/2018 mg/L Source Well MB158 0.09 2.43 8-5
Level-1Total Organic Carbon
(TOC)12/11/2018 mg/L Source Well MB167 0.09 2.94 8-11
Level-1 Sulfate 12/11/2018 mg/L Source Well MB158 0.06 3.38 8-5
Level-1 Conductivity 12/11/2018 umhos/cm Source Well MB158 1 590 8-5
Level-1 Conductivity 12/11/2018 umhos/cm Source Well MB167 1 598 8-11
Level-1 pH 12/11/2018 pH Units Source Well MB167 0.01 7.21 8-11
Level-1 pH 12/11/2018 pH Units Source Well MB158 0.01 7.24 8-5
Level-1 Chloride 12/11/2018 mg/L Source Well MB158 0.04 8.74 8-5
Level-1 Sulfate 12/11/2018 mg/L Source Well MB167 0.06 9.34 8-11
Appendix I: Water Supply Contract I-14
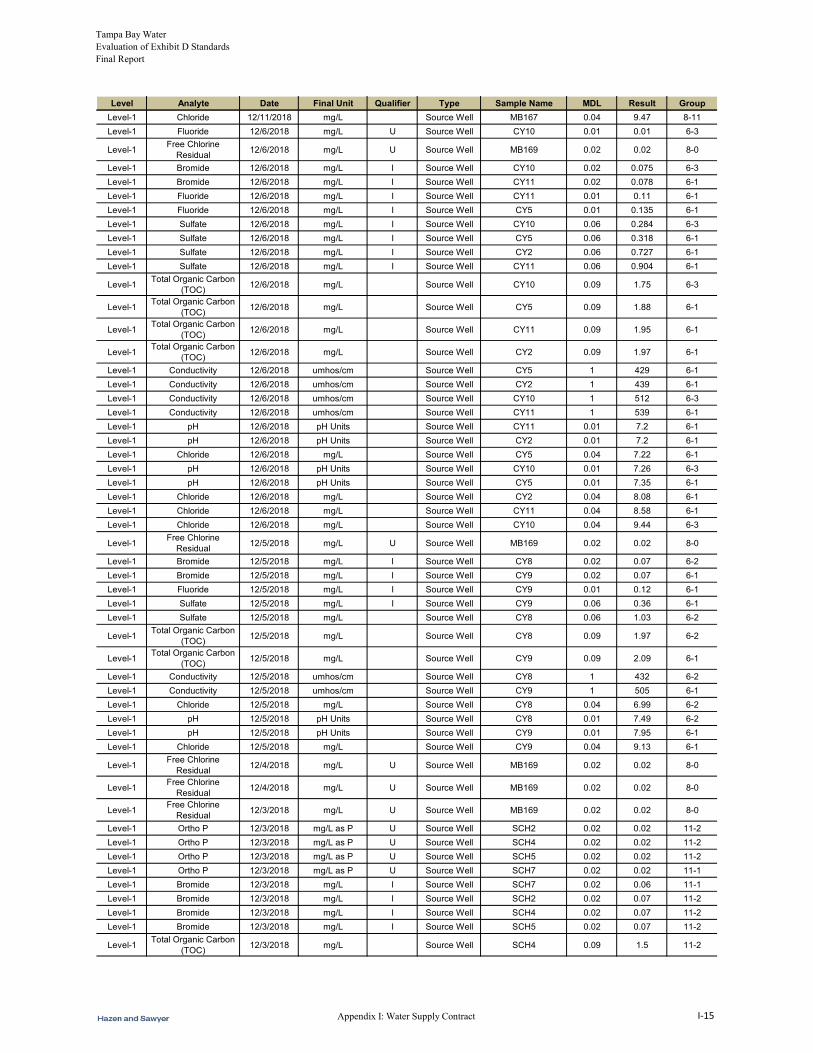
Tampa Bay Water Evaluation of Exhibit D Standards Final Report
Level Analyte Date Final Unit Qualifier Type Sample Name MDL Result Group
Level-1 Chloride 12/11/2018 mg/L Source Well MB167 0.04 9.47 8-11
Level-1 Fluoride 12/6/2018 mg/L U Source Well CY10 0.01 0.01 6-3
Level-1Free Chlorine
Residual12/6/2018 mg/L U Source Well MB169 0.02 0.02 8-0
Level-1 Bromide 12/6/2018 mg/L I Source Well CY10 0.02 0.075 6-3
Level-1 Bromide 12/6/2018 mg/L I Source Well CY11 0.02 0.078 6-1
Level-1 Fluoride 12/6/2018 mg/L I Source Well CY11 0.01 0.11 6-1
Level-1 Fluoride 12/6/2018 mg/L I Source Well CY5 0.01 0.135 6-1
Level-1 Sulfate 12/6/2018 mg/L I Source Well CY10 0.06 0.284 6-3
Level-1 Sulfate 12/6/2018 mg/L I Source Well CY5 0.06 0.318 6-1
Level-1 Sulfate 12/6/2018 mg/L I Source Well CY2 0.06 0.727 6-1
Level-1 Sulfate 12/6/2018 mg/L I Source Well CY11 0.06 0.904 6-1
Level-1Total Organic Carbon
(TOC)12/6/2018 mg/L Source Well CY10 0.09 1.75 6-3
Level-1Total Organic Carbon
(TOC)12/6/2018 mg/L Source Well CY5 0.09 1.88 6-1
Level-1Total Organic Carbon
(TOC)12/6/2018 mg/L Source Well CY11 0.09 1.95 6-1
Level-1Total Organic Carbon
(TOC)12/6/2018 mg/L Source Well CY2 0.09 1.97 6-1
Level-1 Conductivity 12/6/2018 umhos/cm Source Well CY5 1 429 6-1
Level-1 Conductivity 12/6/2018 umhos/cm Source Well CY2 1 439 6-1
Level-1 Conductivity 12/6/2018 umhos/cm Source Well CY10 1 512 6-3
Level-1 Conductivity 12/6/2018 umhos/cm Source Well CY11 1 539 6-1
Level-1 pH 12/6/2018 pH Units Source Well CY11 0.01 7.2 6-1
Level-1 pH 12/6/2018 pH Units Source Well CY2 0.01 7.2 6-1
Level-1 Chloride 12/6/2018 mg/L Source Well CY5 0.04 7.22 6-1
Level-1 pH 12/6/2018 pH Units Source Well CY10 0.01 7.26 6-3
Level-1 pH 12/6/2018 pH Units Source Well CY5 0.01 7.35 6-1
Level-1 Chloride 12/6/2018 mg/L Source Well CY2 0.04 8.08 6-1
Level-1 Chloride 12/6/2018 mg/L Source Well CY11 0.04 8.58 6-1
Level-1 Chloride 12/6/2018 mg/L Source Well CY10 0.04 9.44 6-3
Level-1Free Chlorine
Residual12/5/2018 mg/L U Source Well MB169 0.02 0.02 8-0
Level-1 Bromide 12/5/2018 mg/L I Source Well CY8 0.02 0.07 6-2
Level-1 Bromide 12/5/2018 mg/L I Source Well CY9 0.02 0.07 6-1
Level-1 Fluoride 12/5/2018 mg/L I Source Well CY9 0.01 0.12 6-1
Level-1 Sulfate 12/5/2018 mg/L I Source Well CY9 0.06 0.36 6-1
Level-1 Sulfate 12/5/2018 mg/L Source Well CY8 0.06 1.03 6-2
Level-1Total Organic Carbon
(TOC)12/5/2018 mg/L Source Well CY8 0.09 1.97 6-2
Level-1Total Organic Carbon
(TOC)12/5/2018 mg/L Source Well CY9 0.09 2.09 6-1
Level-1 Conductivity 12/5/2018 umhos/cm Source Well CY8 1 432 6-2
Level-1 Conductivity 12/5/2018 umhos/cm Source Well CY9 1 505 6-1
Level-1 Chloride 12/5/2018 mg/L Source Well CY8 0.04 6.99 6-2
Level-1 pH 12/5/2018 pH Units Source Well CY8 0.01 7.49 6-2
Level-1 pH 12/5/2018 pH Units Source Well CY9 0.01 7.95 6-1
Level-1 Chloride 12/5/2018 mg/L Source Well CY9 0.04 9.13 6-1
Level-1Free Chlorine
Residual12/4/2018 mg/L U Source Well MB169 0.02 0.02 8-0
Level-1Free Chlorine
Residual12/4/2018 mg/L U Source Well MB169 0.02 0.02 8-0
Level-1Free Chlorine
Residual12/3/2018 mg/L U Source Well MB169 0.02 0.02 8-0
Level-1 Ortho P 12/3/2018 mg/L as P U Source Well SCH2 0.02 0.02 11-2
Level-1 Ortho P 12/3/2018 mg/L as P U Source Well SCH4 0.02 0.02 11-2
Level-1 Ortho P 12/3/2018 mg/L as P U Source Well SCH5 0.02 0.02 11-2
Level-1 Ortho P 12/3/2018 mg/L as P U Source Well SCH7 0.02 0.02 11-1
Level-1 Bromide 12/3/2018 mg/L I Source Well SCH7 0.02 0.06 11-1
Level-1 Bromide 12/3/2018 mg/L I Source Well SCH2 0.02 0.07 11-2
Level-1 Bromide 12/3/2018 mg/L I Source Well SCH4 0.02 0.07 11-2
Level-1 Bromide 12/3/2018 mg/L I Source Well SCH5 0.02 0.07 11-2
Level-1Total Organic Carbon
(TOC)12/3/2018 mg/L Source Well SCH4 0.09 1.5 11-2
Appendix I: Water Supply Contract I-15

Tampa Bay Water Evaluation of Exhibit D Standards Final Report
Level Analyte Date Final Unit Qualifier Type Sample Name MDL Result Group
Level-1Total Organic Carbon
(TOC)12/3/2018 mg/L Source Well SCH2 0.09 1.64 11-2
Level-1Total Organic Carbon
(TOC)12/3/2018 mg/L Source Well SCH7 0.09 1.72 11-1
Level-1Total Organic Carbon
(TOC)12/3/2018 mg/L Source Well SCH5 0.09 1.74 11-2
Level-1 TDS 12/3/2018 mg/L Source Well SCH7 10 256 11-1
Level-1 Temperature 12/3/2018 oC Source Well SCH4 0.1 26 11-2
Level-1 Temperature 12/3/2018 oC Source Well SCH5 0.1 26.1 11-2
Level-1 Temperature 12/3/2018 oC Source Well SCH2 0.1 26.5 11-2
Level-1 Temperature 12/3/2018 oC Source Well SCH7 0.1 26.7 11-1
Level-1 TDS 12/3/2018 mg/L Source Well SCH2 10 309 11-2
Level-1 TDS 12/3/2018 mg/L Source Well SCH5 10 323 11-2
Level-1 TDS 12/3/2018 mg/L Source Well SCH4 10 378 11-2
Level-1 Conductivity 12/3/2018 umhos/cm Source Well SCH7 1 512 11-1
Level-1 Conductivity 12/3/2018 umhos/cm Source Well SCH2 1 573 11-2
Level-1 Conductivity 12/3/2018 umhos/cm Source Well SCH5 1 602 11-2
Level-1 Conductivity 12/3/2018 umhos/cm Source Well SCH4 1 666 11-2
Level-1 pH 12/3/2018 pH Units Source Well SCH4 0.01 7.43 11-2
Level-1 pH 12/3/2018 pH Units Source Well SCH5 0.01 7.44 11-2
Level-1 pH 12/3/2018 pH Units Source Well SCH7 0.01 7.47 11-1
Level-1 pH 12/3/2018 pH Units Source Well SCH2 0.01 7.49 11-2
Level-1Free Chlorine
Residual11/29/2018 mg/L U Source Well MB169 0.02 0.02 8-0
Level-1 Ortho P 11/29/2018 mg/L as P U Source Well SCH10 0.02 0.02 11-2
Level-1 Ortho P 11/29/2018 mg/L as P U Source Well SCH13 0.02 0.02 11-7
Level-1 Ortho P 11/29/2018 mg/L as P U Source Well SCH15 0.02 0.02 11-7
Level-1 Bromide 11/29/2018 mg/L I Source Well SCH13 0.02 0.08 11-7
Level-1 Bromide 11/29/2018 mg/L I Source Well SCH15 0.02 0.08 11-7
Level-1 Bromide 11/29/2018 mg/L I Source Well SCH10 0.02 0.099 11-2
Level-1TOTAL COLIFORM
MF11/29/2018 P or A/100mL U Source Well MB158 1 1 8-5
Level-1TOTAL COLIFORM
MF11/29/2018 P or A/100mL U Source Well MB167 1 1 8-11
Level-1Total Organic Carbon
(TOC)11/29/2018 mg/L Source Well SCH15 0.09 1.55 11-7
Level-1Total Organic Carbon
(TOC)11/29/2018 mg/L Source Well SCH13 0.09 1.63 11-7
Level-1Total Organic Carbon
(TOC)11/29/2018 mg/L Source Well SCH10 0.09 1.76 11-2
Level-1 TDS 11/29/2018 mg/L Source Well SCH10 10 224 11-2
Level-1 TDS 11/29/2018 mg/L Source Well SCH15 10 228 11-7
Level-1 TDS 11/29/2018 mg/L Source Well SCH13 10 249 11-7
Level-1 Temperature 11/29/2018 oC Source Well SCH10 0.1 25.6 11-2
Level-1 Temperature 11/29/2018 oC Source Well SCH13 0.1 26.3 11-7
Level-1 Temperature 11/29/2018 oC Source Well SCH15 0.1 26.6 11-7
Level-1 Conductivity 11/29/2018 umhos/cm Source Well SCH10 1 442 11-2
Level-1 Conductivity 11/29/2018 umhos/cm Source Well SCH15 1 454 11-7
Level-1 Conductivity 11/29/2018 umhos/cm Source Well SCH13 1 479 11-7
Level-1 pH 11/29/2018 pH Units Source Well SCH10 0.01 7.49 11-2
Level-1 pH 11/29/2018 pH Units Source Well SCH13 0.01 7.53 11-7
Level-1 pH 11/29/2018 pH Units Source Well SCH15 0.01 7.54 11-7
Level-1 Bromate 11/28/2018 mg/L U Source Well ST10 0.00039 2.82 13-4
Level-1 Bromate 11/28/2018 mg/L U Source Well ST4 0.00039 2.51 13-4
Level-1 Chlorate 11/28/2018 mg/L U Source Well ST7 0.0004 3.11 13-4
Level-1 Chlorate 11/28/2018 mg/L U Source Well ST8 0.0004 2.38 13-4
Level-1 Chlorite 11/28/2018 mg/L U Source Well ST9 0.00047 3.77 13-5
Level-1 Chlorite 11/28/2018 mg/L U Source Well ST10 0.00047 0.00047 13-4
Level-1 Nitrate 11/28/2018 mg/L as N U Source Well ELW106 0.01 0.01 7-1
Level-1 Nitrate 11/28/2018 mg/L as N U Source Well ELW107 0.01 0.01 7-1
Level-1 Nitrate 11/28/2018 mg/L as N U Source Well ELW136 0.01 0.01 7-12
Level-1 Nitrite 11/28/2018 mg/L as N U Source Well ELW106 0.01 0.01 7-1
Level-1 Nitrite 11/28/2018 mg/L as N U Source Well ELW107 0.01 0.01 7-1
Appendix I: Water Supply Contract I-16
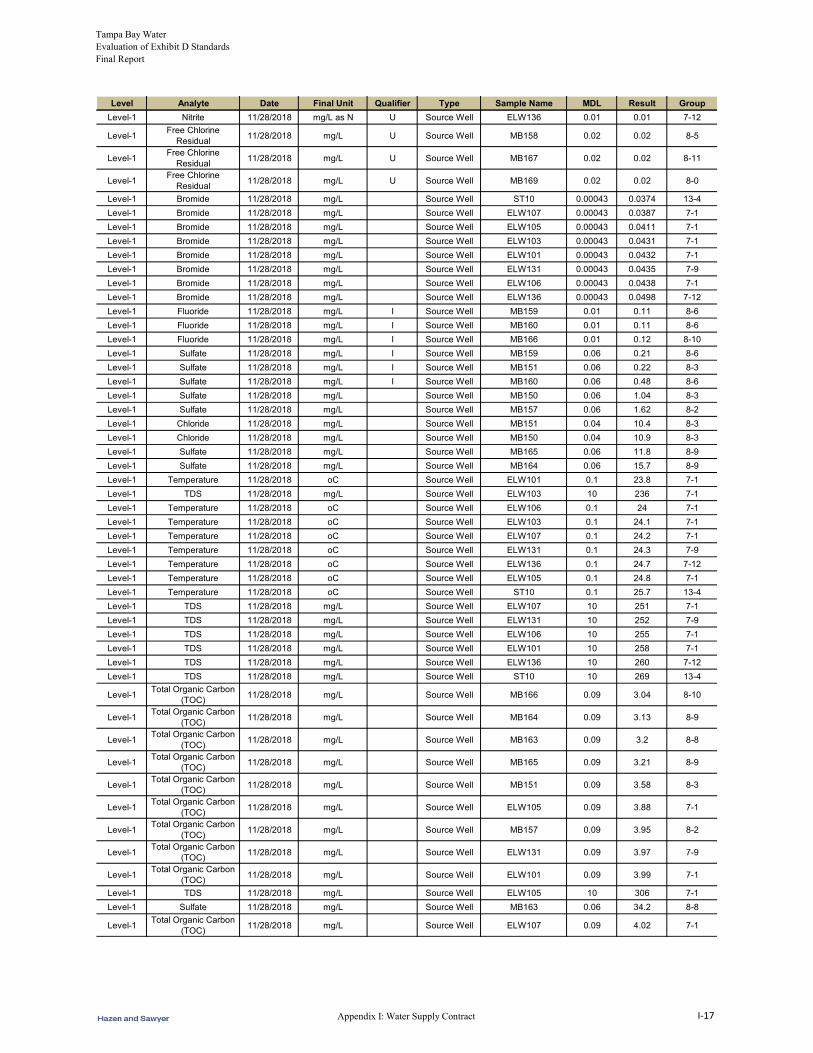
Tampa Bay Water Evaluation of Exhibit D Standards Final Report
Level Analyte Date Final Unit Qualifier Type Sample Name MDL Result Group
Level-1 Nitrite 11/28/2018 mg/L as N U Source Well ELW136 0.01 0.01 7-12
Level-1Free Chlorine
Residual11/28/2018 mg/L U Source Well MB158 0.02 0.02 8-5
Level-1Free Chlorine
Residual11/28/2018 mg/L U Source Well MB167 0.02 0.02 8-11
Level-1Free Chlorine
Residual11/28/2018 mg/L U Source Well MB169 0.02 0.02 8-0
Level-1 Bromide 11/28/2018 mg/L Source Well ST10 0.00043 0.0374 13-4
Level-1 Bromide 11/28/2018 mg/L Source Well ELW107 0.00043 0.0387 7-1
Level-1 Bromide 11/28/2018 mg/L Source Well ELW105 0.00043 0.0411 7-1
Level-1 Bromide 11/28/2018 mg/L Source Well ELW103 0.00043 0.0431 7-1
Level-1 Bromide 11/28/2018 mg/L Source Well ELW101 0.00043 0.0432 7-1
Level-1 Bromide 11/28/2018 mg/L Source Well ELW131 0.00043 0.0435 7-9
Level-1 Bromide 11/28/2018 mg/L Source Well ELW106 0.00043 0.0438 7-1
Level-1 Bromide 11/28/2018 mg/L Source Well ELW136 0.00043 0.0498 7-12
Level-1 Fluoride 11/28/2018 mg/L I Source Well MB159 0.01 0.11 8-6
Level-1 Fluoride 11/28/2018 mg/L I Source Well MB160 0.01 0.11 8-6
Level-1 Fluoride 11/28/2018 mg/L I Source Well MB166 0.01 0.12 8-10
Level-1 Sulfate 11/28/2018 mg/L I Source Well MB159 0.06 0.21 8-6
Level-1 Sulfate 11/28/2018 mg/L I Source Well MB151 0.06 0.22 8-3
Level-1 Sulfate 11/28/2018 mg/L I Source Well MB160 0.06 0.48 8-6
Level-1 Sulfate 11/28/2018 mg/L Source Well MB150 0.06 1.04 8-3
Level-1 Sulfate 11/28/2018 mg/L Source Well MB157 0.06 1.62 8-2
Level-1 Chloride 11/28/2018 mg/L Source Well MB151 0.04 10.4 8-3
Level-1 Chloride 11/28/2018 mg/L Source Well MB150 0.04 10.9 8-3
Level-1 Sulfate 11/28/2018 mg/L Source Well MB165 0.06 11.8 8-9
Level-1 Sulfate 11/28/2018 mg/L Source Well MB164 0.06 15.7 8-9
Level-1 Temperature 11/28/2018 oC Source Well ELW101 0.1 23.8 7-1
Level-1 TDS 11/28/2018 mg/L Source Well ELW103 10 236 7-1
Level-1 Temperature 11/28/2018 oC Source Well ELW106 0.1 24 7-1
Level-1 Temperature 11/28/2018 oC Source Well ELW103 0.1 24.1 7-1
Level-1 Temperature 11/28/2018 oC Source Well ELW107 0.1 24.2 7-1
Level-1 Temperature 11/28/2018 oC Source Well ELW131 0.1 24.3 7-9
Level-1 Temperature 11/28/2018 oC Source Well ELW136 0.1 24.7 7-12
Level-1 Temperature 11/28/2018 oC Source Well ELW105 0.1 24.8 7-1
Level-1 Temperature 11/28/2018 oC Source Well ST10 0.1 25.7 13-4
Level-1 TDS 11/28/2018 mg/L Source Well ELW107 10 251 7-1
Level-1 TDS 11/28/2018 mg/L Source Well ELW131 10 252 7-9
Level-1 TDS 11/28/2018 mg/L Source Well ELW106 10 255 7-1
Level-1 TDS 11/28/2018 mg/L Source Well ELW101 10 258 7-1
Level-1 TDS 11/28/2018 mg/L Source Well ELW136 10 260 7-12
Level-1 TDS 11/28/2018 mg/L Source Well ST10 10 269 13-4
Level-1Total Organic Carbon
(TOC)11/28/2018 mg/L Source Well MB166 0.09 3.04 8-10
Level-1Total Organic Carbon
(TOC)11/28/2018 mg/L Source Well MB164 0.09 3.13 8-9
Level-1Total Organic Carbon
(TOC)11/28/2018 mg/L Source Well MB163 0.09 3.2 8-8
Level-1Total Organic Carbon
(TOC)11/28/2018 mg/L Source Well MB165 0.09 3.21 8-9
Level-1Total Organic Carbon
(TOC)11/28/2018 mg/L Source Well MB151 0.09 3.58 8-3
Level-1Total Organic Carbon
(TOC)11/28/2018 mg/L Source Well ELW105 0.09 3.88 7-1
Level-1Total Organic Carbon
(TOC)11/28/2018 mg/L Source Well MB157 0.09 3.95 8-2
Level-1Total Organic Carbon
(TOC)11/28/2018 mg/L Source Well ELW131 0.09 3.97 7-9
Level-1Total Organic Carbon
(TOC)11/28/2018 mg/L Source Well ELW101 0.09 3.99 7-1
Level-1 TDS 11/28/2018 mg/L Source Well ELW105 10 306 7-1
Level-1 Sulfate 11/28/2018 mg/L Source Well MB163 0.06 34.2 8-8
Level-1Total Organic Carbon
(TOC)11/28/2018 mg/L Source Well ELW107 0.09 4.02 7-1
Appendix I: Water Supply Contract I-17
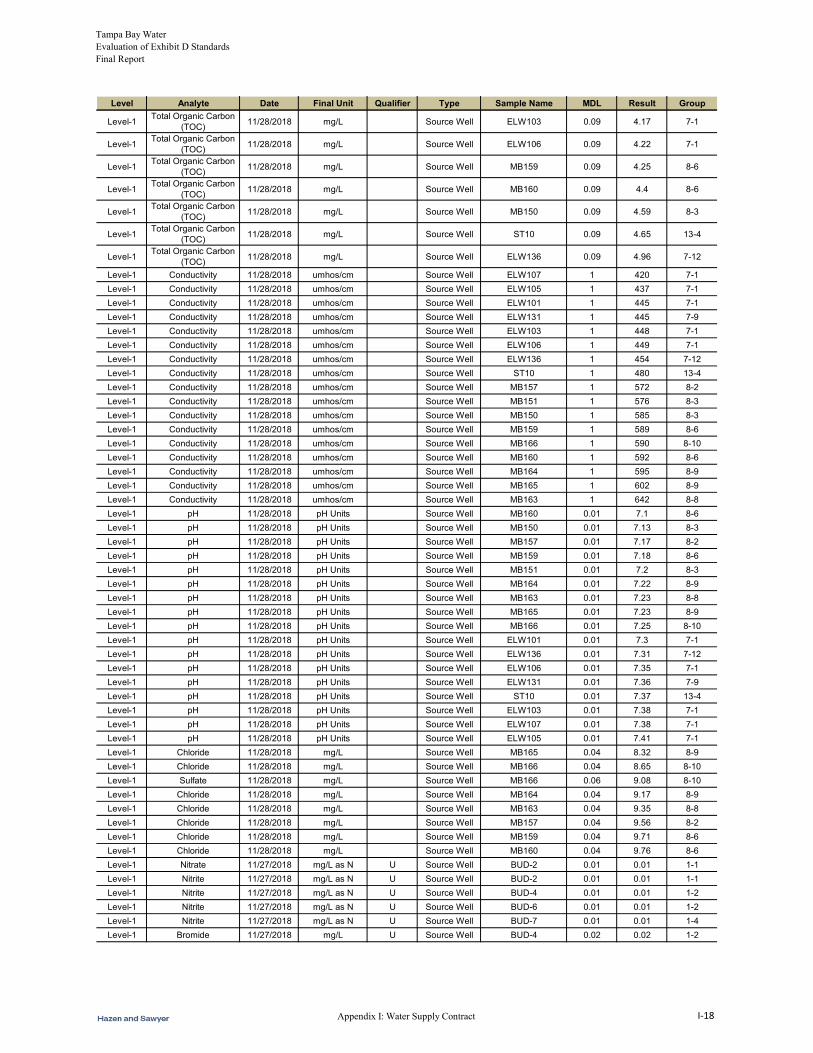
Tampa Bay Water Evaluation of Exhibit D Standards Final Report
Level Analyte Date Final Unit Qualifier Type Sample Name MDL Result Group
Level-1Total Organic Carbon
(TOC)11/28/2018 mg/L Source Well ELW103 0.09 4.17 7-1
Level-1Total Organic Carbon
(TOC)11/28/2018 mg/L Source Well ELW106 0.09 4.22 7-1
Level-1Total Organic Carbon
(TOC)11/28/2018 mg/L Source Well MB159 0.09 4.25 8-6
Level-1Total Organic Carbon
(TOC)11/28/2018 mg/L Source Well MB160 0.09 4.4 8-6
Level-1Total Organic Carbon
(TOC)11/28/2018 mg/L Source Well MB150 0.09 4.59 8-3
Level-1Total Organic Carbon
(TOC)11/28/2018 mg/L Source Well ST10 0.09 4.65 13-4
Level-1Total Organic Carbon
(TOC)11/28/2018 mg/L Source Well ELW136 0.09 4.96 7-12
Level-1 Conductivity 11/28/2018 umhos/cm Source Well ELW107 1 420 7-1
Level-1 Conductivity 11/28/2018 umhos/cm Source Well ELW105 1 437 7-1
Level-1 Conductivity 11/28/2018 umhos/cm Source Well ELW101 1 445 7-1
Level-1 Conductivity 11/28/2018 umhos/cm Source Well ELW131 1 445 7-9
Level-1 Conductivity 11/28/2018 umhos/cm Source Well ELW103 1 448 7-1
Level-1 Conductivity 11/28/2018 umhos/cm Source Well ELW106 1 449 7-1
Level-1 Conductivity 11/28/2018 umhos/cm Source Well ELW136 1 454 7-12
Level-1 Conductivity 11/28/2018 umhos/cm Source Well ST10 1 480 13-4
Level-1 Conductivity 11/28/2018 umhos/cm Source Well MB157 1 572 8-2
Level-1 Conductivity 11/28/2018 umhos/cm Source Well MB151 1 576 8-3
Level-1 Conductivity 11/28/2018 umhos/cm Source Well MB150 1 585 8-3
Level-1 Conductivity 11/28/2018 umhos/cm Source Well MB159 1 589 8-6
Level-1 Conductivity 11/28/2018 umhos/cm Source Well MB166 1 590 8-10
Level-1 Conductivity 11/28/2018 umhos/cm Source Well MB160 1 592 8-6
Level-1 Conductivity 11/28/2018 umhos/cm Source Well MB164 1 595 8-9
Level-1 Conductivity 11/28/2018 umhos/cm Source Well MB165 1 602 8-9
Level-1 Conductivity 11/28/2018 umhos/cm Source Well MB163 1 642 8-8
Level-1 pH 11/28/2018 pH Units Source Well MB160 0.01 7.1 8-6
Level-1 pH 11/28/2018 pH Units Source Well MB150 0.01 7.13 8-3
Level-1 pH 11/28/2018 pH Units Source Well MB157 0.01 7.17 8-2
Level-1 pH 11/28/2018 pH Units Source Well MB159 0.01 7.18 8-6
Level-1 pH 11/28/2018 pH Units Source Well MB151 0.01 7.2 8-3
Level-1 pH 11/28/2018 pH Units Source Well MB164 0.01 7.22 8-9
Level-1 pH 11/28/2018 pH Units Source Well MB163 0.01 7.23 8-8
Level-1 pH 11/28/2018 pH Units Source Well MB165 0.01 7.23 8-9
Level-1 pH 11/28/2018 pH Units Source Well MB166 0.01 7.25 8-10
Level-1 pH 11/28/2018 pH Units Source Well ELW101 0.01 7.3 7-1
Level-1 pH 11/28/2018 pH Units Source Well ELW136 0.01 7.31 7-12
Level-1 pH 11/28/2018 pH Units Source Well ELW106 0.01 7.35 7-1
Level-1 pH 11/28/2018 pH Units Source Well ELW131 0.01 7.36 7-9
Level-1 pH 11/28/2018 pH Units Source Well ST10 0.01 7.37 13-4
Level-1 pH 11/28/2018 pH Units Source Well ELW103 0.01 7.38 7-1
Level-1 pH 11/28/2018 pH Units Source Well ELW107 0.01 7.38 7-1
Level-1 pH 11/28/2018 pH Units Source Well ELW105 0.01 7.41 7-1
Level-1 Chloride 11/28/2018 mg/L Source Well MB165 0.04 8.32 8-9
Level-1 Chloride 11/28/2018 mg/L Source Well MB166 0.04 8.65 8-10
Level-1 Sulfate 11/28/2018 mg/L Source Well MB166 0.06 9.08 8-10
Level-1 Chloride 11/28/2018 mg/L Source Well MB164 0.04 9.17 8-9
Level-1 Chloride 11/28/2018 mg/L Source Well MB163 0.04 9.35 8-8
Level-1 Chloride 11/28/2018 mg/L Source Well MB157 0.04 9.56 8-2
Level-1 Chloride 11/28/2018 mg/L Source Well MB159 0.04 9.71 8-6
Level-1 Chloride 11/28/2018 mg/L Source Well MB160 0.04 9.76 8-6
Level-1 Nitrate 11/27/2018 mg/L as N U Source Well BUD-2 0.01 0.01 1-1
Level-1 Nitrite 11/27/2018 mg/L as N U Source Well BUD-2 0.01 0.01 1-1
Level-1 Nitrite 11/27/2018 mg/L as N U Source Well BUD-4 0.01 0.01 1-2
Level-1 Nitrite 11/27/2018 mg/L as N U Source Well BUD-6 0.01 0.01 1-2
Level-1 Nitrite 11/27/2018 mg/L as N U Source Well BUD-7 0.01 0.01 1-4
Level-1 Bromide 11/27/2018 mg/L U Source Well BUD-4 0.02 0.02 1-2
Appendix I: Water Supply Contract I-18
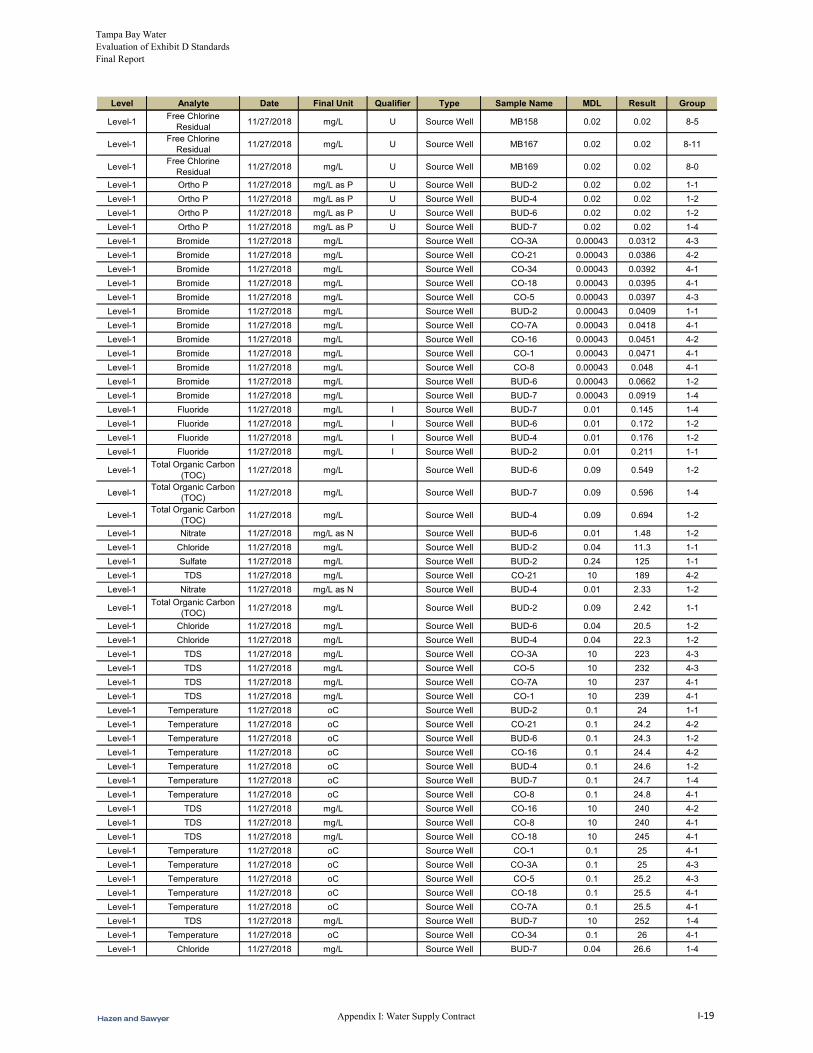
Tampa Bay Water Evaluation of Exhibit D Standards Final Report
Level Analyte Date Final Unit Qualifier Type Sample Name MDL Result Group
Level-1Free Chlorine
Residual11/27/2018 mg/L U Source Well MB158 0.02 0.02 8-5
Level-1Free Chlorine
Residual11/27/2018 mg/L U Source Well MB167 0.02 0.02 8-11
Level-1Free Chlorine
Residual11/27/2018 mg/L U Source Well MB169 0.02 0.02 8-0
Level-1 Ortho P 11/27/2018 mg/L as P U Source Well BUD-2 0.02 0.02 1-1
Level-1 Ortho P 11/27/2018 mg/L as P U Source Well BUD-4 0.02 0.02 1-2
Level-1 Ortho P 11/27/2018 mg/L as P U Source Well BUD-6 0.02 0.02 1-2
Level-1 Ortho P 11/27/2018 mg/L as P U Source Well BUD-7 0.02 0.02 1-4
Level-1 Bromide 11/27/2018 mg/L Source Well CO-3A 0.00043 0.0312 4-3
Level-1 Bromide 11/27/2018 mg/L Source Well CO-21 0.00043 0.0386 4-2
Level-1 Bromide 11/27/2018 mg/L Source Well CO-34 0.00043 0.0392 4-1
Level-1 Bromide 11/27/2018 mg/L Source Well CO-18 0.00043 0.0395 4-1
Level-1 Bromide 11/27/2018 mg/L Source Well CO-5 0.00043 0.0397 4-3
Level-1 Bromide 11/27/2018 mg/L Source Well BUD-2 0.00043 0.0409 1-1
Level-1 Bromide 11/27/2018 mg/L Source Well CO-7A 0.00043 0.0418 4-1
Level-1 Bromide 11/27/2018 mg/L Source Well CO-16 0.00043 0.0451 4-2
Level-1 Bromide 11/27/2018 mg/L Source Well CO-1 0.00043 0.0471 4-1
Level-1 Bromide 11/27/2018 mg/L Source Well CO-8 0.00043 0.048 4-1
Level-1 Bromide 11/27/2018 mg/L Source Well BUD-6 0.00043 0.0662 1-2
Level-1 Bromide 11/27/2018 mg/L Source Well BUD-7 0.00043 0.0919 1-4
Level-1 Fluoride 11/27/2018 mg/L I Source Well BUD-7 0.01 0.145 1-4
Level-1 Fluoride 11/27/2018 mg/L I Source Well BUD-6 0.01 0.172 1-2
Level-1 Fluoride 11/27/2018 mg/L I Source Well BUD-4 0.01 0.176 1-2
Level-1 Fluoride 11/27/2018 mg/L I Source Well BUD-2 0.01 0.211 1-1
Level-1Total Organic Carbon
(TOC)11/27/2018 mg/L Source Well BUD-6 0.09 0.549 1-2
Level-1Total Organic Carbon
(TOC)11/27/2018 mg/L Source Well BUD-7 0.09 0.596 1-4
Level-1Total Organic Carbon
(TOC)11/27/2018 mg/L Source Well BUD-4 0.09 0.694 1-2
Level-1 Nitrate 11/27/2018 mg/L as N Source Well BUD-6 0.01 1.48 1-2
Level-1 Chloride 11/27/2018 mg/L Source Well BUD-2 0.04 11.3 1-1
Level-1 Sulfate 11/27/2018 mg/L Source Well BUD-2 0.24 125 1-1
Level-1 TDS 11/27/2018 mg/L Source Well CO-21 10 189 4-2
Level-1 Nitrate 11/27/2018 mg/L as N Source Well BUD-4 0.01 2.33 1-2
Level-1Total Organic Carbon
(TOC)11/27/2018 mg/L Source Well BUD-2 0.09 2.42 1-1
Level-1 Chloride 11/27/2018 mg/L Source Well BUD-6 0.04 20.5 1-2
Level-1 Chloride 11/27/2018 mg/L Source Well BUD-4 0.04 22.3 1-2
Level-1 TDS 11/27/2018 mg/L Source Well CO-3A 10 223 4-3
Level-1 TDS 11/27/2018 mg/L Source Well CO-5 10 232 4-3
Level-1 TDS 11/27/2018 mg/L Source Well CO-7A 10 237 4-1
Level-1 TDS 11/27/2018 mg/L Source Well CO-1 10 239 4-1
Level-1 Temperature 11/27/2018 oC Source Well BUD-2 0.1 24 1-1
Level-1 Temperature 11/27/2018 oC Source Well CO-21 0.1 24.2 4-2
Level-1 Temperature 11/27/2018 oC Source Well BUD-6 0.1 24.3 1-2
Level-1 Temperature 11/27/2018 oC Source Well CO-16 0.1 24.4 4-2
Level-1 Temperature 11/27/2018 oC Source Well BUD-4 0.1 24.6 1-2
Level-1 Temperature 11/27/2018 oC Source Well BUD-7 0.1 24.7 1-4
Level-1 Temperature 11/27/2018 oC Source Well CO-8 0.1 24.8 4-1
Level-1 TDS 11/27/2018 mg/L Source Well CO-16 10 240 4-2
Level-1 TDS 11/27/2018 mg/L Source Well CO-8 10 240 4-1
Level-1 TDS 11/27/2018 mg/L Source Well CO-18 10 245 4-1
Level-1 Temperature 11/27/2018 oC Source Well CO-1 0.1 25 4-1
Level-1 Temperature 11/27/2018 oC Source Well CO-3A 0.1 25 4-3
Level-1 Temperature 11/27/2018 oC Source Well CO-5 0.1 25.2 4-3
Level-1 Temperature 11/27/2018 oC Source Well CO-18 0.1 25.5 4-1
Level-1 Temperature 11/27/2018 oC Source Well CO-7A 0.1 25.5 4-1
Level-1 TDS 11/27/2018 mg/L Source Well BUD-7 10 252 1-4
Level-1 Temperature 11/27/2018 oC Source Well CO-34 0.1 26 4-1
Level-1 Chloride 11/27/2018 mg/L Source Well BUD-7 0.04 26.6 1-4
Appendix I: Water Supply Contract I-19

Tampa Bay Water Evaluation of Exhibit D Standards Final Report
Level Analyte Date Final Unit Qualifier Type Sample Name MDL Result Group
Level-1 TDS 11/27/2018 mg/L Source Well CO-34 10 261 4-1
Level-1 TDS 11/27/2018 mg/L Source Well BUD-6 10 272 1-2
Level-1 TDS 11/27/2018 mg/L Source Well BUD-4 10 286 1-2
Level-1 Nitrate 11/27/2018 mg/L as N Source Well BUD-7 0.01 3.08 1-4
Level-1Total Organic Carbon
(TOC)11/27/2018 mg/L Source Well CO-21 0.09 3.64 4-2
Level-1Total Organic Carbon
(TOC)11/27/2018 mg/L Source Well CO-3A 0.09 3.87 4-3
Level-1Total Organic Carbon
(TOC)11/27/2018 mg/L Source Well CO-16 0.09 3.88 4-2
Level-1Total Organic Carbon
(TOC)11/27/2018 mg/L Source Well CO-1 0.09 3.99 4-1
Level-1 Sulfate 11/27/2018 mg/L Source Well BUD-7 0.06 31.4 1-4
Level-1 Conductivity 11/27/2018 umhos/cm Source Well CO-21 1 349 4-2
Level-1 TDS 11/27/2018 mg/L Source Well BUD-2 10 383 1-1
Level-1 Conductivity 11/27/2018 umhos/cm Source Well CO-3A 1 391 4-3
Level-1 Conductivity 11/27/2018 umhos/cm Source Well CO-5 1 392 4-3
Level-1Total Organic Carbon
(TOC)11/27/2018 mg/L Source Well CO-5 0.09 4.03 4-3
Level-1Total Organic Carbon
(TOC)11/27/2018 mg/L Source Well CO-18 0.09 4.08 4-1
Level-1Total Organic Carbon
(TOC)11/27/2018 mg/L Source Well CO-7A 0.09 4.49 4-1
Level-1Total Organic Carbon
(TOC)11/27/2018 mg/L Source Well CO-8 0.09 4.56 4-1
Level-1Total Organic Carbon
(TOC)11/27/2018 mg/L Source Well CO-34 0.09 4.61 4-1
Level-1 Conductivity 11/27/2018 umhos/cm Source Well CO-1 1 410 4-1
Level-1 Conductivity 11/27/2018 umhos/cm Source Well CO-8 1 415 4-1
Level-1 Conductivity 11/27/2018 umhos/cm Source Well CO-7A 1 424 4-1
Level-1 Conductivity 11/27/2018 umhos/cm Source Well CO-16 1 431 4-2
Level-1 Conductivity 11/27/2018 umhos/cm Source Well CO-18 1 432 4-1
Level-1 Conductivity 11/27/2018 umhos/cm Source Well CO-34 1 435 4-1
Level-1 Conductivity 11/27/2018 umhos/cm Source Well BUD-7 1 475 1-4
Level-1 Conductivity 11/27/2018 umhos/cm Source Well BUD-6 1 515 1-2
Level-1 Sulfate 11/27/2018 mg/L Source Well BUD-6 0.06 54.4 1-2
Level-1 Conductivity 11/27/2018 umhos/cm Source Well BUD-4 1 540 1-2
Level-1 Sulfate 11/27/2018 mg/L Source Well BUD-4 0.06 59.8 1-2
Level-1 Conductivity 11/27/2018 umhos/cm Source Well BUD-2 1 675 1-1
Level-1 pH 11/27/2018 pH Units Source Well CO-16 0.01 7.25 4-2
Level-1 pH 11/27/2018 pH Units Source Well CO-1 0.01 7.26 4-1
Level-1 pH 11/27/2018 pH Units Source Well CO-18 0.01 7.31 4-1
Level-1 pH 11/27/2018 pH Units Source Well CO-21 0.01 7.31 4-2
Level-1 pH 11/27/2018 pH Units Source Well CO-7A 0.01 7.31 4-1
Level-1 pH 11/27/2018 pH Units Source Well CO-8 0.01 7.31 4-1
Level-1 pH 11/27/2018 pH Units Source Well CO-5 0.01 7.35 4-3
Level-1 pH 11/27/2018 pH Units Source Well CO-34 0.01 7.37 4-1
Level-1 pH 11/27/2018 pH Units Source Well CO-3A 0.01 7.38 4-3
Level-1 pH 11/27/2018 pH Units Source Well BUD-4 0.01 7.4 1-2
Level-1 pH 11/27/2018 pH Units Source Well BUD-6 0.01 7.42 1-2
Level-1 pH 11/27/2018 pH Units Source Well BUD-7 0.01 7.42 1-4
Level-1 pH 11/27/2018 pH Units Source Well BUD-2 0.01 7.43 1-1
Level-1 Temperature 1/8/2019 oC Source Well CO-25 0.1 23.7 4-5
Level-1 Temperature 1/8/2019 oC Source Well ELW116 0.1 24.5 7-7
Level-1 Conductivity 1/8/2019 umhos/cm Source Well ELW116 1 418 7-7
Level-1 Conductivity 1/8/2019 umhos/cm Source Well CO-25 1 449 4-5
Level-1 pH 1/8/2019 pH Units Source Well CO-25 0.01 7.01 4-5
Level-1 pH 1/8/2019 pH Units Source Well ELW116 0.01 7.23 7-7
Level-1 Nitrate 1/4/2019 mg/L as N UQ Source Well ELW13 0.01 0.01 7-5
Level-1 Nitrate 1/4/2019 mg/L as N UQ Source Well ELW9 0.01 0.01 7-2
Level-1 Nitrite 1/4/2019 mg/L as N UQ Source Well ELW13 0.01 0.01 7-5
Level-1 Nitrite 1/4/2019 mg/L as N UQ Source Well ELW9 0.01 0.01 7-2
Level-1 Bromide 1/4/2019 mg/L I Source Well ELW13 0.02 0.084 7-5
Appendix I: Water Supply Contract I-20

Tampa Bay Water Evaluation of Exhibit D Standards Final Report
Level Analyte Date Final Unit Qualifier Type Sample Name MDL Result Group
Level-1 Bromide 1/4/2019 mg/L I Source Well ELW10A 0.02 0.086 7-4
Level-1 Bromide 1/4/2019 mg/L I Source Well ELW9 0.02 0.086 7-2
Level-1 Bromide 1/4/2019 mg/L I Source Well ST9 0.02 0.09 13-5
Level-1 Bromide 1/4/2019 mg/L I Source Well NWH1 0.02 0.091 9-1
Level-1 Ortho P 1/4/2019 mg/L as P Q, I Source Well ELW9 0.02 0.113 7-2
Level-1 Fluoride 1/4/2019 mg/L I Source Well ELW9 0.01 0.127 7-2
Level-1 Fluoride 1/4/2019 mg/L I Source Well ELW13 0.01 0.13 7-5
Level-1 Fluoride 1/4/2019 mg/L I Source Well NWH1 0.01 0.13 9-1
Level-1 Fluoride 1/4/2019 mg/L I Source Well ELW10A 0.01 0.133 7-4
Level-1 Fluoride 1/4/2019 mg/L I Source Well ST9 0.01 0.173 13-5
Level-1 Sulfate 1/4/2019 mg/L Source Well NWH1 0.06 1.27 9-1
Level-1 Chloride 1/4/2019 mg/L Source Well NWH1 0.04 11.5 9-1
Level-1 Sulfate 1/4/2019 mg/L Source Well ST9 0.06 19 13-5
Level-1 Temperature 1/4/2019 oC Source Well ELW102 0.1 23.9 7-3
Level-1 Temperature 1/4/2019 oC Source Well NWH1 0.1 24.4 9-1
Level-1 Temperature 1/4/2019 oC Source Well ELW10A 0.1 24.9 7-4
Level-1 Temperature 1/4/2019 oC Source Well ELW13 0.1 24.9 7-5
Level-1 Temperature 1/4/2019 oC Source Well ST7 0.1 24.9 13-4
Level-1 Temperature 1/4/2019 oC Source Well ST9 0.1 25 13-5
Level-1 Temperature 1/4/2019 oC Source Well ELW9 0.1 25.4 7-2
Level-1 Sulfate 1/4/2019 mg/L Source Well ELW9 0.06 3.31 7-2
Level-1Total Organic Carbon
(TOC)1/4/2019 mg/L Source Well ELW10A 0.09 3.55 7-4
Level-1 Conductivity 1/4/2019 umhos/cm Source Well ELW9 1 385 7-2
Level-1 Conductivity 1/4/2019 umhos/cm Source Well NWH1 1 385 9-1
Level-1 Conductivity 1/4/2019 umhos/cm Source Well ELW10A 1 388 7-4
Level-1Total Organic Carbon
(TOC)1/4/2019 mg/L Source Well ELW13 0.09 4.04 7-5
Level-1 Sulfate 1/4/2019 mg/L Source Well ELW13 0.06 4.13 7-5
Level-1Total Organic Carbon
(TOC)1/4/2019 mg/L Source Well ST7 0.09 4.29 13-4
Level-1Total Organic Carbon
(TOC)1/4/2019 mg/L Source Well ELW102 0.09 4.75 7-3
Level-1 Conductivity 1/4/2019 umhos/cm Source Well ELW13 1 401 7-5
Level-1 Conductivity 1/4/2019 umhos/cm Source Well ELW102 1 409 7-3
Level-1 Sulfate 1/4/2019 mg/L Source Well ELW10A 0.06 5.14 7-4
Level-1 Conductivity 1/4/2019 umhos/cm Source Well ST7 1 507 13-4
Level-1 Conductivity 1/4/2019 umhos/cm Source Well ST9 1 526 13-5
Level-1 pH 1/4/2019 pH Units Source Well ST9 0.01 7.22 13-5
Level-1 pH 1/4/2019 pH Units Source Well ST7 0.01 7.25 13-4
Level-1 pH 1/4/2019 pH Units Source Well NWH1 0.01 7.36 9-1
Level-1 pH 1/4/2019 pH Units Source Well ELW102 0.01 7.37 7-3
Level-1 pH 1/4/2019 pH Units Source Well ELW9 0.01 7.45 7-2
Level-1 pH 1/4/2019 pH Units Source Well ELW10A 0.01 7.46 7-4
Level-1 pH 1/4/2019 pH Units Source Well ELW13 0.01 7.48 7-5
Level-1 Chloride 1/4/2019 mg/L Source Well ELW9 0.04 8.26 7-2
Level-1 Chloride 1/4/2019 mg/L Source Well ELW10A 0.04 9.05 7-4
Level-1 Chloride 1/4/2019 mg/L Source Well ELW13 0.04 9.14 7-5
Level-1 Chloride 1/4/2019 mg/L Source Well ST9 0.04 9.9 13-5
Level-1 TDS 1/4/2019 mg/L Source Well ELW102 264 7-3
Level-1 TDS 1/4/2019 mg/L Source Well ELW10A 214 7-4
Level-1 TDS 1/4/2019 mg/L Source Well ELW13 238 7-5
Level-1 Nitrate 1/3/2019 mg/L as N U Source Well ELW112 0.01 0.01 7-3
Level-1 Nitrate 1/3/2019 mg/L as N U Source Well ELW114 0.01 0.01 7-6
Level-1 Nitrate 1/3/2019 mg/L as N U Source Well ELW120 0.01 0.01 7-6
Level-1 Nitrate 1/3/2019 mg/L as N U Source Well ELW139 0.01 0.01 7-6
Level-1 Nitrate 1/3/2019 mg/L as N U Source Well ELW142 0.01 0.01 7-3
Level-1 Nitrite 1/3/2019 mg/L as N U Source Well ELW112 0.01 0.01 7-3
Level-1 Nitrite 1/3/2019 mg/L as N U Source Well ELW114 0.01 0.01 7-6
Level-1 Nitrite 1/3/2019 mg/L as N U Source Well ELW120 0.01 0.01 7-6
Level-1 Nitrite 1/3/2019 mg/L as N U Source Well ELW139 0.01 0.01 7-6
Appendix I: Water Supply Contract I-21
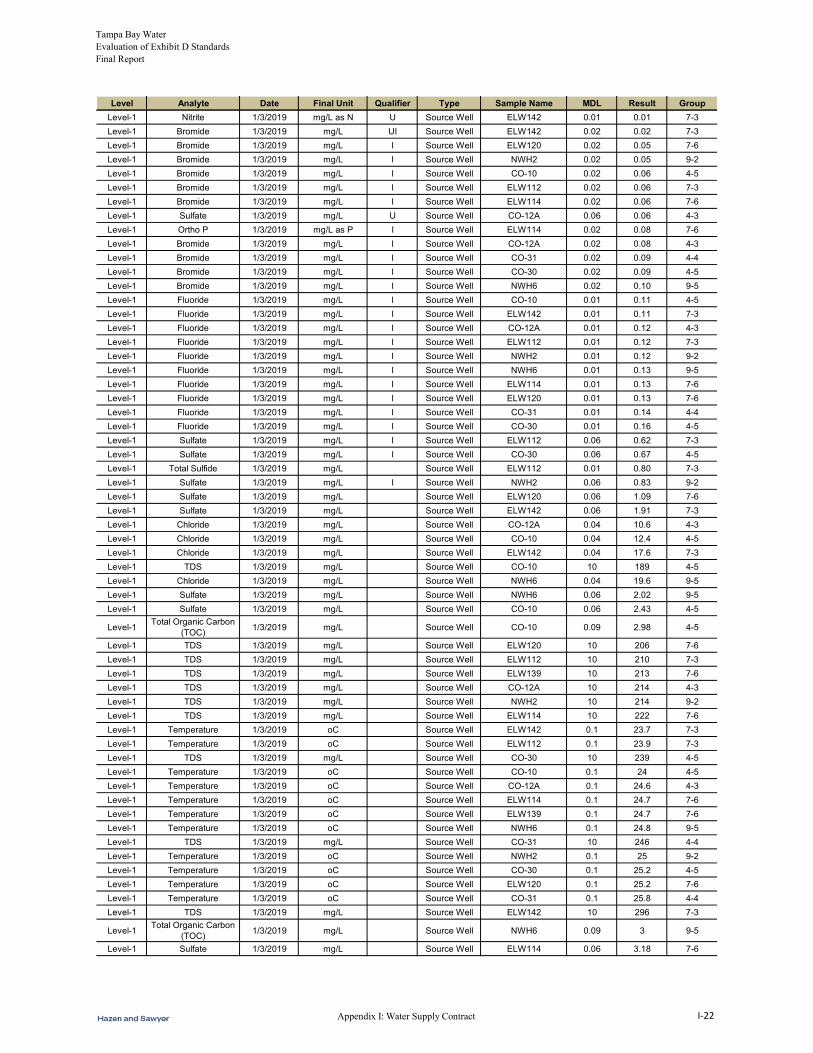
Tampa Bay Water Evaluation of Exhibit D Standards Final Report
Level Analyte Date Final Unit Qualifier Type Sample Name MDL Result Group
Level-1 Nitrite 1/3/2019 mg/L as N U Source Well ELW142 0.01 0.01 7-3
Level-1 Bromide 1/3/2019 mg/L UI Source Well ELW142 0.02 0.02 7-3
Level-1 Bromide 1/3/2019 mg/L I Source Well ELW120 0.02 0.05 7-6
Level-1 Bromide 1/3/2019 mg/L I Source Well NWH2 0.02 0.05 9-2
Level-1 Bromide 1/3/2019 mg/L I Source Well CO-10 0.02 0.06 4-5
Level-1 Bromide 1/3/2019 mg/L I Source Well ELW112 0.02 0.06 7-3
Level-1 Bromide 1/3/2019 mg/L I Source Well ELW114 0.02 0.06 7-6
Level-1 Sulfate 1/3/2019 mg/L U Source Well CO-12A 0.06 0.06 4-3
Level-1 Ortho P 1/3/2019 mg/L as P I Source Well ELW114 0.02 0.08 7-6
Level-1 Bromide 1/3/2019 mg/L I Source Well CO-12A 0.02 0.08 4-3
Level-1 Bromide 1/3/2019 mg/L I Source Well CO-31 0.02 0.09 4-4
Level-1 Bromide 1/3/2019 mg/L I Source Well CO-30 0.02 0.09 4-5
Level-1 Bromide 1/3/2019 mg/L I Source Well NWH6 0.02 0.10 9-5
Level-1 Fluoride 1/3/2019 mg/L I Source Well CO-10 0.01 0.11 4-5
Level-1 Fluoride 1/3/2019 mg/L I Source Well ELW142 0.01 0.11 7-3
Level-1 Fluoride 1/3/2019 mg/L I Source Well CO-12A 0.01 0.12 4-3
Level-1 Fluoride 1/3/2019 mg/L I Source Well ELW112 0.01 0.12 7-3
Level-1 Fluoride 1/3/2019 mg/L I Source Well NWH2 0.01 0.12 9-2
Level-1 Fluoride 1/3/2019 mg/L I Source Well NWH6 0.01 0.13 9-5
Level-1 Fluoride 1/3/2019 mg/L I Source Well ELW114 0.01 0.13 7-6
Level-1 Fluoride 1/3/2019 mg/L I Source Well ELW120 0.01 0.13 7-6
Level-1 Fluoride 1/3/2019 mg/L I Source Well CO-31 0.01 0.14 4-4
Level-1 Fluoride 1/3/2019 mg/L I Source Well CO-30 0.01 0.16 4-5
Level-1 Sulfate 1/3/2019 mg/L I Source Well ELW112 0.06 0.62 7-3
Level-1 Sulfate 1/3/2019 mg/L I Source Well CO-30 0.06 0.67 4-5
Level-1 Total Sulfide 1/3/2019 mg/L Source Well ELW112 0.01 0.80 7-3
Level-1 Sulfate 1/3/2019 mg/L I Source Well NWH2 0.06 0.83 9-2
Level-1 Sulfate 1/3/2019 mg/L Source Well ELW120 0.06 1.09 7-6
Level-1 Sulfate 1/3/2019 mg/L Source Well ELW142 0.06 1.91 7-3
Level-1 Chloride 1/3/2019 mg/L Source Well CO-12A 0.04 10.6 4-3
Level-1 Chloride 1/3/2019 mg/L Source Well CO-10 0.04 12.4 4-5
Level-1 Chloride 1/3/2019 mg/L Source Well ELW142 0.04 17.6 7-3
Level-1 TDS 1/3/2019 mg/L Source Well CO-10 10 189 4-5
Level-1 Chloride 1/3/2019 mg/L Source Well NWH6 0.04 19.6 9-5
Level-1 Sulfate 1/3/2019 mg/L Source Well NWH6 0.06 2.02 9-5
Level-1 Sulfate 1/3/2019 mg/L Source Well CO-10 0.06 2.43 4-5
Level-1Total Organic Carbon
(TOC)1/3/2019 mg/L Source Well CO-10 0.09 2.98 4-5
Level-1 TDS 1/3/2019 mg/L Source Well ELW120 10 206 7-6
Level-1 TDS 1/3/2019 mg/L Source Well ELW112 10 210 7-3
Level-1 TDS 1/3/2019 mg/L Source Well ELW139 10 213 7-6
Level-1 TDS 1/3/2019 mg/L Source Well CO-12A 10 214 4-3
Level-1 TDS 1/3/2019 mg/L Source Well NWH2 10 214 9-2
Level-1 TDS 1/3/2019 mg/L Source Well ELW114 10 222 7-6
Level-1 Temperature 1/3/2019 oC Source Well ELW142 0.1 23.7 7-3
Level-1 Temperature 1/3/2019 oC Source Well ELW112 0.1 23.9 7-3
Level-1 TDS 1/3/2019 mg/L Source Well CO-30 10 239 4-5
Level-1 Temperature 1/3/2019 oC Source Well CO-10 0.1 24 4-5
Level-1 Temperature 1/3/2019 oC Source Well CO-12A 0.1 24.6 4-3
Level-1 Temperature 1/3/2019 oC Source Well ELW114 0.1 24.7 7-6
Level-1 Temperature 1/3/2019 oC Source Well ELW139 0.1 24.7 7-6
Level-1 Temperature 1/3/2019 oC Source Well NWH6 0.1 24.8 9-5
Level-1 TDS 1/3/2019 mg/L Source Well CO-31 10 246 4-4
Level-1 Temperature 1/3/2019 oC Source Well NWH2 0.1 25 9-2
Level-1 Temperature 1/3/2019 oC Source Well CO-30 0.1 25.2 4-5
Level-1 Temperature 1/3/2019 oC Source Well ELW120 0.1 25.2 7-6
Level-1 Temperature 1/3/2019 oC Source Well CO-31 0.1 25.8 4-4
Level-1 TDS 1/3/2019 mg/L Source Well ELW142 10 296 7-3
Level-1Total Organic Carbon
(TOC)1/3/2019 mg/L Source Well NWH6 0.09 3 9-5
Level-1 Sulfate 1/3/2019 mg/L Source Well ELW114 0.06 3.18 7-6
Appendix I: Water Supply Contract I-22
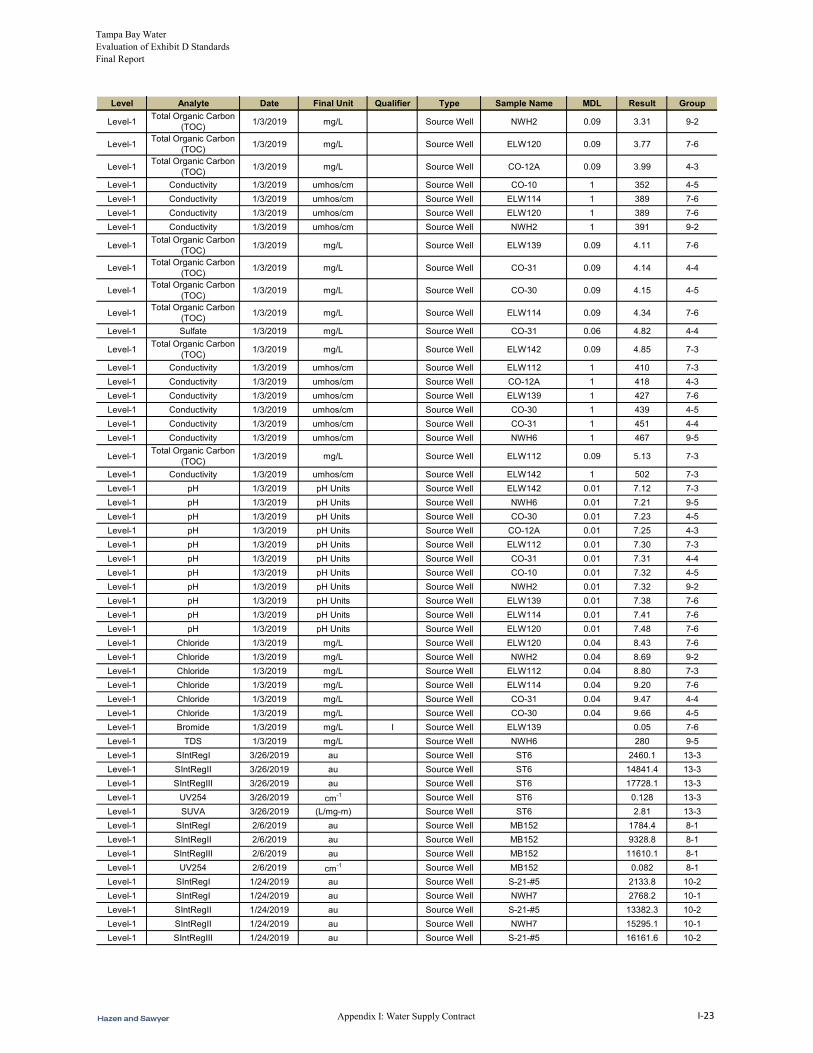
Tampa Bay Water Evaluation of Exhibit D Standards Final Report
Level Analyte Date Final Unit Qualifier Type Sample Name MDL Result Group
Level-1Total Organic Carbon
(TOC)1/3/2019 mg/L Source Well NWH2 0.09 3.31 9-2
Level-1Total Organic Carbon
(TOC)1/3/2019 mg/L Source Well ELW120 0.09 3.77 7-6
Level-1Total Organic Carbon
(TOC)1/3/2019 mg/L Source Well CO-12A 0.09 3.99 4-3
Level-1 Conductivity 1/3/2019 umhos/cm Source Well CO-10 1 352 4-5
Level-1 Conductivity 1/3/2019 umhos/cm Source Well ELW114 1 389 7-6
Level-1 Conductivity 1/3/2019 umhos/cm Source Well ELW120 1 389 7-6
Level-1 Conductivity 1/3/2019 umhos/cm Source Well NWH2 1 391 9-2
Level-1Total Organic Carbon
(TOC)1/3/2019 mg/L Source Well ELW139 0.09 4.11 7-6
Level-1Total Organic Carbon
(TOC)1/3/2019 mg/L Source Well CO-31 0.09 4.14 4-4
Level-1Total Organic Carbon
(TOC)1/3/2019 mg/L Source Well CO-30 0.09 4.15 4-5
Level-1Total Organic Carbon
(TOC)1/3/2019 mg/L Source Well ELW114 0.09 4.34 7-6
Level-1 Sulfate 1/3/2019 mg/L Source Well CO-31 0.06 4.82 4-4
Level-1Total Organic Carbon
(TOC)1/3/2019 mg/L Source Well ELW142 0.09 4.85 7-3
Level-1 Conductivity 1/3/2019 umhos/cm Source Well ELW112 1 410 7-3
Level-1 Conductivity 1/3/2019 umhos/cm Source Well CO-12A 1 418 4-3
Level-1 Conductivity 1/3/2019 umhos/cm Source Well ELW139 1 427 7-6
Level-1 Conductivity 1/3/2019 umhos/cm Source Well CO-30 1 439 4-5
Level-1 Conductivity 1/3/2019 umhos/cm Source Well CO-31 1 451 4-4
Level-1 Conductivity 1/3/2019 umhos/cm Source Well NWH6 1 467 9-5
Level-1Total Organic Carbon
(TOC)1/3/2019 mg/L Source Well ELW112 0.09 5.13 7-3
Level-1 Conductivity 1/3/2019 umhos/cm Source Well ELW142 1 502 7-3
Level-1 pH 1/3/2019 pH Units Source Well ELW142 0.01 7.12 7-3
Level-1 pH 1/3/2019 pH Units Source Well NWH6 0.01 7.21 9-5
Level-1 pH 1/3/2019 pH Units Source Well CO-30 0.01 7.23 4-5
Level-1 pH 1/3/2019 pH Units Source Well CO-12A 0.01 7.25 4-3
Level-1 pH 1/3/2019 pH Units Source Well ELW112 0.01 7.30 7-3
Level-1 pH 1/3/2019 pH Units Source Well CO-31 0.01 7.31 4-4
Level-1 pH 1/3/2019 pH Units Source Well CO-10 0.01 7.32 4-5
Level-1 pH 1/3/2019 pH Units Source Well NWH2 0.01 7.32 9-2
Level-1 pH 1/3/2019 pH Units Source Well ELW139 0.01 7.38 7-6
Level-1 pH 1/3/2019 pH Units Source Well ELW114 0.01 7.41 7-6
Level-1 pH 1/3/2019 pH Units Source Well ELW120 0.01 7.48 7-6
Level-1 Chloride 1/3/2019 mg/L Source Well ELW120 0.04 8.43 7-6
Level-1 Chloride 1/3/2019 mg/L Source Well NWH2 0.04 8.69 9-2
Level-1 Chloride 1/3/2019 mg/L Source Well ELW112 0.04 8.80 7-3
Level-1 Chloride 1/3/2019 mg/L Source Well ELW114 0.04 9.20 7-6
Level-1 Chloride 1/3/2019 mg/L Source Well CO-31 0.04 9.47 4-4
Level-1 Chloride 1/3/2019 mg/L Source Well CO-30 0.04 9.66 4-5
Level-1 Bromide 1/3/2019 mg/L I Source Well ELW139 0.05 7-6
Level-1 TDS 1/3/2019 mg/L Source Well NWH6 280 9-5
Level-1 SIntRegI 3/26/2019 au Source Well ST6 2460.1 13-3
Level-1 SIntRegII 3/26/2019 au Source Well ST6 14841.4 13-3
Level-1 SIntRegIII 3/26/2019 au Source Well ST6 17728.1 13-3
Level-1 UV254 3/26/2019 cm-1 Source Well ST6 0.128 13-3
Level-1 SUVA 3/26/2019 (L/mg-m) Source Well ST6 2.81 13-3
Level-1 SIntRegI 2/6/2019 au Source Well MB152 1784.4 8-1
Level-1 SIntRegII 2/6/2019 au Source Well MB152 9328.8 8-1
Level-1 SIntRegIII 2/6/2019 au Source Well MB152 11610.1 8-1
Level-1 UV254 2/6/2019 cm-1 Source Well MB152 0.082 8-1
Level-1 SIntRegI 1/24/2019 au Source Well S-21-#5 2133.8 10-2
Level-1 SIntRegI 1/24/2019 au Source Well NWH7 2768.2 10-1
Level-1 SIntRegII 1/24/2019 au Source Well S-21-#5 13382.3 10-2
Level-1 SIntRegII 1/24/2019 au Source Well NWH7 15295.1 10-1
Level-1 SIntRegIII 1/24/2019 au Source Well S-21-#5 16161.6 10-2
Appendix I: Water Supply Contract I-23

Tampa Bay Water Evaluation of Exhibit D Standards Final Report
Level Analyte Date Final Unit Qualifier Type Sample Name MDL Result Group
Level-1 SIntRegIII 1/24/2019 au Source Well NWH7 18707.04 10-1
Level-1 UV254 1/24/2019 cm-1 Source Well S-21-#5 0.099 10-2
Level-1 UV254 1/24/2019 cm-1 Source Well NWH7 0.113 10-1
Level-1 TDS 1/24/2019 mg/L Source Well NWH7 260 10-1
Level-1 TDS 1/24/2019 mg/L Source Well S-21-#5 210 10-2
Level-1 Turbidity 1/24/2019 mg/L Source Well S-21-#5 0.12 10-2
Level-1Total Organic Carbon
(TOC)1/24/2019 mg/L Source Well S-21-#5 2.8 10-2
Level-1Total Organic Carbon
(TOC)1/24/2019 mg/L Source Well NWH7 3.6 10-1
Level-1 SUVA 1/24/2019 (L/mg-m) Source Well S-21-#5 3.550 10-2
Level-1 SUVA 1/24/2019 (L/mg-m) Source Well NWH7 3.140 10-1
Level-1 SUVA 1/24/2019 (L/mg-m) Source Well SP-43 2.893 12-1
Level-1 SUVA 1/24/2019 (L/mg-m) Source Well SP-46 2.863 12-1
Level-1 SUVA 1/24/2019 (L/mg-m) Source Well SP-49 2.936 12-3
Level-1 SUVA 1/24/2019 (L/mg-m) Source Well SP-50 2.817 12-1
Level-1 SUVA 1/24/2019 (L/mg-m) Source Well ST3 3.177 13-1
Level-1 Bromide 1/24/2019 mg/L U Source Well NWH7 0.02 10-1
Level-1 Bromide 1/24/2019 mg/L U Source Well S-21-#5 0.02 10-2
Level-1 Fluoride 1/24/2019 mg/L Source Well NWH7 0.1 10-1
Level-1 Nitrite 1/24/2019 mg/L U Source Well NWH7 0.18 10-1
Level-1 Nitrate 1/24/2019 mg/L U Source Well NWH7 0.18 10-1
Level-1 Ortho P 1/24/2019 mg/L Source Well NWH7 0.041 10-1
Level-1 Nitrite 1/24/2019 mg/L U Source Well S-21-#5 0.18 10-2
Level-1 Nitrate 1/24/2019 mg/L U Source Well S-21-#5 0.18 10-2
Level-1 Iron 1/24/2019 mg/L Source Well S-21-#5 0.074 10-2
Level-1 SIntRegI 1/17/2019 au Source Well SP-50 2475.5 12-1
Level-1 SIntRegI 1/17/2019 au Source Well ST3 1710.4 13-1
Level-1 SIntRegII 1/17/2019 au Source Well SP-50 14498.1 12-1
Level-1 SIntRegII 1/17/2019 au Source Well ST3 10324.799 13-1
Level-1 SIntRegIII 1/17/2019 au Source Well SP-50 17863.305 12-1
Level-1 SIntRegIII 1/17/2019 au Source Well ST3 12762.4 13-1
Level-1 UV254 1/17/2019 cm-1 Source Well SP-50 0.126 12-1
Level-1 UV254 1/17/2019 cm-1 Source Well ST3 0.097 13-1
Level-1Total Organic Carbon
(TOC)1/17/2019 mg/L Source Well SP-50 4.47 12-1
Level-1 Bromide 1/17/2019 mg/L U Source Well SP-50 0.02 12-1
Level-1 TDS 1/17/2019 mg/L Source Well SP-50 231 12-1
Level-1Total Organic Carbon
(TOC)1/17/2019 mg/L Source Well ST3 3.05 13-1
Level-1 Bromide 1/17/2019 mg/L U Source Well ST3 0.02 13-1
Level-1 TDS 1/17/2019 mg/L Source Well ST3 182 13-1
Level-1 Bromide 1/16/2019 mg/L I Source Well SP-43 0.05 12-1
Level-1 Bromide 1/16/2019 mg/L I Source Well SP-46 0.05 12-1
Level-1 Bromide 1/16/2019 mg/L I Source Well SP-49 0.05 12-3
Level-1 SIntRegI 1/16/2019 au Source Well SP-43 2736.9 12-1
Level-1 SIntRegI 1/16/2019 au Source Well SP-46 2695.5 12-1
Level-1 SIntRegI 1/16/2019 au Source Well SP-49 2408.8 12-3
Level-1 SIntRegII 1/16/2019 au Source Well SP-43 14640.1 12-1
Level-1 SIntRegII 1/16/2019 au Source Well SP-46 16342.8 12-1
Level-1 SIntRegII 1/16/2019 au Source Well SP-49 14063.499 12-3
Level-1 SIntRegIII 1/16/2019 au Source Well SP-43 17662.5 12-1
Level-1 SIntRegIII 1/16/2019 au Source Well SP-46 19840.1 12-1
Level-1 SIntRegIII 1/16/2019 au Source Well SP-49 17014.3 12-3
Level-1 UV254 1/16/2019 cm-1 Source Well SP-43 0.119 12-1
Level-1 UV254 1/16/2019 cm-1 Source Well SP-46 0.135 12-1
Level-1 UV254 1/16/2019 cm-1 Source Well SP-49 0.115 12-3
Level-1Total Organic Carbon
(TOC)1/16/2019 mg/L Source Well SP-43 4.1 12-1
Level-1 TDS 1/16/2019 mg/L Source Well SP-43 249 12-1
Level-1Total Organic Carbon
(TOC)1/16/2019 mg/L Source Well SP-46 4.73 12-1
Appendix I: Water Supply Contract I-24

Tampa Bay Water Evaluation of Exhibit D Standards Final Report
Level Analyte Date Final Unit Qualifier Type Sample Name MDL Result Group
Level-1 TDS 1/16/2019 mg/L Source Well SP-46 245 12-1
Level-1Total Organic Carbon
(TOC)1/16/2019 mg/L Source Well SP-49 3.93 12-3
Level-1 TDS 1/16/2019 mg/L Source Well SP-49 230 12-3
Level-1 SUVA 1/11/2019 (L/mg-m) Source Well BUD-2 2.077 1-1
Level-1 SUVA 1/11/2019 (L/mg-m) Source Well BUD-4 0.701 1-2
Level-1 SUVA 1/11/2019 (L/mg-m) Source Well BUD-5R 1.746 1-3
Level-1 SUVA 1/11/2019 (L/mg-m) Source Well BUD-6 1.211 1-2
Level-1 SUVA 1/11/2019 (L/mg-m) Source Well BUD-7 0.709 1-4
Level-1 SUVA 1/11/2019 (L/mg-m) Source Well CB1 2.063 2-9
Level-1 SUVA 1/11/2019 (L/mg-m) Source Well CB10 1.703 2-1
Level-1 SUVA 1/11/2019 (L/mg-m) Source Well CB11 1.4253997 2-5
Level-1 SUVA 1/11/2019 (L/mg-m) Source Well CB12 0.654 2-6
Level-1 SUVA 1/11/2019 (L/mg-m) Source Well CB13 1.375 2-5
Level-1 SUVA 1/11/2019 (L/mg-m) Source Well CB15 1.801 2-7
Level-1 SUVA 1/11/2019 (L/mg-m) Source Well CB16 1.285 2-4
Level-1 SUVA 1/11/2019 (L/mg-m) Source Well CB17 0.844 2-3
Level-1 SUVA 1/11/2019 (L/mg-m) Source Well CB2 1.865 2-8
Level-1 SUVA 1/11/2019 (L/mg-m) Source Well CB4 1.597 2-1
Level-1 SUVA 1/11/2019 (L/mg-m) Source Well CB5 1.576 2-1
Level-1 SUVA 1/11/2019 (L/mg-m) Source Well CB7 2.049 2-8
Level-1 SUVA 1/11/2019 (L/mg-m) Source Well CC1 2.433 3-1
Level-1 SUVA 1/11/2019 (L/mg-m) Source Well CC10 2.508 3-4
Level-1 SUVA 1/11/2019 (L/mg-m) Source Well CC11 3.015 3-5
Level-1 SUVA 1/11/2019 (L/mg-m) Source Well CC12 2.124 3-3
Level-1 SUVA 1/11/2019 (L/mg-m) Source Well CC2 2.392 3-2
Level-1 SUVA 1/11/2019 (L/mg-m) Source Well CC3 2.247 3-3
Level-1 SUVA 1/11/2019 (L/mg-m) Source Well CC4 1.930 3-1
Level-1 SUVA 1/11/2019 (L/mg-m) Source Well CC6 2.253 3-3
Level-1 SUVA 1/11/2019 (L/mg-m) Source Well CC9 2.233 3-2
Level-1 SUVA 1/11/2019 (L/mg-m) Source Well CO-1 3.091 4-1
Level-1 SUVA 1/11/2019 (L/mg-m) Source Well CO-10 3.288 4-5
Level-1 SUVA 1/11/2019 (L/mg-m) Source Well CO-12A 3.236 4-3
Level-1 SUVA 1/11/2019 (L/mg-m) Source Well CO-16 2.754 4-2
Level-1 SUVA 1/11/2019 (L/mg-m) Source Well CO-18 3.235 4-1
Level-1 SUVA 1/11/2019 (L/mg-m) Source Well CO-21 2.920 4-2
Level-1 SUVA 1/11/2019 (L/mg-m) Source Well CO-25 3.182 4-5
Level-1 SUVA 1/11/2019 (L/mg-m) Source Well CO-30 3.270 4-5
Level-1 SUVA 1/11/2019 (L/mg-m) Source Well CO-31 4.089 4-4
Level-1 SUVA 1/11/2019 (L/mg-m) Source Well CO-34 3.187 4-1
Level-1 SUVA 1/11/2019 (L/mg-m) Source Well CO-3A 3.076 4-3
Level-1 SUVA 1/11/2019 (L/mg-m) Source Well CO-5 3.005 4-3
Level-1 SUVA 1/11/2019 (L/mg-m) Source Well CO-7A 2.718 4-1
Level-1 SUVA 1/11/2019 (L/mg-m) Source Well CO-8 2.906 4-1
Level-1 SUVA 1/11/2019 (L/mg-m) Source Well CRLWD1 2.987 5-1
Level-1 SUVA 1/11/2019 (L/mg-m) Source Well CRLWD2 2.524 5-1
Level-1 SUVA 1/11/2019 (L/mg-m) Source Well CRLWD3 2.473 5-1
Level-1 SUVA 1/11/2019 (L/mg-m) Source Well CY11 1.595 6-1
Level-1 SUVA 1/11/2019 (L/mg-m) Source Well CY4 1.886 6-1
Level-1 SUVA 1/11/2019 (L/mg-m) Source Well CY6 1.545 6-3
Level-1 SUVA 1/11/2019 (L/mg-m) Source Well CY8 2.377 6-2
Level-1 SUVA 1/11/2019 (L/mg-m) Source Well CY9 1.955 6-1
Level-1 SUVA 1/11/2019 (L/mg-m) Source Well ELW101 2.515 7-1
Level-1 SUVA 1/11/2019 (L/mg-m) Source Well ELW102 2.588 7-3
Level-1 SUVA 1/11/2019 (L/mg-m) Source Well ELW103 2.465 7-1
Level-1 SUVA 1/11/2019 (L/mg-m) Source Well ELW105 2.537 7-1
Level-1 SUVA 1/11/2019 (L/mg-m) Source Well ELW106 2.544 7-1
Level-1 SUVA 1/11/2019 (L/mg-m) Source Well ELW107 2.549 7-1
Level-1 SUVA 1/11/2019 (L/mg-m) Source Well ELW10A 3.302 7-4
Level-1 SUVA 1/11/2019 (L/mg-m) Source Well ELW110 3.047 7-6
Appendix I: Water Supply Contract I-25

Tampa Bay Water Evaluation of Exhibit D Standards Final Report
Level Analyte Date Final Unit Qualifier Type Sample Name MDL Result Group
Level-1 SUVA 1/11/2019 (L/mg-m) Source Well ELW112 2.963 7-3
Level-1 SUVA 1/11/2019 (L/mg-m) Source Well ELW113 2.995 7-6
Level-1 SUVA 1/11/2019 (L/mg-m) Source Well ELW114 3.303 7-6
Level-1 SUVA 1/11/2019 (L/mg-m) Source Well ELW116 3.258 7-7
Level-1 SUVA 1/11/2019 (L/mg-m) Source Well ELW120 3.160 7-6
Level-1 SUVA 1/11/2019 (L/mg-m) Source Well ELW13 3.448 7-5
Level-1 SUVA 1/11/2019 (L/mg-m) Source Well ELW131 2.563 7-9
Level-1 SUVA 1/11/2019 (L/mg-m) Source Well ELW136 2.563 7-12
Level-1 SUVA 1/11/2019 (L/mg-m) Source Well ELW137 2.841 7-6
Level-1 SUVA 1/11/2019 (L/mg-m) Source Well ELW139 3.035 7-6
Level-1 SUVA 1/11/2019 (L/mg-m) Source Well ELW140 2.688 7-3
Level-1 SUVA 1/11/2019 (L/mg-m) Source Well ELW141 2.822 7-3
Level-1 SUVA 1/11/2019 (L/mg-m) Source Well ELW142 2.701 7-3
Level-1 SUVA 1/11/2019 (L/mg-m) Source Well ELW9 3.560 7-2
Level-1 SUVA 1/11/2019 (L/mg-m) Source Well MB151 1.761 8-3
Level-1 SUVA 1/11/2019 (L/mg-m) Source Well MB153 1.651 8-2
Level-1 SUVA 1/11/2019 (L/mg-m) Source Well MB154 1.725 8-2
Level-1 SUVA 1/11/2019 (L/mg-m) Source Well MB155 2.008 8-2
Level-1 SUVA 1/11/2019 (L/mg-m) Source Well MB156 1.846 8-4
Level-1 SUVA 1/11/2019 (L/mg-m) Source Well MB157 1.907 8-2
Level-1 SUVA 1/11/2019 (L/mg-m) Source Well MB158 1.516 8-5
Level-1 SUVA 1/11/2019 (L/mg-m) Source Well MB159 1.770 8-6
Level-1 SUVA 1/11/2019 (L/mg-m) Source Well MB162 1.830 8-8
Level-1 SUVA 1/11/2019 (L/mg-m) Source Well MB164 1.881 8-9
Level-1 SUVA 1/11/2019 (L/mg-m) Source Well MB166 2.458 8-10
Level-1 SUVA 1/11/2019 (L/mg-m) Source Well MB167 1.761 8-11
Level-1 SUVA 1/11/2019 (L/mg-m) Source Well MB169 1.681 8-0
Level-1 SUVA 1/11/2019 (L/mg-m) Source Well NWH1 3.011 9-1
Level-1 SUVA 1/11/2019 (L/mg-m) Source Well NWH2 2.723 9-2
Level-1 SUVA 1/11/2019 (L/mg-m) Source Well NWH3 2.842 9-3
Level-1 SUVA 1/11/2019 (L/mg-m) Source Well NWH4 2.345 9-3
Level-1 SUVA 1/11/2019 (L/mg-m) Source Well NWH5 3.094 9-4
Level-1 SUVA 1/11/2019 (L/mg-m) Source Well NWH6 2.791 9-5
Level-1 SUVA 1/11/2019 (L/mg-m) Source Well S-21-#10 2.871 10-1
Level-1 SUVA 1/11/2019 (L/mg-m) Source Well S-21-#8 3.080 10-1
Level-1 SUVA 1/11/2019 (L/mg-m) Source Well SCH1 2.716 11-1
Level-1 SUVA 1/11/2019 (L/mg-m) Source Well SCH10 2.113 11-2
Level-1 SUVA 1/11/2019 (L/mg-m) Source Well SCH13 2.747 11-7
Level-1 SUVA 1/11/2019 (L/mg-m) Source Well SCH14 3.188 11-8
Level-1 SUVA 1/11/2019 (L/mg-m) Source Well SCH15 2.394 11-7
Level-1 SUVA 1/11/2019 (L/mg-m) Source Well SCH2 1.871 11-2
Level-1 SUVA 1/11/2019 (L/mg-m) Source Well SCH4 2.249 11-2
Level-1 SUVA 1/11/2019 (L/mg-m) Source Well SCH5 2.008 11-2
Level-1 SUVA 1/11/2019 (L/mg-m) Source Well SCH7 2.530 11-1
Level-1 SUVA 1/11/2019 (L/mg-m) Source Well SCH8 2.119 11-2
Level-1 SUVA 1/11/2019 (L/mg-m) Source Well ST10 2.818 13-4
Level-1 SUVA 1/11/2019 (L/mg-m) Source Well ST4 2.509 13-4
Level-1 SUVA 1/11/2019 (L/mg-m) Source Well ST7 3.111 13-4
Level-1 SUVA 1/11/2019 (L/mg-m) Source Well ST8 2.376 13-4
Level-1 SUVA 1/11/2019 (L/mg-m) Source Well ST9 3.765 13-5
Level-1 SIntRegI 1/10/2019 au Source Well MB164 1383.2 8-9
Level-1 SIntRegI 1/10/2019 au Source Well MB166 1225.9 8-10
Level-1 SIntRegI 1/10/2019 au Source Well SCH17 1021.3 11-7
Level-1 SIntRegI 1/10/2019 au Source Well BUD-5R 676.5 1-3
Level-1 SIntRegII 1/10/2019 au Source Well MB164 6954.8 8-9
Level-1 SIntRegII 1/10/2019 au Source Well MB166 6668.0 8-10
Level-1 SIntRegII 1/10/2019 au Source Well SCH17 4967.6 11-7
Level-1 SIntRegII 1/10/2019 au Source Well BUD-5R 3525.2 1-3
Level-1 SIntRegIII 1/10/2019 au Source Well MB164 8799.9 8-9
Level-1 SIntRegIII 1/10/2019 au Source Well MB166 8459.1 8-10
Appendix I: Water Supply Contract I-26
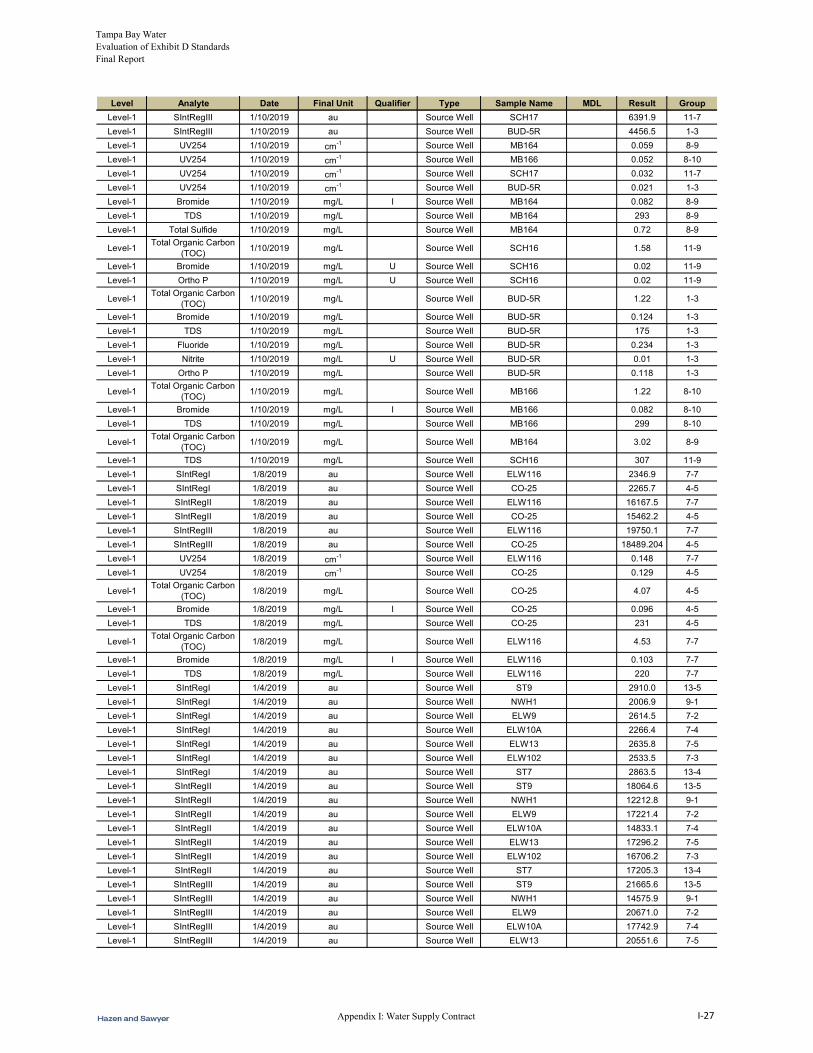
Tampa Bay Water Evaluation of Exhibit D Standards Final Report
Level Analyte Date Final Unit Qualifier Type Sample Name MDL Result Group
Level-1 SIntRegIII 1/10/2019 au Source Well SCH17 6391.9 11-7
Level-1 SIntRegIII 1/10/2019 au Source Well BUD-5R 4456.5 1-3
Level-1 UV254 1/10/2019 cm-1 Source Well MB164 0.059 8-9
Level-1 UV254 1/10/2019 cm-1 Source Well MB166 0.052 8-10
Level-1 UV254 1/10/2019 cm-1 Source Well SCH17 0.032 11-7
Level-1 UV254 1/10/2019 cm-1 Source Well BUD-5R 0.021 1-3
Level-1 Bromide 1/10/2019 mg/L I Source Well MB164 0.082 8-9
Level-1 TDS 1/10/2019 mg/L Source Well MB164 293 8-9
Level-1 Total Sulfide 1/10/2019 mg/L Source Well MB164 0.72 8-9
Level-1Total Organic Carbon
(TOC)1/10/2019 mg/L Source Well SCH16 1.58 11-9
Level-1 Bromide 1/10/2019 mg/L U Source Well SCH16 0.02 11-9
Level-1 Ortho P 1/10/2019 mg/L U Source Well SCH16 0.02 11-9
Level-1Total Organic Carbon
(TOC)1/10/2019 mg/L Source Well BUD-5R 1.22 1-3
Level-1 Bromide 1/10/2019 mg/L Source Well BUD-5R 0.124 1-3
Level-1 TDS 1/10/2019 mg/L Source Well BUD-5R 175 1-3
Level-1 Fluoride 1/10/2019 mg/L Source Well BUD-5R 0.234 1-3
Level-1 Nitrite 1/10/2019 mg/L U Source Well BUD-5R 0.01 1-3
Level-1 Ortho P 1/10/2019 mg/L Source Well BUD-5R 0.118 1-3
Level-1Total Organic Carbon
(TOC)1/10/2019 mg/L Source Well MB166 1.22 8-10
Level-1 Bromide 1/10/2019 mg/L I Source Well MB166 0.082 8-10
Level-1 TDS 1/10/2019 mg/L Source Well MB166 299 8-10
Level-1Total Organic Carbon
(TOC)1/10/2019 mg/L Source Well MB164 3.02 8-9
Level-1 TDS 1/10/2019 mg/L Source Well SCH16 307 11-9
Level-1 SIntRegI 1/8/2019 au Source Well ELW116 2346.9 7-7
Level-1 SIntRegI 1/8/2019 au Source Well CO-25 2265.7 4-5
Level-1 SIntRegII 1/8/2019 au Source Well ELW116 16167.5 7-7
Level-1 SIntRegII 1/8/2019 au Source Well CO-25 15462.2 4-5
Level-1 SIntRegIII 1/8/2019 au Source Well ELW116 19750.1 7-7
Level-1 SIntRegIII 1/8/2019 au Source Well CO-25 18489.204 4-5
Level-1 UV254 1/8/2019 cm-1 Source Well ELW116 0.148 7-7
Level-1 UV254 1/8/2019 cm-1 Source Well CO-25 0.129 4-5
Level-1Total Organic Carbon
(TOC)1/8/2019 mg/L Source Well CO-25 4.07 4-5
Level-1 Bromide 1/8/2019 mg/L I Source Well CO-25 0.096 4-5
Level-1 TDS 1/8/2019 mg/L Source Well CO-25 231 4-5
Level-1Total Organic Carbon
(TOC)1/8/2019 mg/L Source Well ELW116 4.53 7-7
Level-1 Bromide 1/8/2019 mg/L I Source Well ELW116 0.103 7-7
Level-1 TDS 1/8/2019 mg/L Source Well ELW116 220 7-7
Level-1 SIntRegI 1/4/2019 au Source Well ST9 2910.0 13-5
Level-1 SIntRegI 1/4/2019 au Source Well NWH1 2006.9 9-1
Level-1 SIntRegI 1/4/2019 au Source Well ELW9 2614.5 7-2
Level-1 SIntRegI 1/4/2019 au Source Well ELW10A 2266.4 7-4
Level-1 SIntRegI 1/4/2019 au Source Well ELW13 2635.8 7-5
Level-1 SIntRegI 1/4/2019 au Source Well ELW102 2533.5 7-3
Level-1 SIntRegI 1/4/2019 au Source Well ST7 2863.5 13-4
Level-1 SIntRegII 1/4/2019 au Source Well ST9 18064.6 13-5
Level-1 SIntRegII 1/4/2019 au Source Well NWH1 12212.8 9-1
Level-1 SIntRegII 1/4/2019 au Source Well ELW9 17221.4 7-2
Level-1 SIntRegII 1/4/2019 au Source Well ELW10A 14833.1 7-4
Level-1 SIntRegII 1/4/2019 au Source Well ELW13 17296.2 7-5
Level-1 SIntRegII 1/4/2019 au Source Well ELW102 16706.2 7-3
Level-1 SIntRegII 1/4/2019 au Source Well ST7 17205.3 13-4
Level-1 SIntRegIII 1/4/2019 au Source Well ST9 21665.6 13-5
Level-1 SIntRegIII 1/4/2019 au Source Well NWH1 14575.9 9-1
Level-1 SIntRegIII 1/4/2019 au Source Well ELW9 20671.0 7-2
Level-1 SIntRegIII 1/4/2019 au Source Well ELW10A 17742.9 7-4
Level-1 SIntRegIII 1/4/2019 au Source Well ELW13 20551.6 7-5
Appendix I: Water Supply Contract I-27
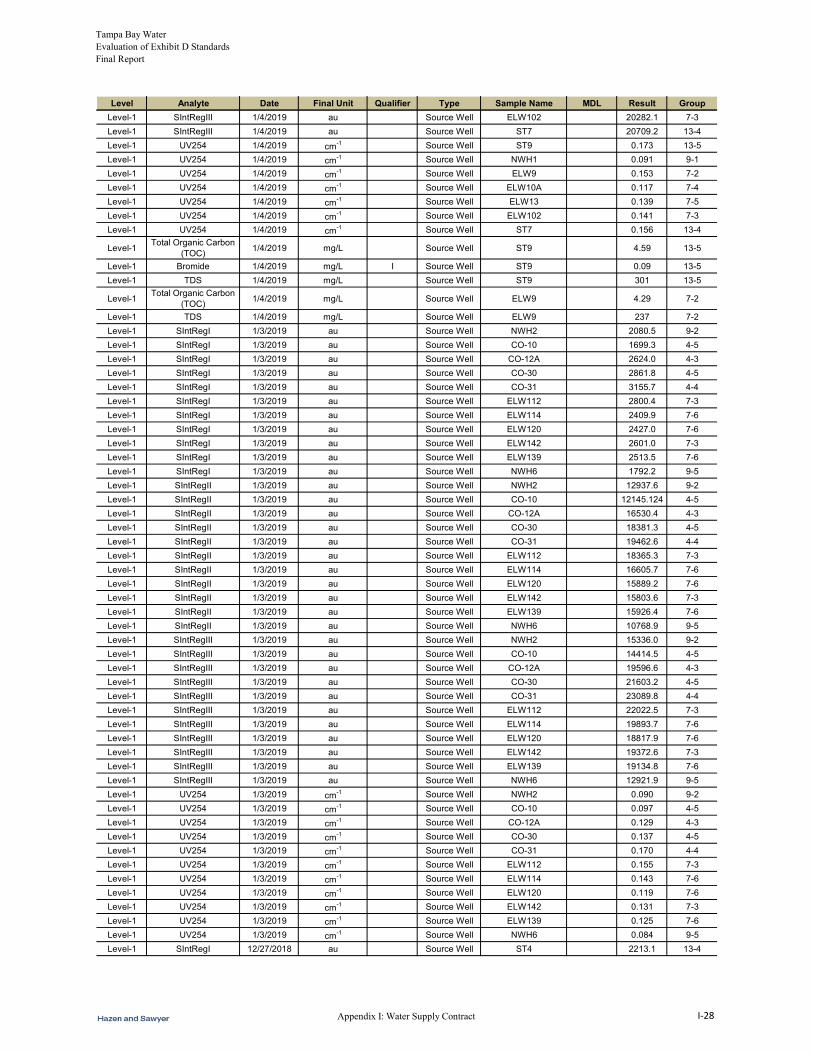
Tampa Bay Water Evaluation of Exhibit D Standards Final Report
Level Analyte Date Final Unit Qualifier Type Sample Name MDL Result Group
Level-1 SIntRegIII 1/4/2019 au Source Well ELW102 20282.1 7-3
Level-1 SIntRegIII 1/4/2019 au Source Well ST7 20709.2 13-4
Level-1 UV254 1/4/2019 cm-1 Source Well ST9 0.173 13-5
Level-1 UV254 1/4/2019 cm-1 Source Well NWH1 0.091 9-1
Level-1 UV254 1/4/2019 cm-1 Source Well ELW9 0.153 7-2
Level-1 UV254 1/4/2019 cm-1 Source Well ELW10A 0.117 7-4
Level-1 UV254 1/4/2019 cm-1 Source Well ELW13 0.139 7-5
Level-1 UV254 1/4/2019 cm-1 Source Well ELW102 0.141 7-3
Level-1 UV254 1/4/2019 cm-1 Source Well ST7 0.156 13-4
Level-1Total Organic Carbon
(TOC)1/4/2019 mg/L Source Well ST9 4.59 13-5
Level-1 Bromide 1/4/2019 mg/L I Source Well ST9 0.09 13-5
Level-1 TDS 1/4/2019 mg/L Source Well ST9 301 13-5
Level-1Total Organic Carbon
(TOC)1/4/2019 mg/L Source Well ELW9 4.29 7-2
Level-1 TDS 1/4/2019 mg/L Source Well ELW9 237 7-2
Level-1 SIntRegI 1/3/2019 au Source Well NWH2 2080.5 9-2
Level-1 SIntRegI 1/3/2019 au Source Well CO-10 1699.3 4-5
Level-1 SIntRegI 1/3/2019 au Source Well CO-12A 2624.0 4-3
Level-1 SIntRegI 1/3/2019 au Source Well CO-30 2861.8 4-5
Level-1 SIntRegI 1/3/2019 au Source Well CO-31 3155.7 4-4
Level-1 SIntRegI 1/3/2019 au Source Well ELW112 2800.4 7-3
Level-1 SIntRegI 1/3/2019 au Source Well ELW114 2409.9 7-6
Level-1 SIntRegI 1/3/2019 au Source Well ELW120 2427.0 7-6
Level-1 SIntRegI 1/3/2019 au Source Well ELW142 2601.0 7-3
Level-1 SIntRegI 1/3/2019 au Source Well ELW139 2513.5 7-6
Level-1 SIntRegI 1/3/2019 au Source Well NWH6 1792.2 9-5
Level-1 SIntRegII 1/3/2019 au Source Well NWH2 12937.6 9-2
Level-1 SIntRegII 1/3/2019 au Source Well CO-10 12145.124 4-5
Level-1 SIntRegII 1/3/2019 au Source Well CO-12A 16530.4 4-3
Level-1 SIntRegII 1/3/2019 au Source Well CO-30 18381.3 4-5
Level-1 SIntRegII 1/3/2019 au Source Well CO-31 19462.6 4-4
Level-1 SIntRegII 1/3/2019 au Source Well ELW112 18365.3 7-3
Level-1 SIntRegII 1/3/2019 au Source Well ELW114 16605.7 7-6
Level-1 SIntRegII 1/3/2019 au Source Well ELW120 15889.2 7-6
Level-1 SIntRegII 1/3/2019 au Source Well ELW142 15803.6 7-3
Level-1 SIntRegII 1/3/2019 au Source Well ELW139 15926.4 7-6
Level-1 SIntRegII 1/3/2019 au Source Well NWH6 10768.9 9-5
Level-1 SIntRegIII 1/3/2019 au Source Well NWH2 15336.0 9-2
Level-1 SIntRegIII 1/3/2019 au Source Well CO-10 14414.5 4-5
Level-1 SIntRegIII 1/3/2019 au Source Well CO-12A 19596.6 4-3
Level-1 SIntRegIII 1/3/2019 au Source Well CO-30 21603.2 4-5
Level-1 SIntRegIII 1/3/2019 au Source Well CO-31 23089.8 4-4
Level-1 SIntRegIII 1/3/2019 au Source Well ELW112 22022.5 7-3
Level-1 SIntRegIII 1/3/2019 au Source Well ELW114 19893.7 7-6
Level-1 SIntRegIII 1/3/2019 au Source Well ELW120 18817.9 7-6
Level-1 SIntRegIII 1/3/2019 au Source Well ELW142 19372.6 7-3
Level-1 SIntRegIII 1/3/2019 au Source Well ELW139 19134.8 7-6
Level-1 SIntRegIII 1/3/2019 au Source Well NWH6 12921.9 9-5
Level-1 UV254 1/3/2019 cm-1 Source Well NWH2 0.090 9-2
Level-1 UV254 1/3/2019 cm-1 Source Well CO-10 0.097 4-5
Level-1 UV254 1/3/2019 cm-1 Source Well CO-12A 0.129 4-3
Level-1 UV254 1/3/2019 cm-1 Source Well CO-30 0.137 4-5
Level-1 UV254 1/3/2019 cm-1 Source Well CO-31 0.170 4-4
Level-1 UV254 1/3/2019 cm-1 Source Well ELW112 0.155 7-3
Level-1 UV254 1/3/2019 cm-1 Source Well ELW114 0.143 7-6
Level-1 UV254 1/3/2019 cm-1 Source Well ELW120 0.119 7-6
Level-1 UV254 1/3/2019 cm-1 Source Well ELW142 0.131 7-3
Level-1 UV254 1/3/2019 cm-1 Source Well ELW139 0.125 7-6
Level-1 UV254 1/3/2019 cm-1 Source Well NWH6 0.084 9-5
Level-1 SIntRegI 12/27/2018 au Source Well ST4 2213.1 13-4
Appendix I: Water Supply Contract I-28

Tampa Bay Water Evaluation of Exhibit D Standards Final Report
Level Analyte Date Final Unit Qualifier Type Sample Name MDL Result Group
Level-1 SIntRegI 12/27/2018 au Source Well ST8 2689.1 13-4
Level-1 SIntRegI 12/27/2018 au Source Well MB157 1613.4 8-2
Level-1 SIntRegI 12/27/2018 au Source Well MB158 958.2 8-5
Level-1 SIntRegI 12/27/2018 au Source Well MB167 1084.2 8-11
Level-1 SIntRegI 12/27/2018 au Source Well MB169 1231.0 8-0
Level-1 SIntRegI 12/27/2018 au Source Well MB151 1667.1 8-3
Level-1 SIntRegI 12/27/2018 au Source Well MB153 1771.6 8-2
Level-1 SIntRegI 12/27/2018 au Source Well MB154 1740.4 8-2
Level-1 SIntRegI 12/27/2018 au Source Well MB159 1750.7 8-6
Level-1 SIntRegII 12/27/2018 au Source Well ST4 13623.8 13-4
Level-1 SIntRegII 12/27/2018 au Source Well ST8 16512.6 13-4
Level-1 SIntRegII 12/27/2018 au Source Well MB157 9141.7 8-2
Level-1 SIntRegII 12/27/2018 au Source Well MB158 4936.0 8-5
Level-1 SIntRegII 12/27/2018 au Source Well MB167 6238.3 8-11
Level-1 SIntRegII 12/27/2018 au Source Well MB169 6886.4 8-0
Level-1 SIntRegII 12/27/2018 au Source Well MB151 7847.9 8-3
Level-1 SIntRegII 12/27/2018 au Source Well MB153 8786.9 8-2
Level-1 SIntRegII 12/27/2018 au Source Well MB154 9871.9 8-2
Level-1 SIntRegII 12/27/2018 au Source Well MB159 8729.6 8-6
Level-1 SIntRegIII 12/27/2018 au Source Well ST4 16511.4 13-4
Level-1 SIntRegIII 12/27/2018 au Source Well ST8 19707.7 13-4
Level-1 SIntRegIII 12/27/2018 au Source Well MB157 11679.8 8-2
Level-1 SIntRegIII 12/27/2018 au Source Well MB158 6394.3 8-5
Level-1 SIntRegIII 12/27/2018 au Source Well MB167 7984.6 8-11
Level-1 SIntRegIII 12/27/2018 au Source Well MB169 8821.2 8-0
Level-1 SIntRegIII 12/27/2018 au Source Well MB151 10061.3 8-3
Level-1 SIntRegIII 12/27/2018 au Source Well MB153 11291.0 8-2
Level-1 SIntRegIII 12/27/2018 au Source Well MB154 12606.7 8-2
Level-1 SIntRegIII 12/27/2018 au Source Well MB159 11225.0 8-6
Level-1 UV254 12/27/2018 cm-1 Source Well ST4 0.120 13-4
Level-1 UV254 12/27/2018 cm-1 Source Well ST8 0.127 13-4
Level-1 UV254 12/27/2018 cm-1 Source Well MB157 0.083 8-2
Level-1 UV254 12/27/2018 cm-1 Source Well MB158 0.041 8-5
Level-1 UV254 12/27/2018 cm-1 Source Well MB167 0.055 8-11
Level-1 UV254 12/27/2018 cm-1 Source Well MB169 0.063 8-0
Level-1 UV254 12/27/2018 cm-1 Source Well MB151 0.068 8-3
Level-1 UV254 12/27/2018 cm-1 Source Well MB153 0.076 8-2
Level-1 UV254 12/27/2018 cm-1 Source Well MB154 0.090 8-2
Level-1 UV254 12/27/2018 cm-1 Source Well MB159 0.078 8-6
Level-1 SIntRegI 12/20/2018 au Source Well NWH3 1959.2 9-3
Level-1 SIntRegI 12/20/2018 au Source Well NWH4 2211.5 9-3
Level-1 SIntRegI 12/20/2018 au Source Well CC4 1302.7 3-1
Level-1 SIntRegII 12/20/2018 au Source Well NWH3 12317.8 9-3
Level-1 SIntRegII 12/20/2018 au Source Well NWH4 13480.6 9-3
Level-1 SIntRegII 12/20/2018 au Source Well CC4 6797.4 3-1
Level-1 SIntRegIII 12/20/2018 au Source Well NWH3 14749.4 9-3
Level-1 SIntRegIII 12/20/2018 au Source Well NWH4 16179.2 9-3
Level-1 SIntRegIII 12/20/2018 au Source Well CC4 8764.9 3-1
Level-1 UV254 12/20/2018 cm-1 Source Well NWH3 0.093 9-3
Level-1 UV254 12/20/2018 cm-1 Source Well NWH4 0.101 9-3
Level-1 UV254 12/20/2018 cm-1 Source Well CC4 0.069 3-1
Level-1 SIntRegI 12/19/2018 au Source Well NWH5 2132.6 9-4
Level-1 SIntRegI 12/19/2018 au Source Well S-21-#8 2185.1 10-1
Level-1 SIntRegI 12/19/2018 au Source Well S-21-#10 2136.9 10-1
Level-1 SIntRegI 12/19/2018 au Source Well CRLWD1 1526.0 5-1
Level-1 SIntRegI 12/19/2018 au Source Well CRLWD2 1401.8 5-1
Level-1 SIntRegI 12/19/2018 au Source Well CRLWD3 1338.0 5-1
Level-1 SIntRegII 12/19/2018 au Source Well NWH5 12655.3 9-4
Level-1 SIntRegII 12/19/2018 au Source Well S-21-#8 14150.7 10-1
Level-1 SIntRegII 12/19/2018 au Source Well S-21-#10 13744.0 10-1
Appendix I: Water Supply Contract I-29
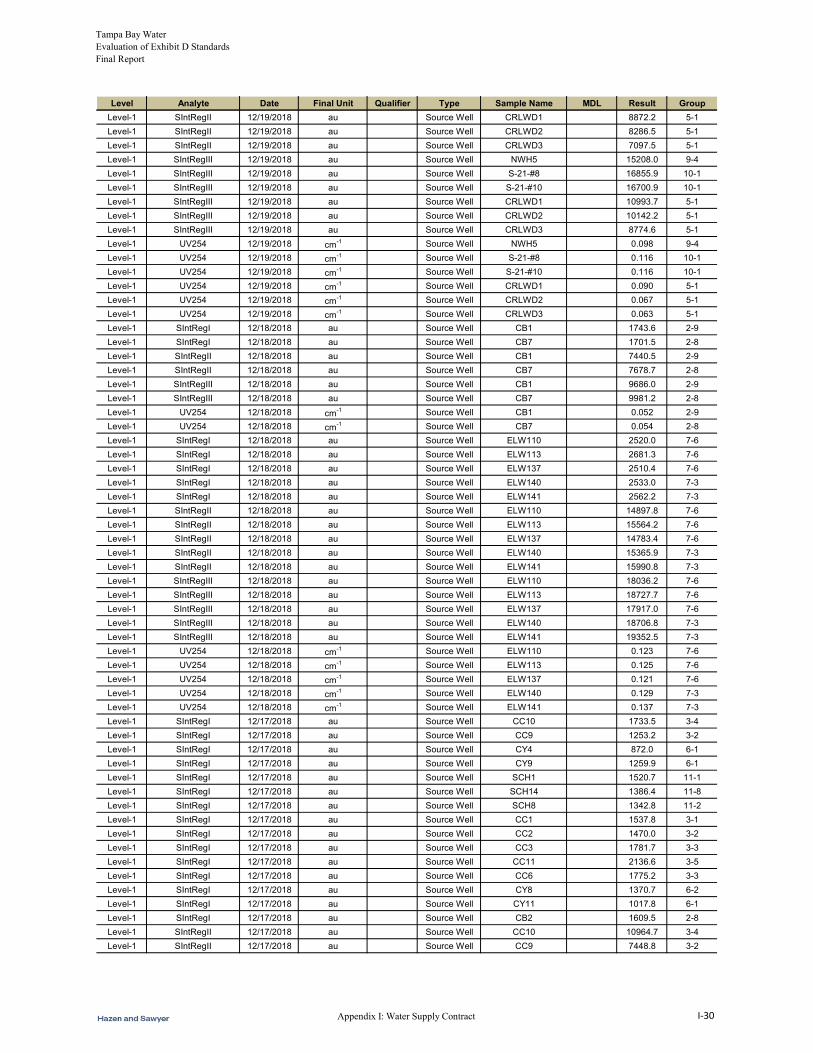
Tampa Bay Water Evaluation of Exhibit D Standards Final Report
Level Analyte Date Final Unit Qualifier Type Sample Name MDL Result Group
Level-1 SIntRegII 12/19/2018 au Source Well CRLWD1 8872.2 5-1
Level-1 SIntRegII 12/19/2018 au Source Well CRLWD2 8286.5 5-1
Level-1 SIntRegII 12/19/2018 au Source Well CRLWD3 7097.5 5-1
Level-1 SIntRegIII 12/19/2018 au Source Well NWH5 15208.0 9-4
Level-1 SIntRegIII 12/19/2018 au Source Well S-21-#8 16855.9 10-1
Level-1 SIntRegIII 12/19/2018 au Source Well S-21-#10 16700.9 10-1
Level-1 SIntRegIII 12/19/2018 au Source Well CRLWD1 10993.7 5-1
Level-1 SIntRegIII 12/19/2018 au Source Well CRLWD2 10142.2 5-1
Level-1 SIntRegIII 12/19/2018 au Source Well CRLWD3 8774.6 5-1
Level-1 UV254 12/19/2018 cm-1 Source Well NWH5 0.098 9-4
Level-1 UV254 12/19/2018 cm-1 Source Well S-21-#8 0.116 10-1
Level-1 UV254 12/19/2018 cm-1 Source Well S-21-#10 0.116 10-1
Level-1 UV254 12/19/2018 cm-1 Source Well CRLWD1 0.090 5-1
Level-1 UV254 12/19/2018 cm-1 Source Well CRLWD2 0.067 5-1
Level-1 UV254 12/19/2018 cm-1 Source Well CRLWD3 0.063 5-1
Level-1 SIntRegI 12/18/2018 au Source Well CB1 1743.6 2-9
Level-1 SIntRegI 12/18/2018 au Source Well CB7 1701.5 2-8
Level-1 SIntRegII 12/18/2018 au Source Well CB1 7440.5 2-9
Level-1 SIntRegII 12/18/2018 au Source Well CB7 7678.7 2-8
Level-1 SIntRegIII 12/18/2018 au Source Well CB1 9686.0 2-9
Level-1 SIntRegIII 12/18/2018 au Source Well CB7 9981.2 2-8
Level-1 UV254 12/18/2018 cm-1 Source Well CB1 0.052 2-9
Level-1 UV254 12/18/2018 cm-1 Source Well CB7 0.054 2-8
Level-1 SIntRegI 12/18/2018 au Source Well ELW110 2520.0 7-6
Level-1 SIntRegI 12/18/2018 au Source Well ELW113 2681.3 7-6
Level-1 SIntRegI 12/18/2018 au Source Well ELW137 2510.4 7-6
Level-1 SIntRegI 12/18/2018 au Source Well ELW140 2533.0 7-3
Level-1 SIntRegI 12/18/2018 au Source Well ELW141 2562.2 7-3
Level-1 SIntRegII 12/18/2018 au Source Well ELW110 14897.8 7-6
Level-1 SIntRegII 12/18/2018 au Source Well ELW113 15564.2 7-6
Level-1 SIntRegII 12/18/2018 au Source Well ELW137 14783.4 7-6
Level-1 SIntRegII 12/18/2018 au Source Well ELW140 15365.9 7-3
Level-1 SIntRegII 12/18/2018 au Source Well ELW141 15990.8 7-3
Level-1 SIntRegIII 12/18/2018 au Source Well ELW110 18036.2 7-6
Level-1 SIntRegIII 12/18/2018 au Source Well ELW113 18727.7 7-6
Level-1 SIntRegIII 12/18/2018 au Source Well ELW137 17917.0 7-6
Level-1 SIntRegIII 12/18/2018 au Source Well ELW140 18706.8 7-3
Level-1 SIntRegIII 12/18/2018 au Source Well ELW141 19352.5 7-3
Level-1 UV254 12/18/2018 cm-1 Source Well ELW110 0.123 7-6
Level-1 UV254 12/18/2018 cm-1 Source Well ELW113 0.125 7-6
Level-1 UV254 12/18/2018 cm-1 Source Well ELW137 0.121 7-6
Level-1 UV254 12/18/2018 cm-1 Source Well ELW140 0.129 7-3
Level-1 UV254 12/18/2018 cm-1 Source Well ELW141 0.137 7-3
Level-1 SIntRegI 12/17/2018 au Source Well CC10 1733.5 3-4
Level-1 SIntRegI 12/17/2018 au Source Well CC9 1253.2 3-2
Level-1 SIntRegI 12/17/2018 au Source Well CY4 872.0 6-1
Level-1 SIntRegI 12/17/2018 au Source Well CY9 1259.9 6-1
Level-1 SIntRegI 12/17/2018 au Source Well SCH1 1520.7 11-1
Level-1 SIntRegI 12/17/2018 au Source Well SCH14 1386.4 11-8
Level-1 SIntRegI 12/17/2018 au Source Well SCH8 1342.8 11-2
Level-1 SIntRegI 12/17/2018 au Source Well CC1 1537.8 3-1
Level-1 SIntRegI 12/17/2018 au Source Well CC2 1470.0 3-2
Level-1 SIntRegI 12/17/2018 au Source Well CC3 1781.7 3-3
Level-1 SIntRegI 12/17/2018 au Source Well CC11 2136.6 3-5
Level-1 SIntRegI 12/17/2018 au Source Well CC6 1775.2 3-3
Level-1 SIntRegI 12/17/2018 au Source Well CY8 1370.7 6-2
Level-1 SIntRegI 12/17/2018 au Source Well CY11 1017.8 6-1
Level-1 SIntRegI 12/17/2018 au Source Well CB2 1609.5 2-8
Level-1 SIntRegII 12/17/2018 au Source Well CC10 10964.7 3-4
Level-1 SIntRegII 12/17/2018 au Source Well CC9 7448.8 3-2
Appendix I: Water Supply Contract I-30
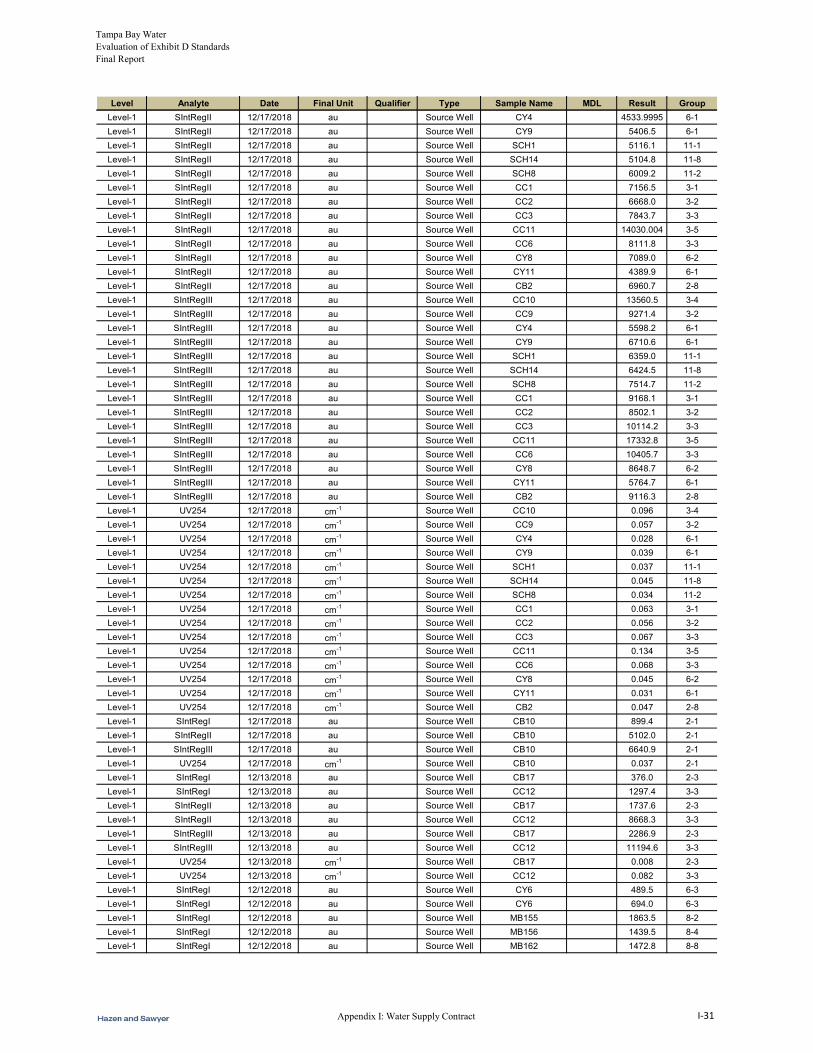
Tampa Bay Water Evaluation of Exhibit D Standards Final Report
Level Analyte Date Final Unit Qualifier Type Sample Name MDL Result Group
Level-1 SIntRegII 12/17/2018 au Source Well CY4 4533.9995 6-1
Level-1 SIntRegII 12/17/2018 au Source Well CY9 5406.5 6-1
Level-1 SIntRegII 12/17/2018 au Source Well SCH1 5116.1 11-1
Level-1 SIntRegII 12/17/2018 au Source Well SCH14 5104.8 11-8
Level-1 SIntRegII 12/17/2018 au Source Well SCH8 6009.2 11-2
Level-1 SIntRegII 12/17/2018 au Source Well CC1 7156.5 3-1
Level-1 SIntRegII 12/17/2018 au Source Well CC2 6668.0 3-2
Level-1 SIntRegII 12/17/2018 au Source Well CC3 7843.7 3-3
Level-1 SIntRegII 12/17/2018 au Source Well CC11 14030.004 3-5
Level-1 SIntRegII 12/17/2018 au Source Well CC6 8111.8 3-3
Level-1 SIntRegII 12/17/2018 au Source Well CY8 7089.0 6-2
Level-1 SIntRegII 12/17/2018 au Source Well CY11 4389.9 6-1
Level-1 SIntRegII 12/17/2018 au Source Well CB2 6960.7 2-8
Level-1 SIntRegIII 12/17/2018 au Source Well CC10 13560.5 3-4
Level-1 SIntRegIII 12/17/2018 au Source Well CC9 9271.4 3-2
Level-1 SIntRegIII 12/17/2018 au Source Well CY4 5598.2 6-1
Level-1 SIntRegIII 12/17/2018 au Source Well CY9 6710.6 6-1
Level-1 SIntRegIII 12/17/2018 au Source Well SCH1 6359.0 11-1
Level-1 SIntRegIII 12/17/2018 au Source Well SCH14 6424.5 11-8
Level-1 SIntRegIII 12/17/2018 au Source Well SCH8 7514.7 11-2
Level-1 SIntRegIII 12/17/2018 au Source Well CC1 9168.1 3-1
Level-1 SIntRegIII 12/17/2018 au Source Well CC2 8502.1 3-2
Level-1 SIntRegIII 12/17/2018 au Source Well CC3 10114.2 3-3
Level-1 SIntRegIII 12/17/2018 au Source Well CC11 17332.8 3-5
Level-1 SIntRegIII 12/17/2018 au Source Well CC6 10405.7 3-3
Level-1 SIntRegIII 12/17/2018 au Source Well CY8 8648.7 6-2
Level-1 SIntRegIII 12/17/2018 au Source Well CY11 5764.7 6-1
Level-1 SIntRegIII 12/17/2018 au Source Well CB2 9116.3 2-8
Level-1 UV254 12/17/2018 cm-1 Source Well CC10 0.096 3-4
Level-1 UV254 12/17/2018 cm-1 Source Well CC9 0.057 3-2
Level-1 UV254 12/17/2018 cm-1 Source Well CY4 0.028 6-1
Level-1 UV254 12/17/2018 cm-1 Source Well CY9 0.039 6-1
Level-1 UV254 12/17/2018 cm-1 Source Well SCH1 0.037 11-1
Level-1 UV254 12/17/2018 cm-1 Source Well SCH14 0.045 11-8
Level-1 UV254 12/17/2018 cm-1 Source Well SCH8 0.034 11-2
Level-1 UV254 12/17/2018 cm-1 Source Well CC1 0.063 3-1
Level-1 UV254 12/17/2018 cm-1 Source Well CC2 0.056 3-2
Level-1 UV254 12/17/2018 cm-1 Source Well CC3 0.067 3-3
Level-1 UV254 12/17/2018 cm-1 Source Well CC11 0.134 3-5
Level-1 UV254 12/17/2018 cm-1 Source Well CC6 0.068 3-3
Level-1 UV254 12/17/2018 cm-1 Source Well CY8 0.045 6-2
Level-1 UV254 12/17/2018 cm-1 Source Well CY11 0.031 6-1
Level-1 UV254 12/17/2018 cm-1 Source Well CB2 0.047 2-8
Level-1 SIntRegI 12/17/2018 au Source Well CB10 899.4 2-1
Level-1 SIntRegII 12/17/2018 au Source Well CB10 5102.0 2-1
Level-1 SIntRegIII 12/17/2018 au Source Well CB10 6640.9 2-1
Level-1 UV254 12/17/2018 cm-1 Source Well CB10 0.037 2-1
Level-1 SIntRegI 12/13/2018 au Source Well CB17 376.0 2-3
Level-1 SIntRegI 12/13/2018 au Source Well CC12 1297.4 3-3
Level-1 SIntRegII 12/13/2018 au Source Well CB17 1737.6 2-3
Level-1 SIntRegII 12/13/2018 au Source Well CC12 8668.3 3-3
Level-1 SIntRegIII 12/13/2018 au Source Well CB17 2286.9 2-3
Level-1 SIntRegIII 12/13/2018 au Source Well CC12 11194.6 3-3
Level-1 UV254 12/13/2018 cm-1 Source Well CB17 0.008 2-3
Level-1 UV254 12/13/2018 cm-1 Source Well CC12 0.082 3-3
Level-1 SIntRegI 12/12/2018 au Source Well CY6 489.5 6-3
Level-1 SIntRegI 12/12/2018 au Source Well CY6 694.0 6-3
Level-1 SIntRegI 12/12/2018 au Source Well MB155 1863.5 8-2
Level-1 SIntRegI 12/12/2018 au Source Well MB156 1439.5 8-4
Level-1 SIntRegI 12/12/2018 au Source Well MB162 1472.8 8-8
Appendix I: Water Supply Contract I-31
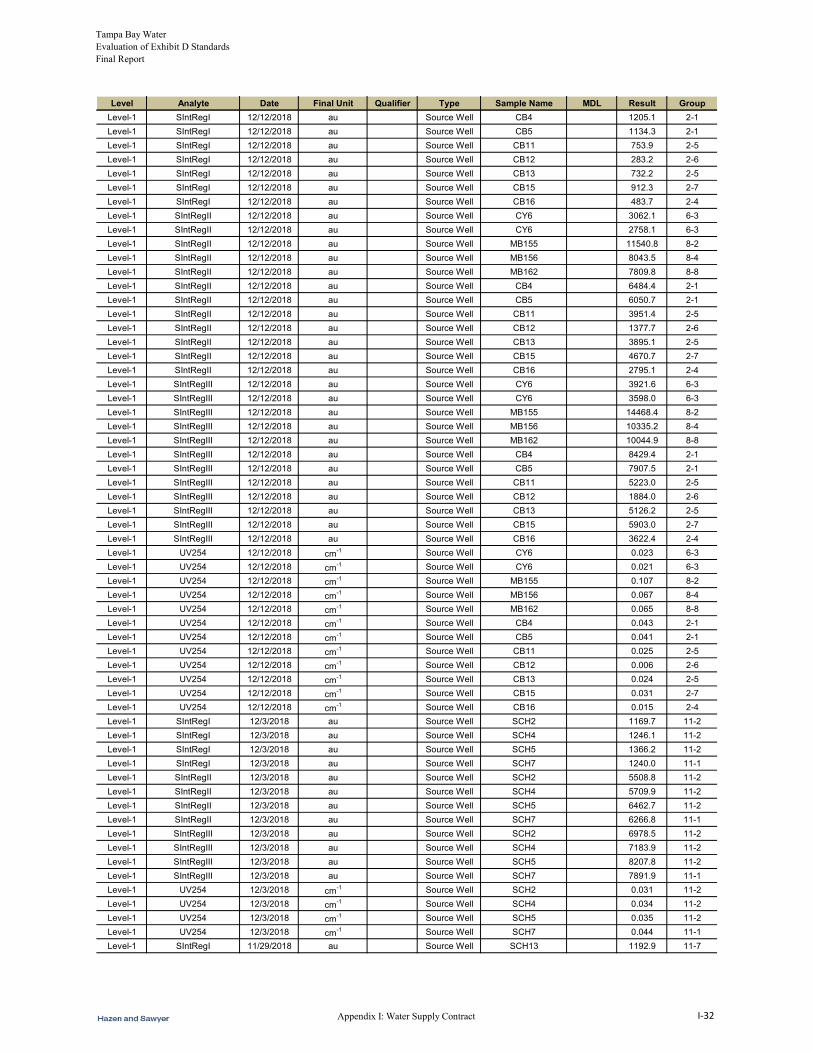
Tampa Bay Water Evaluation of Exhibit D Standards Final Report
Level Analyte Date Final Unit Qualifier Type Sample Name MDL Result Group
Level-1 SIntRegI 12/12/2018 au Source Well CB4 1205.1 2-1
Level-1 SIntRegI 12/12/2018 au Source Well CB5 1134.3 2-1
Level-1 SIntRegI 12/12/2018 au Source Well CB11 753.9 2-5
Level-1 SIntRegI 12/12/2018 au Source Well CB12 283.2 2-6
Level-1 SIntRegI 12/12/2018 au Source Well CB13 732.2 2-5
Level-1 SIntRegI 12/12/2018 au Source Well CB15 912.3 2-7
Level-1 SIntRegI 12/12/2018 au Source Well CB16 483.7 2-4
Level-1 SIntRegII 12/12/2018 au Source Well CY6 3062.1 6-3
Level-1 SIntRegII 12/12/2018 au Source Well CY6 2758.1 6-3
Level-1 SIntRegII 12/12/2018 au Source Well MB155 11540.8 8-2
Level-1 SIntRegII 12/12/2018 au Source Well MB156 8043.5 8-4
Level-1 SIntRegII 12/12/2018 au Source Well MB162 7809.8 8-8
Level-1 SIntRegII 12/12/2018 au Source Well CB4 6484.4 2-1
Level-1 SIntRegII 12/12/2018 au Source Well CB5 6050.7 2-1
Level-1 SIntRegII 12/12/2018 au Source Well CB11 3951.4 2-5
Level-1 SIntRegII 12/12/2018 au Source Well CB12 1377.7 2-6
Level-1 SIntRegII 12/12/2018 au Source Well CB13 3895.1 2-5
Level-1 SIntRegII 12/12/2018 au Source Well CB15 4670.7 2-7
Level-1 SIntRegII 12/12/2018 au Source Well CB16 2795.1 2-4
Level-1 SIntRegIII 12/12/2018 au Source Well CY6 3921.6 6-3
Level-1 SIntRegIII 12/12/2018 au Source Well CY6 3598.0 6-3
Level-1 SIntRegIII 12/12/2018 au Source Well MB155 14468.4 8-2
Level-1 SIntRegIII 12/12/2018 au Source Well MB156 10335.2 8-4
Level-1 SIntRegIII 12/12/2018 au Source Well MB162 10044.9 8-8
Level-1 SIntRegIII 12/12/2018 au Source Well CB4 8429.4 2-1
Level-1 SIntRegIII 12/12/2018 au Source Well CB5 7907.5 2-1
Level-1 SIntRegIII 12/12/2018 au Source Well CB11 5223.0 2-5
Level-1 SIntRegIII 12/12/2018 au Source Well CB12 1884.0 2-6
Level-1 SIntRegIII 12/12/2018 au Source Well CB13 5126.2 2-5
Level-1 SIntRegIII 12/12/2018 au Source Well CB15 5903.0 2-7
Level-1 SIntRegIII 12/12/2018 au Source Well CB16 3622.4 2-4
Level-1 UV254 12/12/2018 cm-1 Source Well CY6 0.023 6-3
Level-1 UV254 12/12/2018 cm-1 Source Well CY6 0.021 6-3
Level-1 UV254 12/12/2018 cm-1 Source Well MB155 0.107 8-2
Level-1 UV254 12/12/2018 cm-1 Source Well MB156 0.067 8-4
Level-1 UV254 12/12/2018 cm-1 Source Well MB162 0.065 8-8
Level-1 UV254 12/12/2018 cm-1 Source Well CB4 0.043 2-1
Level-1 UV254 12/12/2018 cm-1 Source Well CB5 0.041 2-1
Level-1 UV254 12/12/2018 cm-1 Source Well CB11 0.025 2-5
Level-1 UV254 12/12/2018 cm-1 Source Well CB12 0.006 2-6
Level-1 UV254 12/12/2018 cm-1 Source Well CB13 0.024 2-5
Level-1 UV254 12/12/2018 cm-1 Source Well CB15 0.031 2-7
Level-1 UV254 12/12/2018 cm-1 Source Well CB16 0.015 2-4
Level-1 SIntRegI 12/3/2018 au Source Well SCH2 1169.7 11-2
Level-1 SIntRegI 12/3/2018 au Source Well SCH4 1246.1 11-2
Level-1 SIntRegI 12/3/2018 au Source Well SCH5 1366.2 11-2
Level-1 SIntRegI 12/3/2018 au Source Well SCH7 1240.0 11-1
Level-1 SIntRegII 12/3/2018 au Source Well SCH2 5508.8 11-2
Level-1 SIntRegII 12/3/2018 au Source Well SCH4 5709.9 11-2
Level-1 SIntRegII 12/3/2018 au Source Well SCH5 6462.7 11-2
Level-1 SIntRegII 12/3/2018 au Source Well SCH7 6266.8 11-1
Level-1 SIntRegIII 12/3/2018 au Source Well SCH2 6978.5 11-2
Level-1 SIntRegIII 12/3/2018 au Source Well SCH4 7183.9 11-2
Level-1 SIntRegIII 12/3/2018 au Source Well SCH5 8207.8 11-2
Level-1 SIntRegIII 12/3/2018 au Source Well SCH7 7891.9 11-1
Level-1 UV254 12/3/2018 cm-1 Source Well SCH2 0.031 11-2
Level-1 UV254 12/3/2018 cm-1 Source Well SCH4 0.034 11-2
Level-1 UV254 12/3/2018 cm-1 Source Well SCH5 0.035 11-2
Level-1 UV254 12/3/2018 cm-1 Source Well SCH7 0.044 11-1
Level-1 SIntRegI 11/29/2018 au Source Well SCH13 1192.9 11-7
Appendix I: Water Supply Contract I-32
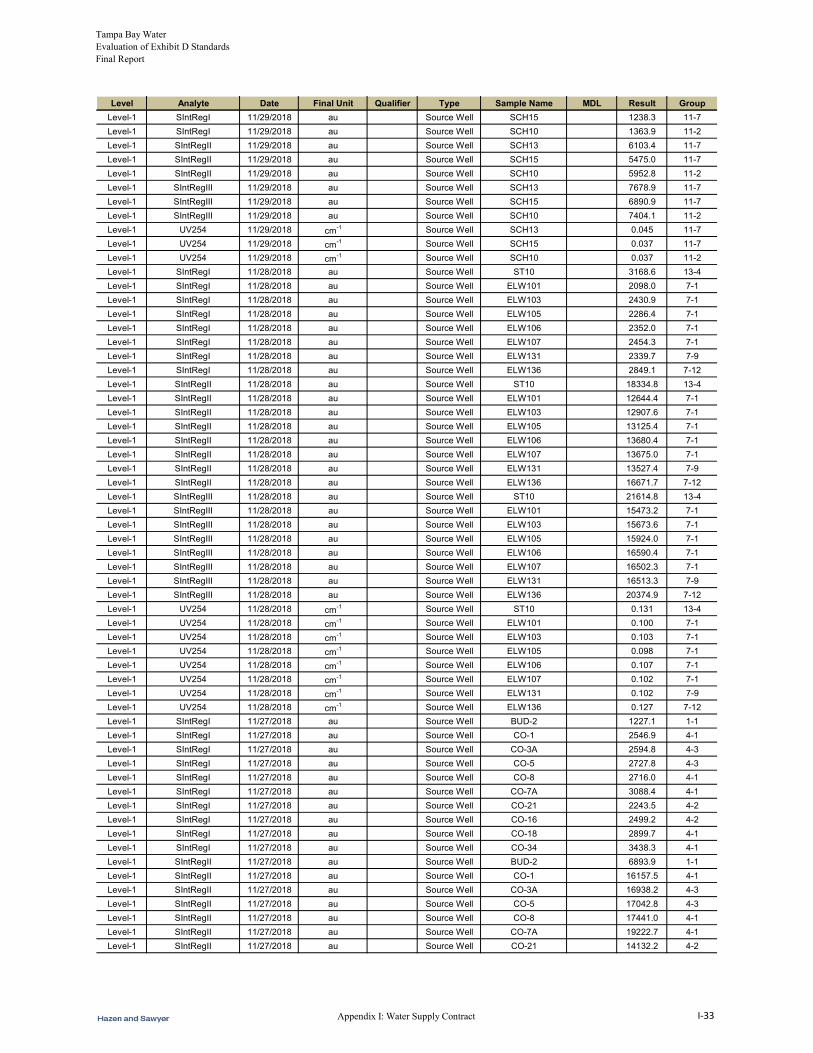
Tampa Bay Water Evaluation of Exhibit D Standards Final Report
Level Analyte Date Final Unit Qualifier Type Sample Name MDL Result Group
Level-1 SIntRegI 11/29/2018 au Source Well SCH15 1238.3 11-7
Level-1 SIntRegI 11/29/2018 au Source Well SCH10 1363.9 11-2
Level-1 SIntRegII 11/29/2018 au Source Well SCH13 6103.4 11-7
Level-1 SIntRegII 11/29/2018 au Source Well SCH15 5475.0 11-7
Level-1 SIntRegII 11/29/2018 au Source Well SCH10 5952.8 11-2
Level-1 SIntRegIII 11/29/2018 au Source Well SCH13 7678.9 11-7
Level-1 SIntRegIII 11/29/2018 au Source Well SCH15 6890.9 11-7
Level-1 SIntRegIII 11/29/2018 au Source Well SCH10 7404.1 11-2
Level-1 UV254 11/29/2018 cm-1 Source Well SCH13 0.045 11-7
Level-1 UV254 11/29/2018 cm-1 Source Well SCH15 0.037 11-7
Level-1 UV254 11/29/2018 cm-1 Source Well SCH10 0.037 11-2
Level-1 SIntRegI 11/28/2018 au Source Well ST10 3168.6 13-4
Level-1 SIntRegI 11/28/2018 au Source Well ELW101 2098.0 7-1
Level-1 SIntRegI 11/28/2018 au Source Well ELW103 2430.9 7-1
Level-1 SIntRegI 11/28/2018 au Source Well ELW105 2286.4 7-1
Level-1 SIntRegI 11/28/2018 au Source Well ELW106 2352.0 7-1
Level-1 SIntRegI 11/28/2018 au Source Well ELW107 2454.3 7-1
Level-1 SIntRegI 11/28/2018 au Source Well ELW131 2339.7 7-9
Level-1 SIntRegI 11/28/2018 au Source Well ELW136 2849.1 7-12
Level-1 SIntRegII 11/28/2018 au Source Well ST10 18334.8 13-4
Level-1 SIntRegII 11/28/2018 au Source Well ELW101 12644.4 7-1
Level-1 SIntRegII 11/28/2018 au Source Well ELW103 12907.6 7-1
Level-1 SIntRegII 11/28/2018 au Source Well ELW105 13125.4 7-1
Level-1 SIntRegII 11/28/2018 au Source Well ELW106 13680.4 7-1
Level-1 SIntRegII 11/28/2018 au Source Well ELW107 13675.0 7-1
Level-1 SIntRegII 11/28/2018 au Source Well ELW131 13527.4 7-9
Level-1 SIntRegII 11/28/2018 au Source Well ELW136 16671.7 7-12
Level-1 SIntRegIII 11/28/2018 au Source Well ST10 21614.8 13-4
Level-1 SIntRegIII 11/28/2018 au Source Well ELW101 15473.2 7-1
Level-1 SIntRegIII 11/28/2018 au Source Well ELW103 15673.6 7-1
Level-1 SIntRegIII 11/28/2018 au Source Well ELW105 15924.0 7-1
Level-1 SIntRegIII 11/28/2018 au Source Well ELW106 16590.4 7-1
Level-1 SIntRegIII 11/28/2018 au Source Well ELW107 16502.3 7-1
Level-1 SIntRegIII 11/28/2018 au Source Well ELW131 16513.3 7-9
Level-1 SIntRegIII 11/28/2018 au Source Well ELW136 20374.9 7-12
Level-1 UV254 11/28/2018 cm-1 Source Well ST10 0.131 13-4
Level-1 UV254 11/28/2018 cm-1 Source Well ELW101 0.100 7-1
Level-1 UV254 11/28/2018 cm-1 Source Well ELW103 0.103 7-1
Level-1 UV254 11/28/2018 cm-1 Source Well ELW105 0.098 7-1
Level-1 UV254 11/28/2018 cm-1 Source Well ELW106 0.107 7-1
Level-1 UV254 11/28/2018 cm-1 Source Well ELW107 0.102 7-1
Level-1 UV254 11/28/2018 cm-1 Source Well ELW131 0.102 7-9
Level-1 UV254 11/28/2018 cm-1 Source Well ELW136 0.127 7-12
Level-1 SIntRegI 11/27/2018 au Source Well BUD-2 1227.1 1-1
Level-1 SIntRegI 11/27/2018 au Source Well CO-1 2546.9 4-1
Level-1 SIntRegI 11/27/2018 au Source Well CO-3A 2594.8 4-3
Level-1 SIntRegI 11/27/2018 au Source Well CO-5 2727.8 4-3
Level-1 SIntRegI 11/27/2018 au Source Well CO-8 2716.0 4-1
Level-1 SIntRegI 11/27/2018 au Source Well CO-7A 3088.4 4-1
Level-1 SIntRegI 11/27/2018 au Source Well CO-21 2243.5 4-2
Level-1 SIntRegI 11/27/2018 au Source Well CO-16 2499.2 4-2
Level-1 SIntRegI 11/27/2018 au Source Well CO-18 2899.7 4-1
Level-1 SIntRegI 11/27/2018 au Source Well CO-34 3438.3 4-1
Level-1 SIntRegII 11/27/2018 au Source Well BUD-2 6893.9 1-1
Level-1 SIntRegII 11/27/2018 au Source Well CO-1 16157.5 4-1
Level-1 SIntRegII 11/27/2018 au Source Well CO-3A 16938.2 4-3
Level-1 SIntRegII 11/27/2018 au Source Well CO-5 17042.8 4-3
Level-1 SIntRegII 11/27/2018 au Source Well CO-8 17441.0 4-1
Level-1 SIntRegII 11/27/2018 au Source Well CO-7A 19222.7 4-1
Level-1 SIntRegII 11/27/2018 au Source Well CO-21 14132.2 4-2
Appendix I: Water Supply Contract I-33
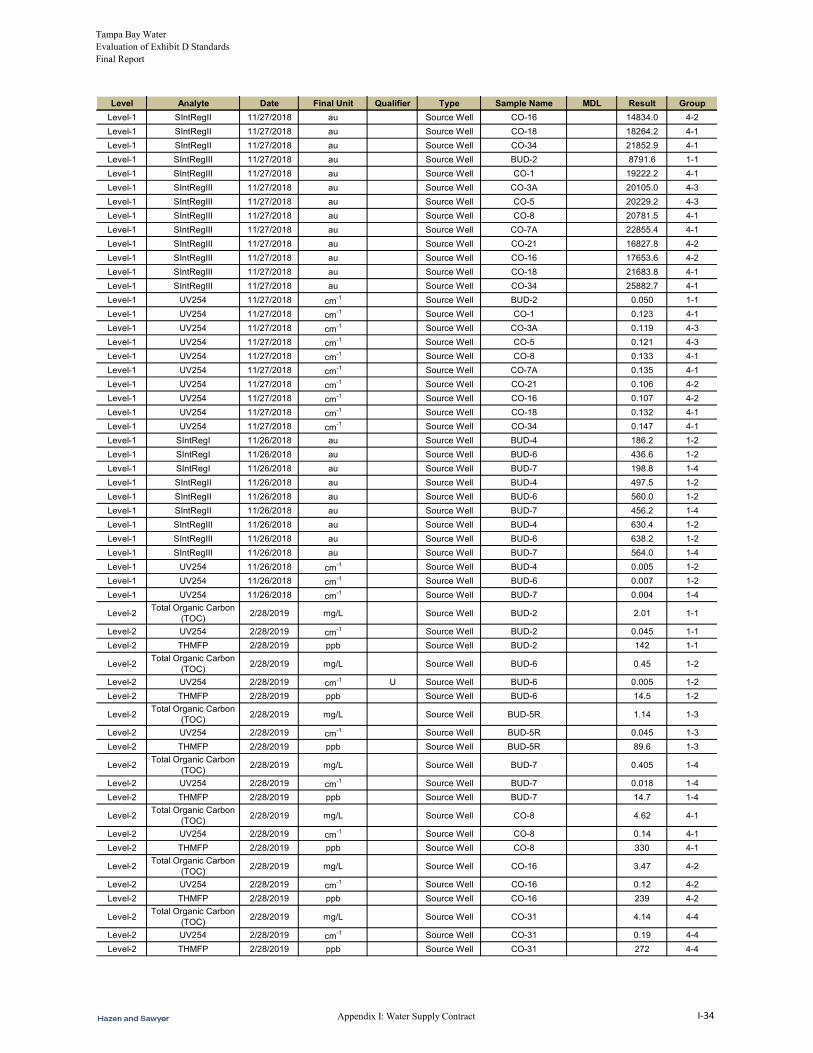
Tampa Bay Water Evaluation of Exhibit D Standards Final Report
Level Analyte Date Final Unit Qualifier Type Sample Name MDL Result Group
Level-1 SIntRegII 11/27/2018 au Source Well CO-16 14834.0 4-2
Level-1 SIntRegII 11/27/2018 au Source Well CO-18 18264.2 4-1
Level-1 SIntRegII 11/27/2018 au Source Well CO-34 21852.9 4-1
Level-1 SIntRegIII 11/27/2018 au Source Well BUD-2 8791.6 1-1
Level-1 SIntRegIII 11/27/2018 au Source Well CO-1 19222.2 4-1
Level-1 SIntRegIII 11/27/2018 au Source Well CO-3A 20105.0 4-3
Level-1 SIntRegIII 11/27/2018 au Source Well CO-5 20229.2 4-3
Level-1 SIntRegIII 11/27/2018 au Source Well CO-8 20781.5 4-1
Level-1 SIntRegIII 11/27/2018 au Source Well CO-7A 22855.4 4-1
Level-1 SIntRegIII 11/27/2018 au Source Well CO-21 16827.8 4-2
Level-1 SIntRegIII 11/27/2018 au Source Well CO-16 17653.6 4-2
Level-1 SIntRegIII 11/27/2018 au Source Well CO-18 21683.8 4-1
Level-1 SIntRegIII 11/27/2018 au Source Well CO-34 25882.7 4-1
Level-1 UV254 11/27/2018 cm-1 Source Well BUD-2 0.050 1-1
Level-1 UV254 11/27/2018 cm-1 Source Well CO-1 0.123 4-1
Level-1 UV254 11/27/2018 cm-1 Source Well CO-3A 0.119 4-3
Level-1 UV254 11/27/2018 cm-1 Source Well CO-5 0.121 4-3
Level-1 UV254 11/27/2018 cm-1 Source Well CO-8 0.133 4-1
Level-1 UV254 11/27/2018 cm-1 Source Well CO-7A 0.135 4-1
Level-1 UV254 11/27/2018 cm-1 Source Well CO-21 0.106 4-2
Level-1 UV254 11/27/2018 cm-1 Source Well CO-16 0.107 4-2
Level-1 UV254 11/27/2018 cm-1 Source Well CO-18 0.132 4-1
Level-1 UV254 11/27/2018 cm-1 Source Well CO-34 0.147 4-1
Level-1 SIntRegI 11/26/2018 au Source Well BUD-4 186.2 1-2
Level-1 SIntRegI 11/26/2018 au Source Well BUD-6 436.6 1-2
Level-1 SIntRegI 11/26/2018 au Source Well BUD-7 198.8 1-4
Level-1 SIntRegII 11/26/2018 au Source Well BUD-4 497.5 1-2
Level-1 SIntRegII 11/26/2018 au Source Well BUD-6 560.0 1-2
Level-1 SIntRegII 11/26/2018 au Source Well BUD-7 456.2 1-4
Level-1 SIntRegIII 11/26/2018 au Source Well BUD-4 630.4 1-2
Level-1 SIntRegIII 11/26/2018 au Source Well BUD-6 638.2 1-2
Level-1 SIntRegIII 11/26/2018 au Source Well BUD-7 564.0 1-4
Level-1 UV254 11/26/2018 cm-1 Source Well BUD-4 0.005 1-2
Level-1 UV254 11/26/2018 cm-1 Source Well BUD-6 0.007 1-2
Level-1 UV254 11/26/2018 cm-1 Source Well BUD-7 0.004 1-4
Level-2Total Organic Carbon
(TOC)2/28/2019 mg/L Source Well BUD-2 2.01 1-1
Level-2 UV254 2/28/2019 cm-1 Source Well BUD-2 0.045 1-1
Level-2 THMFP 2/28/2019 ppb Source Well BUD-2 142 1-1
Level-2Total Organic Carbon
(TOC)2/28/2019 mg/L Source Well BUD-6 0.45 1-2
Level-2 UV254 2/28/2019 cm-1 U Source Well BUD-6 0.005 1-2
Level-2 THMFP 2/28/2019 ppb Source Well BUD-6 14.5 1-2
Level-2Total Organic Carbon
(TOC)2/28/2019 mg/L Source Well BUD-5R 1.14 1-3
Level-2 UV254 2/28/2019 cm-1 Source Well BUD-5R 0.045 1-3
Level-2 THMFP 2/28/2019 ppb Source Well BUD-5R 89.6 1-3
Level-2Total Organic Carbon
(TOC)2/28/2019 mg/L Source Well BUD-7 0.405 1-4
Level-2 UV254 2/28/2019 cm-1 Source Well BUD-7 0.018 1-4
Level-2 THMFP 2/28/2019 ppb Source Well BUD-7 14.7 1-4
Level-2Total Organic Carbon
(TOC)2/28/2019 mg/L Source Well CO-8 4.62 4-1
Level-2 UV254 2/28/2019 cm-1 Source Well CO-8 0.14 4-1
Level-2 THMFP 2/28/2019 ppb Source Well CO-8 330 4-1
Level-2Total Organic Carbon
(TOC)2/28/2019 mg/L Source Well CO-16 3.47 4-2
Level-2 UV254 2/28/2019 cm-1 Source Well CO-16 0.12 4-2
Level-2 THMFP 2/28/2019 ppb Source Well CO-16 239 4-2
Level-2Total Organic Carbon
(TOC)2/28/2019 mg/L Source Well CO-31 4.14 4-4
Level-2 UV254 2/28/2019 cm-1 Source Well CO-31 0.19 4-4
Level-2 THMFP 2/28/2019 ppb Source Well CO-31 272 4-4
Appendix I: Water Supply Contract I-34
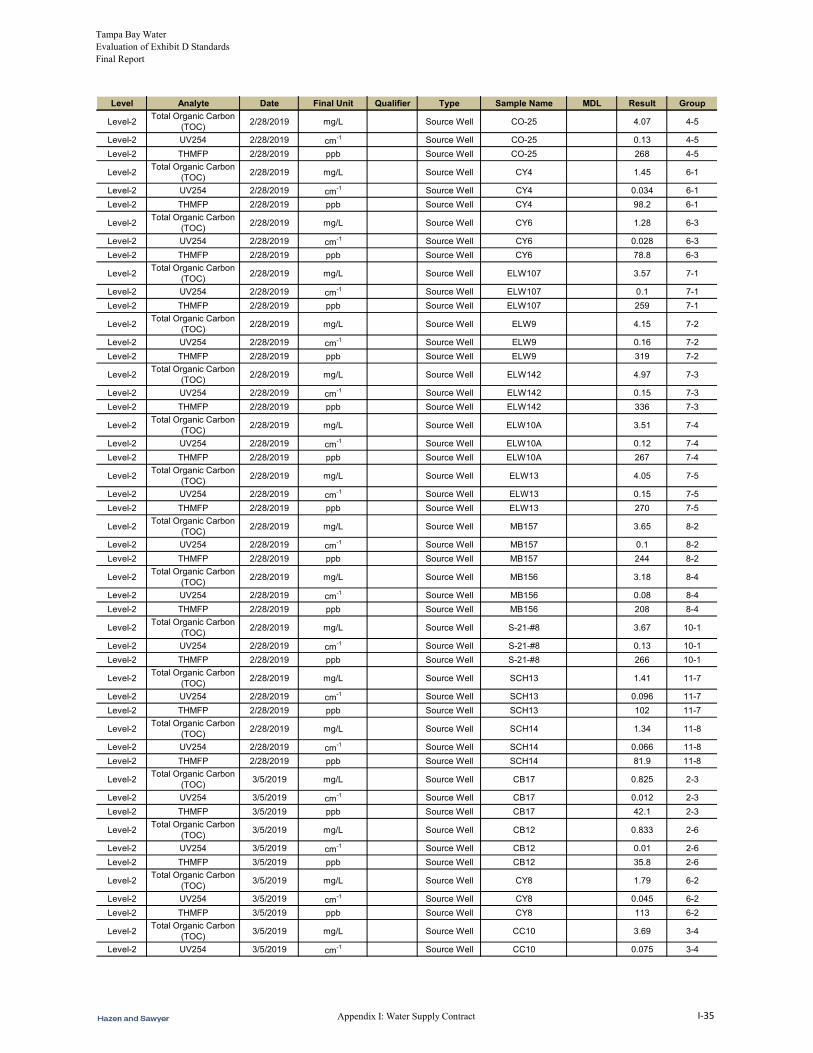
Tampa Bay Water Evaluation of Exhibit D Standards Final Report
Level Analyte Date Final Unit Qualifier Type Sample Name MDL Result Group
Level-2Total Organic Carbon
(TOC)2/28/2019 mg/L Source Well CO-25 4.07 4-5
Level-2 UV254 2/28/2019 cm-1 Source Well CO-25 0.13 4-5
Level-2 THMFP 2/28/2019 ppb Source Well CO-25 268 4-5
Level-2Total Organic Carbon
(TOC)2/28/2019 mg/L Source Well CY4 1.45 6-1
Level-2 UV254 2/28/2019 cm-1 Source Well CY4 0.034 6-1
Level-2 THMFP 2/28/2019 ppb Source Well CY4 98.2 6-1
Level-2Total Organic Carbon
(TOC)2/28/2019 mg/L Source Well CY6 1.28 6-3
Level-2 UV254 2/28/2019 cm-1 Source Well CY6 0.028 6-3
Level-2 THMFP 2/28/2019 ppb Source Well CY6 78.8 6-3
Level-2Total Organic Carbon
(TOC)2/28/2019 mg/L Source Well ELW107 3.57 7-1
Level-2 UV254 2/28/2019 cm-1 Source Well ELW107 0.1 7-1
Level-2 THMFP 2/28/2019 ppb Source Well ELW107 259 7-1
Level-2Total Organic Carbon
(TOC)2/28/2019 mg/L Source Well ELW9 4.15 7-2
Level-2 UV254 2/28/2019 cm-1 Source Well ELW9 0.16 7-2
Level-2 THMFP 2/28/2019 ppb Source Well ELW9 319 7-2
Level-2Total Organic Carbon
(TOC)2/28/2019 mg/L Source Well ELW142 4.97 7-3
Level-2 UV254 2/28/2019 cm-1 Source Well ELW142 0.15 7-3
Level-2 THMFP 2/28/2019 ppb Source Well ELW142 336 7-3
Level-2Total Organic Carbon
(TOC)2/28/2019 mg/L Source Well ELW10A 3.51 7-4
Level-2 UV254 2/28/2019 cm-1 Source Well ELW10A 0.12 7-4
Level-2 THMFP 2/28/2019 ppb Source Well ELW10A 267 7-4
Level-2Total Organic Carbon
(TOC)2/28/2019 mg/L Source Well ELW13 4.05 7-5
Level-2 UV254 2/28/2019 cm-1 Source Well ELW13 0.15 7-5
Level-2 THMFP 2/28/2019 ppb Source Well ELW13 270 7-5
Level-2Total Organic Carbon
(TOC)2/28/2019 mg/L Source Well MB157 3.65 8-2
Level-2 UV254 2/28/2019 cm-1 Source Well MB157 0.1 8-2
Level-2 THMFP 2/28/2019 ppb Source Well MB157 244 8-2
Level-2Total Organic Carbon
(TOC)2/28/2019 mg/L Source Well MB156 3.18 8-4
Level-2 UV254 2/28/2019 cm-1 Source Well MB156 0.08 8-4
Level-2 THMFP 2/28/2019 ppb Source Well MB156 208 8-4
Level-2Total Organic Carbon
(TOC)2/28/2019 mg/L Source Well S-21-#8 3.67 10-1
Level-2 UV254 2/28/2019 cm-1 Source Well S-21-#8 0.13 10-1
Level-2 THMFP 2/28/2019 ppb Source Well S-21-#8 266 10-1
Level-2Total Organic Carbon
(TOC)2/28/2019 mg/L Source Well SCH13 1.41 11-7
Level-2 UV254 2/28/2019 cm-1 Source Well SCH13 0.096 11-7
Level-2 THMFP 2/28/2019 ppb Source Well SCH13 102 11-7
Level-2Total Organic Carbon
(TOC)2/28/2019 mg/L Source Well SCH14 1.34 11-8
Level-2 UV254 2/28/2019 cm-1 Source Well SCH14 0.066 11-8
Level-2 THMFP 2/28/2019 ppb Source Well SCH14 81.9 11-8
Level-2Total Organic Carbon
(TOC)3/5/2019 mg/L Source Well CB17 0.825 2-3
Level-2 UV254 3/5/2019 cm-1 Source Well CB17 0.012 2-3
Level-2 THMFP 3/5/2019 ppb Source Well CB17 42.1 2-3
Level-2Total Organic Carbon
(TOC)3/5/2019 mg/L Source Well CB12 0.833 2-6
Level-2 UV254 3/5/2019 cm-1 Source Well CB12 0.01 2-6
Level-2 THMFP 3/5/2019 ppb Source Well CB12 35.8 2-6
Level-2Total Organic Carbon
(TOC)3/5/2019 mg/L Source Well CY8 1.79 6-2
Level-2 UV254 3/5/2019 cm-1 Source Well CY8 0.045 6-2
Level-2 THMFP 3/5/2019 ppb Source Well CY8 113 6-2
Level-2Total Organic Carbon
(TOC)3/5/2019 mg/L Source Well CC10 3.69 3-4
Level-2 UV254 3/5/2019 cm-1 Source Well CC10 0.075 3-4
Appendix I: Water Supply Contract I-35
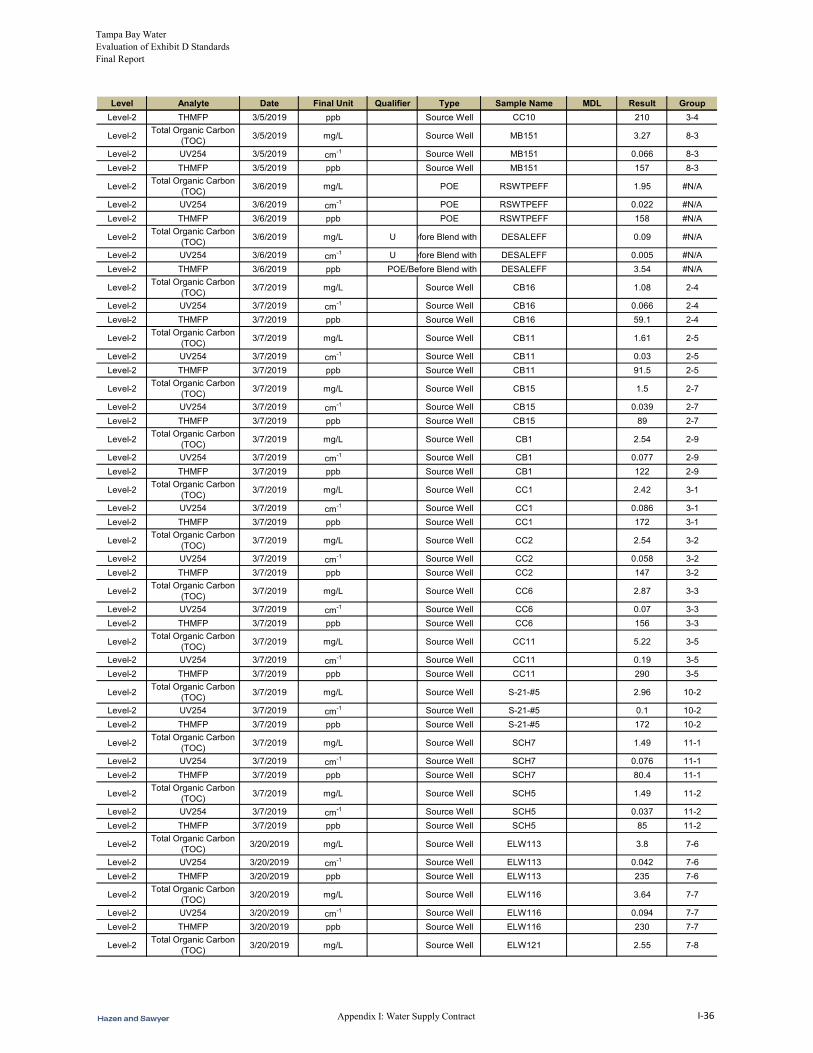
Tampa Bay Water Evaluation of Exhibit D Standards Final Report
Level Analyte Date Final Unit Qualifier Type Sample Name MDL Result Group
Level-2 THMFP 3/5/2019 ppb Source Well CC10 210 3-4
Level-2Total Organic Carbon
(TOC)3/5/2019 mg/L Source Well MB151 3.27 8-3
Level-2 UV254 3/5/2019 cm-1 Source Well MB151 0.066 8-3
Level-2 THMFP 3/5/2019 ppb Source Well MB151 157 8-3
Level-2Total Organic Carbon
(TOC)3/6/2019 mg/L POE RSWTPEFF 1.95 #N/A
Level-2 UV254 3/6/2019 cm-1 POE RSWTPEFF 0.022 #N/A
Level-2 THMFP 3/6/2019 ppb POE RSWTPEFF 158 #N/A
Level-2Total Organic Carbon
(TOC)3/6/2019 mg/L UPOE/Before Blend with RSWTPDESALEFF 0.09 #N/A
Level-2 UV254 3/6/2019 cm-1 UPOE/Before Blend with RSWTPDESALEFF 0.005 #N/A
Level-2 THMFP 3/6/2019 ppb POE/Before Blend with RSWTPDESALEFF 3.54 #N/A
Level-2Total Organic Carbon
(TOC)3/7/2019 mg/L Source Well CB16 1.08 2-4
Level-2 UV254 3/7/2019 cm-1 Source Well CB16 0.066 2-4
Level-2 THMFP 3/7/2019 ppb Source Well CB16 59.1 2-4
Level-2Total Organic Carbon
(TOC)3/7/2019 mg/L Source Well CB11 1.61 2-5
Level-2 UV254 3/7/2019 cm-1 Source Well CB11 0.03 2-5
Level-2 THMFP 3/7/2019 ppb Source Well CB11 91.5 2-5
Level-2Total Organic Carbon
(TOC)3/7/2019 mg/L Source Well CB15 1.5 2-7
Level-2 UV254 3/7/2019 cm-1 Source Well CB15 0.039 2-7
Level-2 THMFP 3/7/2019 ppb Source Well CB15 89 2-7
Level-2Total Organic Carbon
(TOC)3/7/2019 mg/L Source Well CB1 2.54 2-9
Level-2 UV254 3/7/2019 cm-1 Source Well CB1 0.077 2-9
Level-2 THMFP 3/7/2019 ppb Source Well CB1 122 2-9
Level-2Total Organic Carbon
(TOC)3/7/2019 mg/L Source Well CC1 2.42 3-1
Level-2 UV254 3/7/2019 cm-1 Source Well CC1 0.086 3-1
Level-2 THMFP 3/7/2019 ppb Source Well CC1 172 3-1
Level-2Total Organic Carbon
(TOC)3/7/2019 mg/L Source Well CC2 2.54 3-2
Level-2 UV254 3/7/2019 cm-1 Source Well CC2 0.058 3-2
Level-2 THMFP 3/7/2019 ppb Source Well CC2 147 3-2
Level-2Total Organic Carbon
(TOC)3/7/2019 mg/L Source Well CC6 2.87 3-3
Level-2 UV254 3/7/2019 cm-1 Source Well CC6 0.07 3-3
Level-2 THMFP 3/7/2019 ppb Source Well CC6 156 3-3
Level-2Total Organic Carbon
(TOC)3/7/2019 mg/L Source Well CC11 5.22 3-5
Level-2 UV254 3/7/2019 cm-1 Source Well CC11 0.19 3-5
Level-2 THMFP 3/7/2019 ppb Source Well CC11 290 3-5
Level-2Total Organic Carbon
(TOC)3/7/2019 mg/L Source Well S-21-#5 2.96 10-2
Level-2 UV254 3/7/2019 cm-1 Source Well S-21-#5 0.1 10-2
Level-2 THMFP 3/7/2019 ppb Source Well S-21-#5 172 10-2
Level-2Total Organic Carbon
(TOC)3/7/2019 mg/L Source Well SCH7 1.49 11-1
Level-2 UV254 3/7/2019 cm-1 Source Well SCH7 0.076 11-1
Level-2 THMFP 3/7/2019 ppb Source Well SCH7 80.4 11-1
Level-2Total Organic Carbon
(TOC)3/7/2019 mg/L Source Well SCH5 1.49 11-2
Level-2 UV254 3/7/2019 cm-1 Source Well SCH5 0.037 11-2
Level-2 THMFP 3/7/2019 ppb Source Well SCH5 85 11-2
Level-2Total Organic Carbon
(TOC)3/20/2019 mg/L Source Well ELW113 3.8 7-6
Level-2 UV254 3/20/2019 cm-1 Source Well ELW113 0.042 7-6
Level-2 THMFP 3/20/2019 ppb Source Well ELW113 235 7-6
Level-2Total Organic Carbon
(TOC)3/20/2019 mg/L Source Well ELW116 3.64 7-7
Level-2 UV254 3/20/2019 cm-1 Source Well ELW116 0.094 7-7
Level-2 THMFP 3/20/2019 ppb Source Well ELW116 230 7-7
Level-2Total Organic Carbon
(TOC)3/20/2019 mg/L Source Well ELW121 2.55 7-8
Appendix I: Water Supply Contract I-36
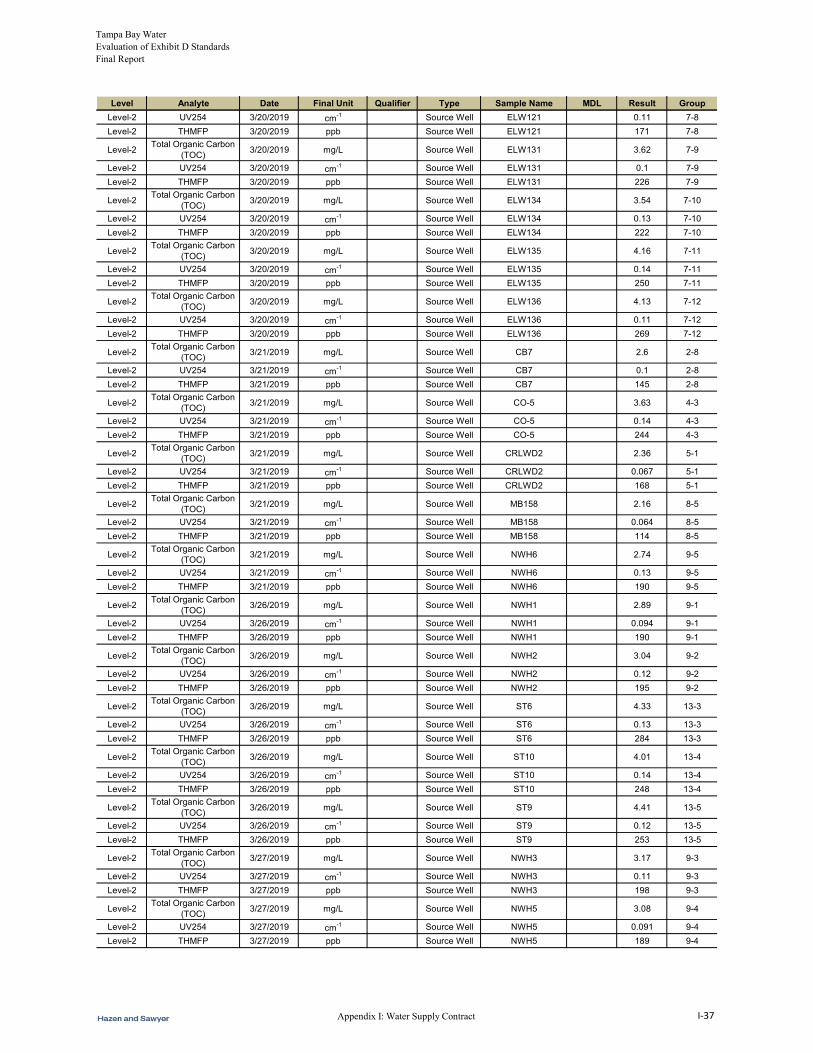
Tampa Bay Water Evaluation of Exhibit D Standards Final Report
Level Analyte Date Final Unit Qualifier Type Sample Name MDL Result Group
Level-2 UV254 3/20/2019 cm-1 Source Well ELW121 0.11 7-8
Level-2 THMFP 3/20/2019 ppb Source Well ELW121 171 7-8
Level-2Total Organic Carbon
(TOC)3/20/2019 mg/L Source Well ELW131 3.62 7-9
Level-2 UV254 3/20/2019 cm-1 Source Well ELW131 0.1 7-9
Level-2 THMFP 3/20/2019 ppb Source Well ELW131 226 7-9
Level-2Total Organic Carbon
(TOC)3/20/2019 mg/L Source Well ELW134 3.54 7-10
Level-2 UV254 3/20/2019 cm-1 Source Well ELW134 0.13 7-10
Level-2 THMFP 3/20/2019 ppb Source Well ELW134 222 7-10
Level-2Total Organic Carbon
(TOC)3/20/2019 mg/L Source Well ELW135 4.16 7-11
Level-2 UV254 3/20/2019 cm-1 Source Well ELW135 0.14 7-11
Level-2 THMFP 3/20/2019 ppb Source Well ELW135 250 7-11
Level-2Total Organic Carbon
(TOC)3/20/2019 mg/L Source Well ELW136 4.13 7-12
Level-2 UV254 3/20/2019 cm-1 Source Well ELW136 0.11 7-12
Level-2 THMFP 3/20/2019 ppb Source Well ELW136 269 7-12
Level-2Total Organic Carbon
(TOC)3/21/2019 mg/L Source Well CB7 2.6 2-8
Level-2 UV254 3/21/2019 cm-1 Source Well CB7 0.1 2-8
Level-2 THMFP 3/21/2019 ppb Source Well CB7 145 2-8
Level-2Total Organic Carbon
(TOC)3/21/2019 mg/L Source Well CO-5 3.63 4-3
Level-2 UV254 3/21/2019 cm-1 Source Well CO-5 0.14 4-3
Level-2 THMFP 3/21/2019 ppb Source Well CO-5 244 4-3
Level-2Total Organic Carbon
(TOC)3/21/2019 mg/L Source Well CRLWD2 2.36 5-1
Level-2 UV254 3/21/2019 cm-1 Source Well CRLWD2 0.067 5-1
Level-2 THMFP 3/21/2019 ppb Source Well CRLWD2 168 5-1
Level-2Total Organic Carbon
(TOC)3/21/2019 mg/L Source Well MB158 2.16 8-5
Level-2 UV254 3/21/2019 cm-1 Source Well MB158 0.064 8-5
Level-2 THMFP 3/21/2019 ppb Source Well MB158 114 8-5
Level-2Total Organic Carbon
(TOC)3/21/2019 mg/L Source Well NWH6 2.74 9-5
Level-2 UV254 3/21/2019 cm-1 Source Well NWH6 0.13 9-5
Level-2 THMFP 3/21/2019 ppb Source Well NWH6 190 9-5
Level-2Total Organic Carbon
(TOC)3/26/2019 mg/L Source Well NWH1 2.89 9-1
Level-2 UV254 3/26/2019 cm-1 Source Well NWH1 0.094 9-1
Level-2 THMFP 3/26/2019 ppb Source Well NWH1 190 9-1
Level-2Total Organic Carbon
(TOC)3/26/2019 mg/L Source Well NWH2 3.04 9-2
Level-2 UV254 3/26/2019 cm-1 Source Well NWH2 0.12 9-2
Level-2 THMFP 3/26/2019 ppb Source Well NWH2 195 9-2
Level-2Total Organic Carbon
(TOC)3/26/2019 mg/L Source Well ST6 4.33 13-3
Level-2 UV254 3/26/2019 cm-1 Source Well ST6 0.13 13-3
Level-2 THMFP 3/26/2019 ppb Source Well ST6 284 13-3
Level-2Total Organic Carbon
(TOC)3/26/2019 mg/L Source Well ST10 4.01 13-4
Level-2 UV254 3/26/2019 cm-1 Source Well ST10 0.14 13-4
Level-2 THMFP 3/26/2019 ppb Source Well ST10 248 13-4
Level-2Total Organic Carbon
(TOC)3/26/2019 mg/L Source Well ST9 4.41 13-5
Level-2 UV254 3/26/2019 cm-1 Source Well ST9 0.12 13-5
Level-2 THMFP 3/26/2019 ppb Source Well ST9 253 13-5
Level-2Total Organic Carbon
(TOC)3/27/2019 mg/L Source Well NWH3 3.17 9-3
Level-2 UV254 3/27/2019 cm-1 Source Well NWH3 0.11 9-3
Level-2 THMFP 3/27/2019 ppb Source Well NWH3 198 9-3
Level-2Total Organic Carbon
(TOC)3/27/2019 mg/L Source Well NWH5 3.08 9-4
Level-2 UV254 3/27/2019 cm-1 Source Well NWH5 0.091 9-4
Level-2 THMFP 3/27/2019 ppb Source Well NWH5 189 9-4
Appendix I: Water Supply Contract I-37

Tampa Bay Water Evaluation of Exhibit D Standards Final Report
Level Analyte Date Final Unit Qualifier Type Sample Name MDL Result Group
Level-2Total Organic Carbon
(TOC)3/27/2019 mg/L Source Well SP-50 4.82 12-1
Level-2 UV254 3/27/2019 cm-1 Source Well SP-50 0.12 12-1
Level-2 THMFP 3/27/2019 ppb Source Well SP-50 317 12-1
Level-2Total Organic Carbon
(TOC)3/27/2019 mg/L Source Well SP-49 3.9 12-3
Level-2 UV254 3/27/2019 cm-1 Source Well SP-49 0.11 12-3
Level-2 THMFP 3/27/2019 ppb Source Well SP-49 264 12-3
Level-2Total Organic Carbon
(TOC)7/26/2019 mg/L Source Well CB5 2.14 2-1
Level-2 UV254 7/26/2019 cm-1 Source Well CB5 0.41 2-1
Appendix I: Water Supply Contract I-38