Embed Size (px)
Citation preview

Evaluation of ETM+ Gap-filled SLC-Off Data for Geologic Mapping in Semi-Arid Terrain
Prepared by G. Bryan Bailey, USGS, July 2004 USGS EROS Data Center, Sioux Falls, SD
Introduction The value of Landsat TM and ETM+ data as tools for geologic mapping in semi-arid terrain has been demonstrated over the years by many investigators. The spatial and spectral characteristics of ETM+ data provide the geologist with lithologic and structural geologic information important in the construction of geologic maps and in the exploration for non-renewable natural resources. Digital image processing plays an important role in extracting geologically important information from the data. Band ratioing, principal components analysis, and decorrelation stretching are the techniques perhaps most commonly applied in the analysis and interpretation of Landsat TM and ETM+ data for geologic studies in semi-arid terrain, and they typically produce enhanced image products that provide important and useful information. Consequently, it is important to understand what effect the gap-filled SLC-Off ETM+ products will have on geologists’ ability to extract the important and useful geologic information available to them in the past from normal SLC-On ETM+ data. It is worth noting that geologic studies in semi-arid terrain perhaps will be impacted by the ETM+ SLC anomaly less than almost all other types of scientific or practical investigation. This is true because most geologic studies do not require current data, and nearly all of the Earth’s surface is covered by good quality ETM+ data with minimal cloud cover. Methodology Previous studies using TM and pre-anomaly ETM+ data by the author and his colleagues in the Drum Mountains of west central Utah have provided a good basis of comparison for the effects on geologic mapping in semi-arid terrain of the SLC anomaly. A number of enhanced image products were produced from the gap-filled ETM+ data set provided, which was synthesized from the same August 14, 1999 ETM+ scene used in the most recent previous studies of the Drum Mts. study area. The enhanced image products produced and evaluated were: contrast enhanced false-color composite (FCC); a color composite band ratio image with 3/1(R), 5/7(G), and 7/3(B); a color composite principle components image produced from the six 30 m ETM+ bands and presenting PC’s 4(R), 1(G), and 3(B); and a decorrelation stretch image produced from ETM+ bands 3, 5, and 7. Image comparisons also were generated for the ETM+ pan and TIR bands. The various image products generated were compared against identically processed images that used normal (SLC-on) August 14, 1999 ETM+ data as inputs. They were evaluated for their “interpretability” with respect to lithologic and structural information, and they were examined for noticeable artifacts related to the gap-filling process. Finally, scene statistics were run on the six 30 m bands for image subsets covering the study area. This was done for both SLC-On and gap-filled SLC-Off data, and results were compared.

Results In general, and most frequently, the like-generated images using SLC-On and gap-filled SLC-Off data appeared very similar to nearly identical to each other. Linear artifacts related to the scan line anomaly and gap-filling process are apparent, and were identified, in many of the gap-filled SLC-Off images produced. However, at least in the case of the enhanced color images produced from 30 m data, these artifacts do not significantly detract from the ability to extract important and meaningful geologic information from them. The most distinct artifacts observed in the study occurred in the gap-filled SLC-Off thermal infrared band, where rather sharp and continuous linear features exist. Somewhat broader and slightly less distinct linear features were observed in the gap-filled SLC-Off pan band. These pan band artifacts do not significantly detract from the image’s usefulness in providing a more detailed overview of the field site nor in its contribution to a structural geologic interpretation of the area. However, the possible effect of these artifacts on images produced as “pan-band-sharpened” images was not investigated as part of this study, but should be. Appendices 1-6 present the images compared in this study and provide additional comments on results. Most of the results of this study are qualitative in the sense that they speak to the interpretability of enhanced image products generated from gap-filled SLC-Off data rather than to the effect on DN’s of the anomaly and of the process applied to correct it. However, statistical comparisons were performed on the six 30 m bands, and the results support the visual, qualitative conclusion that it oftentimes is difficult to distinguish between the SLC-On and gap-filled SLC-Off images. This was no more apparent than in the comparison of histograms from SLC-On and gap-filled SLC-Off Bands 7 images (below), which appear very similar to each other. The SLC-On Band 7 image has a mean of 115.006289 and a standard deviation of 26.079503 compared with a mean of 114.876260 and a standard deviation of 25.902077 for the gap-filled SLC-Off Band 7 image. Differences in means and standard deviations for the other five 30 m bands were similar.
SLC-On Band 7 Histogram Gap-filled SLC-Off Band 7 Histogram
2

3
Conclusions Caution always must be exercised when extrapolating specific results to a general situation, and while this study was limited in its scope, particularly in the fact that only one study area was examined, its results seem to bode well for the utility of ETM+ gap-filled SLC-Off data. This study clearly suggests that for geologic mapping in semi-arid terrain the utility of ETM+ gap-filled SLC-Off data is no less than that of ETM+ data acquired prior to the May 31, 2003 scan line corrector malfunction. The study employed synthesized gap-filled SLC-Off data believed to be fully representative of actual Gap-filled SLC-Off data. To be totally confident in concluding that gap-filled SLC-Off data will not negatively impact ETM+-based geologic studies in arid and semi-arid terrain, this investigator would prefer to evaluate real gap-filled SLC-Off data and to do so for one or two additional field areas.

Appendix 1 – FCC Image Comparisons
Drum Mountains Study Area
2
1
Zo
SLC–On 2% Above – Lineardata appear neainterpretation im
Gap-filled SLC–
Zoom
om 3
LCS FCC 4(R) 3(G) 2
contrast stretched, Frly identical to each ages. Below - Gap-
Off 2% LCS FCC 4(R)
Zoom
(B) Gap-filled SLC–Off 2% LCS FCC 4(R) 3(G) 2(B)
CC images produced from SLC-On and gap-filled SLC-Off other and are equally good as overview and general filled image (left) and image mask showing gap locations.
3(G) 2(B) Image mask with image gaps shown as colored strips
4

SLC–On 2% LS FCC - Zoom 1 Gap-filled SLC–Off 2% LS FCC - Zoom 1 Above - Zoom 1 images are very similar to each other. The main difference in appearance is in overall scene brightness that resulted from minor differences in the mappings applied during contrast enhancement. Below - Comparison of the gap-filled Zoom 1 image and the location of the gaps in the image. The gap-fill data are discernible in the zoom image, but they are not real obvious, even at this enlarged scale.
Gap-filled SLC–Off 2% LS FCC - Zoom 1 Image mask with image gaps shown as colored strips 5

SLC–On 2% LS FCC - Zoom 2 Gap-filled SLC–Off 2% LS FCC - Zoom 2 Above - Zoom 2 images also are very similar to each other with the main difference in appearance again being in overall scene brightness that resulted from minor differences in the mappings applied during contrast enhancement. Below - Comparison of the gap-filled zoom 1 image and the location of the gaps in the image. Again, the gap-fill data are discernible in the zoom image, but they are rather subtle given the enlarged scale of the image.
Gap-filled SLC–Off 2% LS FCC - Zoom 2 Image mask with image gaps shown as colored strips
6

SLC–On 2% LS FCC - Zoom 3 Gap-filled SLC–Off 2% LS FCC - Zoom 3 Above - As with the other FCC zoom image comparisons, these images appear are very similar to each other and seem to be different primarily in overall scene brightness that resulted from minor differences in the mappings applied during contrast enhancement. Below - Comparison of the gap-filled Zoom 1 image and the location of the gaps in the image. In this case, the gaps in the in SLC-Off zoom image seem almost indiscernible.
Gap-filled SLC–Off 2% LS FCC - Zoom 3 Image mask with image gaps shown as colored strips
7

Appendix 2 – Band Ratio Image Comparisons
Drum Mountains Study Area
Zoom 1
Zoom 2
Zoom 3
SLC–On Band Ratio Image 3/1(R) 5/7(G) 7/3(B) Gap-filled SLC–Off Band Ratio Image 3/1(R) 5/7(G) 7/3(B) Above - Band ratio color composite images were important in the Drum Mts. area for their ability to locate areas of hydrothermally altered igneous rocks and bleached carbonate rocks. These band ratio images produced from SLC-On and gap-filled SLC-Off data appear nearly identical to each other. Below - Gap-filled image (left) and image mask showing gap locations.
8
Gap-filled SLC–Off Ratio Image 3/1(R) 5/7(G) 7/3(B) Image mask with image gaps shown as B&W strips
Gap-fill Anomalies
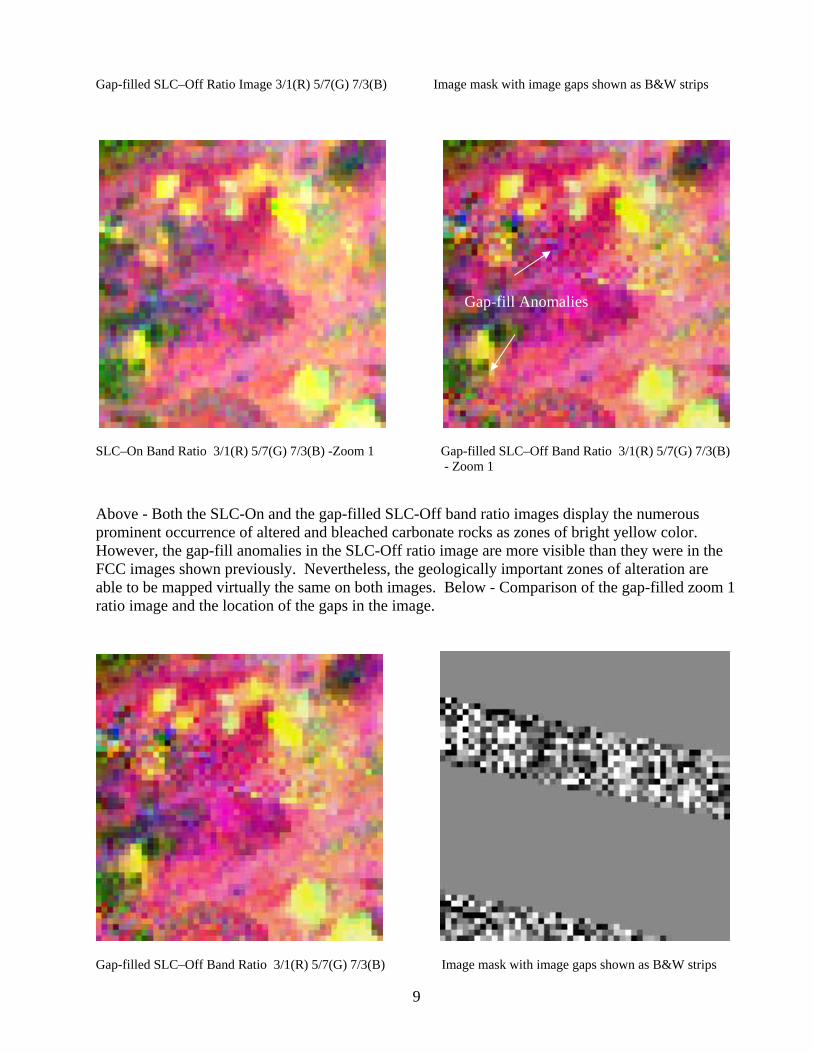
SLC–On Band Ratio 3/1(R) 5/7(G) 7/3(B) -Zoom 1 Gap-filled SLC–Off Band Ratio 3/1(R) 5/7(G) 7/3(B) - Zoom 1 Above - Both the SLC-On and the gap-filled SLC-Off band ratio images display the numerous prominent occurrence of altered and bleached carbonate rocks as zones of bright yellow color. However, the gap-fill anomalies in the SLC-Off ratio image are more visible than they were in the FCC images shown previously. Nevertheless, the geologically important zones of alteration are able to be mapped virtually the same on both images. Below - Comparison of the gap-filled zoom 1 ratio image and the location of the gaps in the image.
Gap-filled SLC–Off Band Ratio 3/1(R) 5/7(G) 7/3(B) Image mask with image gaps shown as B&W strips
9
- Zoom 1
Gap-fill Anomalies
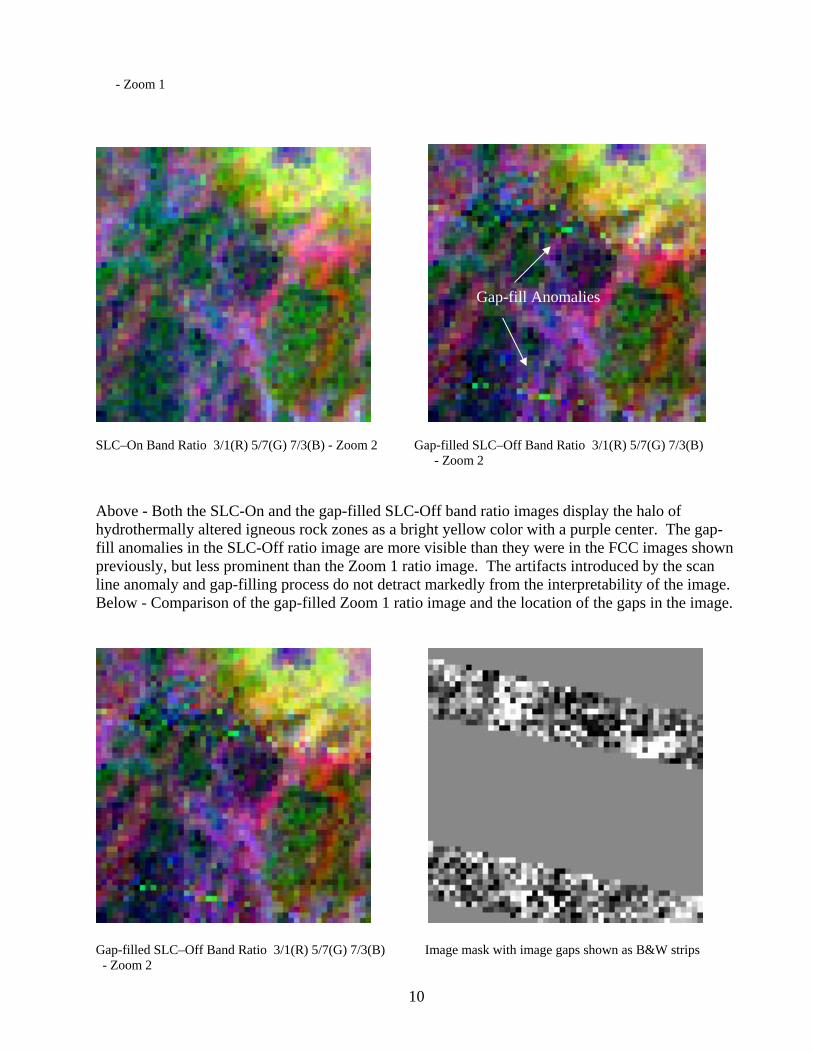
SLC–On Band Ratio 3/1(R) 5/7(G) 7/3(B) - Zoom 2 Gap-filled SLC–Off Band Ratio 3/1(R) 5/7(G) 7/3(B) - Zoom 2 Above - Both the SLC-On and the gap-filled SLC-Off band ratio images display the halo of hydrothermally altered igneous rock zones as a bright yellow color with a purple center. The gap-fill anomalies in the SLC-Off ratio image are more visible than they were in the FCC images shown previously, but less prominent than the Zoom 1 ratio image. The artifacts introduced by the scan line anomaly and gap-filling process do not detract markedly from the interpretability of the image. Below - Comparison of the gap-filled Zoom 1 ratio image and the location of the gaps in the image.
Gap-filled SLC–Off Band Ratio 3/1(R) 5/7(G) 7/3(B) Image mask with image gaps shown as B&W strips - Zoom 2
10
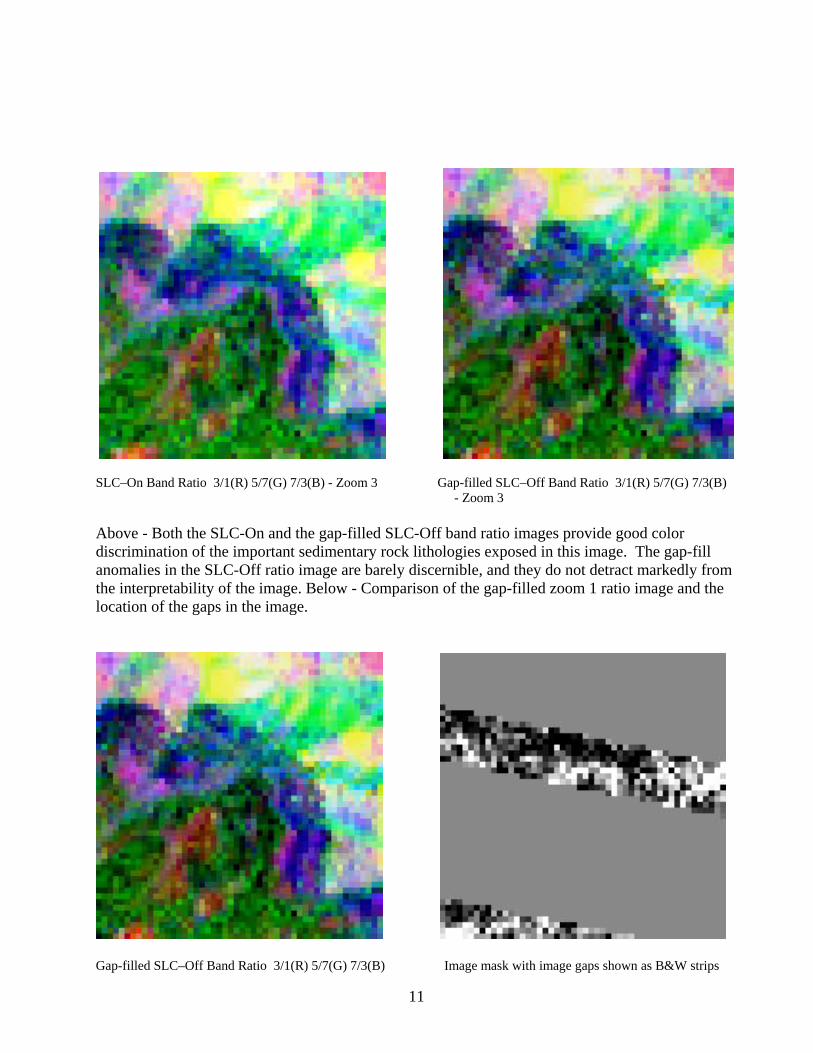
SLC–On Band Ratio 3/1(R) 5/7(G) 7/3(B) - Zoom 3 Gap-filled SLC–Off Band Ratio 3/1(R) 5/7(G) 7/3(B) - Zoom 3 Above - Both the SLC-On and the gap-filled SLC-Off band ratio images provide good color discrimination of the important sedimentary rock lithologies exposed in this image. The gap-fill anomalies in the SLC-Off ratio image are barely discernible, and they do not detract markedly from the interpretability of the image. Below - Comparison of the gap-filled zoom 1 ratio image and the location of the gaps in the image.
Gap-filled SLC–Off Band Ratio 3/1(R) 5/7(G) 7/3(B) Image mask with image gaps shown as B&W strips
11

- Zoom 3
Appendix 3 – Principal Components Image Comparisons
Drum Mountains Study Area
Zoom 1
Zoom 2
Zoom 3
SLC–On Saturation Stretched PC 4(R) 1(G) 3(B) Gap-filled SLC–Off Saturation Stretched PC 4(R) 1(G) 3(B) Above - These saturation-stretched principal components images produced from SLC-On and gap-filled SLC-Off data appear virtually the same. This PC image was very useful for discriminating sedimentary rock units and locating zones of hydrothermal alteration in the Drum Mts. study area. Below - Gap-filled image (left) and image mask showing gap locations.
12
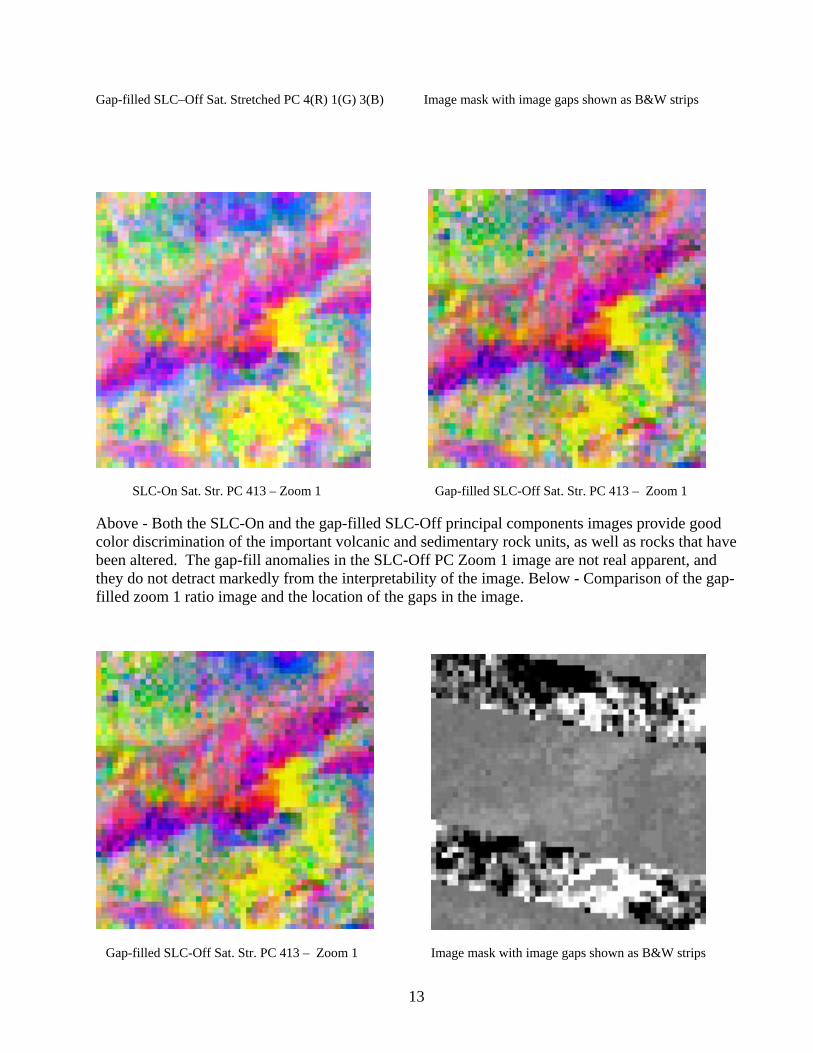
Gap-filled SLC–Off Sat. Stretched PC 4(R) 1(G) 3(B) Image mask with image gaps shown as B&W strips
SLC-On Sat. Str. PC 413 – Zoom 1 Gap-filled SLC-Off Sat. Str. PC 413 – Zoom 1 Above - Both the SLC-On and the gap-filled SLC-Off principal components images provide good color discrimination of the important volcanic and sedimentary rock units, as well as rocks that have been altered. The gap-fill anomalies in the SLC-Off PC Zoom 1 image are not real apparent, and they do not detract markedly from the interpretability of the image. Below - Comparison of the gap-filled zoom 1 ratio image and the location of the gaps in the image.
Gap-filled SLC-Off Sat. Str. PC 413 – Zoom 1 Image mask with image gaps shown as B&W strips
13

SLC-On Sat. Str. PC 413 – Zoom 2 Gap-filled SLC-Off Sat. Str. PC 413 – Zoom 2 Above - Both the SLC-On and the gap-filled SLC-Off principal components images provide good color discrimination of sedimentary rock units located along the eastern front of the Drum Mts. The gap-fill anomalies in the SLC-Off PC Zoom 1 image are barely discernible. In general, scan line anomaly related artifacts were not readily observed in the images produced using principal components analysis. Below - Comparison of the gap-filled zoom 1 ratio image and the location of the gaps in the image.
Gap-filled SLC-Off Sat. Str. PC 413 – Zoom 2 Image mask with image gaps shown as B&W strips
14
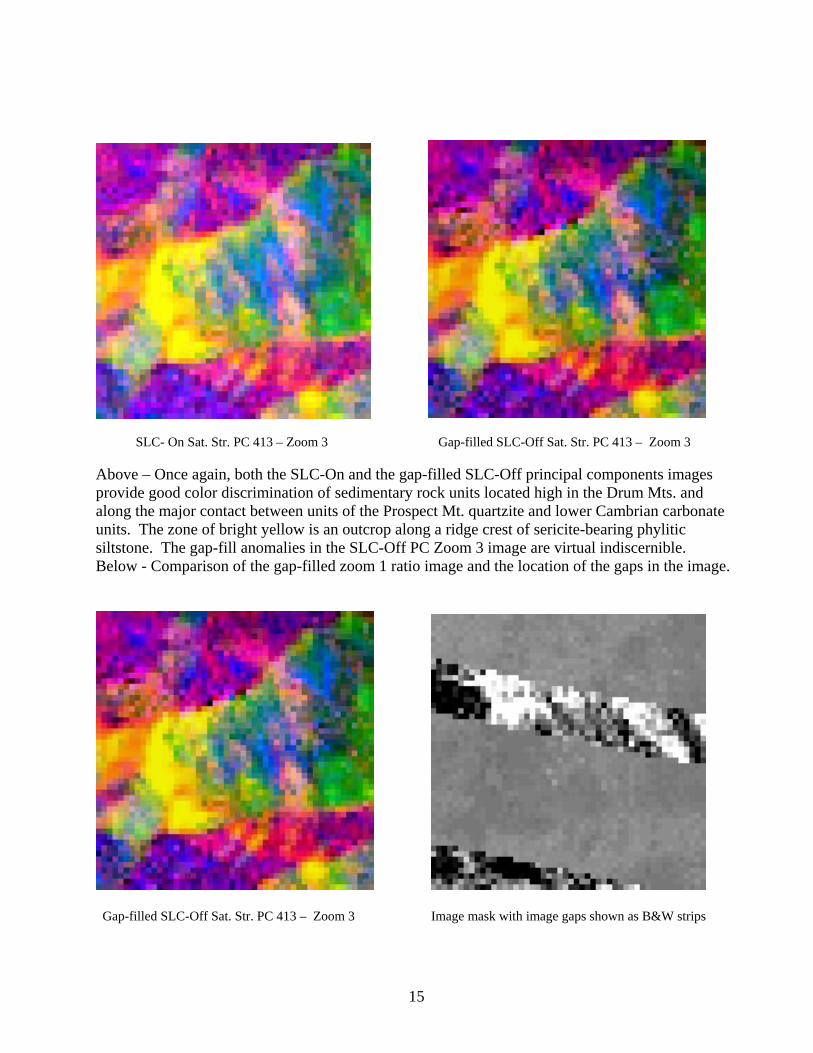
SLC- On Sat. Str. PC 413 – Zoom 3 Gap-filled SLC-Off Sat. Str. PC 413 – Zoom 3 Above – Once again, both the SLC-On and the gap-filled SLC-Off principal components images provide good color discrimination of sedimentary rock units located high in the Drum Mts. and along the major contact between units of the Prospect Mt. quartzite and lower Cambrian carbonate units. The zone of bright yellow is an outcrop along a ridge crest of sericite-bearing phylitic siltstone. The gap-fill anomalies in the SLC-Off PC Zoom 3 image are virtual indiscernible. Below - Comparison of the gap-filled zoom 1 ratio image and the location of the gaps in the image.
Gap-filled SLC-Off Sat. Str. PC 413 – Zoom 3 Image mask with image gaps shown as B&W strips
15

Appendix 4 – Decorrelation Stretch Image Comparisons
Drum Mountains Study Area
Zoom 1
Zoom 2
Zoom 3
SLC–On Decor & Saturation Stretch 5(R) 3(G) 7(B) SLC–Off Decor & Saturation Stretch 5(R) 3(G) 7(B) Above - These decor stretch images produced from SLC-On and Gap-filled SLC-Off data appear nearly identical to each other. This decor stretch image was very useful in the Drum Mts. area for mapping sedimentary rocks and locating areas of hydrothermally altered igneous rocks and bleached carbonate rocks. Below - Gap-filled image (left) and image mask showing gap locations.
16

SLC–Off Decor & Saturation Stretch 5(R) 3(G) 7(B) Image mask with image gaps shown as B&W strips
SLC-On Decor. & Sat. Str. 537 – Zoom 1 Gap-filled SLC-Off Decor. & Sat. Str. 537 - Zoom 1 Above - Both the SLC-On and the gap-filled SLC-Off decorrelation and saturation stretched images provide good color discrimination of the important volcanic and sedimentary rock units, as well as rocks that have been altered. The gap-fill anomalies in the SLC-Off decor and saturation stretched Zoom 1 image are discernible, but they do not detract much from the interpretability of the image. Below - Comparison of the gap-filled Zoom 1 decor. Stretch image and the location of the gaps in the image.
17

Gap-filled SLC-Off Decor. & Sat. Str. 537 - Zoom 1 Image mask with image gaps shown as B&W strips
Gap-fill Anomalies
SLC-On Decor. & Sat. Str. 537 – Zoom 2 Gap-filled SLC-Off Decor. & Sat. Str. 537 - Zoom 2 Above - Both the SLC-On and the gap-filled SLC-Off decorrelation and saturation stretched images clearly show the disturbed ground surrounding the abandon Drum Mine as bright yellow. However, the gap-fill anomalies in the SLC-Off decor and saturation stretched Zoom 2 image are quite discernible, yet they do not detract all that much from the interpretability of the image. Below - Comparison of the gap-filled Zoom 2 decor. stretch image and the location of the gaps in the image.
18

Gap-filled SLC-Off Decor. & Sat. Str. 537 - Zoom 2 Image mask with image gaps shown as B&W strips
Gap-fill Anomalies
SLC-On Decor. & Sat. Str. 537 – Zoom 3 Gap-filled SLC-Off Decor. & Sat. Str. 537 - Zoom 3 Above – Once again, both the SLC-On and the gap-filled SLC-Off decorrelation and saturation stretched images provide good color discrimination of sedimentary rock units located high in the Drum Mts. and along the major contact between units of the Prospect Mt. quartzite and lower Cambrian carbonate units. The zone of bright yellow is an outcrop along a ridge crest of sericite-bearing phylitic siltstone. In this case, the gap-fill anomaly does slightly diminish the ability to accurately interpret lithologic contacts between rock units. Below - Comparison of the gap-filled Zoom 3 decor. stretch image and the location of the gaps in the image.
19

Gap-filled SLC-Off Decor. & Sat. Str. 537 - Zoom 3 Image mask with image gaps shown as B&W strips Appendix 5 –Pan Band Image Comparisons
Drum Mountains Study Area
Zoom
SLC–On Pan Band Gap-filled SLC–Off Pan Band Above - SLC-On and gap-filled SLC-Off pan band images appear virtually identical. However, at enlarged scale distinct artifacts related to the scan line anomaly and gap filling process are apparent. Below - Gap-filled image (left) and image mask showing gap locations.
20

Gap-filled SLC–Off Pan Band Image mask with image gaps shown as B&W strips
Gap-fill Anomalies
SLC–On Pan Band – Zoom SLC–Off Pan Band – Zoom Above – 15-meter pan band images from SLC-On and gap-filled SLC-Off data from the Zoom area have a very similar appearance, but the gap-filled areas are clearly visible in the SLC-Off image. However, the interpretability of the gap-filled SLC-Off image is not diminished significantly compared to the SLC-On image. Below - Comparison of the gap-filled Zoom 1 image and the location of the gaps in the image.
21

SLC–Off Pan Band – Zoom Image mask with image gaps shown as B&W strips Appendix 6 – TIR Image Comparisons
Drum Mountains Study Area
Zoom
SLC–On TIR Image Gap-filled SLC–Off TIR Image Above - These SLC-On and gap-filled SLC-Off TIR images are very similar in general appearance, but the gap-filled SLC-Off images contain distinct linear artifacts related to the scan line anomaly and gap-filling process. Below - Gap-filled image (left) and image mask showing gap locations.
22

Gap-filled SLC–Off TIR Image Image mask with image gaps shown as B&W strips
Numerous Gap-fill Anomalies
SLC–On TIR Image - Zoom Gap-filled SLC–Off TIR Image - Zoom Above - The general appearance of the SLC-On and gap-filled SLC-Off TIR Zoom images is very similar, but gap-filled artifacts are clearly visible in the SLC-Off Zoom image. While their impact on the visual interpretability of the ETM+ thermal band image is not great, their potential impact on quantitative temperature or emissivity investigations needs further study. Below - Comparison of the gap-filled Zoom image and the location of the gaps in the image. 23

Gap-filled SLC–Off TIR Image – Zoom Image mask with image gaps shown as B&W strips
24