Embed Size (px)
Citation preview

Supplementary Fig. S1. Calculation of P-score according to P-value.
P-score is defined by the represented equation. The graph shows relationship between P-score
and P-value; x-axis indicates P-value with log-scale and y-axis indicates P-score. For easy
recognition of statistical significance, we projected P-score to 0.5 when P-value is 0.01.
Evaluation of drug-targetable genes by defining modes of abnormality in
gene expression
Junseong Park*, Jungsul Lee, Chulhee Choi*
10 -10 10 -8 10 -6 10 -4 10 -2 10 00
0.1
0.2
0.3
0.4
0.5
0.6
0.7
0.8
0.9
1
P-value
P-sc
ore
P-score = sign(tg)×{1 – log10(P-value)}sign(tg) = +1, if tg expression in cancer ≥ in normal
–1, if tg expression in cancer < in normal
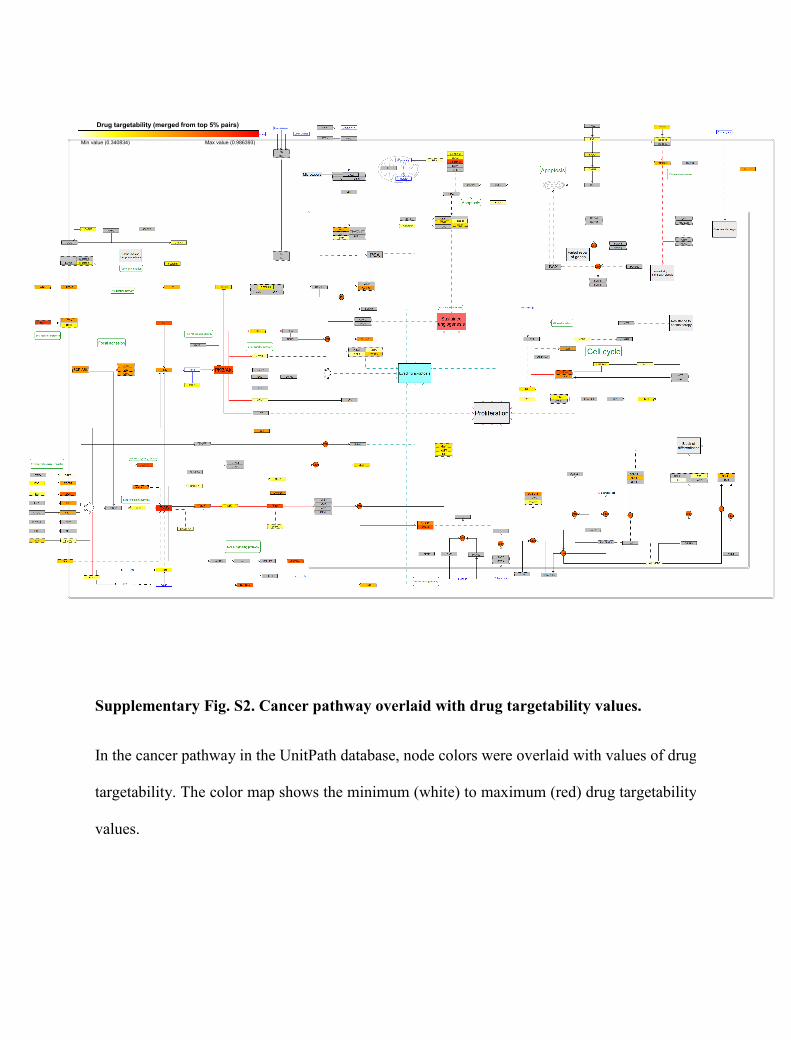
Drug targetability (merged from top 5% pairs)
Min value (0.340834) Max value (0.986393)
Supplementary Fig. S2. Cancer pathway overlaid with drug targetability values.
In the cancer pathway in the UnitPath database, node colors were overlaid with values of drug
targetability. The color map shows the minimum (white) to maximum (red) drug targetability
values.