1
Evaluation of Drug Disposition Using Transgenic Animal Models and Quantitative Whole Body Autoradiography Draganov, D. 1 ; Johnson, T. 1 ; Knecht, C. 1 ; Godsey, J. 1 ; MacElrevey, C. 1 ; MacBride, M. 2 ; Sved, D. 1 ; Chengelis, C. 1 1 WIL Research Laboratories, LLC, Ashland, OH, 2 Taconic, Hudson, NY ABSTRACT The important role of membrane transporters in drug absorption and disposition, therapeutic efficacy and adverse drug reactions as well as for drug-drug interactions is nowadays well recognized. The identification of the membrane transporters that influence the disposition and safety of drugs in development is a major challenge in preclinical drug evaluation. In vivo animal models are an important tool to investigate the interplay between uptake/efflux transporters and metabolizing enzymes and the relative importance of each transporter or enzyme considering overlapping substrate specificity. Current study demonstrates the utility of using transgenic mice lacking efflux transporter gene(s) and quantitative whole body autoradiography (QWBA) to study the role of the individual transporters in the disposition and elimination of a radiolabeled drug. Wild type (wt) FVB mice and ABC transporter family knock-out (KO) mice on FVB background (Mdr1a/b (-/-) , Bcrp (-/-) , and Mrp2 (-/-) ) were provided by Taconic (Hudson, NY). 14 C-Taxol was selected as a probe and the brain as a primary target organ. The time course of plasma and tissue distribution of 14 C-taxol equivalents was determined first, and based on the results two time points (6 and 24 hours post-dosing) were selected for comparison of 14 C-taxol distribution in the wt and KO mice. At both evaluation time points, concentrations of 14 C-taxol equivalents in the brain higher than the wt were observed for the Mdr1a/b (-/-) mice (10- to 20-fold difference at 6 hours post- dosing and 60- to 200-fold difference at 24 hours post-dosing), but not for the Bcrp (-/-) and Mrp2 (-/-) mice. This proof of concept study demonstrated the utility of using transgenic mice models and QWBA for elucidation of the role of individual transporters in drug disposition. INTRODUCTION The important role of membrane transporters in drug absorption and disposition, therapeutic efficacy and adverse drug reactions as well as for drug-drug interactions is well recognized. The identification of the membrane transporters that influence the disposition and safety of drugs in development is a major challenge in preclinical drug evaluation. More than 400 membrane transporters belonging to two major superfamilies, ATP-binding cassette (ABC) and solute carrier, have been annotated in the human genome [1]. Among these, P-glycoprotein (P-gp, MDR1, ABCB1), breast cancer resistance protein (BCRP, ABCG2), and multidrug resistance protein (MRP2, ABCC2) are known to have a significant impact on bioavailability of many drugs [2]. The techniques and methodology for studying drug-transporter interactions continually evolve. In vitro methods (membrane- and cell-based assays) are currently used to identify substrates and inhibitors for the individual transporters and for developing QSAR models. Decision trees for P-gp and BCRP substrate and inhibitor interactions based on results from bidirectional in vitro transporter assays have been described in the FDA guidance for drug interaction studies [3] and in the white paper membrane transporters in drug development [1]; probable P-gp and BCRP substrates/inhibitors are then recommended to be further assessed in vivo. In vivo animal models, particularly transgenic animals lacking one or more transporters, are important tools to investigate the interplay between uptake/efflux transporters and metabolizing enzymes and the relative importance of each transporter or enzyme considering overlapping substrate specificity. In the current study we evaluated the utility of using transgenic mice lacking efflux transporter gene(s) and quantitative whole body autoradiography (QWBA) to study the role of the individual transporters in the disposition and elimination of a radiolabeled drug. Wild type (wt) FVB and ABC transporter family knock-out (KO) mice on FVB background (Mdr1a/b (-/-) , Bcrp (-/-) , and Mrp2 (-/-) ) were used. 14 C-Taxol was selected as a probe and the brain as a primary target organ. P-gp and BCRP are both present in brain endothelium and therefore are likely to play a role in a drug disposition in the brain [4, 5]. First, the time course of plasma and tissue distribution of 14 C-taxol equivalents was determined in the FVB wt, and based on the results two time points (6 and 24 hours post-dosing) were selected for comparison of the 14 C taxol distribution in the wt and KO mice. METHODS AND MATERIALS FVB wt mice and efflux transporter KO mice on FVB background (Mdr1a/b (-/-) , Bcrp (-/-) , and Mrp2 (-/-) ) were provided by Taconic (Hudson, NY). Animals were housed and handled following WIL research Laboratories, LLC standard operating procedures. The protocol for the study was approved by the Institutional Animal care Use committee. Nonlabeled and 14 C-labeled taxol were purchased from Moravek Biochemicals, Inc., Brea, CA. On the days of dosing, taxol was formulated in Polysorbate 80:ethanol:sterile saline in 1:1:6 ratio (v/v/v). Phase I: Six (3 per sex) FVB wt mice were administered a single intraperiotoneal (IP) injection of 14 C-taxol at 0.25 mg/ (5 µci)/animal. Blood, bladder urine and a select set of tissues were collected from one animal per sex at 2, 4, 6, 8, 12, and 24 hours postdose. The collected samples were analyzed for total radioactivity by liquid scintillation counting (LSC). Phase II: Twelve FVB wt, Mdr1a/b (-/-) , Bcrp (-/-) , and Mrp2 (-/-) KO mice (6 per sex from each strain) were administered a single IP injection of 14 C-taxol at 0.25 mg (5µCi)/animal. Blood was collected from 3 animals/sex/strain at 6 and 24 hours post-dosing. Whole blood and plasma were analyzed for total radioactivity by LSC. carcasses were processed for WBA (see next section). Quantitative Whole Body Autoradiography (QWBA) Analysis After euthanasia, the carcasses were submerged in a dry ice/hexane bath until frozen. The frozen carcasses blocked in 5% (w/v) carboxymethylcellulose (CMC). Standards and quality control (QC) samples were prepared by fortification of mouse whole blood with known amounts of 14 C-glucose. Sagittal, 30-µm thick sections of the CMC-embedded mouse carcasses, including QC standards, and CMC-embedded calibration standards, were collected and using transfer tape. The sections were dehydrated and placed on phosphor imaging plates. The exposure time was approximately 4 days. The imaging plates were scanned using a Fujifilm BAS-5000 phosphor imager. The images (autoradioluminograms) were overlaid, if necessary, with digital images of the sections to aid in the identification of tissue localization of the radioactivity. Approximately 30 tissues/animal were analyzed. RESULTS Phase I. The time course of 14 C-taxol equivalents in plasma, brain, liver, and kidney in the FVB wt mice is presented in Figure 1. Peak concentration of 14 C-taxol equivalents in brain was observed at 6 hours post-dosing in both male and female mice, and this time point was selected as a primary evaluation period for Phase II of the study. Phase II. Plasma concentrations of 14 C-taxol equivalents at 6 and 24 hours post-dosing in the FVB wt and KO mice are presented in Figure 2. For the 6-hour post-dosing time point, 3 animals/sex per strain from the FVB wt and Mdr1a/b (-/-) were processed for and analyzed by QWBA. Representative images of whole body autoradioluminograms (pseudo-colored in rainbow) overlaid with the digital image of the sections are presented in Figure 3. The interanimal variability in the concentration of the 14 C-taxol derived radioactivity among the animals from the same sex and strain was low and, therefore, single animals/sex/time point were analyzed by QBWA for the Bcrp (-/-) and Mrp2 (-/-) mice at 6 hours post-dosing and for all strains at 24 hours post- dosing. Representative images of autoradioluminograms (pseudo-colored in rainbow) of the heads overlaid with the digital image of the sections are presented in Figure 4. The estimated brain-to-plasma ratio is illustrated in Figure 2. The concentrations of 14 C-taxol equivalents in selected tissues at 6 and 24 hours post-dosing are presented in Table 1; the ratio of the tissue concentration in KOs vs. wt was color coded as indicated in the table legend. At both evaluation time points, concentrations of 14 C-taxol equivalents in the brain higher than the wt were observed for the Mdr1a/b (-/-) mice (10- to 20-fold difference at 6 hours post-dosing and 60- to 200-fold difference at 24 hours post dosing), but not for the Bcrp (-/-) and Mrp2 (-/-) mice. Higher concentrations of 14 C-taxol equivalents in many tissues were observed at 24 hours post-dosing in all 3 KOs compared to the wt which was likely due to impaired elimination of the taxol metabolites from liver and kidney. CONCLUSIONS This proof of concept study demonstrated the utility of using transgenic mice models and QWBA for elucidation of the role of individual transporters in drug disposition. The research strategy will be to determine the time course of plasma and tissue distribution of the radiolabeled drug in FVB wt mice for optimal selection of time point(s) to investigate the dispositionof the drug in the KO mice. The feasibility of using 14 C-taxol as a probe for evaluation of potential/ proposed P-gp inhibitors in vivo is under current investigation. REFERENCES 1. K. M. Giacomini, S.-M. Huang, D. J. Tweedie et al. for The International Transporter Consortium: Membrane transporters in drug development. Nature Reviews Drug Discovery (2010) 9:215231. 2. H. Glaeser and M. F. Fromm: Animal models and intestinal drug transport. Expert Opin Drug Metab Toxicol (2008) 4:347-361. 3. US Department of Health and Human Services, Food and Drug Administration, Center for Drug Evaluation and Research (CDER), Center for Biologics Evaluation and Research (CBER): Guidance for Industry. Drug Interaction Studies — Study Design, Data Analysis, and Implications for Dosing and Labeling. (2006). 4. E. M. Kemper, E. van Zandbergen, C. Cleypool, H. A. Mos, W. Boogerd, J. H. Beijnen, and O. van Tellingen: Increased Penetration of Paclitaxel into the Brain by Inhibition of P-Glycoprotein. Clin Cancer Res (2003) 9:2849-2855. 5. N. A. de Vries, J. Zhao, E. Kroon, T. Buckle, J. H. Beijnen, and O. van Tellingen: P-Glycoprotein and Breast Cancer Resistance Protein: Two Dominant Transporters Working Together in Limiting the Brain Penetration of Topotecan. Clin Cancer Res November (2007) 13:6440-6449. ACKNOWLEDGMENTS The authors acknowledge the excellent technical support provided by the staff of Metabolism Department at WIL Research Laboratories, LLC. The authors also wish to thank Taconic for providing the FVB wt and efflux transporter KO mice. APRIL2010 Figure 1 Phase I: Time course of 14 C-Taxol Equivalents in Plasma, Brain, Liver, and Kidney of FVB wt Mice after a Single IP Injection of 14 C-Taxol at 0.25 mg/animal. Figure 2 Phase II: Time course of 14 C-Taxol Equivalents in Plasma and Brain to Plasma Ratio in FVB wt, Mdr1a/b (-/-) , Bcrp (-/-) , and Mrp2 (-/-) Mice after a Single IP Injection of 14 C-Taxol at 0.25 mg/animal. Figure 3 Whole Body Autoradioluminograms Overlaid with the Section Images for Representative FVB wt and Mdr1a/b (-/-) Male Mice at 6 and 24 Hours after a Single IP Injection of 14 C-Taxol at 0.25 mg/animal. Figure 4 Autoradioluminograms Overlaid with the Section Images for Representative FVB wt, Mdr1a/b (-/-) , Bcrp (-/-) , and Mrp2 (-/-) Mice at 6 and 24 Hours after a Single IP Injection of 14 C-Taxol at 0.25 mg/animal. Table 1 Concentration of 14 C-Taxol Equivalents (ng/g) in Representative Tissues of FVB wt, Mdr1a/b (-/-) , Bcrp (-/-) , and Mrp2 (-/-) Mice at 6 and 24 Hours after a Single IP Injection of 14 C-Taxol at 0.25 mg/animal Strain FVB wt Mdr1a/b (-/-) Bcrp (-/-) Mrp2 (-/-) Tissue Males Females Males Females Males Females Males Females 6 Hours Post-dosing Adrenal gland 3050 3416 7542 11462 10742 3075 5432 1913 Brain 28.4 13.5 288 261 12.3 15.7 67.1 16.2 Heart 1811 1418 3088 3473 1071 881 2830 1516 Kidney 5071 6054 6146 6933 3481 5104 9844 10921 Liver 32275 15912 42275 30828 18765 13589 50084 23177 Lung 2228 2449 4426 5555 1038 1739 5386 1890 Pancreas 4926 5007 5005 5905 3345 4986 6734 4085 Spleen 3338 3077 6078 7449 2382 3566 5078 1578 Thymus 1510 878 1763 2510 666 1243 1286 1178 24 Hours Post-dosing Adrenal gland 9.13 12.5 NSA 715 63.3 281 NSA NSA Brain 2.83 6.41 498 405 0.197 9.06 9.34 5.03 Heart 16.7 8.00 147 123 48.0 52.1 61.0 14.1 Kidney 26.0 49.0 194 374 392 436 1041 639 Liver 575 545 5242 3800 1415 1512 6846 3473 Lung 26.8 49.1 654 213 142 939 105 40.7 Pancreas 46.1 58.3 264 351 115 203 158 106 Spleen 7.72 37.9 234 252 236 127 57.2 34.6 Thymus 218 785 2167 1402 626 534 1458 477 NSA = No sample analyzed. KO/wt ratio <0.1 >0.1<0.5 >0.5<2 >2<10 >10

Evaluation of Drug Disposition Using Transgenic Animal

  • Upload
    others

  • View
    1

  • Download
    0

Embed Size (px)

Citation preview

Evaluation of Drug Disposition Using Transgenic Animal Models and Quantitative Whole Body Autoradiography

Draganov, D.1; Johnson, T.1; Knecht, C.1; Godsey, J.1; MacElrevey, C.1; MacBride, M.2; Sved, D.1; Chengelis, C.1

1WIL Research Laboratories, LLC, Ashland, OH, 2Taconic, Hudson, NY

ABsTrACT

The important role of membrane transporters in drug absorption and disposition, therapeutic efficacy and adverse drug reactions as well as for drug-drug interactions is nowadays well recognized. The identification of the membrane transporters that influence the disposition and safety of drugs in development is a major challenge in preclinical drug evaluation. In vivo animal models are an important tool to investigate the interplay between uptake/efflux transporters and metabolizing enzymes and the relative importance of each transporter or enzyme considering overlapping substrate specificity. Current study demonstrates the utility of using transgenic mice lacking efflux transporter gene(s) and quantitative whole body autoradiography (QWBA) to study the role of the individual transporters in the disposition and elimination of a radiolabeled drug. Wild type (wt) FVB mice and ABC transporter family knock-out (KO) mice on FVB background (Mdr1a/b(-/-), Bcrp(-/-), and Mrp2(-/-)) were provided by Taconic (Hudson, NY). 14C-Taxol was selected as a probe and the brain as a primary target organ. The time course of plasma and tissue distribution of 14C-taxol equivalents was determined first, and based on the results two time points (6 and 24 hours post-dosing) were selected for comparison of 14C-taxol distribution in the wt and KO mice. At both evaluation time points, concentrations of 14C-taxol equivalents in the brain higher than the wt were observed for the Mdr1a/b(-/-) mice (10- to 20-fold difference at 6 hours post-dosing and 60- to 200-fold difference at 24 hours post-dosing), but not for the Bcrp(-/-) and Mrp2(-/-) mice. This proof of concept study demonstrated the utility of using transgenic mice models and QWBA for elucidation of the role of individual transporters in drug disposition.

INTroDUCTIoNThe important role of membrane transporters in drug absorption and disposition, therapeutic efficacy and adverse drug reactions as well as for drug-drug interactions is well recognized. The identification of the membrane transporters that influence the disposition and safety of drugs in development is a major challenge in preclinical drug evaluation. More than 400 membrane transporters belonging to two major superfamilies, ATP-binding cassette (ABC) and solute carrier, have been annotated in the human genome [1]. Among these, P-glycoprotein (P-gp, MDR1, ABCB1), breast cancer resistance protein (BCRP, ABCG2), and multidrug resistance protein (MRP2, ABCC2) are known to have a significant impact on bioavailability of many drugs [2]. The techniques and methodology for studying drug-transporter interactions continually evolve. In vitro methods (membrane- and cell-based assays) are currently used to identify substrates and inhibitors for the individual transporters and for developing QSAR models. Decision trees for P-gp and BCRP substrate and inhibitor interactions based on results from bidirectional in vitro transporter assays have been described in the FDA guidance for drug interaction studies [3] and in the white paper membrane transporters in drug development [1]; probable P-gp and BCRP substrates/inhibitors are then recommended to be further assessed in vivo. In vivo animal models, particularly transgenic animals lacking one or more transporters, are important tools to investigate the interplay between uptake/efflux transporters and metabolizing enzymes and the relative importance of each transporter or enzyme considering overlapping substrate specificity.

In the current study we evaluated the utility of using transgenic mice lacking efflux transporter gene(s) and quantitative whole body autoradiography (QWBA) to study the role of the individual transporters in the disposition and elimination of a radiolabeled drug. Wild type (wt) FVB and ABC transporter family knock-out (KO) mice on FVB background (Mdr1a/b(-/-), Bcrp(-/-), and Mrp2(-/-)) were used. 14C-Taxol was selected as a probe and the brain as a primary target organ. P-gp and BCRP are both present in brain endothelium and therefore are likely to play a role in a drug disposition in the brain [4, 5]. First, the time course of plasma and tissue distribution of 14C-taxol equivalents was determined in the FVB wt, and based on the results two time points (6 and 24 hours post-dosing) were selected for comparison of the 14C taxol distribution in the wt and KO mice.

METhoDs AND MATErIAlsFVB wt mice and efflux transporter KO mice on FVB background (Mdr1a/b(-/-), Bcrp(-/-), and Mrp2(-/-)) were provided by Taconic (Hudson, NY). Animals were housed and handled following WIL research Laboratories, LLC standard operating procedures. The protocol for the study was approved by the Institutional Animal care Use committee.

Nonlabeled and 14C-labeled taxol were purchased from Moravek Biochemicals, Inc., Brea, CA. On the days of dosing, taxol was formulated in Polysorbate 80:ethanol:sterile saline in 1:1:6 ratio (v/v/v).

Phase I: Six (3 per sex) FVB wt mice were administered a single intraperiotoneal (IP) injection of 14C-taxol at 0.25 mg/ (5 µci)/animal. Blood, bladder urine and a select set of tissues were collected from one animal per sex at 2, 4, 6, 8, 12, and 24 hours postdose. The collected samples were analyzed for total radioactivity by liquid scintillation counting (LSC).

Phase II: Twelve FVB wt, Mdr1a/b(-/-), Bcrp(-/-), and Mrp2(-/-) KO mice (6 per sex from each strain) were administered a single IP injection of 14C-taxol at 0.25 mg (5µCi)/animal. Blood was collected from 3 animals/sex/strain at 6 and 24 hours post-dosing. Whole blood and plasma were analyzed for total radioactivity by LSC. carcasses were processed for WBA (see next section).

Quantitative Whole Body Autoradiography (QWBA) Analysis

After euthanasia, the carcasses were submerged in a dry ice/hexane bath until frozen. The frozen carcasses blocked in 5% (w/v) carboxymethylcellulose (CMC). Standards and quality control (QC) samples were prepared by fortification of mouse whole blood with known amounts of 14C-glucose. Sagittal, 30-µm thick sections of the CMC-embedded mouse carcasses, including QC standards, and CMC-embedded calibration standards, were collected and using transfer tape. The sections were dehydrated and placed on phosphor imaging plates. The exposure time was approximately 4 days. The imaging plates were scanned using a Fujifilm BAS-5000 phosphor imager. The images (autoradioluminograms) were overlaid, if necessary, with digital images of the sections to aid in the identification of tissue localization of the radioactivity. Approximately 30 tissues/animal were analyzed.

rEsUlTs

Phase I. The time course of 14C-taxol equivalents in plasma, brain, liver, and kidney in the FVB wt mice is presented in Figure 1. Peak concentration of 14C-taxol equivalents in brain was observed at 6 hours post-dosing in both male and female mice, and this time point was selected as a primary evaluation period for Phase II of the study.

Phase II. Plasma concentrations of 14C-taxol equivalents at 6 and 24 hours post-dosing in the FVB wt and KO mice are presented in Figure 2.

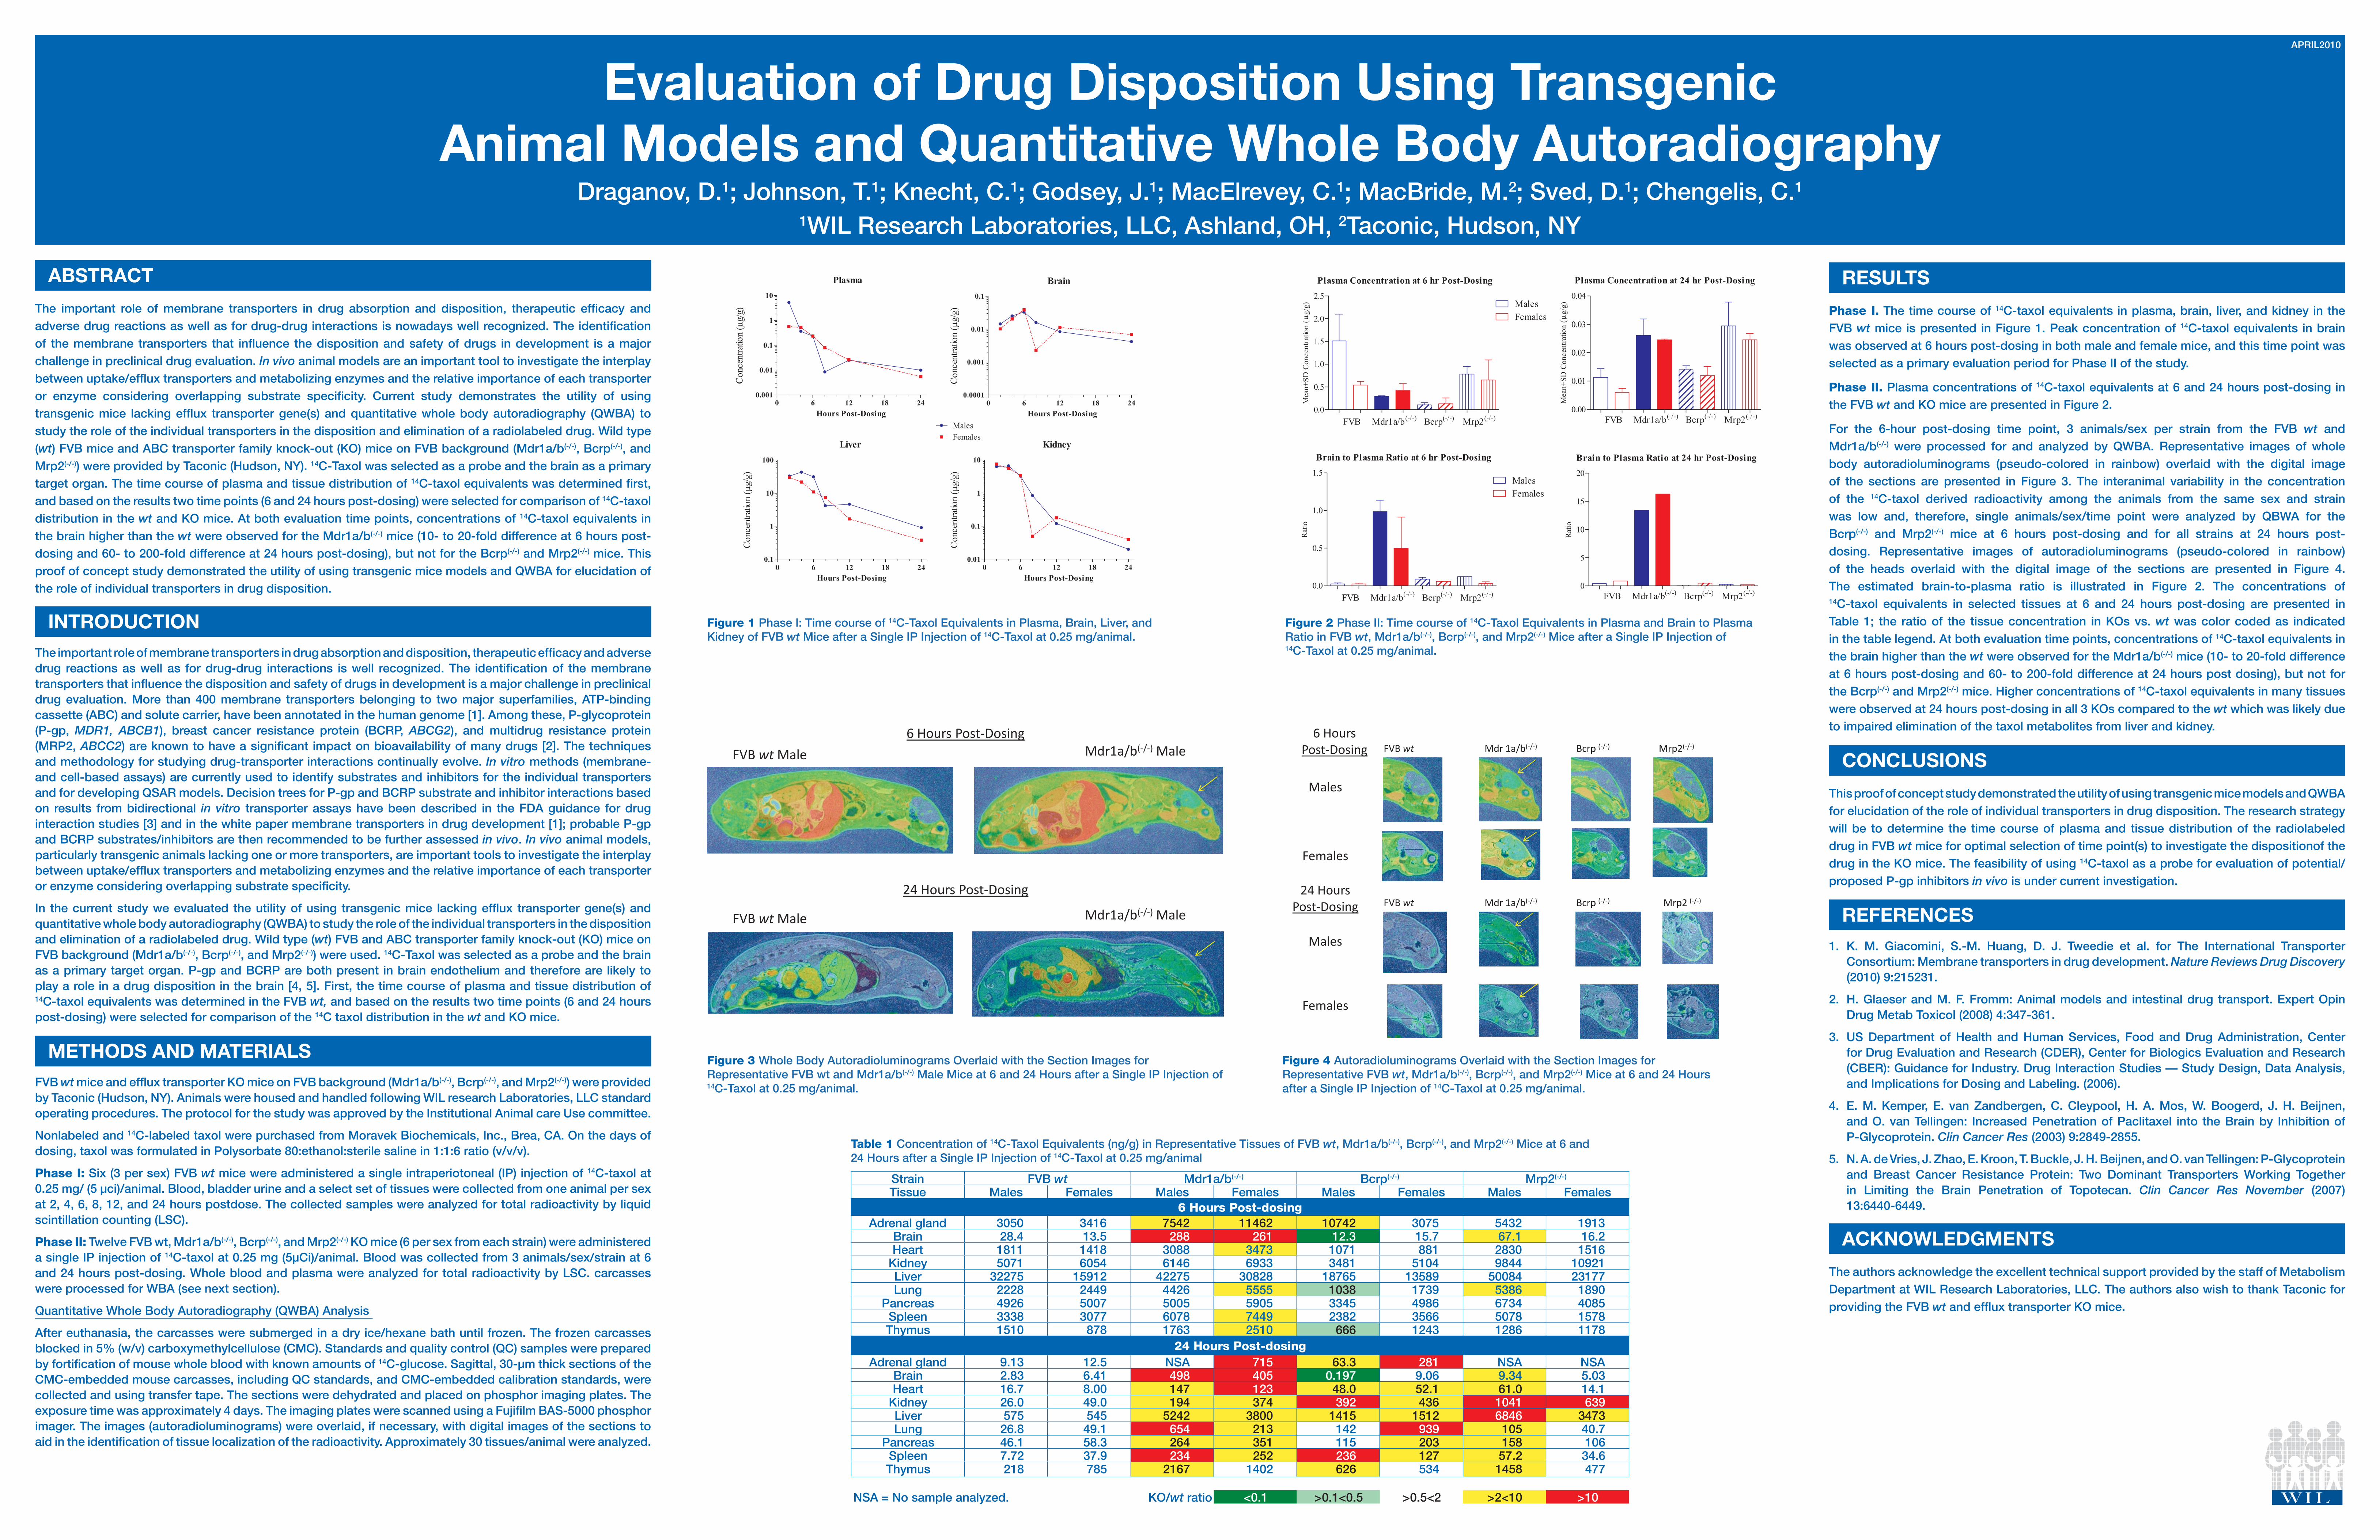
For the 6-hour post-dosing time point, 3 animals/sex per strain from the FVB wt and Mdr1a/b(-/-) were processed for and analyzed by QWBA. Representative images of whole body autoradioluminograms (pseudo-colored in rainbow) overlaid with the digital image of the sections are presented in Figure 3. The interanimal variability in the concentration of the 14C-taxol derived radioactivity among the animals from the same sex and strain was low and, therefore, single animals/sex/time point were analyzed by QBWA for the Bcrp(-/-) and Mrp2(-/-) mice at 6 hours post-dosing and for all strains at 24 hours post-dosing. Representative images of autoradioluminograms (pseudo-colored in rainbow) of the heads overlaid with the digital image of the sections are presented in Figure 4. The estimated brain-to-plasma ratio is illustrated in Figure 2. The concentrations of 14C-taxol equivalents in selected tissues at 6 and 24 hours post-dosing are presented in Table 1; the ratio of the tissue concentration in KOs vs. wt was color coded as indicated in the table legend. At both evaluation time points, concentrations of 14C-taxol equivalents in the brain higher than the wt were observed for the Mdr1a/b(-/-) mice (10- to 20-fold difference at 6 hours post-dosing and 60- to 200-fold difference at 24 hours post dosing), but not for the Bcrp(-/-) and Mrp2(-/-) mice. Higher concentrations of 14C-taxol equivalents in many tissues were observed at 24 hours post-dosing in all 3 KOs compared to the wt which was likely due to impaired elimination of the taxol metabolites from liver and kidney.

CoNClUsIoNs

This proof of concept study demonstrated the utility of using transgenic mice models and QWBA for elucidation of the role of individual transporters in drug disposition. The research strategy will be to determine the time course of plasma and tissue distribution of the radiolabeled drug in FVB wt mice for optimal selection of time point(s) to investigate the dispositionof the drug in the KO mice. The feasibility of using 14C-taxol as a probe for evaluation of potential/proposed P-gp inhibitors in vivo is under current investigation.

rEfErENCEs1. K. M. Giacomini, S.-M. Huang, D. J. Tweedie et al. for The International Transporter

Consortium: Membrane transporters in drug development. Nature Reviews Drug Discovery (2010) 9:215231.

2. H. Glaeser and M. F. Fromm: Animal models and intestinal drug transport. Expert Opin Drug Metab Toxicol (2008) 4:347-361.

3. US Department of Health and Human Services, Food and Drug Administration, Center for Drug Evaluation and Research (CDER), Center for Biologics Evaluation and Research (CBER): Guidance for Industry. Drug Interaction Studies — Study Design, Data Analysis, and Implications for Dosing and Labeling. (2006).

4. E. M. Kemper, E. van Zandbergen, C. Cleypool, H. A. Mos, W. Boogerd, J. H. Beijnen, and O. van Tellingen: Increased Penetration of Paclitaxel into the Brain by Inhibition of P-Glycoprotein. Clin Cancer Res (2003) 9:2849-2855.

5. N. A. de Vries, J. Zhao, E. Kroon, T. Buckle, J. H. Beijnen, and O. van Tellingen: P-Glycoprotein and Breast Cancer Resistance Protein: Two Dominant Transporters Working Together in Limiting the Brain Penetration of Topotecan. Clin Cancer Res November (2007) 13:6440-6449.

ACkNoWlEDgMENTs

The authors acknowledge the excellent technical support provided by the staff of Metabolism Department at WIL Research Laboratories, LLC. The authors also wish to thank Taconic for providing the FVB wt and efflux transporter KO mice.

APRIL2010

Figure 1 Phase I: Time course of 14C-Taxol Equivalents in Plasma, Brain, Liver, and Kidney of FVB wt Mice after a Single IP Injection of 14C-Taxol at 0.25 mg/animal.

Figure 2 Phase II: Time course of 14C-Taxol Equivalents in Plasma and Brain to Plasma Ratio in FVB wt, Mdr1a/b(-/-), Bcrp(-/-), and Mrp2(-/-) Mice after a Single IP Injection of 14C-Taxol at 0.25 mg/animal.

Figure 3 Whole Body Autoradioluminograms Overlaid with the Section Images for Representative FVB wt and Mdr1a/b(-/-) Male Mice at 6 and 24 Hours after a Single IP Injection of 14C-Taxol at 0.25 mg/animal.

Figure 4 Autoradioluminograms Overlaid with the Section Images for Representative FVB wt, Mdr1a/b(-/-), Bcrp(-/-), and Mrp2(-/-) Mice at 6 and 24 Hours after a Single IP Injection of 14C-Taxol at 0.25 mg/animal.

Table 1 Concentration of 14C-Taxol Equivalents (ng/g) in Representative Tissues of FVB wt, Mdr1a/b(-/-), Bcrp(-/-), and Mrp2(-/-) Mice at 6 and 24 Hours after a Single IP Injection of 14C-Taxol at 0.25 mg/animal

Strain FVB wt Mdr1a/b(-/-) Bcrp(-/-) Mrp2(-/-)

Tissue Males Females Males Females Males Females Males Females6 Hours Post-dosing

Adrenal gland 3050 3416 7542 11462 10742 3075 5432 1913Brain 28.4 13.5 288 261 12.3 15.7 67.1 16.2Heart 1811 1418 3088 3473 1071 881 2830 1516

Kidney 5071 6054 6146 6933 3481 5104 9844 10921Liver 32275 15912 42275 30828 18765 13589 50084 23177Lung 2228 2449 4426 5555 1038 1739 5386 1890

Pancreas 4926 5007 5005 5905 3345 4986 6734 4085Spleen 3338 3077 6078 7449 2382 3566 5078 1578Thymus 1510 878 1763 2510 666 1243 1286 1178

24 Hours Post-dosingAdrenal gland 9.13 12.5 NSA 715 63.3 281 NSA NSA

Brain 2.83 6.41 498 405 0.197 9.06 9.34 5.03Heart 16.7 8.00 147 123 48.0 52.1 61.0 14.1

Kidney 26.0 49.0 194 374 392 436 1041 639Liver 575 545 5242 3800 1415 1512 6846 3473Lung 26.8 49.1 654 213 142 939 105 40.7

Pancreas 46.1 58.3 264 351 115 203 158 106Spleen 7.72 37.9 234 252 236 127 57.2 34.6Thymus 218 785 2167 1402 626 534 1458 477

NSA = No sample analyzed. KO/wt ratio <0.1 >0.1<0.5 >0.5<2 >2<10 >10