Embed Size (px)
Citation preview
Hydrol. Earth Syst. Sci., 22, 4329–4348, 2018https://doi.org/10.5194/hess-22-4329-2018© Author(s) 2018. This work is distributed underthe Creative Commons Attribution 4.0 License.
Evaluation of Doppler radar and GTS data assimilationfor NWP rainfall prediction of an extreme summer stormin northern China: from the hydrological perspectiveJia Liu1, Jiyang Tian1, Denghua Yan1, Chuanzhe Li1, Fuliang Yu1, and Feifei Shen2
1State Key Laboratory of Simulation and Regulation of Water Cycle in River Basin, China Institute of Water Resources andHydropower Research, Beijing, 100038, China2Key Laboratory of Meteorological Disaster of Ministry of Education, Nanjing University of InformationScience & Technology, Nanjing, 210044, China
Correspondence: Jia Liu ([email protected])
Received: 27 November 2017 – Discussion started: 2 January 2018Revised: 29 April 2018 – Accepted: 24 July 2018 – Published: 16 August 2018
Abstract. Data assimilation is an effective tool in improv-ing high-resolution rainfall of the numerical weather predic-tion (NWP) systems which always fails in providing satis-factory rainfall products for hydrological use. The aim ofthis study is to explore the potential effects of assimilatingdifferent sources of observations, i.e., the Doppler weatherradar and the Global Telecommunication System (GTS) data,in improving the mesoscale NWP rainfall products. A 24 hsummer storm occurring over the Beijing–Tianjin–Hebei re-gion of northern China on 21 July 2012 is selected as acase study. The Weather Research and Forecasting (WRF)Model is used to obtain 3 km rainfall forecasts, and the ob-servations are assimilated using the three-dimensional varia-tional (3DVar) data assimilation method. Eleven data assim-ilation modes are designed for assimilating different com-binations of observations in the two nested domains of theWRF model. Both the rainfall accumulative amount and itsdistribution in space and time are examined for the forecast-ing results with and without data assimilation. The resultsshow that data assimilation can effectively help improve theWRF rainfall forecasts, which is of great importance for hy-drologic applications through the rainfall–runoff transforma-tion process. Both the radar reflectivity and the GTS data aregood choices for assimilation in improving the rainfall prod-ucts, whereas special attention should be paid to assimilatingradial velocity where unsatisfactory results are always found.The assimilation of the GTS data in the coarser domain haspositive effects on the radar data assimilation in the finer do-main, which can make the rainfall forecasts more accurate
than assimilating the radar data alone. It is also found thatthe assimilation of more observations cannot guarantee fur-ther improvement of the rainfall products, whereas the effec-tive information contained in the assimilated data is of moreimportance than the data quantity. Potential improvements ofdata assimilation in improving the NWP rainfall products arediscussed and suggestions are further made.
1 Introduction
Numerical weather prediction (NWP) systems play an im-portant role in the prediction of meteorological and hydro-logical processes, with the ability of providing relatively re-liable products for analyzing and forecasting weather events(Rodwell et al., 2010; Boussetta et al., 2013). Rainfall isnot only a crucial meteorological variable but is also a hy-drological element; therefore, it is always important to ob-tain accurate rainfall information for hydrological use. Un-fortunately, because of the uncertainties and complexities ofatmospheric processes, rainfall is among the most difficultvariables to accurately capture using NWP (Berenguer et al.,2012; Shrestha et al., 2013). The Weather Research and Fore-casting (WRF) Model is a latest-generation mesoscale NWPsystem that has been widely used for rainfall simulation andprediction (Efstathiou et al., 2013; Yang et al., 2015). Al-though rainfall products can be directly used due to the highaccuracy of rain or no-rain predictions, the WRF model still
Published by Copernicus Publications on behalf of the European Geosciences Union.

4330 J. Liu et al.: Evaluation of Doppler radar and GTS data assimilation for NWP rainfall prediction
cannot ensure accurate rainfall quantities or spatiotemporaldistributions at the catchment scale for hydrological predic-tion (Liu et al., 2012, 2013a).
Qie et al. (2014) simulated a storm event that featuredshort-term (12 h) heavy rainfall and frequent lightning activ-ity over northern China using the WRF model. The resultsshowed that the mean absolute error of the 6 h accumulatedrainfall was 39.8 mm for an observed rainfall range of 20–50 mm, whereas the mean absolute error reached 53.3 mm foran observed rainfall range of 11–20 mm. Hamill (2014) usedan ensemble prediction system to analyze the performanceof the WRF model in northern Colorado. Although ensembleprediction could avoid the complications induced by uncer-tainties, the accumulated rainfall also had a large bias com-pared with the observations. Kryza et al. (2013) found thatthe WRF model always underestimated the 24 h accumu-lated rainfall in Poland, and the rainfall coverage area greatlychanged based on different physical parameterizations. Efs-tathiou et al. (2013) indicated that the WRF model could notcapture the maximum rainfall intensity in either time or spaceat Chalkidiki, Greece. Gascón et al. (2016) used the WRFmodel to simulate an exceptionally heavy convective rainfallon 3 July 2006 in Calabria, Italy. The simulation results wereunsatisfactory, and the total rainfall was significantly under-estimated.
Data assimilation has been shown to be an efficient way inimproving the quality of the WRF rainfall products (Liu etal., 2013b). The WRF model provides a three-dimensionalvariational (3DVar) data assimilation system, i.e., WRF-3DVar (Barker et al., 2004), that works in tandem with theWRF model in real time. The system can assimilate varioustypes of conventional and unconventional data, such as ob-servations from surface weather stations, buoys, ships, pilotballoons, radars and satellites (Routray et al., 2010). Manystudies have shown that WRF-3DVar works well with obser-vations from different sources. Routray et al. (2012) assim-ilated upper-air and surface data from the Global Telecom-munication System (GTS) using WRF-3DVar, and the re-sults showed that the location and amount of rainfall wascaptured better over the west coast of India when comparedwith the simulation without data assimilation. Wind obser-vations were also assimilated using WRF-3DVar as the mainobserved data for rainfall simulation in India, and the rainfallintensity and spatial distribution were considerably improved(Mohanty et al., 2012). To improve heavy rainfall forecastsover the Korean Peninsula, global positioning system (GPS)radio occultation (RO) data were used with WRF-3DVar (Haet al., 2014). Results indicated that the quantitative accuracyof the rainfall forecast was in better agreement with observa-tions, especially the maximum rainfall amount.
Compared with other observational data, Doppler radarcan obtain detailed rainfall information with spatial resolu-tions of a few kilometers and temporal resolutions of a fewminutes (Sugimoto et al., 2009). With high spatial and tem-poral resolutions, Doppler radar can reveal detailed structural
features of mesoscale storms and capture rapidly developingconvective weather systems (Pu et al., 2009; Maiello et al.,2014). Moreover, Doppler radar can provide real-time obser-vations that can be assimilated using WRF-3DVar and usedfor real-time rainfall forecasts (Liu et al., 2013b). Some stud-ies have also indicated that significant improvements couldbe obtained in rainfall simulations using data assimilation(Bauer et al., 2015), because radar data can provide more de-tailed information on the initial fields and improve the lateralboundary conditions of the WRF model (Sokol and Pešice,2009).
Doppler radar can provide two types of observations forassimilation, i.e., radar reflectivity and radial velocity. Bothhave been found to have positive impacts on NWP rain-fall simulations and forecasts, especially for heavy rainfallevents (Li et al., 2012). Based on the operating principle ofDoppler radar, reflectivity contains information on the num-ber of falling drops per unit volume, which depends on thehydrometeor number and size, whereas radial velocity is re-lated to vertical atmospheric motions (Maiello et al., 2014).This means that assimilating reflectivity impacts the thermo-dynamic and dynamic fields, whereas radial velocity assim-ilation only influences the dynamic fields (Xiao and Sun,2007; Abhilash et al., 2012). Li et al. (2012) indicated thatassimilating radial velocity every 30 min could improve theaccuracy of rainfall (caused by hurricane) intensity predic-tion. Sun et al. (2012) found that the pattern and location offorecasted rainfall were noticeably improved with radar re-flectivity assimilation. Pan et al. (2012) found that the WRFmodel can capture rainfall distributions in time and space bet-ter by assimilating both Doppler radar reflectivity and radialvelocity. Abhilash et al. (2012) went further and comparedthe assimilation effects of radar reflectivity and radial veloc-ity. Results showed that the assimilation of both radar reflec-tivity and radial velocity significantly improved most meteo-rological elements, including wind, moisture and rainfall.
However, it has been found that data assimilation is mainlyused for synoptic analyses of meteorological fields. The po-tential of data assimilation has not been fully studied for hy-drological purposes, which require a more rigorous evalua-tion of rainfall quantities and variations (Liu et al., 2015).Rainfall prediction is especially important for real-time floodforecasting in small-sized catchments which often have shortconcentration times and need predicted rainfall to extendthe flood forecast lead time (Liu and Han, 2013). There-fore, hydrologists are particularly concerned about the ac-curacy of the accumulative amount and the spatiotemporaldistribution of the predicted rainfall at the catchment scale.The spatiotemporal distribution of the predicted rainfall di-rectly impacts the forecasted discharge and the timing of theflood peak through rainfall–runoff transformation modeling.To what extent can the assimilation of Doppler radar obser-vations help improve rainfall predictions of particular stormevents at the catchment scale? Is it always the best choiceto simultaneously assimilate radar reflectivity and radial ve-
Hydrol. Earth Syst. Sci., 22, 4329–4348, 2018 www.hydrol-earth-syst-sci.net/22/4329/2018/

J. Liu et al.: Evaluation of Doppler radar and GTS data assimilation for NWP rainfall prediction 4331
locity? In general, Doppler radar is easily contaminated bynon-weather returns, such as second trips, sidelobe clutter,ground clutter and low signal-to-noise returns, which canaffect the quality of radar data and the assimilation effect(Zhang et al., 2012). Therefore, it may be of interest to exam-ine whether rainfall predictions can be improved by assimi-lating radar data with other observations, such as meteoro-logical elements from fixed and mobile stations.
A 24 h storm event that occurred in July of 2012 in theBeijing–Tianjin–Hebei region of northern China was se-lected for this study. The storm event has received wide atten-tion due to its high intensity and the significant losses causedby the corresponding flooding. The 24 h rainfall that accu-mulated in the small mountainous catchment of Zijingguanwith the drainage area of 1760 km2 was regenerated using theWRF model with different data assimilation scenarios. Ob-servations from an S-band Doppler weather radar that com-pletely covers the Zijingguan catchment were assimilatedwith the assistance of WRF-3DVar. Traditional meteorologi-cal data from the GTS were obtained from the National Cen-ter for Atmospheric Research (NCAR). Eleven different dataassimilation modes were designed for assimilating differentcombinations of the three types of data, i.e., radar reflectiv-ity, radial velocity and GTS observations, in the two nesteddomains of the WRF model. The improvements in the fore-casted rainfall from the 11 data assimilation scenarios wereevaluated from the perspectives of the accumulative process,the spatiotemporal distribution and the total amount. The per-formances of different data assimilation scenarios were com-pared, and the efficient way to assimilate Doppler radar ob-servations for rainfall prediction was further discussed.
2 The WRF model and 3DVar data assimilation
2.1 The WRF model setup
The WRF model (version 3.6) is a next-generation mete-orological model that includes a variety of physical op-tions and can be used over a wide range of scales, rang-ing from tens of meters to thousands of kilometers. Detaileddescriptions of the model were available in Skamaraock etal. (2008). Two nested domains were centered over the Zi-jingguan catchment, and two-way nesting was used for com-munication between the parent and child domains. To ob-tain high-resolution rainfall products and make the resultsapplicable for hydrological forecasting systems, the horizon-tal grid spacing of the WRF inner domain (Domain 2) was setto 3 km, and the downscaling ratio was set to 1 : 3, which wascommonly used and always performed well in the Beijing–Tianjin–Hebei region of northern China (Liu et al., 2012;Chambon et al., 2014; Tian et al., 2017b). The nested do-main sizes were 1260× 1260 and 450× 360 km2 for the Zi-jingguan catchment. The settings of the nested domains havebeen shown to be effective in previous studies in terms of
representing the large-scale topography and the main climatecharacteristics in the study area (Wang et al., 2013; Tian etal., 2017b). The two domains were comprised of 40 verti-cal pressure levels, with the top level set to 50 hPa (Doneet al., 2004; Aligo et al., 2009; Fierro et al., 2013; Qie etal., 2014). The model initial and lateral boundary conditionswere obtained from Global Forecast System (GFS) forecastdata, which were provided by NCEP with 1◦× 1◦ grids andwere widely used to forecast historical storm events (Routrayet al., 2010; Ha and Lee, 2012). The time step of the WRFmodel output was set to 1 h. Considering the use of down-scaling and the high resolution needed for meteorologicaland hydrological studies, the forecasted rainfall in the innerdomain was chosen for analysis.
Cumulus physics, microphysics and planetary boundarylayer (PBL) are important physical parameterization op-tions for rainfall simulations (Fernández-González et al.,2015). According to our previous investigations on the per-formances of the most important WRF physical parameter-izations affecting the rainfall processes in northern China(Tian et al., 2017a, c), the most appropriate set of parame-terizations for this extreme summer storm, including Kain–Fritsch (KF), WRF single-moment 6 (WSM6) and Mellor–Yamada–Janjic (MYJ), was adopted in this study when con-figuring the WRF model (Miao et al., 2011; Guo et al., 2014;Di et al., 2015).
2.2 3DVar data assimilation
The 3DVar data assimilation produces an optimal estimateof the atmospheric state through the iterative solution of aprescribed cost function (Ide et al., 1997):
J (x)=12
(x− xb
)TB−1
(x− xb
)+
12
(y− y0
)TR−1
(y− y0
)(1)
where x is the atmospheric and surface state vector, xb is thefirst guess or background, and y0 is the assimilated obser-vation. y is the observation space derived from the model.B and R are the background error covariance matrix and theobservation error covariance matrix, respectively.
The WRF-3DVar data assimilation system in the WRFmodel was used for assimilating the GTS and weather radardata in real time (Barker et al., 2004; Gao et al., 2004). Thebackground error covariance CV3 was used in this study. Thegreatest advantage of CV3 is its wide applicability (Mengand Zhang, 2008). The reason why CV3 is used also includesthe trial to simplify the data assimilation procedure which en-ables a more extensive application among hydrologists.
www.hydrol-earth-syst-sci.net/22/4329/2018/ Hydrol. Earth Syst. Sci., 22, 4329–4348, 2018

4332 J. Liu et al.: Evaluation of Doppler radar and GTS data assimilation for NWP rainfall prediction
Figure 1. The location of the Zijingguan catchment with (a) the 11 rain gauges and (b) the 3 km× 3 km grid cells.
2.3 The observation operators: radar reflectivity andradial velocity
In the WRF-3DVar system, the total water mixing ratio qtwas used as the moisture control variable instead of thepseudo-relative humidity when assimilating the radar reflec-tivity data (Dudhia, 1989). The water mixing ratio has a moredirect relation with the radar reflectivity, as described byEq. (2), which has been proven to be effective in WRF-3DVaras an observation operator to calculate the model-derivedradar reflectivity Z from the rainwater mixing ratio qr (Sunand Crook, 1997).
Z = 43.1+ 17.5log(ρqr) , (2)
where ρ is the density of air. By assuming a Marshall–Palmerraindrop size distribution and that the ice phases have no ef-fect on reflectivity, Eq. (2) can be derived.
For the assimilation of the radial velocity, the precondi-tioned wind control variables were also combined with therainwater mixing ratio qr. Equations (3)–(5) show how themodel-derived radial velocity Vr was calculated:
Vr = ux− xi
ri+ v
y− yi
ri+ (w− vt)
z− zi
ri, (3)
where u, v and w represent the three-dimensional wind field;x, y and z represent the location of the observation point; andxi , yi and zi represent the location of the radar station. ri isthe distance between the data point and the radar, and vt isthe hydrometer fall speed or terminal velocity.
According to Sun and Crook (1998), vt can be representedas follows:
vt = 5.40a(ρqr)0.125, (4)
a = (p0/p)0.4, (5)
where a is the correction factor, p is the base-state pressureand p0 is the pressure at the ground.
3 Study area and data
3.1 Study area and the storm event
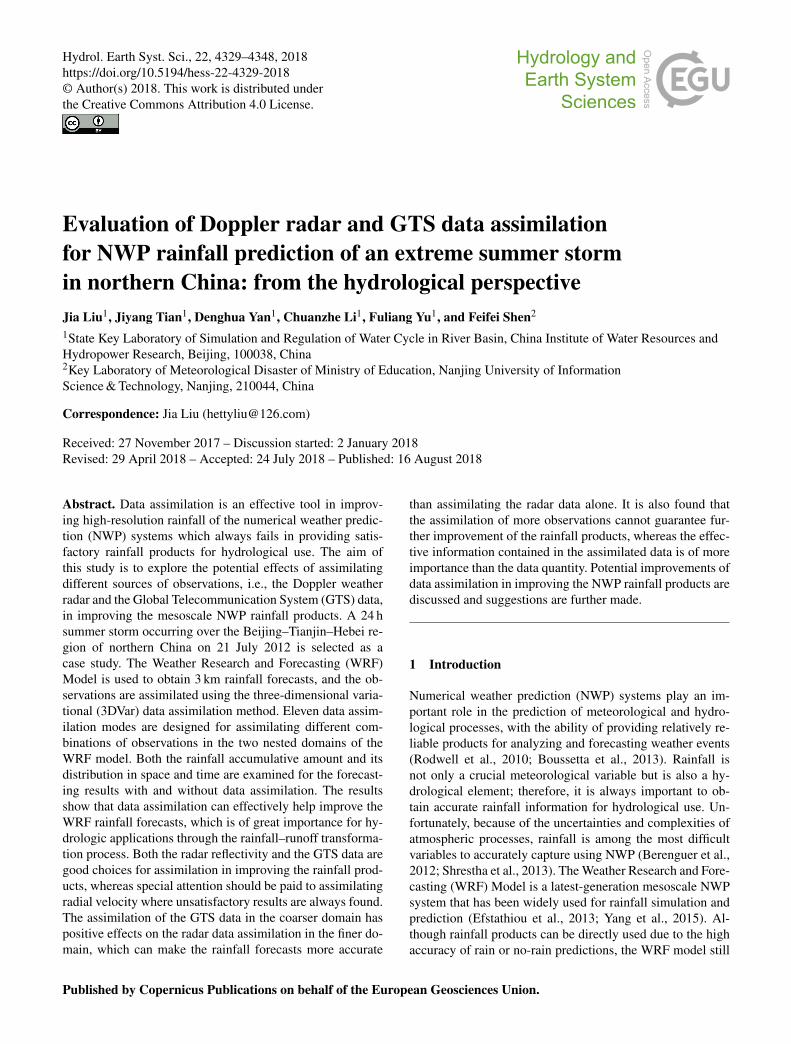
The Zijingguan catchment, which lies in the northern reachof the Daqing River basin, was chosen as the study area(Fig. 1). It is located at 39◦13′–39◦40′ north latitude and114◦28′–115◦11′ east longitude and has a drainage area of1760 km2. It is 54 km long from north to south and 61 kmwide from east to west. The Zijingguan catchment has atemperate continental monsoon climate. The average annualrainfall is approximately 600 mm, and the majority of rainfalls during the flood season from late May to early Septem-ber. The size and terrain together with the previous historyof extreme storms and floods make the Zijingguan catch-ment representative of the catchments in the semi-humid andsemi-arid area of northern China that require flood warnings.To avoid enormous losses caused by floods, accurate rainfallforecasts are very important.
A 24 h storm event that occurred over the Beijing–Tianjin–Hebei region on 21 July 2012 was chosen for this study. Be-
Hydrol. Earth Syst. Sci., 22, 4329–4348, 2018 www.hydrol-earth-syst-sci.net/22/4329/2018/

J. Liu et al.: Evaluation of Doppler radar and GTS data assimilation for NWP rainfall prediction 4333
Table 1. Descriptions of the GTS datasets assimilated in the study.
Dataset Descriptions Number ofobservations
SOUND Upper-level pressure, temperature, humidity, and wind report from a fixed or mobile land station, a sea 2718station, or a sonde released by carrier balloons or aircraft.
SYNOP Report of surface observation from a fixed or mobile land station. 4217PILOT Upper-wind report from a fixed or mobile land station or a sea station. 733AIREP Aircraft weather report. 201METAR Aerodrome routine or special meteorological report. 612
cause of the high-intensity rainfall, wide coverage and sig-nificant losses, the storm event has received widespread at-tention in China. Many studies have investigated the causesand the properties of the storm (Sang et al., 2013; Zhong etal., 2015). Before the extreme storm event took place, an en-counter between a northward-moving subtropical high vor-tex and an eastward-moving cold vortex in the mid–hightroposphere provided a stable atmospheric circulation overthe study area, which was conducive to heavy rain forma-tion. Abundant water vapor transported from a low-level jet,strong upward motion caused by the Taihang Mountains anda long duration of dense air humidity were the primary causesof the storm event. The extreme storm event contained twophases: (1) a strong convective rain that occurred in the warmsector ahead of the cold front and (2) a dominant frontalrain after the arrival of the cold front (Guo et al., 2015).Those showed the reasons why the parameterizations of KF,WSM6 and MYJ were chosen for WRF rainfall prediction.KF has strong ability in simulating the low-level jet and theupward transportation of vapor (Kain, 2004). WSM6 con-tains six water substance variables, which can realisticallyidentify rainfall formation (Kim et al., 2013). MYJ is moresuitable for the simulation of the convection system (Janjic,1994). The 24 h accumulated rainfall with 172 mm led to thehigh peak flow (2580 m3 s−1) in the Zijingguan catchment.The observed areal rainfall in the Zijingguan catchment canbe calculated using the Thiessen polygon method with therainfall data from the 11 rain gauges, which were chosen asthe ground truth to evaluate the WRF outputs. The forecastedareal rainfall was calculated by averaging values of the gridcells that have more than 50 % area located inside the Zijing-guan catchment. The 11 rain gauges with the Thiessen poly-gons and the model grid cells (3 km× 3 km) were shown inFig. 1.
3.2 GTS data
Surface weather station, ship, buoy, pilot balloon, sonde, air-craft and satellite observations from the GTS can be pro-cessed using the OBSPROC observation preprocessor be-fore being assimilated using WRF-3DVar. A shell script wascompiled to transform the decoded data to the suitable LIT-TLE_R format, which can be directly used by WRF-3DVar
Figure 2. Locations of the radar scan area, the GTS data, the studycatchments and the two nested domains.
for data assimilation. Wide coverage in horizontal directionand high levels in vertical direction are the main characteris-tic of the GTS data, although the spatial density of the obser-vations was low, and the time interval of the GTS data was6 h. Therefore, the GTS data are usually used to improvethe prediction of large-scale flows. In this study, five GTSdatasets, including SOUND, SYNOP, PILOT, AIREP andMETAR, were assimilated in the WRF model. The SOUNDand SYNOP data took the majority of the GTS data. De-tailed descriptions of the datasets were shown in Table 1.According to Fig. 2, the observations covered by the outerdomain were mostly located on land and only a few were onthe ocean. The data located on land were distributed evenly.
The quality control of the GTS data is implemented inWRF-3DVar by defining the observation error covariance.The default US Air Force Weather Agency (AFWA) OBSerror file is used in this study, which defines the instrumental
www.hydrol-earth-syst-sci.net/22/4329/2018/ Hydrol. Earth Syst. Sci., 22, 4329–4348, 2018

4334 J. Liu et al.: Evaluation of Doppler radar and GTS data assimilation for NWP rainfall prediction
Figure 3. Rainfall observations from the rain gauges and the weather radar: (a) hyetograph of the hourly catchment areal rainfall; (b) spatialdistribution of the 24 h rainfall accumulation from the rain gauges; (c) spatial distribution of the 24 h rainfall accumulation from the radar.
and sensor errors for various air, water and surface observa-tion types as well as satellite retrievals.
3.3 Weather radar data
An S-band Doppler weather radar is located in Shijiazhuang,the capital of Hebei province. It is approximately 100 kmfrom the Zijingguan catchment and covers a radius of250 km. The study area can be completely covered by theradar. The radar cycles include nine different scan elevationsevery 0.1 h over the course of a day. Figure 2 showed the rel-ative positions of the WRF domains and the radar scan area.To make the atmospheric motions more stable and reduce thenonlinearity in the outer domain, radar data were only assim-ilated in Domain 2 in this study.
The S-band radar belongs to the newest-generationweather radar network of China (CINRAD), the quality con-trol of which is supported by China Integrated Meteoro-logical Information Service System (CIMISS) of the ChinaMeteorological Administration. The potential error sources,such as ground clutter, radial interference echo, speckles andother artifacts, were removed through the quality control pro-cedure (Tong and Xue, 2005). The rainfall observations fromrain gauges and weather radar were also compared to checkthe quality of the radar data. The following Z–R relationshipwas used to convert the radar reflectivity into rainfall rates(Hunter, 1996):
Z = 300×R1.4, (6)
where Z is the radar reflectivity in mm6 m−3 and R is therainfall rate in mm h−1. Figure 3 showed the time seriesbars and the spatial distributions of the 24 h accumulatedrainfall. The accumulated areal rainfall was 160.48 mm ob-served from the weather radar and 172.17 mm from the raingauges. Although the accumulated rainfall was slightly un-derestimated by the weather radar, the spatial distribution ofthe accumulation was quite consistent with the rain gauges.The temporal variation of the catchment areal rainfall alsoshowed a consistent trend with the rain gauge observations.Therefore, the assimilation of the weather radar data is ex-pected to have positive effect in improving the WRF fore-casting results.
3.4 Mode configurations
To explore the effects of data assimilation using WRF-3DVarfor rainfall prediction in the study area, 11 modes were de-signed based on the different combinations of the availableGTS data, radar reflectivities and radial velocities in thetwo nested domains, as shown in Table 2. The improve-ments in the rainfall forecasts using data assimilation withthe 11 modes were examined in this study and are shown inTable 2. In addition to the different data assimilation com-binations, the 11 modes have the same settings of the WRFmodel and the WRF-3DVar. The purpose of the mode designwas to find the most effective way to assimilate the weatherradar and traditional meteorological data for improving theWRF rainfall forecasts.
Hydrol. Earth Syst. Sci., 22, 4329–4348, 2018 www.hydrol-earth-syst-sci.net/22/4329/2018/

J. Liu et al.: Evaluation of Doppler radar and GTS data assimilation for NWP rainfall prediction 4335
Table 2. Designed assimilation modes with different data combina-tions.
Modes Assimilated data
Domain 1 Domain 2
1 – radar reflectivity2 – radial velocity3 – radar reflectivity and radial velocity4 GTS data –5 GTS data GTS data6 GTS data radar reflectivity7 GTS data radial velocity8 GTS data radar reflectivity and radial velocity9 GTS data GTS data and radar reflectivity10 GTS data GTS data and radial velocity11 GTS data GTS data, radar reflectivity and radial velocity
3.5 Cycling the WRF-3DVar runs
WRF-3DVar needs to be run in the cycling mode to continu-ously assimilate real-time observations during storm events.According to the tests of different spin-up periods (6, 12 and24 h), which were commonly used in the WRF model (Gi-vati et al., 2012; Pan et al., 2017; Jr and Johnson, 2016), thespin-up periods had little influence on rainfall prediction ofthe extreme storm event in this study. Considering the calcu-lation efficiency, the 6 h spin-up period was chosen. Figure 4shows the start and end times of the storm event that occurredon 21 July 2012 and the time bars of the cycling WRF-3DVarruns. The storm event began at 03:00 LT on 21 July 2012and lasted for 24 h. Data assimilation began at 00:00 LT on21 July 2012 and ended at 00:00 LT on 22 July 2012, with atime interval of 6 h. Thus, the data assimilation took place onfour occasions (21 July 2012 00:00, 06:00, 12:00, 18:00 and00:00 LT). A 6 h spin-up period was executed by run 1 andthe first-guess files generated in run 1 were used for run 2. Astime progressed, runs 3–6 were initiated at the correspondingtimes with the first-guess files generated by the previous runs.In the six runs, only run 1 was the original WRF run withoutassimilating observations, which can be treated as a bench-mark to evaluate the improvements using data assimilation.
4 Results
4.1 Evaluation on the storm process improvements
Figure 5 showed the forecasted rainfall process of the stormevent on 21 July 2012 for the different data assimilationmodes. To show the influence of the six runs on the rainfallforecast, all of the WRF-3DVar runs were shown in Fig. 5.The total run time was 36 h, which was longer than the du-ration (24 h) of the storm event. In Fig. 5, the gray area indi-cated the duration of the storm event. The black solid lineindicated the ground truth of the catchment areal rainfall,which was calculated from the rain gauge observations using
18:00 00:00 06:00 12:00 18:00 00:00 06:00
2012/07/21/03:00
2012/07/22/03:00
Run 1
Run 2
Run 3
Run 4
Run 5
Run 6
Figure 4. The time bars of the cycling WRF-3DVar runs.
the Thiessen polygon method. The six runs were all shown bycombining the solid and dashed lines. The solid line segmentat the beginning of each run represented a new data assimi-lation run that generated the most recently updated forecasts.After 6 h, which marked the beginning of the next data as-similation run, the previous run was shown as a dashed line,indicating that the results were no longer the latest. For agiven run, the solid and dashed line segments were the samecolor. The purpose of the data assimilation is to improve theaccuracy of the rainfall forecast, and the presumed trends inthe cumulative rainfall from the cycling WRF-3DVar runsshould therefore increasingly approach the black solid line.In reality, different modes showed different data assimilationeffects, and some of them were distinctly different from thepresumed trends. Comparing the red and black hyetographs,the original forecast of the areal rainfall accumulation wassignificantly lower than the ground truth. This finding indi-cates that the WRF model was unable to forecast the stormevent accurately without data assimilation, and the forecasterrors may lead to poor runoff forecasts due to error accumu-lation and magnification during the rainfall–runoff transfor-mation process.
Comparing the first three subfigures of Fig. 5, a significantimprovement in the accumulated areal rainfall was found inMode 1 by assimilating the radar reflectivity in Domain 2.The results of modes 2 and 3 were unstable in the differentcycling WRF-3DVar runs, which was a result of the assimi-lation of the radar velocity data. For modes 2 and 3, the accu-mulated areal rainfall forecasts for the first 6 h of run 3 wereless than for Mode 1, and the assimilation results of run 4were also unsatisfactory. The forecasted rainfall for modes 2and 3 was even less than the original run (run 1), which indi-cated that the assimilation of radial velocity observations atthe time 06:00 and 12:00 LT on 21 July 2012 was unable tohelp trigger the main storm process.
For modes 4 and 5 shown in Fig. 5d and e, assimilatingthe GTS data improved the rainfall forecasts, and only as-similating the GTS data in Domain 1 (Mode 4) was a littlebetter than assimilating the GTS data in both nested domains(Mode 5). The accumulated areal rainfall forecast for Mode 4was only slightly better than that of Mode 1, while the rain-fall processes were very different. For Mode 1, the greatest
www.hydrol-earth-syst-sci.net/22/4329/2018/ Hydrol. Earth Syst. Sci., 22, 4329–4348, 2018

4336 J. Liu et al.: Evaluation of Doppler radar and GTS data assimilation for NWP rainfall prediction
0
30
60
90
120
150
180
18:00 00:00 06:00 12:00 18:00 00:00 06:00
Rai
nfal
l acc
umul
atio
n/m
m
Time
24 h event duration
Gauge
(a) Mode 1
Dom1:/Dom2:ref
0
30
60
90
120
150
180
Rai
nfal
l acc
umul
atio
n/m
m
24 h event duration
Gauge
Run 1
Run 2
Run 3
Run 4
Run 5
Run 6
(b) Mode 2
Dom1:/Dom2:vel
0
30
60
90
120
150
180
Rai
nfal
l acc
umul
atio
n/m
m
24 h event duration
Gauge
(c) Mode 3
Dom1:/Dom2:ref+vel
0
30
60
90
120
150
180
Rai
nfal
l acc
umul
atio
n/m
m
24 h event duration
Gauge
(d) Mode 4
Dom1:GTSDom2:/
0
30
60
90
120
150
180
Rai
nfal
l acc
umul
atio
n/m
m
24 h event duration
Gauge
(e) Mode 5
Dom1:GTSDom2:GTS
0
30
60
90
120
150
180
Rai
nfal
l acc
umul
atio
n/m
m
24 h event duration
Gauge
(f) Mode 6
Dom1:GTSDom2:ref
18:00 00:00 06:00 12:00 18:00 00:00 06:00Time
18:00 00:00 06:00 12:00 18:00 00:00 06:00Time
18:00 00:00 06:00 12:00 18:00 00:00 06:00Time
18:00 00:00 06:00 12:00 18:00 00:00 06:00Time
18:00 00:00 06:00 12:00 18:00 00:00 06:00Time
Run 1
Run 2
Run 3
Run 4
Run 5
Run 6
Run 1
Run 2
Run 3
Run 4
Run 5
Run 6
Run 1
Run 2
Run 3
Run 4
Run 5
Run 6
Run 1
Run 2
Run 3
Run 4
Run 5
Run 6
Run 1
Run 2
Run 3
Run 4
Run 5
Run 6
Figure 5.
rainfall amounts were obtained in run 3, whereas the rain-fall amounts of run 4 had the largest proportion for Mode 4.Different types of data assimilation can not only affect therainfall amounts but also the rainfall process.
In order to investigate the impacts of assimilating GTSdata on the radar data assimilation effects and the rainfallforecasts, Mode 6–8 (assimilating the GTS data in Domain 1
as well as the radar data in Domain 2) were compared withMode 1–3 (only assimilating the radar data in Domain 2). Forthe six modes, the rainfall processes were relatively similarfor run 1, run 2, run 5 and run 6, whereas the forecasts ofrun 3 and run 4 were very different. The accumulated rain-fall for run 3 in Mode 1 was slightly higher than in Mode 6,whereas the result was opposite for run 4. In comparison with
Hydrol. Earth Syst. Sci., 22, 4329–4348, 2018 www.hydrol-earth-syst-sci.net/22/4329/2018/

J. Liu et al.: Evaluation of Doppler radar and GTS data assimilation for NWP rainfall prediction 4337
0
30
60
90
120
150
180
Rai
nfa
ll a
ccu
mu
lati
on
/mm
24 h event duration
Gauge
(g) Mode 7
Dom1:GTS
Dom2:vel
0
30
60
90
120
150
180
Rai
nfa
ll a
ccu
mu
lati
on
/mm
24 h event duration
Gauge
(h) Mode 8
Dom1:GTS
Dom2:ref+vel
0
30
60
90
120
150
180
Rai
nfa
ll a
ccu
mu
lati
on
/mm
24 h event duration
Gauge
(i) Mode 9
Dom1:GTS
Dom2:GTS+ref
0
30
60
90
120
150
180R
ain
fall
acc
um
ula
tion
/mm
24 h event duration
Gauge
(j) Mode 10
Dom1:GTS
Dom2:GTS+vel
0
30
60
90
120
150
180
Rai
nfa
ll a
ccu
mu
lati
on
/mm
24 h event duration
Gauge
(k) Mode 11
Dom1:GTS
Dom2:GTS+ref+vel
18:00 00:00 06:00 12:00 18:00 00:00 06:00Time
18:00 00:00 06:00 12:00 18:00 00:00 06:00Time
18:00 00:00 06:00 12:00 18:00 00:00 06:00Time
Run 1
Run 2
Run 3
Run 4
Run 5
Run 6
Run 1
Run 2
Run 3
Run 4
Run 5
Run 6
Run 1
Run 2
Run 3
Run 4
Run 5
Run 6
Run 1
Run 2
Run 3
Run 4
Run 5
Run 6
Run 1
Run 2
Run 3
Run 4
Run 5
Run 6
Figure 5. Cumulative hyetographs for the 11 data assimilation modes.
www.hydrol-earth-syst-sci.net/22/4329/2018/ Hydrol. Earth Syst. Sci., 22, 4329–4348, 2018
4338 J. Liu et al.: Evaluation of Doppler radar and GTS data assimilation for NWP rainfall prediction
modes 2 and 3, modes 7 and 8 had larger accumulated rainfalltotals in run 3 and run 4, respectively. This finding indicatedthat the assimilation of the GTS data in Domain 1 could haveaffected the rainfall forecast when assimilating radar data inDomain 2, which resulted in further improved forecasts thatagreed better with the observed rainfall.
Modes 9–11 were designed to explore the influence of theassimilation of the GTS data in Domain 2 on modes 6–8.The accumulated rainfall for run 4 in Mode 9 was less thanin Mode 6, which indicated that assimilating the GTS data inDomain 2 at 21 July 2012 12:00 LT may have changed theatmospheric state and water vapor transport when the GTSdata were also assimilated in Domain 1 and the radar reflec-tivity data were assimilated in Domain 2 at the same time.Both run 3 and run 4 of Mode 10 had much less forecastedrainfall than Mode 7, and the rainfall forecast was the worstamong the 11 modes. This result showed that assimilating theGTS data in Domain 2 may have reduced the improvement inthe rainfall forecast when the GTS data were also assimilatedin Domain 1 and the radial velocity data were assimilated inDomain 2. Unlike modes 9 and 10, run 4 of Mode 11 pre-dicted more rainfall than the other modes and provided thelargest contribution to the 24 h accumulated areal rainfall.
It can be found in Fig. 5 that the predicted storms alwaysstart and end around 6 h earlier than the observations. In ad-dition to the errors in the boundary conditions, it is found thatthe assimilation of the water vapor information (contained inthe radar reflectivity and the GTS data) can make the rainin the initial fields form and fall to the earth more quickly(Georgakakos, 2000; Sun, 2005; Sun et al., 2016). Consid-ering the error is consistent, an error prediction model couldbe built in further studies, and the assimilation of the latentheat may also be helpful in correcting the starting and endingtime of the forecasted rainfall process (Stephan et al., 2010;Schraff et al., 2016).
4.2 Evaluation on the 24 h accumulated areal rainfall
To more quantitatively evaluate the 11 data assimilationmodes, the accumulated areal rainfall in the Zijingguancatchment was calculated for the 24 h duration of the stormevent on 21 July 2012. The rain gauge observations, WRFmodel forecasts, and relative errors between them wereshown in Table 3. For all 11 modes, the first 6 h of the runs(solid line segments in Fig. 5), which covered the duration ofthe storm, were used to calculate the 24 h accumulated arealrainfall.
The WRF model forecasts without data assimilation weretoo poor to be used for hydrological forecasting. The fore-casted rainfall accumulation was only 95.54 mm, which wasmuch lower than the rain gauge observations. Data assimila-tion was used to improve the rainfall forecasts, although theforecast results worsened in modes 2, 3 and 10, and all of therelative errors exceeded 50 %. Interestingly, all three modesassimilated radar velocity data. For the other eight modes, the
Table 3. Observed and forecasted 24 h accumulated areal rainfallfrom different data assimilation modes.
Modes Rain WRF Relativegauge model error(mm) (mm) (%)
No data assimilation 172.17 95.54 −44.511 172.17 118.92 −30.932 172.17 77.65 −54.903 172.17 79.76 −53.674 172.17 129.02 −25.065 172.17 111.71 −35.116 172.17 136.37 −20.797 172.17 132.89 −22.828 172.17 132.89 −22.819 172.17 124.74 −27.5510 172.17 71.04 −58.7411 172.17 165.68 −3.77
rainfall forecasts were improved at different levels. Mode 11performed the best because the forecast (165.68 mm) wasclosest to the rain gauge observation (172.17 mm), and therelative error was only −3.77 %. Although Mode 5 was im-proved by assimilating the GTS data in both nested domains,the effect was the least profound.
Comparing modes 1–4, which all assimilated the observa-tions in a single domain, the lower relative errors were foundin modes 1 (−30.93 %) and 4 (−25.06 %), whereas the high-est error was found in Mode 2 (−54.90 %). This finding in-dicated that assimilating radar reflectivity and GTS data canprovide good results, while assimilating radar velocity madethe rainfall forecast unsatisfactory. The observation errors inthe radial velocity may have been the main factor that ledto the poorest performance (Abhilash et al., 2012). Anotherreason is that assimilating radial velocity can only changethe dynamic field, which changes quickly for small-scale re-gions, and 6 h may have been too long for the assimilationtime interval (Lin et al., 2011).
Modes 6–8 were formed by assimilating the GTS datain Domain 1 based on modes 1–3. The results showed thatthe relative errors decreased significantly when the GTSdata were assimilated in Domain 1. The forecasted rainfallamounts for modes 6–8 were very similar, and the relativeerrors were all approximately −20 %. This finding indicatedthat assimilating the GTS data over a large area (Domain 1)had large positive effects on the rainfall forecast using theWRF model.
Compared with modes 6–8, modes 9–11 also assimilatedthe GTS data in Domain 2 at the same time. The dif-ference between the forecasted rainfall totals for modes 6and 9 was not significant, although Mode 9 performed worsethan Mode 6. However, the relative error for Mode 10 was−58.74 %, which was much higher than that of Mode 7.This finding indicated that assimilating the GTS data over
Hydrol. Earth Syst. Sci., 22, 4329–4348, 2018 www.hydrol-earth-syst-sci.net/22/4329/2018/

J. Liu et al.: Evaluation of Doppler radar and GTS data assimilation for NWP rainfall prediction 4339
Figure 6. Spatial distributions of the forecasted 24 h rainfall accumulations from different data assimilation modes.
a small area (Domain 2) may have increased the forecast er-ror, whereas the forecasted rainfall may not have been greatlyinfluenced when the radar reflectivity was assimilated in Do-main 2 at the same time.
4.3 Evaluation on the spatial and temporaldistributions of rainfall
In addition to the accumulative amount, the rainfall varia-tions in both space and time play a crucial role in the for-mation of the runoff process. Therefore, in the study thespatial and temporal distributions of the forecasted rainfallwere evaluated by the root mean square error (RMSE) andthe results were shown in Table 4. The rainfall accumula-tions at different rain gauges and the catchment average rain-fall at different time steps are respectively used to calculatethe RMSE indices in the spatial and the temporal dimen-sions. Detailed equations can be found in Tian et al. (2017a).The spatial and temporal distributions of the forecasted 24 hrainfall from the 11 data assimilation modes were shown inFigs. 6 and 7, respectively. It can be observed that for mostof the assimilation modes the spatial and temporal distribu-tions were improved in varying degrees after data assimila-tion. Mode 6 had the lowest RMSE (0.316) in the spatial di-
mension and Mode 7 showed the lowest RMSE (0.582) inthe temporal dimension.
When the radar data are solely assimilated with the radialvelocity being involved, modes 2 and 3 showed the worst dis-tribution results among the 11 modes, and no improvementwas found in both spatial and temporal dimensions. Mode 1performed much better than modes 2 and 3 for the spatialdistributions of the rainfall forecasts while the RMSEs ofthe temporal distributions for modes 1–3 did not have muchdifference. Modes 4 and 5 showed improvements to certainextents in both spatial and temporal distributions after dataassimilation.
For the temporal distributions of the rainfall forecasts, theRMSEs of modes 1–3 were above 0.90, while the RMSEs ofmodes 6–8 were much lower, between 0.58 and 0.71. Forthe spatial distributions, the RMSEs were above 0.80 formodes 2 and 3 but less than 0.40 for modes 7 and 8, andthe RMSE was also reduced from 0.456 for Mode 1 to 0.316for Mode 6. Compared with modes 1–3, the rainfall distribu-tions of modes 6–8 had significant improvements by addingthe GTS data assimilation in the outer domain, which also in-dicated that assimilating the GTS data over a large area canhelp the WRF model assimilate the radar data more effec-tively.
www.hydrol-earth-syst-sci.net/22/4329/2018/ Hydrol. Earth Syst. Sci., 22, 4329–4348, 2018

4340 J. Liu et al.: Evaluation of Doppler radar and GTS data assimilation for NWP rainfall prediction
0
10
20
30
40
0 6 12 18 24
Rai
nfal
l int
ensit
y (m
m h
)
Time (h)
ObservationNo data assimilationMode 1
0
10
20
30
40
0 6 12 18 24Time (h)
ObservationNo data assimilationMode 2
0
10
20
30
40
0 6 12 18 24Time (h)
ObservationNo data assimilationMode 3
0
10
20
30
40
0 6 12 18 24Time (h)
ObservationNo data assimilationMode 4
0
10
20
30
40
0 6 12 18 24Time (h)
ObservationNo data assimilationMode 5
0
10
20
30
40
0 6 12 18 24Time (h)
ObservationNo data assimilationMode 6
0
10
20
30
40
0 6 12 18 24Time (h)
ObservationNo data assimilationMode 7
0
10
20
30
40
0 6 12 18 24Time (h)
ObservationNo data assimilationMode 8
0
10
20
30
40
0 6 12 18 24Time (h)
ObservationNo data assimilationMode 9
0
10
20
30
40
0 6 12 18 24Time (h)
ObservationNo data assimilationMode 10
0
10
20
30
40
0 6 12 18 24Time (h)
ObservationNo data assimilationMode 11
-1R
ainf
all i
nten
sity
(mm
h
)-1
Rai
nfal
l int
ensit
y (m
m h
)
-1R
ainf
all i
nten
sity
(mm
h
)-1
Rai
nfal
l int
ensit
y (m
m h
)
-1
Rai
nfal
l int
ensit
y (m
m h
)
-1
Rai
nfal
l int
ensit
y (m
m h
)
-1
Rai
nfal
l int
ensit
y (m
m h
)
-1
Rai
nfal
l int
ensit
y (m
m h
)
-1
Rai
nfal
l int
ensit
y (m
m h
)
-1
Rai
nfal
l int
ensit
y (m
m h
)
-1
Figure 7. Hyetographs of the observed and forecasted rainfall from different data assimilation modes.
However, the rainfall distributions of modes 9–11 wereworse compared with modes 6–8, though Mode 9 performeda little better than Mode 6 in the temporal dimension andMode 11 was better than Mode 8 in the spatial dimension.Especially for Mode 10, the RMSEs for the spatial and tem-poral distributions of the rainfall forecasts were both higherthan Mode 7. The results indicated that assimilating the GTSdata in the inner domain may have a negative impact on theassimilation of the radar data regarding the distributions ofthe forecasted rainfall.
4.4 Influence of the number of assimilated observations
To further explore the assimilation techniques and the causesof the assimilation effects, the number of assimilated obser-vations for each of the 11 modes is shown in Table 5.
Mode 3 can be regarded as a combination of modes 1and 2. The number of assimilated observations in Mode 3was less than the sum of the number of assimilated obser-vations in modes 1 and 2 at each time. Therefore, there wasa conflict between the radar reflectivity and radial velocity,and some of the radar data were not assimilated in the WRFmodel when the two types of radar data were assimilated inthe same domain at the same time. However, Mode 3 per-formed worse than Mode 1, which indicated that assimilating
Hydrol. Earth Syst. Sci., 22, 4329–4348, 2018 www.hydrol-earth-syst-sci.net/22/4329/2018/

J. Liu et al.: Evaluation of Doppler radar and GTS data assimilation for NWP rainfall prediction 4341
Table 4. RMSEs for the spatial and temporal distributions of theforecasted rainfall from different data assimilation modes.
Modes Spatial Temporaldimension dimension
No data assimilation 0.456 0.9021 0.421 0.9142 0.834 0.9213 0.826 0.9344 0.337 0.6925 0.539 0.8876 0.316 0.7017 0.414 0.5828 0.359 0.6139 0.362 0.66710 0.833 1.23211 0.341 0.826
the radial velocity data in Domain 2 had a negative effect onthe forecasted rainfall.
Through a comparative analysis of modes 1 and 6, modes 2and 7, and modes 3 and 8, modes 6–8 assimilated fewer ob-servations than modes 1–3, although the assimilation effectswere improved. This finding indicated that the data assim-ilation approach in modes 6–8 was more rational. The as-similation of the GTS data in Domain 1 helped eliminate theunreasonable radar data assimilated in modes 1–3 and im-proved the radar data assimilation results.
The comparisons were also made between modes 6 and 9,modes 7 and 10, and modes 8 and 11. For modes 9–11, thenumber of assimilated observations in Domain 2 was greaterthan for modes 6–8, which meant that the GTS data wereassimilated by the WRF model in Domain 2. However, theassimilation results indicated that more assimilated data didnot mean better assimilation effects.
5 Discussion
Among the 11 data assimilation modes, assimilating radarvelocity always led to poorer results than the original rain-fall forecasts. It should be noted that the assimilation of theradar radial velocity cannot directly influence the physicalprocess of the rainfall formation, although the assimilationcan change the wind field and affect the water vapor trans-port. If the assimilated radar velocity cannot improve the at-mospheric circulation predictions, the water vapor field maynot be improved, which thus leads to unimproved rainfallforecasts (Pan et al., 2012; Dong and Xue, 2013). In real-ity, the accuracy of the radial velocity observations dependson the atmospheric refractive index, which is affected by theair density and the water vapor content (Montmerle and Fac-cani, 2010; Maiello et al., 2014). Unfortunately, both the airdensity and the water vapor content are quite variable, espe-cially on rainy days (Abdalla and Cavaleri, 2002). Therefore,
the spatial observation errors in the radial velocity retrievalsare unavoidable and might be the main factor that leads topoorer performance of the NWP model than that achievedwithout data assimilation (Abhilash et al., 2012). Due to theability of frequent adjustment for the atmospheric motions,decreasing the assimilation time interval may reduce the riskof over correction (Xiao et al., 2005). However, the added in-formation may involve more observation errors, which mayincrease the nonlinearity of the atmosphere and lead to a dif-ficult model convergence. The weather radar in this study hada temporal resolution of 0.1 h, whereas the assimilation timeinterval was 6 h; therefore, there is still room to increase thedata assimilation frequency, although there is a trade-off be-tween model performance and the operating efficiency.
On the contrary, the assimilation of the radar reflectivityalways had a positive effect on the forecasted rainfall, andthe model performance was relatively stable. The data as-similation modes which involved the radar reflectivity alwaysperformed better than the others. The main reason is that theradar reflectivity contain information directly related to theprecipitation hydrometeors. According to the Eq. (2), the as-similation of radar reflectivity is a correction to the humid-ity field in essence, which directly influences the formationprocess of the precipitation. Additionally, after strict qualitycontrol the radar reflectivity assimilated in this study showedconsistent trends with the gauge observations in both spa-tial and temporal distributions (as shown by Fig. 3), whichhelped result in more effective assimilation results than theradial velocity.
The assimilation of the GTS data played a subsidiary roleto the radar reflectivity in improving the rainfall forecasts. Acombination of the radar reflectivity together with the GTSdata always resulted in better results that assimilating theradar data alone. Although the spatial density of the GTS datais relatively low compared to the radar data, it contains ob-servations of various atmospheric states. As shown by Fig. 2,the GTS data located on land were distributed evenly, whichhelped improve the stability of the WRF model during dataassimilation (Carrassi et al., 2008). SOUND and SYNOPdatasets took the majority of the GTS data (Table 1), whichmeans that the observations from the surface-based stationsand the upper-air observatories have the most contributionsto the improvement of the rainfall prediction. Pressure, tem-perature, humidity and wind reports from the surface and up-per air are contained in SOUND and SYNOP datasets. Theassimilation of these meteorological elements can directlycorrect the initial and lateral boundary conditions through thewide horizontal coverage and vertical levels (Tu et al., 2017).Figure 8 compares the improvement of the initial conditionsof Domain 2 after data assimilation in modes 1 and 6. Theincrement distributions of wind, humidity and pressure whenthe radar reflectivity was solely assimilated in the inner do-main (Mode 1) were shown in Fig. 8a, whereas those whenassimilating the radar reflectivity in the inner domain as well
www.hydrol-earth-syst-sci.net/22/4329/2018/ Hydrol. Earth Syst. Sci., 22, 4329–4348, 2018

4342 J. Liu et al.: Evaluation of Doppler radar and GTS data assimilation for NWP rainfall prediction
Figure 8. The increment distributions of wind, humidity and pressure in Domain 2 at 850 hPa for (a) assimilating only radar reflectivity and(b) assimilating both radar reflectivity and GTS data.
as the GTS data in the outer domain (Mode 6) were shown inFig. 8b.
It can be seen that the changes of the wind increments weremore significant in Fig. 8b than Fig. 8a in the inner domainof the WRF model. Though the changes of the increment dis-tributions for humidity and pressure were not obvious for the
two data assimilation modes, the major differences gather to-ward the southeast of the domain area, which assisted in theoccurrence of the heavy rainfall in the downstream of thestudy catchment. This may to some extent explain why therainfall accumulations and the spatial and temporal distribu-tions can be improved from Mode 1 to Mode 6, by adding the
Hydrol. Earth Syst. Sci., 22, 4329–4348, 2018 www.hydrol-earth-syst-sci.net/22/4329/2018/

J. Liu et al.: Evaluation of Doppler radar and GTS data assimilation for NWP rainfall prediction 4343
Table 5. Total number of assimilated observations in the two WRF nested domains.
Modes Domain Number of assimilated observations
Time 1 Time 2 Time 3 Time 4 Time 521 July 21 July 21 July 21 July 22 July
00:00 LT 06:00 LT 12:00 LT 18:00 LT 00:00 LT
1 1 – – – – –2 16 158 19 233 26 032 11 821 6239
2 1 – – – – –2 75 014 107 901 57 095 60 993 23 508
3 1 – – – – –2 60 550 84 573 71 148 45 896 24 924
4 1 2625 1758 2445 930 7232 – – – – –
5 1 2625 1758 2445 930 7232 596 170 304 145 106
6 1 2625 1758 2447 931 7202 6156 2905 14795 3795 4232
7 1 2625 1760 2450 934 7212 54 394 14 954 40 227 52 914 20 984
8 1 2625 1760 2450 931 7242 60 550 17 806 72 966 39 142 23 912
9 1 2625 1759 2444 937 7232 6752 3095 31 711 42 108 20 194
10 1 2625 1758 2446 935 7192 54 990 64 247 78 253 53 209 24 628
11 1 2625 1760 2449 941 7252 61 146 17 823 74 014 41 592 24 293
GTS data in the outer domain. The involvement of the GTSdata in the outer domain helped improve the atmosphericstate at a relatively large scale, which induced a positive ef-fect on the rainfall forecasts in the inner domain with thetwo-way nesting mechanism. Therefore, in this study the as-similation of GTS data together with the radar data performsthe best among different assimilation modes.
In order to further verify the findings for assimilating dif-ferent sources of data, another two storm events with rela-tively moderate rainfall intensity (around 50 mm for 24 h ac-cumulation) were selected from an analogue catchment tobe tested with four simplified assimilation modes (Mode 1,3, 4 and 6). The analogue catchment locates in the south-ern reach of the Daqing River basin with a drainage area of2210 km2. Table 6 showed the details of the storm events andthe rainfall forecasting results from different data assimila-tion modes. The cumulative hyetographs of the forecastedareal rainfall were illustrated in Fig. 9. The results were inaccordance with the conclusions from the extreme event inthe Zijingguan catchment. Assimilating radar reflectivity to-
gether with radial velocity (Mode 3) cannot guarantee im-proved results compared to only assimilating radar reflectiv-ity (Mode 1). The GTS data alone can also generate as goodresults (Mode 4) as the radar reflectivity. When the radar re-flectivity is assimilated in the inner domain, the involvementof the GTS data in the outer domain (Mode 6) further helpedproduce better results.
Before the NCEP-driven data were used in this study,ECMWF was also tested for the data assimilation with thesame storm event. Although the rainfall forecasts showedsome differences based on the boundary conditions from thetwo centers, the improvement patterns from different data as-similation modes were quite similar. It should be noted thatthe initial and lateral boundary conditions do have some po-tential impact on the rainfall forecast results. More studiesshould be carried out to verify the effects of data assimila-tions using different driven data, such as CMA. The ultimategoal for the application of the numerical rainfall prediction isto make flow forecasts at the catchment outlet. Errors in theforecasted rainfall process and the accumulative amount can
www.hydrol-earth-syst-sci.net/22/4329/2018/ Hydrol. Earth Syst. Sci., 22, 4329–4348, 2018

4344 J. Liu et al.: Evaluation of Doppler radar and GTS data assimilation for NWP rainfall prediction
Table 6. The two storm events of the analogue catchment and the relative errors of the forecasted rainfall from different data assimilationmodes.
Event Duration Rain gauge WRF Assimilation results (%)
observation original Mode 1 Mode 3 Mode 4 Mode 6(mm) run (%)
a 29 July 2007 20:00 LT–30 July 2007 20:00 LT 63.38 −15.94 −11.45 −14.66 −9.35 −2.78b 30 July 2012 10:00 LT–31 July 2012 10:00 LT 50.48 −26.26 −9.69 −17.16 −6.01 −2.10
0
10
20
30
40
50
60
70
0 6 12 18 24
Rai
nfal
l acc
umul
atio
n/m
m
Time
Event (a)
GaugeWithout data assimilationDom2: refDom2: ref+velDom1: GTSDom1: GTS, Dom2: ref
0
10
20
30
40
50
60
0 6 12 18 24
Rai
nfal
l acc
umul
atio
n/m
mTime
Event (b)
GaugeWithout data assimilationDom2: refDom2: ref+velDom1: GTSDom1: GTS, Dom2: ref
Figure 9. Cumulative hyetographs of the two storm events in the analogue catchments with different data assimilation modes.
result in divergent flood peak time and peak stage of the flood(Shih et al., 2014). Therefore, data assimilation is an impor-tant tool in improving the forecasted rainfall as well as theflow. Yucel et al. (2015) assimilated conventional meteoro-logical observations to improve the rainfall prediction, mean-while the mean runoff error was reduced by 14.7 % with dataassimilation in the Black Sea Region. The peak dischargeerror was also reduced from 50 % to 14 % when the radardata were assimilated in a hydrometeorological model builtin the Dese river catchment (Rossa et al., 2010). In the fur-ther study, the coupled atmospheric–hydrological model withdata assimilation will be built and flood forecasts from thecoupling system will be examined to evaluate the effect ofdata assimilation on flood forecasting.
6 Conclusion
This study explored the effects of data assimilation usingWRF-3DVar for the improvement of rainfall forecasting inthe Beijing–Tianjin–Hebei region of northern China. Twonested domains were employed, and the GFS data were usedto drive the WRF model. A storm event that occurred overthe Beijing–Tianjin–Hebei region on 21 July 2012 was se-lected, considering the widespread attention it received inChina due to the high intensity, wide coverage of the rain-fall process and the significant losses caused by the followingflood. The rainfall accumulation during the storm in a moun-tainous catchment named Zijingguan with a drainage area of1760 km2 was set as the forecasting target. Three types ofobservations, i.e., GTS data, radar reflectivity and radial ve-
locity, were used to investigate the potential improvementson WRF rainfall forecasts through data assimilation. Elevendata assimilation modes were designed based on differentcombinations of the three types of observations in the twonested domains.
Contrastive analyses of the rainfall forecasts from the11 data assimilation modes were carried out from three as-pects: the rainfall evolution process, the accumulated amountand the number of the observations assimilated. Four mainconclusions can be drawn: (1) when the radar data wereassimilated alone, the assimilation of radar reflectivity per-formed better than radial velocity in improving the rainfallforecasts, and the assimilation of both of the two types ofthe radar data generated poorer results than only assimilat-ing the radar reflectivity; (2) assimilating the GTS data overa large area can help the WRF model assimilate the radardata effectively, and the involvement of the GTS data in theouter domain when radar data are assimilated in the innerdomain resulted in better forecasts than only assimilating theradar data; (3) assimilating more observations does not guar-antee further improvement – on the other hand, the effec-tive information contained in the assimilated data is of moreimportance than the data quantity. In this study, accordingto the results of 24 h accumulated areal rainfall prediction,spatiotemporal distributions of the predicted rainfall and thenumber of assimilated observations, the combination of radarreflectivity and GTS data resulted in the best improvementsof the rainfall forecasts. Considering the poor performance ofradial velocity in other assimilation modes and the reasonsexplained in the discussion, the radial velocity data should
Hydrol. Earth Syst. Sci., 22, 4329–4348, 2018 www.hydrol-earth-syst-sci.net/22/4329/2018/

J. Liu et al.: Evaluation of Doppler radar and GTS data assimilation for NWP rainfall prediction 4345
be carefully used with a very strict quality control process.Further research considering various geographical and mete-orological case studies should be carried out to further verifythe conclusions of this study.
Data availability. Data for observed rainfall are available uponrequest from the Information Center of the Ministry of WaterResources of China (http://www.hydroinfo.gov.cn/, last access:4 February 2017). Radar data are available via the China Me-teorological Administration (http://www.cma.gov.cn/, last access:6 May 2017). Other data are available on request from the US Na-tional Centers for Environmental Prediction (http://www.ncep.noaa.gov/, last access: 4 March 2017).
Author contributions. All the authors contributed to the conceptionand the development of this paper. JL and JT contributed to the cal-culations and the analyses. DY and FY assisted in the experimentdesign and the assimilation methods. CL and FS helped with thefigure production and the writing of the paper.
Competing interests. The authors declare that they have no conflictof interest.
Acknowledgements. This study was supported by the National KeyR & D Program (2016YFA0601503, 2017YFC1502405), the HebeiProvince Water Scientific Research Project (2015-16), the MajorScience and Technology Program for Water Pollution Control andTreatment (2018ZX07110001), and the IWHR Research and Devel-opment Support Program (WR0145B732017).
The authors especially appreciate the helpful comments andconstructive suggestions from the editor, Florian Pappenberger, andthe two reviewers, Yunqing Xuan and an anonymous reviewer.
Edited by: Florian PappenbergerReviewed by: Yunqing Xuan and one anonymous referee
References
Abdalla, S. and Cavaleri, L.: Effect of wind variability and variableair density on wave modelling, J. Geophys. Res., 107, 17-1–17-17, https://doi.org/10.1029/2000JC000639, 2002.
Abhilash, S., Sahai, A. K., Mohankumar, K., George, J. P., and Das,S.: Assimilation of doppler weather radar radial velocity and re-flectivity observations in WRF-3DVAR system for short-rangeforecasting of convective storms, Pure Appl. Geophys., 169,2047–2070, https://doi.org/10.1007/s00024-012-0462-z, 2012.
Aligo, E. A., Gallus, W. A., and Segal, M.: On the im-pact of WRF model vertical grid resolution on Midwestsummer rainfall forecasts, Weather Forecast., 24, 575–594,https://doi.org/10.1175/2008WAF2007101.1, 2009.
Barker, D. M., Huang, W., Guo, Y. R., Bourgeois, A., andXiao, Q. N.: A three-dimensional variational data assimi-lation system for MM5: implementation and initial results,
Mon. Weather Rev., 132, 897–914, https://doi.org/10.1175/1520-0493(2004)132<0897:ATVDAS>2.0.CO;2, 2004.
Bauer, H. S., Schwitalla, T., Wulfmeyer, V., Bakhshall, A., Ehret,U., Neuper, M., and Caumont, O.: Quantitative precipitation es-timation based on high-resolution numerical weather predictionand data assimilation with WRF – a performance test, Tellus A,67, 25047, https://doi.org/10.3402/tellusa.v67.25047, 2015.
Berenguer, M., Surcel, M., Zawadzki, I., Xue, M., and Kong, F.:The diurnal cycle of precipitation from continental radar mo-saics and numerical weather prediction models. Part II: Inter-comparison among numerical models and with nowcasting, Mon.Weather Rev., 140, 2689–2705, https://doi.org/10.1175/MWR-D-11-00181.1, 2012.
Boussetta, S., Balsamo, G., Beljaars, A., and Kral, T.: Im-pact of a satellite-derived Leaf Area Index monthlyclimatology in a global Numerical Weather Predic-tion model, Int. J. Remote Sens., 34, 3520–3542,https://doi.org/10.1080/01431161.2012.716543, 2013.
Carrassi, A., Ghil, M., Trevisan, A., and Uboldi, F.: Data assimi-lation as a nonlinear dynamical systems problem: stability andconvergence of the prediction-assimilation system, Chaos, 18,023112, https://doi.org/10.1063/1.2909862, 2008.
Chambon, P., Zhang, S. Q., Hou, A. Y., Zupanski, M., and Che-ung, S.: Assessing the impact of pre-GPM microwave precip-itation observations in the Goddard WRF ensemble data as-similation system, Q. J. Roy. Meteorol. Soc., 140, 1219–1235,https://doi.org/10.1002/qj.2215, 2014.
Di, Z., Duan, Q., Gong, W., Wang, C., Gan, Y., Quan, J., Li, J.,Miao, C., Ye, A., and Charles, T.: Assessing WRF model param-eter sensitivity: A case study with 5 day summer precipitationforecasting in the Greater Beijing Area, Geophys. Res. Lett., 42,579–587, https://doi.org/10.1002/2014GL061623, 2015.
Done, J., Davis, C. A., and Weisman, M.: The next generation ofNWP: explicit forecasts of convection using the weather researchand forecasting (WRF) model, Atmos. Sci. Lett., 5, 110–117,https://doi.org/10.1002/asl.72, 2004.
Dong, J. and Xue, M.: Assimilation of radial velocity and reflec-tivity data from coastal WSR-88D radars using an ensembleKalman filter for the analysis and forecast of landfalling hur-ricane Ike (2008), Q. J. Roy. Meteorol. Soc., 139, 467–487,https://doi.org/10.1002/qj.1970, 2013.
Dudhia, J.: Numerical study of convection ob-served during the winter monsoon experiment us-ing a mesoscale two-dimensional model, J. Atmos.Sci., 46, 3077–3107, https://doi.org/10.1175/1520-0469(1989)046<3077:NSOCOD>2.0.CO;2, 1989.
Efstathiou, G. A., Zoumakis, N. M., Melas, D., Lolis, C. J., and Kas-somenos, P.: Sensitivity of WRF to boundary layer parameteriza-tions in simulating a heavy rainfall event using different micro-physical schemes, Effect on large-scale processes, Atmos. Res.,132, 125–143, https://doi.org/10.1016/j.atmosres.2013.05.004,2013.
Fernández-González, S., Valero, F., Sánchez, J. L., Gascón, E.,López, L., García-Ortega, E., and Merino, A.: Numerical sim-ulations of snowfall events: Sensitivity analysis of physical pa-rameterizations, J. Geophys. Res.-Atmos., 120, 10130–10148,https://doi.org/10.1002/2015JD023793, 2015.
Fierro, A. O., Mansell, E. R., Macgorman, D. R., and Ziegler,C. L.: The implementation of an explicit charging and dis-
www.hydrol-earth-syst-sci.net/22/4329/2018/ Hydrol. Earth Syst. Sci., 22, 4329–4348, 2018
4346 J. Liu et al.: Evaluation of Doppler radar and GTS data assimilation for NWP rainfall prediction
charge lightning scheme within the WRF-ARW model: bench-mark simulations of a continental squall line, a tropical cy-clone, and a winter storm, Mon. Weather Rev., 141, 2390–2415,https://doi.org/10.1175/MWR-D-12-00278.1, 2013.
Gao, J. D., Xue, M., Brewster, K. A., and Droegemeier,K.: A three-dimensional variational data analysis methodwith recursive filter for Doppler radars, J. Atmos.Ocean. Tech., 21, 457–469, https://doi.org/10.1175/1520-0426(2004)021<0457:ATVDAM>2.0.CO;2, 2004.
Gascón, E., Laviola, S., Merino, A., and Miglietta, M.M.: Analysis of a localized flash-flood event over thecentral Mediterranean, Atmos. Res., 182, 256–268,https://doi.org/10.1016/j.atmosres.2016.08.007, 2016.
Georgakakos, K. P.: Covariance propagation and updating inthe context of real-time radar data assimilation by quantita-tive precipitation forecast models, J. Hydrol., 239, 115–129,https://doi.org/10.1016/S0022-1694(00)00355-3, 2000.
Givati, A., Lynn, B., Liu, Y., and Rimmer, A.: Using theWRF model in an operational streamflow forecast systemfor the Jordan River, J. Appl. Meteorol. Clim., 51, 285–299,https://doi.org/10.1175/JAMC-D-11-082.1, 2012.
Guo, C., Xiao, H., Yang, H., and Tang, Q.: Observation and mod-eling analyses of the macro-and microphysical characteristicsof a heavy rain storm in Beijing, Atmos. Res., 156, 125–141,https://doi.org/10.1016/j.atmosres.2015.01.007, 2015.
Guo, X., Fu, D., Guo, X., and Zhang, C.: A case studyof aerosol impacts on summer convective clouds and pre-cipitation over northern China, Atmos. Res., 142, 142–157,https://doi.org/10.1016/j.atmosres.2013.10.006, 2014.
Ha, J. H. and Lee, D. K.: Effect of length scale tuning of bachgrounderror in WRF-3DVar system on assimilation of high-resolutionsurface data for heavy rainfall simulation, Adv. Atmos. Sci., 29,1142–1158, https://doi.org/10.1007/s00376-012-1183-z, 2012.
Ha, J. H., Lim, G. H., and Choi, S. J.: Assimilation of GPS ra-dio occultation refractivity data with WRF 3DVAR and its im-pact on the prediction of a heavy rainfall event, J. Appl. Meteo-rol. Clim., 53, 1381–1398, https://doi.org/10.1175/JAMC-D-13-0224.1, 2014.
Hamill, T. M.: Performance of Operational model pre-cipitation forecast guidance during the 2013 Coloradofront-range floods, Mon. Weather Rev., 142, 2609–2618,https://doi.org/10.1175/MWR-D-14-00007.1, 2014.
Hunter, S. M.: WSR-88D radar rainfall estimation: Capabilities,limitations and potential improvements, Natl. Weather Dig., 20,26–38, 1996.
Ide, K., Courtier, P., Ghil, M., and Lorenc, A. C.: Unified Notationfor data assimilation: Operational, sequential and variational, J.Meteorol. Soc. Jpn., 75, 181–189, 1997.
Janjic, Z. I.: The step-mountain eta coordinate model:further developments of the convection, viscous sub-layer, and turbulence closure schemes, Mon. WeatherRev., 122, 927–945, https://doi.org/10.1175/1520-0493(1994)122<0927:TSMECM>2.0.CO;2, 1994.
Jr, J. H. R. and Johnson, R. H.: On the cumulus diurnal cycle overthe tropical warm pool, J. Adv. Model Earth Syst., 8, 669–690,https://doi.org/10.1002/2015MS000610, 2016.
Kain, J. S.: The Kain-Fritsch convective pa-rameterization: an update, J. Appl. Meteo-
rol., 43, 170–181, https://doi.org/10.1175/1520-0450(2004)043<0170:TKCPAU>2.0.CO;2, 2004.
Kim, J. H., Shin, D. B., and Kummerow, C.: Impacts of a prioridatabases using six WRF microphysics schemes on passive mi-crowave rainfall retrievals, J. Atmos. Ocean. Tech., 30, 2367–2381, https://doi.org/10.1175/JTECH-D-12-00261.1, 2013.
Kryza, M., Werner, M., Wałszek, K., and Dore, A. J.: Applicationand evaluation of the WRF model for high-resolution forecastingof rainfall – a case study of SW Poland, Meteorol. Z., 22, 595–601, https://doi.org/10.1127/0941-2948/2013/0444, 2013.
Li, Y., Wang, X., and Xue, M.: Assimilation of radar radial veloc-ity data with the WRF hybrid ensemble – 3DVAR system forthe prediction of Hurricane Ike (2008), Mon. Weather Rev., 140,3507–3524, https://doi.org/10.1175/MWR-D-12-00043.1, 2012.
Lin, H. H., Lin, P. L., Xiao, Q., and Kuo, Y. H.: Effectof Doppler radial velocity data assimilation on the simula-tion of a typhoon approaching Taiwan: A case study of Ty-phoon Aere (2004), Terr. Atmos. Ocean. Sci., 22, 325–345,https://doi.org/10.3319/TAO.2010.10.08.01(A), 2011.
Liu, J. and Han, D.: On selection of the optimal data time inter-val for real-time hydrological forecasting, Hydrol. Earth Syst.Sci., 17, 3639–3659, https://doi.org/10.5194/hess-17-3639-2013,2013.
Liu, J., Bray, M., and Han, D.: Sensitivity of the Weather Researchand Forecasting (WRF) model to downscaling ratios and stormtypes in rainfall simulation, Hydrol. Process., 26, 3012–3031,https://doi.org/10.1002/hyp.8247, 2012.
Liu, J., Bray, M., and Han, D.: A study on WRF radar data assimi-lation for hydrological rainfall precipitation, Hydrol. Earth Syst.Sci., 17, 3095–3110, https://doi.org/10.5194/hess-17-3095-2013,2013a.
Liu, J., Bray, M., and Han, D.: Exploring the effect of data assimi-lation by WRF-3DVar for numerical rainfall prediction with dif-ferent types of storm events, Hydrol. Process., 27, 3627–3640,https://doi.org/10.1002/hyp.9488, 2013b.
Liu, J., Wang, J., Pan, S., Tang, K., Li, C., and Han, D.: Areal-time flood forecasting system with dual updating of theNWP rainfall and the river flow, Nat. Hazards., 77, 1161–1182,https://doi.org/10.1007/s11069-015-1643-8, 2015.
Maiello, I., Ferretti, R., Gentile, S., Montopoli, M., Picciotti, E.,Marzano, F. S., and Faccani, C.: Impact of radar data assim-ilation for the simulation of a heavy rainfall case in centralItaly using WRF–3DVAR, Atmos. Meas. Tech., 7, 2919–2935,https://doi.org/10.5194/amt-7-2919-2014, 2014.
Meng, Z. and Zhang, F.: Tests of an ensemble Kalmanfilter for mesoscale and regional-scale data assimila-tion, Part IV: Comparison with 3DVAR in a month-long experiment, Mon. Weather Rev., 136, 3671–3682,https://doi.org/10.1175/2007MWR2106.1, 2008.
Miao, S., Chen, F., and Li, Q.: Impacts of urban processes and ur-banization on summer precipitation: A case study of heavy rain-fall in Beijing on 1 August 2006, J. Appl. Meteorol. Clim., 50,806–825, https://doi.org/10.1175/2007MWR2106.1, 2011.
Mohanty, U. C., Routray, A., Osuri, K. K., and Prasad, S. K.: Astudy on simulation of heavy rainfall events over Indian regionwith ARW-3DVAR modeling system, Pure Appl. Geophys., 169,381–399, https://doi.org/10.1007/s00024-011-0376-1, 2012.
Montmerle, T. and Faccani, C.: Mesoscale assimilation ofradial velocities from Doppler radars in a preopera-
Hydrol. Earth Syst. Sci., 22, 4329–4348, 2018 www.hydrol-earth-syst-sci.net/22/4329/2018/

J. Liu et al.: Evaluation of Doppler radar and GTS data assimilation for NWP rainfall prediction 4347
tional framework, Mon. Weather Rev., 137, 1939–1953,https://doi.org/10.1175/2008MWR2725.1, 2010.
Pan, X., Tian, X., Li, X., Xie, Z., Shao, A., and Lu, C.: AssimilatingDoppler radar radial velocity and reflectivity observations in theweather research and forecasting model by a proper orthogonal-decomposition-based ensemble, three-dimensional variationalassimilation method, J. Geophys. Res.-Atmos., 117, D17113,https://doi.org/10.1029/2012JD017684, 2012.
Pan, X., Li, X., Cheng, G., and Hong, Y.: Effects of 4D-Var data as-similation using remote sensing precipitation products in a WRFmodel over the complex terrain of an arid region river basin, Re-mote Sensing, 9, 963, https://doi.org/10.3390/rs9090963, 2017.
Pu, Z., Li, X., and Sun, J.: Impact of airborne Doppler radar dataassimilation on the numerical simulation of intensity changes ofHurricane Dennis near a landfall, J. Atmos. Sci., 66, 3351–3365,https://doi.org/10.1175/2009JAS3121.1, 2009.
Qie, X., Zhu, R., Yuan, T., Wu, X., Li, W., and Liu, D.: Applicationof total-lightning data assimilation in a mesoscale convective sys-tem based on the WRF model, Atmos. Res., 145–146, 255–266,https://doi.org/10.1016/j.atmosres.2014.04.012, 2014.
Rodwell, M. J., Richardson, D. S., Hewson, T. D., and Haiden, T.: Anew equitable score suitable for verifying precipitation in numer-ical weather prediction, Q. J. Roy. Meteorol. Soc., 136, 1344–1363, https://doi.org/10.1002/qj.65, 2010.
Rossa, A. M., Guerra, F. L. D., Borga, M., Zanon, F.,Settin, T., and Leuenberger, D.: Radar-driven high-resolution hydro-meteorological forecasts of the 26 Septem-ber 2007 Venice flash flood, J. Hydrol., 394, 230–244,https://doi.org/10.1016/j.jhydrol.2010.08.035, 2010.
Routray, A., Mohanty, U. C., Niyogi, D., Rizvi, S. R. H., and Osuri,K. K.: Simulation of heavy rainfall events over Indian monsoonregion using WRF-3DVAR data assimilation system, Meteorol.Atmos. Phys., 106, 107–125, https://doi.org/10.1007/s00703-009-0054-3, 2010.
Routray, A., Osuri, K. K., and Kulkarni, M. A.: A comparative studyon performance of analysis nudging and 3DVAR in simulationof a heavy rainfall event using WRF modeling system, Isrn. Me-teorol., 2012, 1191–1213, https://doi.org/10.5402/2012/523942,2012.
Sang, Y. F., Wang, Z., and Liu, C.: What factors are respon-sible for the Beijing storm, Nat. Hazards, 65, 2399–2400,https://doi.org/10.1007/s11069-012-0426-8, 2013.
Schraff, C., Reich, H., Rhodin, A., Schomburg, A., Stephan, K.,Perianez, A., and Potthast, R.: Kilometre-scale ensemble dataassimilation for the COSMO model (KENDA), Q. J. Roy. Me-teorol. Soc., 142, 1453–1472, https://doi.org/10.1002/qj.2748,2016.
Shih, D. S., Chen, C. H., and Yeh, G. T.: Improving ourunderstanding of flood forecasting using earlier hydro-meteorological intelligence, J. Hydrol., 512, 470–481,https://doi.org/10.1016/j.jhydrol.2014.02.059, 2014.
Shrestha, D. L., Robertson, D. E., Wang, Q. J., Pagano, T. C., andHapuarachchi, H. A. P.: Evaluation of numerical weather pre-diction model precipitation forecasts for short-term streamflowforecasting purpose, Hydrol. Earth. Syst. Sci., 17, 1913–1931,https://doi.org/10.5194/hess-17-1913-2013, 2013.
Skamaraock, W. C., Klemp, J. B., Dudhia, J., Gill, D. O., Barker,D. M., Duda, M. G., Huang, X. Y., Wang, W., and Powers, J. G.:A description of the advanced research WRF Version 3, NCAR
technical note, available at: http://www.ncar.ucar.edu, last ac-cess: 6 January 2008.
Sokol, Z. and Pešice, P.: Comparing nowcastings of three severeconvective events by statistical and NWP models, Atmos. Res.,93, 397–407, https://doi.org/10.1016/j.atmosres.2008.09.016,2009.
Stephan, K., Klink, S., and Schraff, C.: Assimilation of radar-derived rain rates into the convective-scale model COSMO-DE at DWD, Q. J. Roy. Meteorol. Soc., 134, 1315–1326,https://doi.org/10.1002/qj.269, 2010.
Sugimoto, S., Crook, N. A., Sun, J., Xiao, Q., and Barker,D. M.: An examination of WRF 3DVAR radar data assim-ilation on its capability in retrieving unobserved variablesand forecasting precipitation through observing system sim-ulation experiments, Mon. Weather Rev., 137, 4011–4029,https://doi.org/10.1175/2009MWR2839.1, 2009.
Sun, J.: Convective-scale assimilation of radar data: progressand challenges, Q. J. Roy. Meteorol. Soc., 131, 3439–3463,https://doi.org/10.1256/qj.05.149, 2005.
Sun, J. and Crook, N. A.: Dynamical and microphysical retrievalfrom Doppler radar observations using a cloud model and its ad-joint. Part I: Model development and simulated data experiments,J. Atmos. Sci., 54, 1642–1661, https://doi.org/10.1175/1520-0469(1997)054<1642:DAMRFD>2.0.CO;2, 1997.
Sun, J. and Crook, N. A.: Dynamical and microphysi-cal retrieval from Doppler radar observations using acloud model and its adjoint. Part II: Retrieval experi-ments of an observed Florida convective storm, J. At-mos. Sci., 55, 835–852, https://doi.org/10.1175/1520-0469(1998)055<0835:DAMRFD>2.0.CO;2, 1998.
Sun, J., Trier, S. B., Xiao, Q., Weisman, M. L., Wang, H.,Ying, Z., Xu, M., and Zhang, Y.: Sensitivity of 0-12-hwarm-season precipitation forecasts over the central UnitedStates to model initialization, Weather Forecast., 27, 832–855,https://doi.org/10.1175/WAF-D-11-00075.1, 2012.
Sun, J., Wang, H., Tong, W., Zhang, Y., Lin, C. Y., andXu, D.: Comparison of the impacts of momentum controlvariables on high-resolution variational data assimilation andprecipitation forecasting, Mon. Weather Rev., 144, 149–169,https://doi.org/10.1175/MWR-D-14-00205.1, 2016.
Tian, J., Liu, J., Wang, J., Li, C., Yu, F., and Chu, Z.: A spatio-temporal evaluation of the WRF physical parameterisationsfor numerical rainfall simulation in semi-humid and semi-aridcatchments of Northern China, Atmos. Res., 191, 141–155,https://doi.org/10.1016/j.atmosres.2017.03.012, 2017a.
Tian, J., Liu, J., Yan, D., Li, C., Chu, Z., and Yu, F.:An assimilation test of Doppler radar reflectivity and ra-dial velocity from different height layers in improvingthe WRF rainfall forecasts, Atmos. Res., 198, 132–144,https://doi.org/10.1016/j.atmosres.2017.08.004, 2017b.
Tian, J., Liu, J., Yan, D., Li, C., and Yu, F.: Numerical rainfall sim-ulation with different spatial and temporal evenness by using aWRF multiphysics ensemble, Nat. Hazards Earth Syst. Sci., 17,563–579, https://doi.org/10.5194/nhess-17-563-2017, 2017c.
Tong, M. and Xue, M.: Ensemble Kalman filter assimilationof Doppler radar data with a compressible nonhydrostaticmodel: OSS Experiments, Mon. Weather Rev., 133, 1789–1807,https://doi.org/10.1175/MWR2898.1, 2005.
www.hydrol-earth-syst-sci.net/22/4329/2018/ Hydrol. Earth Syst. Sci., 22, 4329–4348, 2018

4348 J. Liu et al.: Evaluation of Doppler radar and GTS data assimilation for NWP rainfall prediction
Tu, C. C., Chen, Y. L., Chen, S. Y., Kuo, Y. H., and Lin, P.L.: Impacts of including rain-evaporative cooling in the ini-tial conditions on the prediction of a coastal heavy rainfallevent during TiMREX, Mon. Weather Rev., 145, 253–277,https://doi.org/10.1175/MWR-D-16-0224.1, 2017.
Wang, H., Sun, J., Fan, S., and Huang, X.: Indirect assimilation ofradar reflectivity with WRF 3D-Var and its impact on predictionof four summertime convective events, J. Appl. Meteorol. Clim.,52, 889–902, https://doi.org/10.1175/JAMC-D-12-0120.1, 2013.
Xiao, Q. and Sun, J.: Multiple-radar data assimilation and short-range quantitative precipitation forecasting of a squall line ob-served during, IHOP_2002, Mon. Weather Rev., 135, 3381–3404, https://doi.org/10.1175/MWR3471.1, 2007.
Xiao, Q., Kuo, Y. H., Sun, J., Lee, W. C., Lim, E., Guo, Y. R., andBarker, D. M.: Assimilation of Doppler radar observations witha regional 3DVAR System: Impact of Doppler velocities on fore-casts of a heavy rainfall case, J. Appl. Meteorol., 44, 768–788,https://doi.org/10.1175/JAM2248.1, 2005.
Yang, B., Zhang, Y., Qian, Y., Huang, A., and Yan, H.: Cali-bration of a convective parameterization scheme in the WRFmodel and its impact on the simulation of East Asian sum-mer monsoon precipitation, Clim. Dynam., 44, 1661–1684,https://doi.org/10.1007/s00382-014-2118-4, 2015.
Yucel, I., Onen, A., Yilmaz, K. K., and Gochis, D. J.: Cal-ibration and evaluation of a flood forecasting system: Util-ity of numerical weather prediction model, data assimi-lation and satellite-based rainfall, J. Hydrol., 523, 49–66,https://doi.org/10.1016/j.jhydrol.2015.01.042, 2015.
Zhang, L., Pu, Z., Lee, W. C., and Zhao, Q.: The influenceof airborne Doppler radar data quality on numerical simula-tions of a tropical cyclone, Weather Forecast., 27, 231–239,https://doi.org/10.1175/WAF-D-11-00028.1, 2012.
Zhong, L., Mu, R., Zhang, D., Zhao, P., Zhang, Z., andWang, N.: An observational analysis of warm-sector rain-fall characteristics associated with the 21 July 2012 Beijingextreme rainfall event, J. Geophys. Res., 120, 3274–3291,https://doi.org/10.1002/2014JD022686, 2015.
Hydrol. Earth Syst. Sci., 22, 4329–4348, 2018 www.hydrol-earth-syst-sci.net/22/4329/2018/