Embed Size (px)
Citation preview
NDOT Research Report
Report No: RDT02-031
EVALUATION OF
CONCRETE MIXES FOR FILLING THE STEEL
ARCHES IN THE GALENA CREEK BRIDGE
June 2002
Prepared by Research Division Nevada Department of Transportation
1263 South Stewart Street Carson City, Nevada 89712
TECHNICAL REPORT DOCUMENTATION PAGE
TECHNICAL REPORT DOCUMENTATION PAGE 1. Report No. RDT 02-031
2. Government Accession No.
3. Recipient=s Catalog No.
4. Title and Subtitle
Evaluation of Concrete Mixes for Filling the Steel Arches in the Galena Creek Bridge
5. Report Date
June 2002
6. Performing Organization Code
7. Author(s)
Ambere Banghart, David H. Sanders, M. Saiid Saiidi
8. Performing Organization Report No.
CCEER-02-05
9. Performing Organization Name and Address
Department of Civil Engineering/258University of Nevada, RenoReno, Nevada 89557
10. Work Unit No.
11. Contract or Grant No. N/A
12. Sponsoring Agency Name and Address
Nevada Department of Transportation 1263 S. Stewart StreetCarson City, NV 89712
13. Type or Report and Period Covered2001 to 2002
14. Sponsoring Agency Code
15. Supplementary Notes
16. Abstract
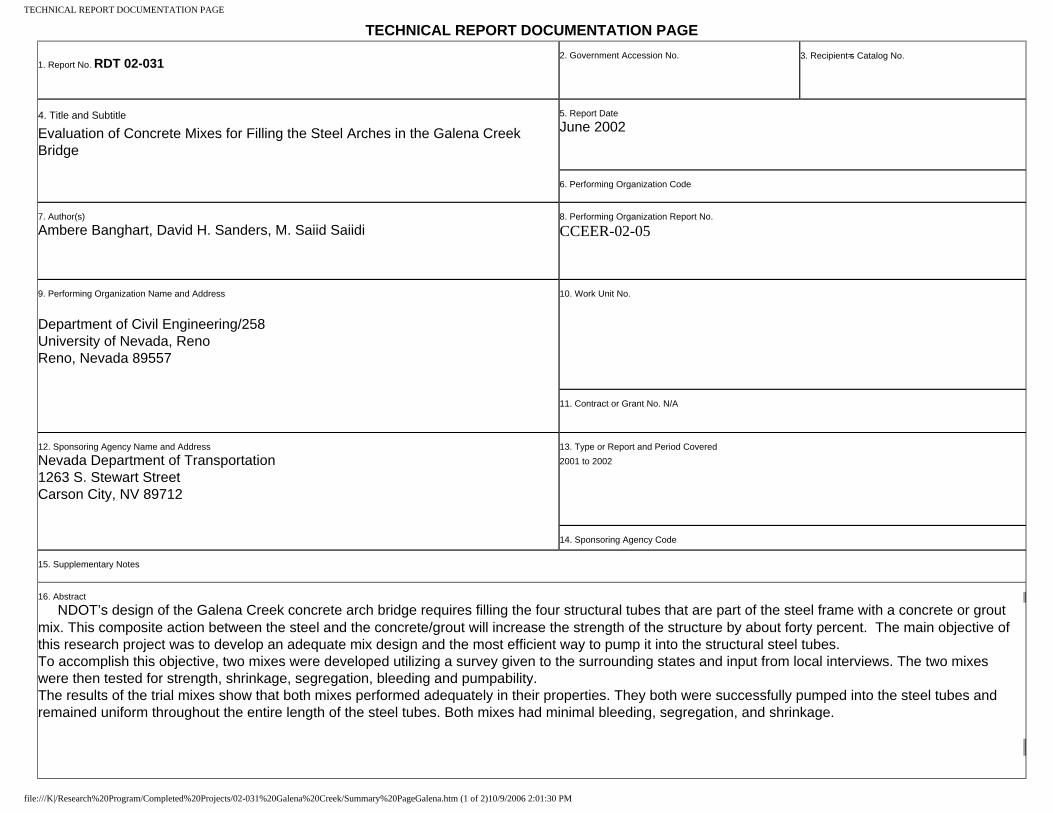
NDOT’s design of the Galena Creek concrete arch bridge requires filling the four structural tubes that are part of the steel frame with a concrete or grout mix. This composite action between the steel and the concrete/grout will increase the strength of the structure by about forty percent. The main objective of this research project was to develop an adequate mix design and the most efficient way to pump it into the structural steel tubes. To accomplish this objective, two mixes were developed utilizing a survey given to the surrounding states and input from local interviews. The two mixes were then tested for strength, shrinkage, segregation, bleeding and pumpability. The results of the trial mixes show that both mixes performed adequately in their properties. They both were successfully pumped into the steel tubes and remained uniform throughout the entire length of the steel tubes. Both mixes had minimal bleeding, segregation, and shrinkage.
file:///K|/Research%20Program/Completed%20Projects/02-031%20Galena%20Creek/Summary%20PageGalena.htm (1 of 2)10/9/2006 2:01:30 PM

TECHNICAL REPORT DOCUMENTATION PAGE
17. Key Words
Bridges, Grout, Arch Bridges, Hollow Steel Tubes
18. Distribution StatementUnrestricted. This document is available through the National Technical Information Service, Springfield, VA 21161
19. Security Classif. (of this report)
Unclassified20. Security Classif. (of this page)
Unclassified21. No. Of Pages
6922. Price
file:///K|/Research%20Program/Completed%20Projects/02-031%20Galena%20Creek/Summary%20PageGalena.htm (2 of 2)10/9/2006 2:01:30 PM

Evaluation of Concrete Mixes for Filling the Steel Arches in the Galena Creek Bridge
Report No. CCEER 02-05
Ambere Banghart David H. Sanders
M. Saiid Saiidi
A Report for the Nevada Department of Transportation
Carson City, Nevada
June 2002
Center for Earthquake Engineering Research Department of Civil Engineering/258 University of Nevada Reno, Nevada 89557

i
Abstract
NDOT’s design of the Galena Creek concrete arch bridge requires filling the four
structural tubes that are part of the steel frame with a concrete or grout mix. This composite
action between the steel and the concrete/grout will increase the strength of the structure by
about forty percent. The main objective of this research project was to develop an adequate mix
design and the most efficient way to pump it into the structural steel tubes.
To accomplish this objective, two mixes were developed utilizing a survey given to the
surrounding states and input from local interviews. The two mixes were then tested for strength,
shrinkage, segregation, bleeding and pumpability.
The results of the trial mixes show that both mixes performed adequately in their
properties. They both were successfully pumped into the steel tubes and remained uniform
throughout the entire length of the steel tubes. Both mixes had minimal bleeding, segregation,
and shrinkage.

ii
Table of Contents
Chapter 1 Introduction 1
1.1 Introduction………………………………………………………….……1
1.2 Objective…………………………………………………………….……1
1.3 Background…………………………………………………………...…..1
1.4 Scope……………………………………………………………………..2
Chapter 2 Experimental Program 4
2.1 Introduction……………………………………………………….……...4
2.2 Surveys…………………………………………………………….……..4
2.3 Interviews………………………………………………………...….…...5
2.4 Selection of Concrete/Grout Mix Design…………………………….…..6
2.5 Preliminary Testing…………………………………………………..…..7
2.5.1 Bleeding and Pumpability……………………………………...7
2.5.2 Compressive Strength Test (ASTM C 39)………………….….8
2.5.3 Length Change Test (ASTM C 157)…………………………...8
2.5.4 Bleeding of Concrete Test (ASTM C232)…………………......9
2.6 Field Test—Full-Scale Structural Tubes………………………………...9
2.6.1 80-foot Structural Tubes…………………………………….…9
2.6.2 60-inch Structural Tubes……….……………………………..10
2.6.3 Compression Strength Test (ASTM C 39).…………………...10
2.6.4 Length Change Test (ASTM C 157)………..………………...11
2.6.5 Slump Flow Test……………………………………………...11
iii
Chapter 3 Experimental Results 12
3.1 Introduction……………………………………………………………..12
3.2 Compressive Strength…………………………………………………..12
3.3 Bleeding………………………………………………………………...13
3.4 Compressive Strength for the Grout Pumped into the PVC Pipes……..14
3.5 Shrinkage……………………………………………………………….15
3.6 Slump Flow…………………………………………………………….16
3.7 80-Foot Structural Tube………………………………………………..16
3.8 60-Inch Structural Tube………………………………………………..17
Chapter 4 Summary, Conclusions, and Recommendations 19
4.1 Summary……………………………………………………………….19
4.2 Conclusions…………………………………………………………….20
4.3 Recommendations……………………………………………………...21
References 23
Tables 24
Figures 31
Appendix 52
iv
List of Tables
Chapter 2
Table 2-1: #8 Stone, 5000 psi, Non-Air Entrained 3/8” Concrete/Grout 24 Table 2-2: #8 Stone, 5000 psi, Non-Air Entrained 3/8” Concrete/Grout 24 Chapter 3 Table 3-1: Compressive Strength (psi) at 7, 14, 28, and 56-Days 25 From Preliminary Testing Table 3-2: Compressive Strength Test Data for 7-Day Curing 25
From Preliminary Testing Table 3-3: Compressive Strength Test Data for 14-Day Curing 25
From Preliminary Testing Table 3-4: Compressive Strength Test Data for 28-Day Curing 26 From Preliminary Testing
Table 3-5: Compressive Strength Test Data for 56-Day Curing 26 From Preliminary Testing Table 3-6: Compressive Strength (psi) at 7, 14, 25, and 28-Days 26
From Field-Testing Table 3-7: Compressive Strength Test Data for 7-Day Curing 27 From Field-Testing Table 3-8: Compressive Strength Test Data for 14-Day Curing 27 From Field-Testing Table 3-9: Compressive Strength Test Data for 25-Day Curing 27 From Field-Testing Table 3-10: Compressive Strength Test Data for 28-Day Curing 28
From the Field-Testing Table 3-11: Compressive Strength for Cylinders From 10-ft PVC Tubes 28
Table 3-12: Federal Highway Administration Performance Grades 28
Table 3-13: Preliminary Testing Length Changes 29 Table 3-14: Field-Testing Length Changes 29
Table 3-15: Length Change Data from the Preliminary Testing 30
Table 3-16: Length Change Data from the Field-Testing 30 Table 3-17: Slump Flow Data 30

v
List of Figures
Chapter 1
Figure 1-1: Cross-Section of Steel Arch’s Structural Tubes at the Four 31 Corners
Chapter 2
Figure 2-1: Pedestrian Bridge Supported by Steel Tube Filled with 31 Concrete Figure 2-2: 10-ft x 6-in Diameter PVC Pipe Apparatuses 32
Figure 2-3: Cross-Section of Cut Cylinder from PVC Pipe Specimens 32
Figure 2-4: 12-in x 6-in Diameter Cylinder Grout Specimens 33
Figure 2-5: 12-in x 6-in Diameter Cylinder Being Tested in Compression 33
Figure 2-6: 3-in x 3-in x 11.25-in Prism Molds for the Length Change Test 34
Figure 2-7: Length Comparator with Shrinkage Specimen 34
Figure 2-8: Specimens Curing in Moisture Room 35
Figure 2-9: Specimens Air Curing 35
Figure 2-10: Metal Bucket and Cover for Bleed Water Test 36
Figure 2-11: Trailer Line Pump 36
Figure 2-12: Structural Tubes Resting on Ground and Frame Support 37
Figure 2-13: Frame System to Support Structural Tubes, Section A-A 37
Figure 2-14: Frame System Attached to Wall, Section B-B 38 Figure 2-15: Actual Steel Frame Mounted on Wall 38 Figure 2-16: Pump attached at the bottom of the tube and pumping the grout 39
Mix up Figure 2-17: The 80-ft Structural Steel Tubes Prior to Being Pumped Full 39 With the Grout Mixes
Figure 2-18: The cuts in the 80-ft Structural Tube 40
Figure 2-19: 4 x 4 x 1/8 Structural Tube Designed for the Vertical Testing 40 Machine

vi
Figure 2-20: Specimen in the Vertical Testing Machine 41
Figure 2-21: Slump Flow Test 41
Chapter 3
Figure 3-1: Compression Strength Comparison for the Preliminary 42 Testing Figure 3-2: Compression Strength Comparison for the Field-Testing 42 Figure 3-3: Cross-section of Steel Tube with the Grout Mix Design 43 Containing 8-sack of Cement, Section III Figure 3-4: Cross-section of Steel Tube with the Grout Mix Design 43
Containing 8-sack of Cement, Section IV Figure 3-5: Cross-section of Steel Tube with the Grout Mix Design 44
Containing 8-sack of Cement, Section V Figure 3-6: Cross-section of Steel Tube with the Grout Mix Design 44 Containing 8.5-sack of Cement, Section III Figure 3-7: Cross-section of Steel Tube with the Grout Mix Design 45 Containing 8.5-sack of Cement, Section IV Figure 3-8: Cross-section of Steel Tube with the Grout Mix Design 45 Containing 8.5-sack of Cement, Section V Figure 3-9: The Structural Steel Tubes Starting to Get Cut 46
Figure 3-10: The Structural Steel Tubes Being Cut with the Larger Blade 46 Figure 3-11: The Structural Steel Tubes cut in 15-Foot Segments 47
Figure 3-12: 60-inch Tubes Curing After Ends Burned Off and Filled 47
Figure 3-13: Test One-Axial Force vs. Strain 48
Figure 3-14: Test Two-Axial Force vs. Strain 48
Figure 3-15: Comparison of the Stress vs. Strain Curve 49
Figure 3-16: First Test Local Buckling at Bottom 49
Figure 3-17: First Test Local Buckling Close-Up 50
Figure 3-18: Second Test Local Buckling at Bottom 50
Figure 3-19: Second Test Local Buckling All Four Sides 51
Figure 3-20: Concrete Exposed at the Location of Buckling 51

1
Chapter 1
Introduction
1.1 Introduction
This report covers the investigation of the concrete/grout mix that will be used for the four
corner 16-inch x 16-inch x ½-inch structural steel tubes that are part of each arch span of the
Galena Creek Bridge. Filling the tubes with a concrete or grout will increase the strength of the
frame by about forty percent. Basic guidelines were given for this fill material. The fill material
must have at least a 5000 psi (pounds per square inch) compression capacity. The material must
be pumpable and the maximum aggregate should not exceed 3/8”. The maximum angle of
inclination for the tubes is thirty-five degrees.
1.2 Objective
The objective of this project was to develop and test concrete/grout options for the filling of
the structural tubes that are part of the NDOT alternative for the Galena Creek concrete arch
bridge. The arch provides several challenges including the distance that the concrete/grout will
need to travel, the method needed to pump the mix into the tubes, and the need for the
concrete/grout to fill the entire tube.
1.3 Background
In the NDOT alternative for the concrete arch, a steel tube arch is constructed initially. Once
the arch is constructed over Galena Creek, the hollow structural tubes of the arch, see cross-
section of the arch frame Figure 1-1, will be filled with either a concrete or a grout mix to create

2
composite action. After filling the tubes, concrete will be placed around the truss in order to
form the concrete arch. The tubes will act as part of the primary reinforcement for the arch.
The structure as a whole will consist of two arch spans with sixty-two feet decks. The arch
will span a length of 689-feet with the largest vertical clearance approximately 302-feet. The
vertical distance of the arch itself is approximately 130-feet. It is necessary to pump the
concrete/grout under pressure to be sure that all parts of the tube are filled. The arch will be
constructed in 80-foot segments. The filling of the tubes could be done in segments, multiple
segments or by filling half of the arch at a time. If each segment is done individually, access
becomes an issue for the higher segments in the arch, since the concrete/grout must be delivered
to each segment. NDOT has indicated a need for a 5000-psi compressive strength mix that is
low to non-shrinkage.
1.4 Scope
The scope of this project was to develop and test several mix designs. A survey was
conducted to provide a starting point for this project. The survey asked members of the
surrounding state transportation departments about their experience and exposure to pumping
concrete into tubes and their opinions concerning the tubes of the arch bridge. Interviews of
Reno suppliers and contractors were also conducted. Based on the surveys and interviews, two
mix designs were developed and tested for pumpability, bleeding, compressive strength,
shrinkage and segregation.
Two sets of tests were conducted. The preliminary tests for each mix design consisted of:
two 10-foot x 6-inch pipe systems to test for bleed water and later for compression strength, a
cylindrical container to test for bleed water, cylinders molded to test for compression strength,
3
and rectangular prisms molded to test for shrinkage. The field tests for each mix design
consisted of: an 80-foot structural steel tube placed at an eighteen degree angle and filled with
the mix design to test for pumpability and uniformity, a 5-foot tube filled with the mix design to
test for axial strength, cylinders molded to test for compression strength, and rectangular prisms
molded to test for shrinkage.
Chapter 2 of this report provides information on the selecting of the mix designs tested
for this project. Chapter 2 also contains descriptions of the test methods used to determine the
performance of the mix designs selected. Chapter 3 gives the results of the tests performed as
well as some discussion of those results. Chapter 4 provides specific conclusions and
recommendations on the mix designs based on the test results.
4
Experimental Program
2.1 Introduction
It is essential that an adequate mix design be found to fill the structural tubes of the
arched bridge. In order for the composite action to occur, the tubes have to be completely filled
with concrete and the shrinkage has to be minimal. The mix design developed will have to be
pumpable, have to keep its uniformity (no segregation), have little or no shrinkage, and meet the
5000-psi stress requirement.
2.2 Surveys
To develop a mix design and procedure for pumping the mix into the tubes of the arch
bridge a survey was sent to the transportation departments and Federal Highway Administration
headquarters in Alaska, Arizona, California, Colorado, Idaho, Montana, New Mexico, Oregon,
Utah, and Washington. The survey included a cover letter, short description of the project, a
questionnaire, and pictures of the simulated bridge and cross-section of the frame with the steel
tubes at the four corners, see Appendix A-1.
Thirty-two surveys were sent out. The survey provided questions on pumping experience
in general and pumping through horizontal, vertical and inclined tubes. It also asked about
experience with pumpable mixes and suggestions for the mix design needed and how to place it
in the tubes. Nine surveys were returned expressing that they had no useful information. Seven
surveys were returned with responses to the questions. The responding surveys came from the
Departments of Transportation in Alaska, Arizona, Colorado, New Mexico, Oregon and
Washington. The information received is summarized in Appendix A-2. Two specific responses
are provided in the following paragraphs.

5
Ted Barber of New Mexico’s Department of Transportation suggested a grout mix with
high cement content and a superplasticizer to increase flowability. He suggested that the mix be
pumped from the bottom up through the tube to prevent segregation.
Michael McMulley of Colorado’s Department of Transportation sent some information
on a smaller scale but similar project (7). In this project a composite pedestrian bridge was
constructed using steel tubing 14 inches in diameter and approximately ½-inch thick. The arch is
about 11.5-feet tall with a span of about 92-feet, see Figure 2-1. The arch is composed of four
segments separated by transverse walls. Each segment had an opening at the lowest point
designed to hook up to a pumping facility and a hole at the top for deairing. High strength
concrete was pumped into the tube segments until it came out of the deairing openings then both
ends were closed off. The mix used in the pedestrian bridge project was composed of a fine
aggregate gradation, i.e. a grout mix. This arch was successfully constructed by pumping the
tube in sections from the bottom up and using a grout mix.
2.3 Interviews
Nine concrete distributors and concrete pumping companies locally were interviewed, see
Appendix A-3. Information gathered from these interviews presented mixed views on the
pumping procedure needed to fill the structural tubes. Pumping from the top down would
require vibrating the mix to ensure consolidation. Since vibrating the mix is not an option due to
inability of access, pumping from the bottom up to prevent air voids and segregation provides for
the better option.
Mark Baker of Reno Sparks Ready Mix created two specific mix designs to try. They were
composed of fine aggregates, and a low water/cement ratio. They included fly ash for

6
workability, superplasticizer for workability and prevention of segregation, and a shrinkage
reducer.
CB Concrete company and American Ready-Mix also provided some mix designs from
prior jobs. These mixes were not designed specifically for this project and they did not meet all
desired criteria. The mix designs provided by CB Concrete were all composed of aggregate
greater than 3/8” and did not include a shrinkage-compensating admixture. The mix designs
provided by American Ready-Mix were designed for a 4000 psi compressive strength and did
not include a shrinkage-compensating admixture.
2.4 Selection of Concrete/Grout Mix Design
Based on the surveys and interviews, the mix designs developed for testing are a type of
grout mix (composed of fine aggregates) and tests were conducted by pumping the mix through
the tubes from the bottom up to prevent air voids and segregation.
Of the three concrete mixing companies that provided mix designs, the two mixes designed
by Mark Baker of Reno Sparks Ready-Mix were chosen as the best candidates for testing. These
mixes were specifically designed to meet the criteria specified. Both mix designs contained a
high cement content and low water/cement ratio to provide the required strength of 5000 psi.
The maximum aggregate for both mixes was a #8 stone; this was well below the required 3/8-
inch maximum aggregate. Fly ash and a superplasticizer were included to provide workability,
pumpability, and uniformity (non-segregating). A shrinkage reducer was added to both mix
designs to minimize the shrinkage.
The two mix designs are similar, but have the following variations. Mix design one,
which will be referred to as the 8-sack mix, has 639 pounds per cubic yard (pcy) of cement, 113
7
pcy of fly ash, a water cement ratio of .34, and an aggregate ratio of 50/50 (#8 aggregate/sand),
see Table 2-1. The second mix design, which will be referred to as the 8.5-sack mix, has 679
pcy of cement, 120 pcy of fly ash, a water cement ratio of .35, and an aggregate ratio of 40/60
(#8 aggregate/sand), see Table 2-2. Both mix designs contained the same admixtures.
2.5 Preliminary Testing
The mix design that will fill the tubes of the arch bridge will need to meet specific
standards. The mixes were tested for the strength requirement of 5000 psi, minimal shrinkage,
minimal bleeding, no indication of segregation, and the ability for the mix to be pumped
successfully up the tubes. Two different bleed water tests, a compressive strength test, and a
shrinkage test were performed.
2.5.1 Bleeding and Pumpability
Two vertical 10-foot PVC pipe systems with a 6-in diameter were constructed for each
mix design, see Figure 2-2. The systems allowed for the grout to be pumped through the tubes
from the bottom. The purpose of this test was to check the amount of bleed water and quality of
the grout after pumping. After the curing process, 1-foot segments were cut from top, middle,
and bottom of each tube. The PVC pipe was then removed. The specimens were given a visual
inspection for uniformity, see Figure 2-3, and then are subjected to a compression strength test
conforming to ASTM C39 Standard Test Method for Compressive Strength of Cylindrical
Concrete Specimens (6).
8
2.5.2 Compressive Strength Test for Cylindrical Concrete Specimens (ASTM C 39)
The purpose of this test was to determine the compressive strength of the grout
specimens. This test was performed at 7-days, 14-days, 28-days, and 56-days after the casting of
each mix design. For this test, cylindrical concrete specimens with a 6-in diameter and 12-in
length were molded, see Figure 2-4, and moist cured for the designated time periods. Neoprene
pads were placed at the ends of the specimens and then a testing machine was used to apply an
axial load until failure, see Figure 2-5. The maximum load attained was recorded and divided by
the cross-sectional area to obtain the compression strength (1).
2.5.3 Length Change Test of Hardened Hydraulic-Cement Concrete (ASTM C 157)
The purpose of this test was to determine the length change or shrinkage of the grout
mixes due to factors other than externally applied forces and temperature changes. The grout
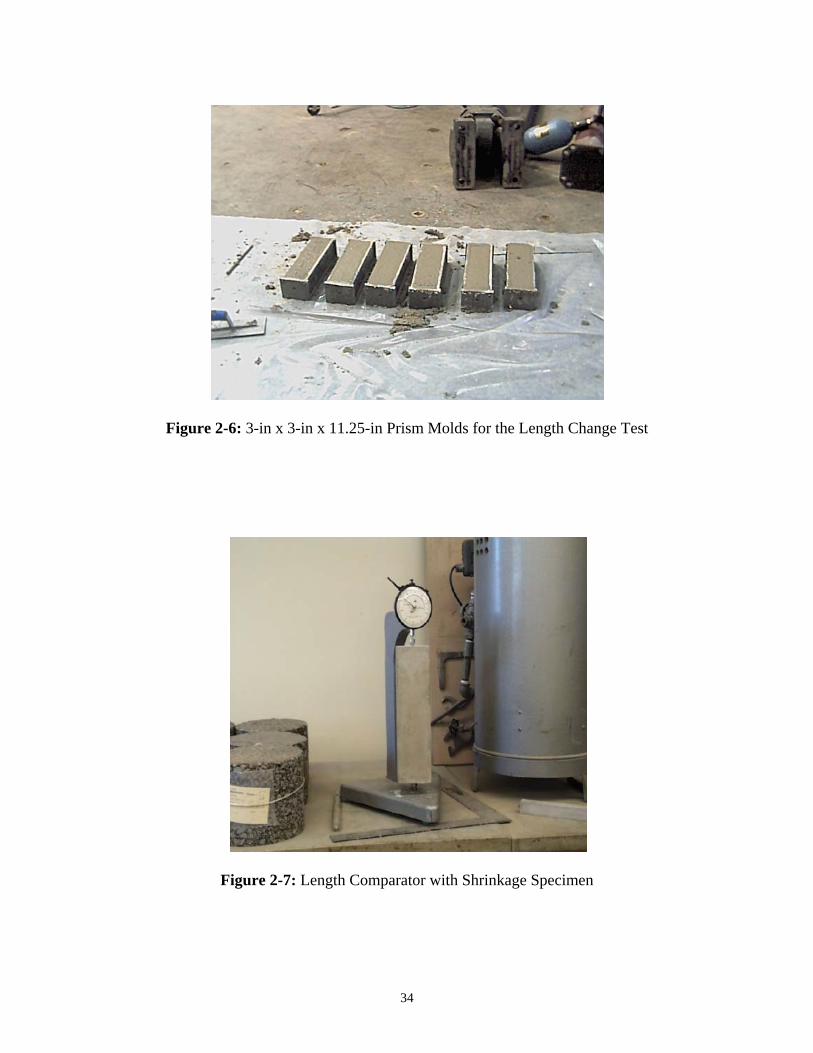
mixes were placed in prisms that were 3-in x 3-in x 11.25-in with metal gage studs at the center
of each end, see Figure 2-6. After a day, the molds were removed and an initial reading was
taken using the length comparator, see Figure 2-7 (5). The prisms were placed into two different
curing atmospheres to compare the difference in the shrinkage rates. Half of the specimens of
each mix were moist cured, see Figure 2-8, and the other half were air cured, see Figure 2-9.
Readings were taken at 7, 14, and 28 days, and 8 and 16 weeks. The length comparator readings
at each test age were compared to the initial length comparator reading to calculate the shrinkage
of the concrete, which was measured in microstrains (3).
9
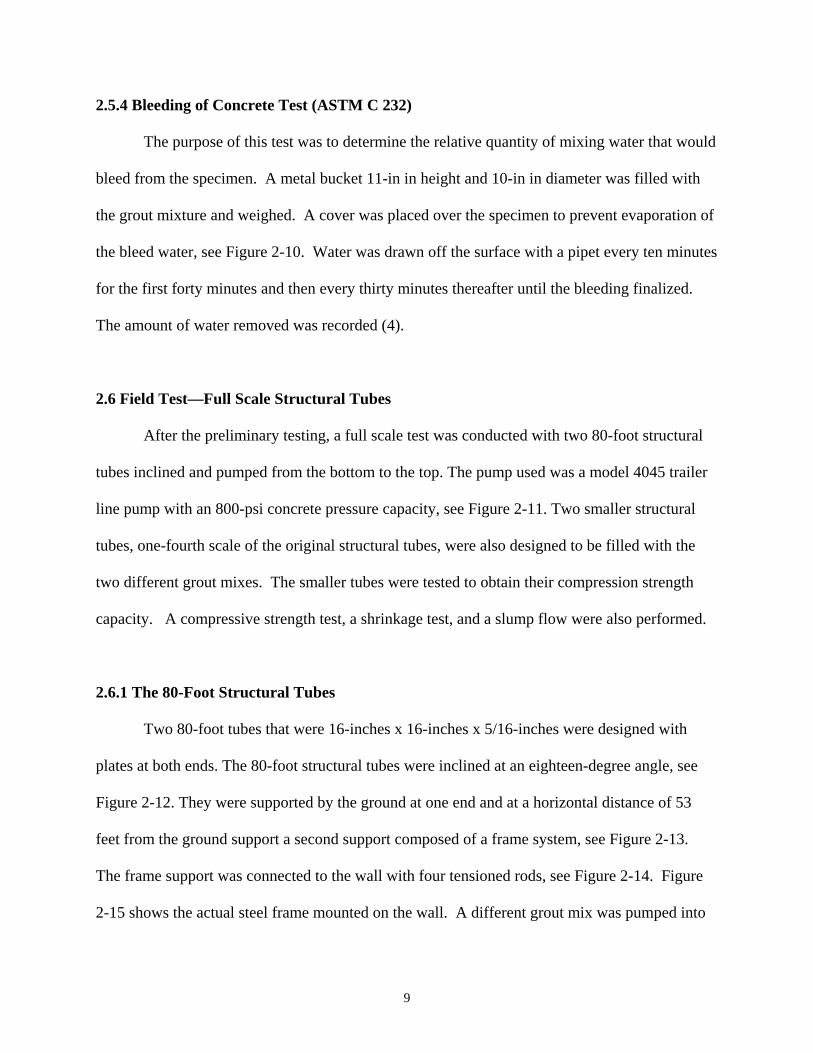
2.5.4 Bleeding of Concrete Test (ASTM C 232)
The purpose of this test was to determine the relative quantity of mixing water that would
bleed from the specimen. A metal bucket 11-in in height and 10-in in diameter was filled with
the grout mixture and weighed. A cover was placed over the specimen to prevent evaporation of
the bleed water, see Figure 2-10. Water was drawn off the surface with a pipet every ten minutes
for the first forty minutes and then every thirty minutes thereafter until the bleeding finalized.
The amount of water removed was recorded (4).
2.6 Field Test—Full Scale Structural Tubes
After the preliminary testing, a full scale test was conducted with two 80-foot structural
tubes inclined and pumped from the bottom to the top. The pump used was a model 4045 trailer
line pump with an 800-psi concrete pressure capacity, see Figure 2-11. Two smaller structural
tubes, one-fourth scale of the original structural tubes, were also designed to be filled with the
two different grout mixes. The smaller tubes were tested to obtain their compression strength
capacity. A compressive strength test, a shrinkage test, and a slump flow were also performed.
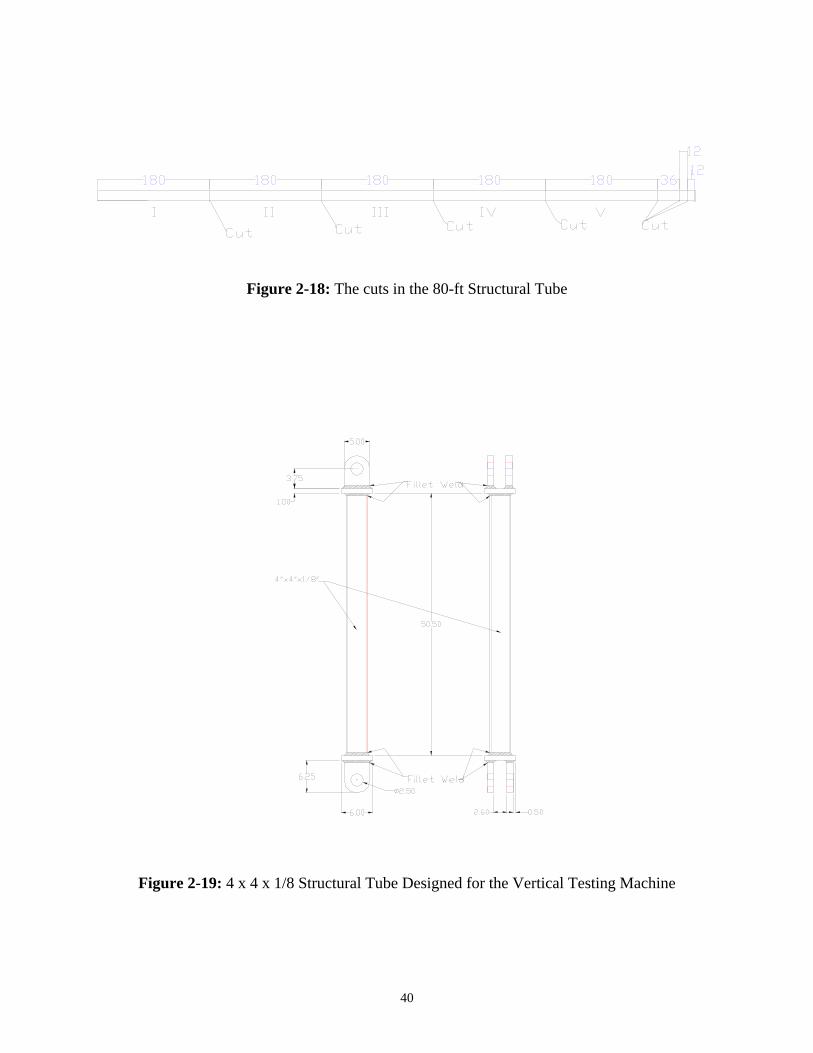
2.6.1 The 80-Foot Structural Tubes
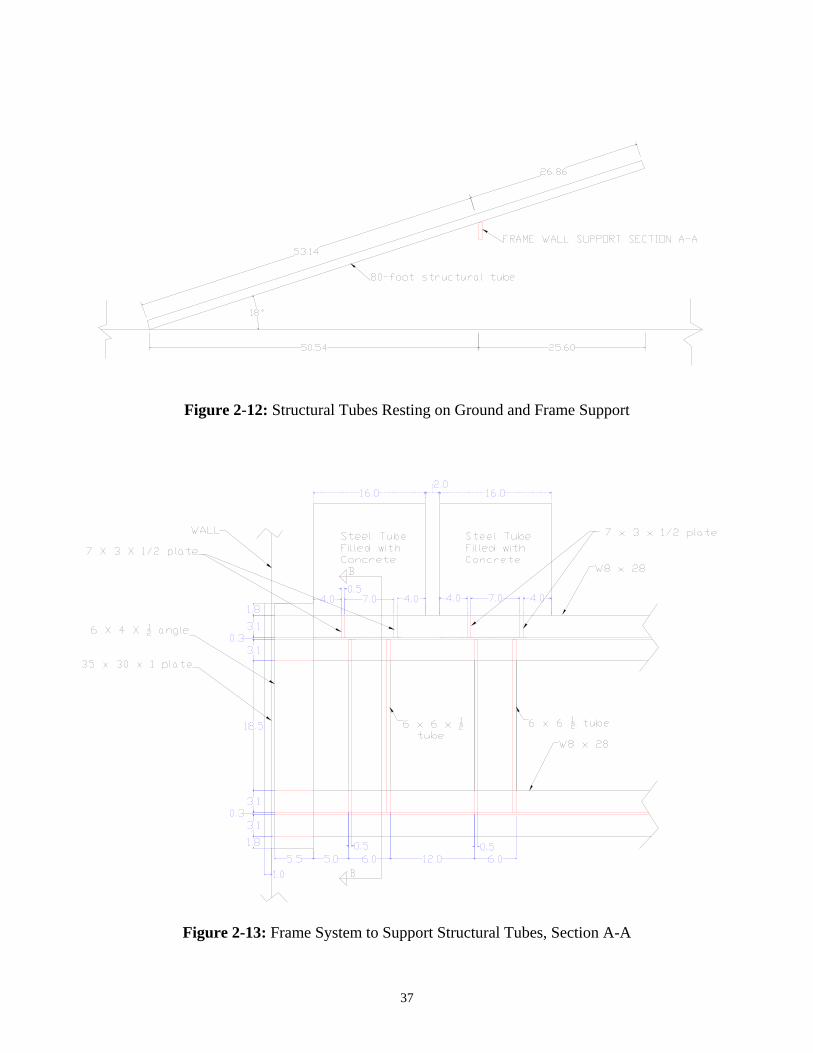
Two 80-foot tubes that were 16-inches x 16-inches x 5/16-inches were designed with
plates at both ends. The 80-foot structural tubes were inclined at an eighteen-degree angle, see
Figure 2-12. They were supported by the ground at one end and at a horizontal distance of 53
feet from the ground support a second support composed of a frame system, see Figure 2-13.
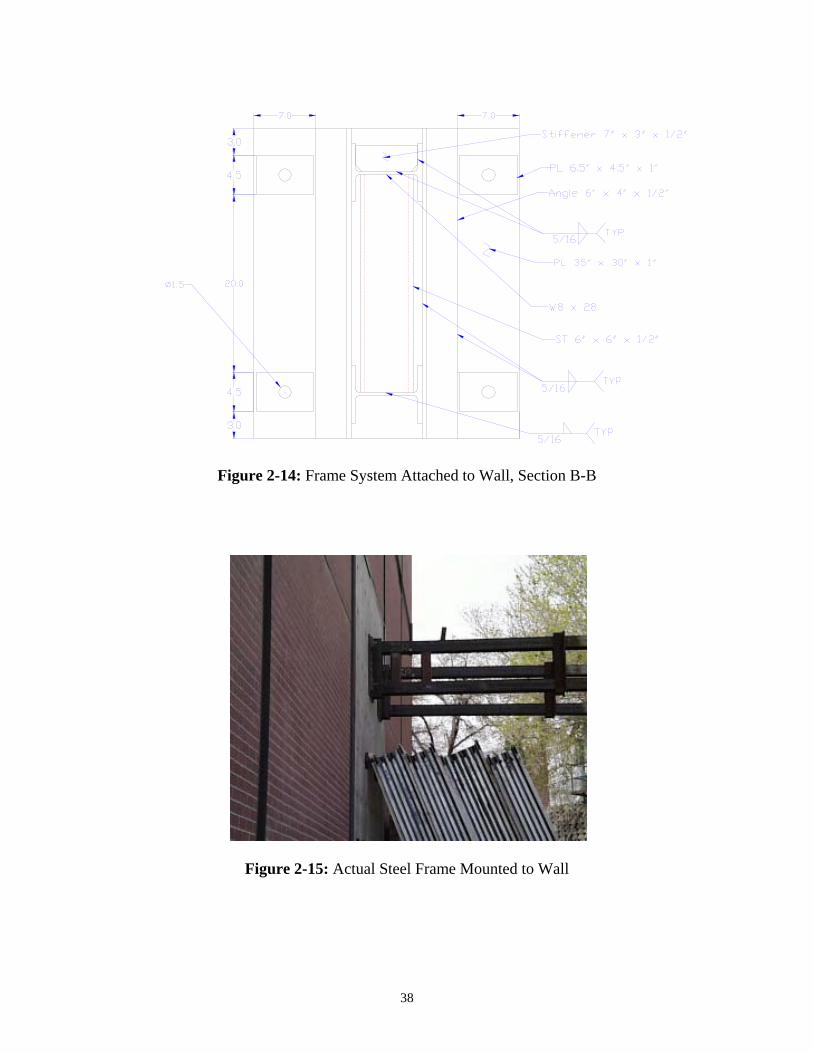
The frame support was connected to the wall with four tensioned rods, see Figure 2-14. Figure
2-15 shows the actual steel frame mounted on the wall. A different grout mix was pumped into
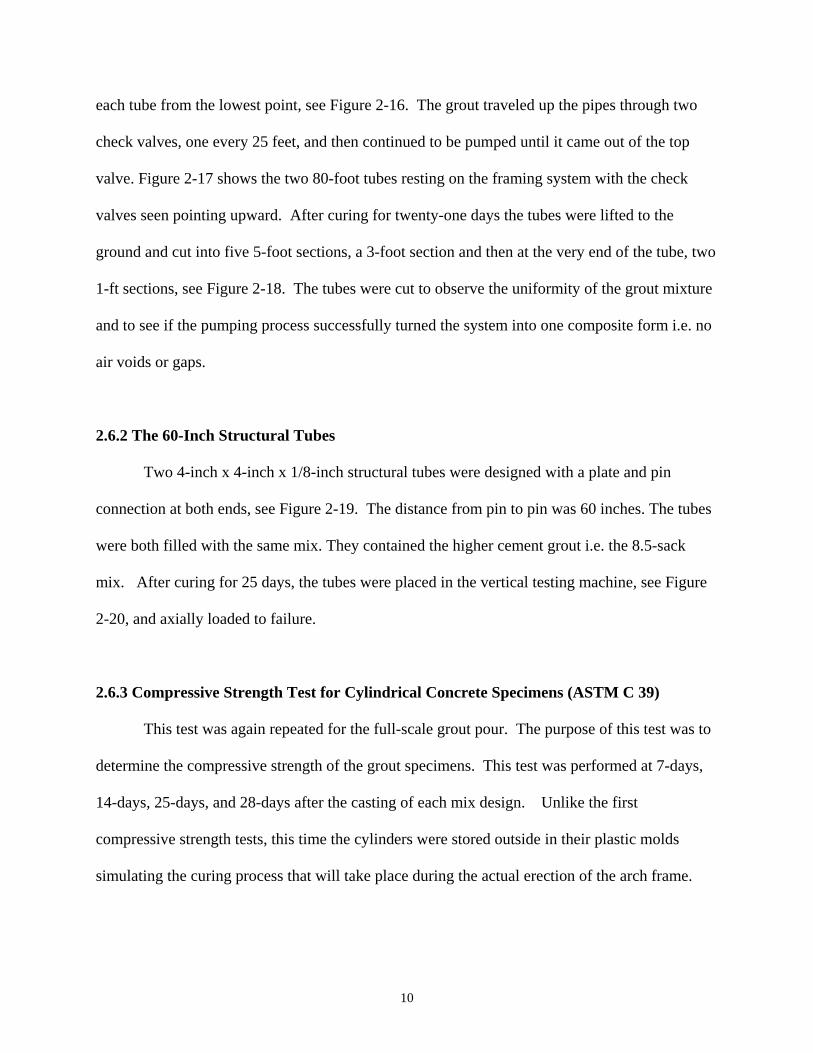
10
each tube from the lowest point, see Figure 2-16. The grout traveled up the pipes through two
check valves, one every 25 feet, and then continued to be pumped until it came out of the top
valve. Figure 2-17 shows the two 80-foot tubes resting on the framing system with the check
valves seen pointing upward. After curing for twenty-one days the tubes were lifted to the
ground and cut into five 5-foot sections, a 3-foot section and then at the very end of the tube, two
1-ft sections, see Figure 2-18. The tubes were cut to observe the uniformity of the grout mixture
and to see if the pumping process successfully turned the system into one composite form i.e. no
air voids or gaps.
2.6.2 The 60-Inch Structural Tubes
Two 4-inch x 4-inch x 1/8-inch structural tubes were designed with a plate and pin
connection at both ends, see Figure 2-19. The distance from pin to pin was 60 inches. The tubes
were both filled with the same mix. They contained the higher cement grout i.e. the 8.5-sack
mix. After curing for 25 days, the tubes were placed in the vertical testing machine, see Figure
2-20, and axially loaded to failure.
2.6.3 Compressive Strength Test for Cylindrical Concrete Specimens (ASTM C 39)
This test was again repeated for the full-scale grout pour. The purpose of this test was to
determine the compressive strength of the grout specimens. This test was performed at 7-days,
14-days, 25-days, and 28-days after the casting of each mix design. Unlike the first
compressive strength tests, this time the cylinders were stored outside in their plastic molds
simulating the curing process that will take place during the actual erection of the arch frame.

11
The molds were not removed until the day they were tested. The maximum load attained is
recorded and divided by the cross-sectional area to obtain the compression strength.
2.6.4 Length Change Test of Hardened Hydraulic-Cement Concrete (ASTM C 157)
The purpose of this test was to determine the length change or shrinkage of the grout
mixes due to factors other than externally applied forces and temperature changes. Half the
specimens of each mix were moist cured and the other half were air cured. Readings were taken
at 7, 14, and 28 days. The length comparator readings at each test age were compared to the
initial length comparator reading to calculate the shrinkage of the concrete, which was measured
in microstrains.
2.6.5 Slump Flow Test
The purpose of this test was to measure the unconfined flow of the grout mix. The grout
was shoveled into the slump cone and then the cone was lifted away and the concrete was
allowed to spread laterally, see Figure 2-21. The diameter was taken at two locations
perpendicular to each other and then recorded (10).
12
Chapter 3
Experiment Results
3.1 Introduction
This section describes the results from the preliminary tests and the full-scale field tests.
The two mix designs chosen for testing were evaluated through the series of tests described in
Chapter 2. The two bleed water tests and the strengths for both mixes are discussed. The
shrinkage of each grout mix from the length change test was calculated and is evaluated. A
visual examination of the uniformity for the 10-foot pipe systems is presented. For the full-scale
test the repeated compressive strength and shrinkage data is analyzed. The axial load and stress
for the 60-inch tubes subjected to the vertical-testing machine were evaluated and are compared.
And the full-scale 80-inch tubes were cut up after being pumped with each mix design and cured
for the designated time period. The tubes were subjected to a visual inspection and this will be
discussed.
3.2. Compressive Strength
To determine the resistance of the grout mixes to axial loading, the compressive strength
test was very critical. The specified strength requirement for both of the trial mix designs was
5000 psi.
For the compression tests performed on the two different mix designs during the
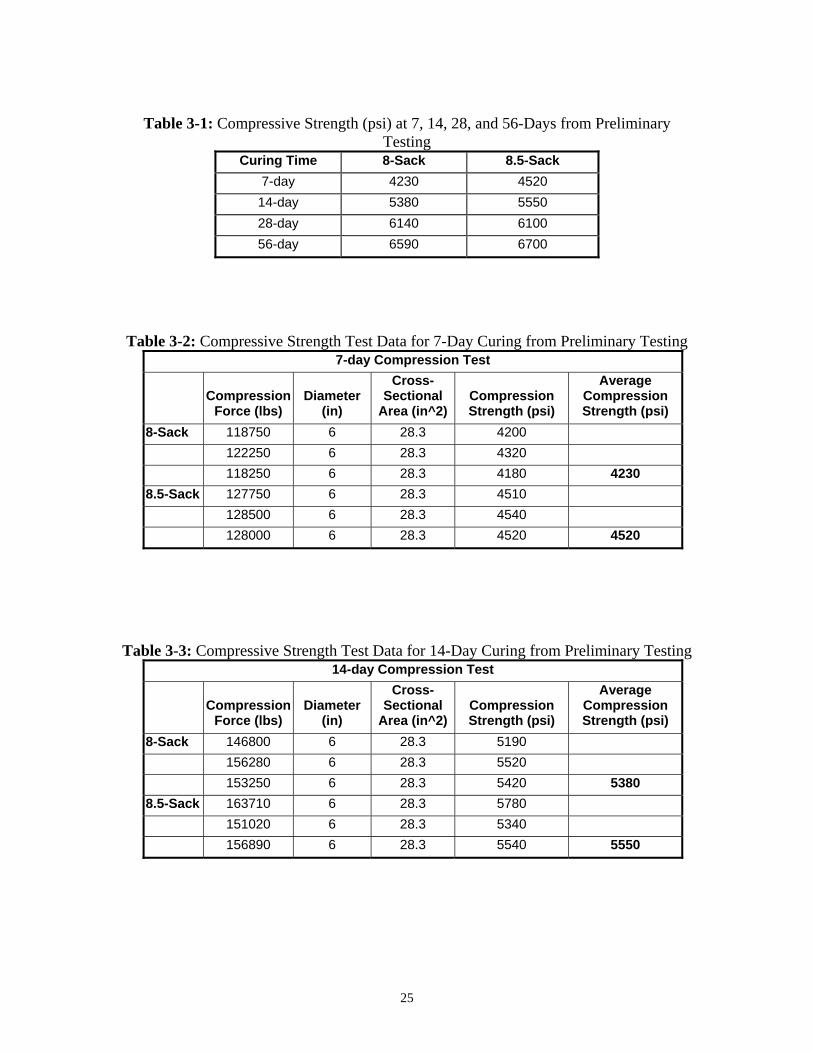
preliminary testing, the strengths for both mixes were above what was required as seen in Table
3-1. The strength requirement of 5000 psi was met by the 14-day mark for both mix designs. At
the 28-day curing period (when the minimum strength requirement should be met) the specimens
were tested to be 6590 psi and 6700 psi, for the 8-sack and the 8.5-sack mix respectively. The
13
detailed compressive strength data for the 7, 14, 28, and 56-day curing periods are given in
Tables 3-2 through 3-5. At the 7-day curing period the 8.5-sack mix was 290 psi higher in
compressive strength than the 8-sack. At 14 days the 8.5-sack mix was still higher in
compressive strength but the difference between the two mix designs decreased to 170 psi. At
28 days the 8.5-sack mix increased in strength, but dropped slightly below the 8-sack mix. Then
at 56 days the 8.5-sack mix regained its higher strength with a 110 psi margin. The comparison
between the two mix designs is shown in Figure 3-1.
For the field testing with the full-scale structural steel tubes, the compression test results
are summarized in Table 3-6. The 28-day strengths were 6787 psi and 7128 psi, for the 8-sack
and the 8.5-sack mix respectively. These strengths are well above the required 5000 psi strength
that must be met. The early compression strengths were not as high in comparison to the
preliminary compression strengths, but the later compression strengths were actually a little
higher than the preliminary compression strengths. The detailed compressive strength data for
the 7, 14, 25, and 28-day curing periods are given in Tables 3-7 through 3-10. After 7 days of
curing the 8.5-sack mix was 624 psi greater in strength than the 8-sack mix. At 14 days the 8.5-
sack mix was 677 psi above the 8-sack mix. At 25 days the 8.5-sack mix was 836 psi above the
8-sack mix. At 28 days the 8.5-sack mix was 341 psi above the 8-sack mix. The comparisons
between the two mix designs are shown in Figure 3-2.
3.3 Bleeding
Bleeding is the migration of water to the top surface of freshly placed concrete or grout
caused by the settlement of the solid materials (8). Bleeding can effect the durability of the mix

14
and can also cause the mix to shrink. These two adverse effects are important in determining an
adequate mix design for this project.
In attempting to perform both bleed water tests, data was unable to be collected due to the
lack of water that bled up to the surface. According to the ASTM C 232 Bleeding of Concrete
Test, a lack of rising water concluded that there was not enough bleed water to calculate the
volume of bleed water per unit area of surface or the percent of water in the specimen that will
bleed. This test ran a duration of two hours for each of the two mix designs and no water was
able to be collected from either mix design.
The second attempt at measuring the bleed water in the mixes came from the pumping of
the 10-foot PVC pipes. The pipes were left to cure for almost three months and during that
duration the grout mixes contained within the tubes did not show any signs of bleeding or
shrinkage indicated by the hole in the top of the apparatuses that were checked periodically.
The two tests provided positive results toward the insignificance of bleed water in the
mix designs. There were no differences between the two mixes.
3.4 Compressive Strength for the Grout Pumped into the PVC Pipes
The compression test provided positive results. The average strengths were 7085 psi and
7715 psi, for the 8-sack and 8.5-sack mix respectively. These strengths were well above the
required strength of 5000 psi. The detailed compressive strength data is given in Table 3-11.
In comparing the results from these cylinders cut from the PVC tubes with the cylinders
made during the two concrete pours, the cylinders that were pumped tested as having a higher
strength.

15
The visual inspection as seen in Figure 2-3 concluded that the mix remained uniform
during the pumping and curing process. An issue was the concern of segregation. Figure 2-3
and other cross-sections show how well the mix stayed uniform. There were no differences
between the two mixes.
3.5 Shrinkage
To obtain the increased strength in the arched structure from the grout filled tubes, it is
essential for the steel and grout to form a composite system. Shrinkage can hinder this
composite action. The goal was to obtain a mix design with minimal shrinkage. The Federal
Highway Administration categorizes concrete into different performance grades depending on
their amount of shrinkage, see Table 3-12.
The changes in length of the shrinkage specimens for both the preliminary testing and the
field testing are summarized in Tables 3-13 and Table 3-14 respectively. The specimens
numbered one through three were cured in the moisture room and the specimens numbered four
through six were air cured. The negative numbers indicate expansion in the grout. The
specimens that cured in the moisture room tend to display expansion due to the ability of the
grout to constantly absorb water.
Both mix designs fell into Performance Grade Three, which is described as good, for
shrinkage. The length changes in the preliminary tests indicated a larger shrinkage rate for the
8.5-sack mix design. The detailed length change data is given in Table 3-15. The length
changes for the field testing set of tests were only continued through to the 28-day period due to
lack of time, but according to the data collected up to this point, the rate of shrinkage for the two
16
mix designs seemed to be fairly close in relation to each other. The detailed length change data
is given in Table 3-16.
3.6 Slump Flow
The test result for both mix designs was a diameter of 13 inches see Table 3-17.
According to the range of slump flow values in this test procedure the data collected was
irrelevant to any type of evaluation concerning this test. The ranges specified in the testing
procedure are all in the twenties; the data collected from the grout mixes were too low. Although
too low for the specified test, the flow was sufficient for pumping.
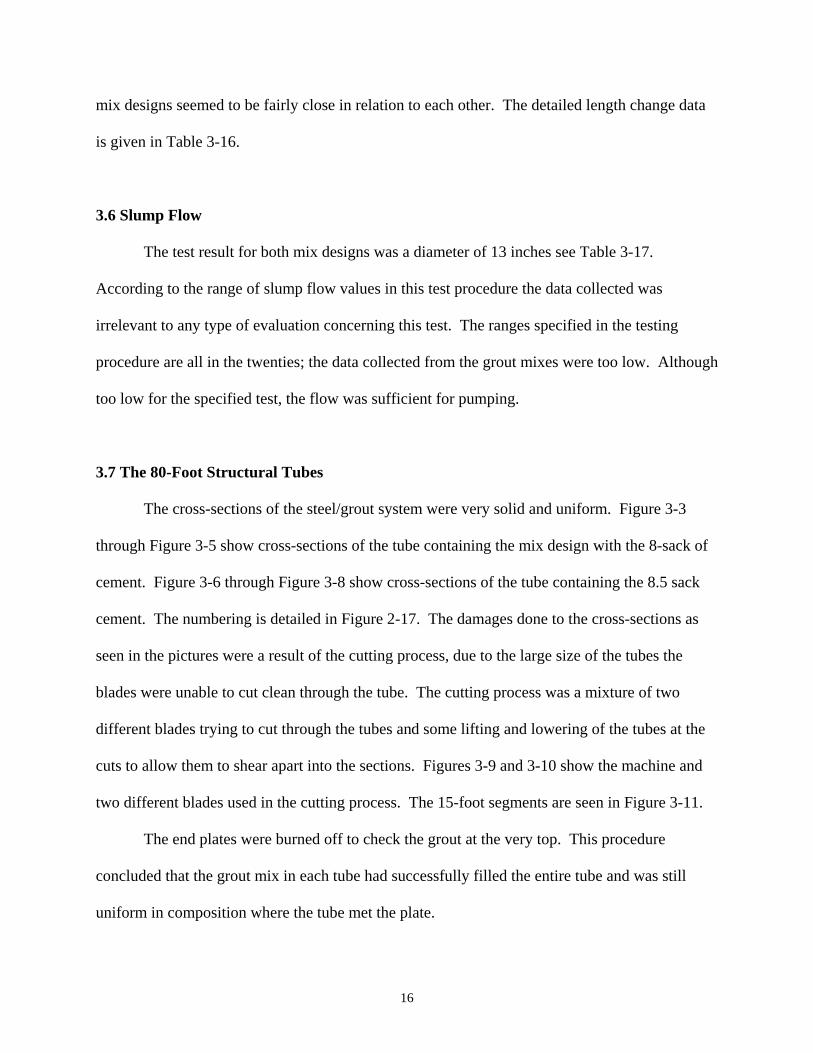
3.7 The 80-Foot Structural Tubes
The cross-sections of the steel/grout system were very solid and uniform. Figure 3-3
through Figure 3-5 show cross-sections of the tube containing the mix design with the 8-sack of
cement. Figure 3-6 through Figure 3-8 show cross-sections of the tube containing the 8.5 sack
cement. The numbering is detailed in Figure 2-17. The damages done to the cross-sections as
seen in the pictures were a result of the cutting process, due to the large size of the tubes the
blades were unable to cut clean through the tube. The cutting process was a mixture of two
different blades trying to cut through the tubes and some lifting and lowering of the tubes at the
cuts to allow them to shear apart into the sections. Figures 3-9 and 3-10 show the machine and
two different blades used in the cutting process. The 15-foot segments are seen in Figure 3-11.
The end plates were burned off to check the grout at the very top. This procedure
concluded that the grout mix in each tube had successfully filled the entire tube and was still
uniform in composition where the tube met the plate.

17
Due to the 5/16-inch walls of the steel tubes, deformation occurred on the lower portion
of the tubes. The maximum deformations were 1 inch and 1½ inches for the tubes containing the
8-sack cement and the 8.5 sack cement respectively. The deformation in the actual structure will
not be an issue because the wall thickness of the tubes are ½ inch.
3.8 The 60-inch Structural Tubes
Sixty-inch structural tubes were made to test the compressive capacity of the system.
These 4-inch x 4-inch x 1/8-inch structural steel tubes had difficulty being pumped full of grout.
They were designed with a 1-inch diameter opening for the grout. This diameter was determined
so as not to initiate a decrease in the axial strength of the steel. The pump was unable to
decrease the pressure low enough to allow the grout mix to sufficiently enter into the tube
without jamming up the aggregate in the 1-inch diameter pipe.
The alternative was to burn off one end plate and hand pack the grout mix into the pipes
with the aid of a vibrator, see Figure 3-11. This change in filling the tubes provided for some
issues during the axial load test. These issues included: unequal bearing of the tube on the plate
under compression, the field weld connection of the plate back on the tube, some generation of
eccentricity, and an understanding that the mix was not pumped, simulating the actual proposed
procedure.
The axial strength interpolated from the Composite Column Tables in the LRFD Manual
for Steel Construction was 127.4 kips (9). This was based on an fy of 46 ksi and an f'c of 5 ksi.
Hand calculations using actual concrete strength and a fy of 46 ksi determined a capacity of
159.4 kips. The actual fy is not known. The axial force vs. strain for the two tests are shown in
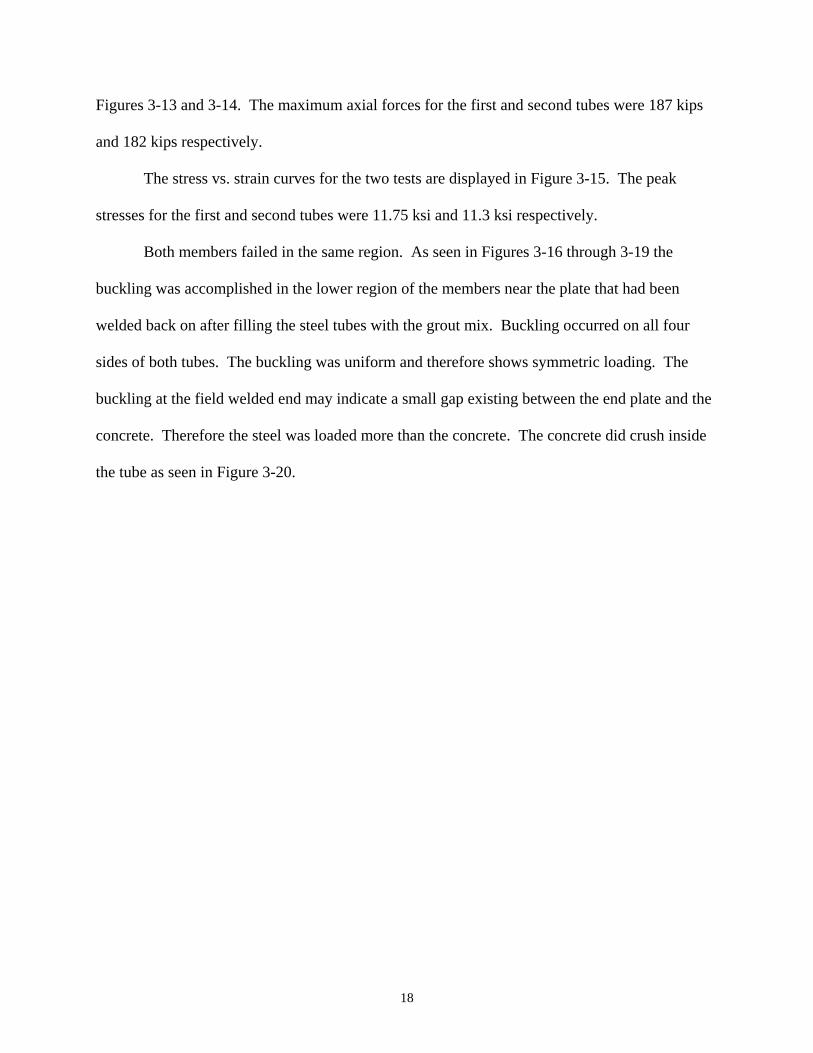
18
Figures 3-13 and 3-14. The maximum axial forces for the first and second tubes were 187 kips
and 182 kips respectively.
The stress vs. strain curves for the two tests are displayed in Figure 3-15. The peak
stresses for the first and second tubes were 11.75 ksi and 11.3 ksi respectively.
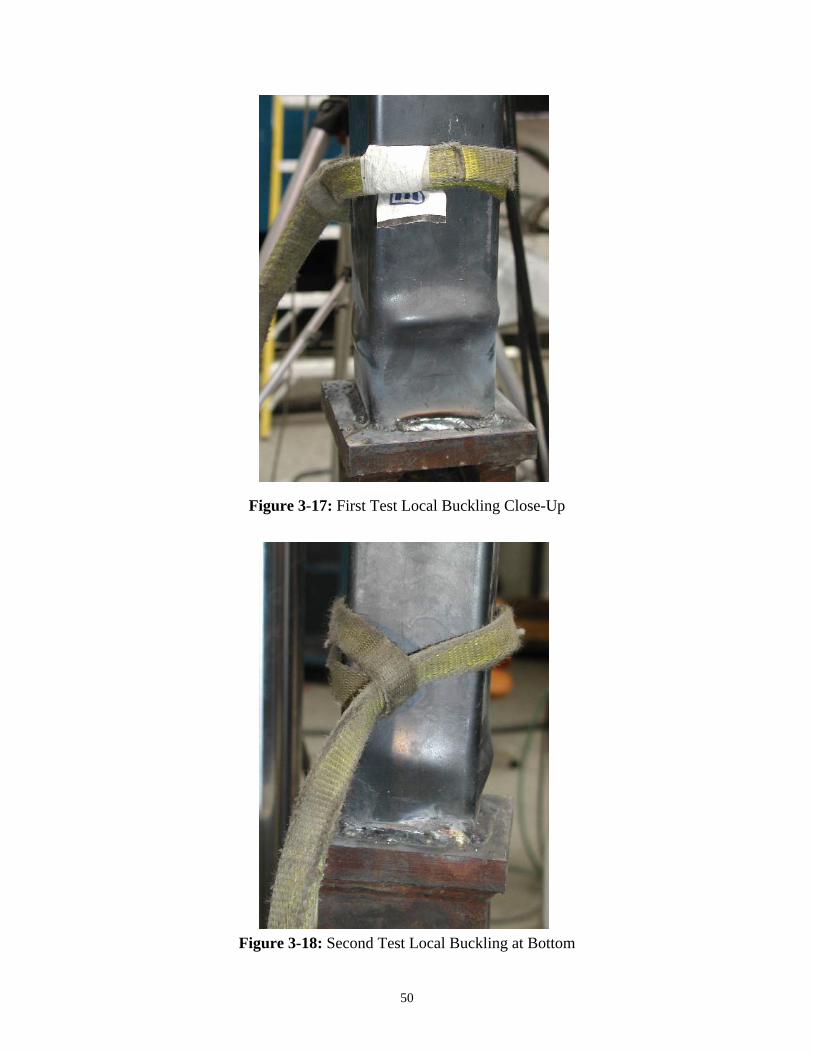
Both members failed in the same region. As seen in Figures 3-16 through 3-19 the
buckling was accomplished in the lower region of the members near the plate that had been
welded back on after filling the steel tubes with the grout mix. Buckling occurred on all four
sides of both tubes. The buckling was uniform and therefore shows symmetric loading. The
buckling at the field welded end may indicate a small gap existing between the end plate and the
concrete. Therefore the steel was loaded more than the concrete. The concrete did crush inside
the tube as seen in Figure 3-20.

19
Chapter 4
Summary, Conclusions, and Recommendations
4.1 Summary
To ensure a proper mix design that will successfully and completely fill the cross-
sections of the arch in the Galena Creek bridge certain criteria must be considered. The criteria
discussed in this report are: the minimum 5000 psi compressive strength, the need for a non-
segregating uniform mix design, little or no shrinkage, the prevention of bleed water, and the
ability for the mix to be pumped into the tubes.
Surveys taken from the surrounding states and local interviews provided information on
the method in which the mix should be placed in the tubes. Pumping from the bottom up was
found to be a very efficient way of accomplishing a composite system between the concrete and
the steel. As seen in the cross-sections, the mixes remained uniform and filled the entire volume
of the tubes.
Both mixes proved to be efficient in attaining the required compressive strength. The
preliminary compression tests resulted in higher early strength and the field-testing compression
tests resulted in higher later strength. The cylinders tested from the PVC pipes had the highest
strength.
The shrinkage tests placed both mixes in performance grade three, which is described as
good according to the Federal Highway Administration. The shrinkage was a lot greater in the
specimens that were air cured verses the specimens that were moist cured. The specimens
maintained in the moisture room were constantly exposed to water, which allowed them to
absorb moisture and expand. The actual bridge will be between moist and air cured.

20
Since no bleed water was collected from any of the test specimens, a balanced mix design
is indicated. This means the mix designs only contain enough water for the hydration process,
which minimizes drying shrinkage.
The large-scale structural steel tubes were pumped successfully and formed a composite
action with the grout mixes. The smaller structural steel tubes despite the complications getting
the grout inside the tubes, provided good results under the axial loading. The values obtained
were above the code capacity values.
4.2 Conclusions
1) The mix designs were successful in meeting the specified compressive strength. Both of the
mixes tested met and exceeded the minimum requirement. Essentially three sets of tests were
done to establish a strong confidence that the mix designs are able to reach the required strength.
2) Bleed water was not an issue with either of the mix designs tested. No free standing water
could be seen at the top of either tube. Bleeding of concrete can indicate a non-uniform mix.
This was one indication that the mixes tested were not prone to segregation. This result was a
combination of the low water/cement ratio, the shrinkage compensating admixture, the addition
of fly ash, and the large amount of fine aggregates. All these conditions aid in the elimination of
bleed water.
3) Shrinkage of the grout mixes was still present, but was minimal. According to the Portland
Cement Association, the average specimen will experience 34 percent of its shrinkage in the first
month. And the amount of shrinkage can be relative to the size of the mass. Smaller masses
21
tend to have larger shrinkage amounts. Depending on NDOT’s specific needs these mixes may
need to be tested further. There has been no parameters set or tests done on grout or concrete
within a confined environment, but according to current standard set by FHWA the mix designs
tested are a grade three which was considered good. This comparison can be made with data
given in Tables 3-14 and 3-15 and the standards set by FHWA given in Table 3-13.
4) The 80-ft structural steel tubes were pumped very successfully. Both mixes were able to fill
the entire volume of the tubes. The cross-sections provided a clear picture in the ability of the
grout mixes to keep their uniform composition through the pumping process and the curing
process. Even the top end where the plate was burned off of the tube the grout remained uniform
and composite.
5) The 60-inch structural tubes were a positive indication of the strength that can be obtained
through the composite action of the grout encased in the steel tube. Both mixes achieved
strengths higher than the design strength.
6) The pumping of the mix up through the bottom of the tubes has proven to be a successful
method and one in which was probably the most feasible. Both mixes tested are sufficient in
contending to be the fill in the Galena Creek Arch Bridge.
4.3 Recommendations
1) Based on the results, both mixes are very adequate to fill the structural steel tubes. No
evidence has made one mix design dominate over the other mix design.
22
2) Pumping from the bottom up worked well. In filling the entire arch system the structure
should be broken down into eighty-foot sections that are closed off from one another. The
lowest end should have a hook-up for the hose of the pump. It may not be necessary to have
three deairing holes per section, but maybe only one at the top allowing the grout mix to
come up through. The top hole should be larger than 1 inch in diameter (preferably 2 inch)
to prevent the aggregate from jamming in the 1-inch diameter pipe. This issue may be some
of the cause in the deformation occurring in the bottom of the tubes.
3) The admixtures used in the two mixes proved to be adequate and the proper quantities for the
desired results.
4) The two mixes have indicated a successful guideline for the slump and slump flow
requirement needed in the mix design chosen for the fill of the structural tubes.

23
References
1. ASTM C 39-99 “Standard Test Method for Compressive Strength of Cylindrical Concrete Specimens,” American Society for Testing and Materials. West Conshochocken, PA 1999.
2. ASTM C 143-99 “Standard Test Method for Slump of Hydraulic Cement Concrete,”
American Society for Testing and Materials. West Conshochocken, PA 1999. 3. ASTM C 157-99 “Standard Test Method for Length Change of Hardened Hydraulic-Cement
Mortar Concrete,” American Society for Testing and Materials. West Conshochocken, PA 1999.
4. ASTM C 232-99 “Bleeding of Concrete Test,” American Society for Testing and Materials.
West Conshochocken, PA 1999 5. ASTM C 490-99 “Standard Practice for Use of Apparatus for the Determination of Length Changes of Hardened Cement Paste, Mortar, and Concrete. American Society for Testing and Materials. West Conshochocken, PA 1999. 6. ASTM C 617-99 “Standard Practice for Capping Cylindrical Concrete Specimens.
American Society for Testing and Materials. West Conshochocken, PA 1999. 7. Fischer, Michael and Konig, Gert. “Composite Pedestrian Bridge Constructed From
Unbonded Prestress,” Lacer, No.5 2000. 8. Kosmatka, Steven H. and Panarese, William C., Design and Control of Concrete
Mixtures. Portland Cement Association. Skokie, IL, 1994. 9. Load and Resistance Factor Design, Manual of Steel Construction. American Institute of
Steel Construction, 1998. 10. MB-RDC-01 “Test Method for Measuring Slump Flow of Hydraulic Cement
Concrete,” Master Builders. Cleveland, Oh, 2000.

24
Table 2-1: #8 Stone, 5000 psi, Non-Air Entrained 3/8” Concrete/Grout,
8-Sack Cementitious, Shrinkage Compensated MATERIAL BATCH WEIGHTS VOLUME S.G. (SSD) % by Volume of Mortar (Ttl Mix)
N.C. Type II Cement 639 3.251 3.15 68.81 Chem Comp lll 120 0.652 2.95 Pozzolanic Fly Ash 113 0.771 2.35 Water 300 4.808 0 Air (%) 1.8 0.878 0 % by Volume of Aggregate (only)#8 Paiute 1371 8.421 2.61 50 Sand Paiute 1356 8.421 2.58 50 Total Weight 3911 27
Water/Cement Ratio ADMIXTURES oz/100wt & per Yard Oz/Yard 0.34
Pozzolith 322-N 7 61.04 Pozzolith 440-N 14 122.08 Theoretical Unit Wt
144.85 Slump/inch 9
Table 2-2: #8 Stone, 5000 psi, Non-Air Entrained 3/8” Concrete/Grout, 8.5-Sack Cementitious, Shrinkage Compensated
MATERIAL BATCH WEIGHTS VOLUME S.G. (SSD) % by Volume of Mortar (Ttl Mix)N.C. Type II Cement 679 3.454 3.15 75.91 Chem Comp lll 120 0.652 2.95 Pozzolanic Fly Ash 120 0.818 2.35 Water 320 5.128 0 Air (%) 1.8 0.888 0 % by Volume of Aggregate (only)#8 Paiute 1059 6.504 2.61 40 Sand Paiute 1571 9.756 2.58 60 Total Weight 3881 27
Water/Cement Ratio ADMIXTURES oz/100wt & per Yard Oz/Yard 0.35
Pozzolith 322-N 7 64.33 Pozzolith 440-N 14 128.66 Theoretical Unit Wt
143.75 Slump/inch 9
25
Table 3-1: Compressive Strength (psi) at 7, 14, 28, and 56-Days from Preliminary
Testing Curing Time 8-Sack 8.5-Sack
7-day 4230 4520 14-day 5380 5550 28-day 6140 6100 56-day 6590 6700
Table 3-2: Compressive Strength Test Data for 7-Day Curing from Preliminary Testing 7-day Compression Test
Compression
Force (lbs)
Diameter
(in)
Cross-Sectional
Area (in^2)
Compression Strength (psi)
Average Compression Strength (psi)
8-Sack 118750 6 28.3 4200 122250 6 28.3 4320 118250 6 28.3 4180 4230
8.5-Sack 127750 6 28.3 4510 128500 6 28.3 4540 128000 6 28.3 4520 4520
Table 3-3: Compressive Strength Test Data for 14-Day Curing from Preliminary Testing 14-day Compression Test
Compression
Force (lbs)
Diameter
(in)
Cross-Sectional
Area (in^2)
Compression Strength (psi)
Average Compression Strength (psi)
8-Sack 146800 6 28.3 5190 156280 6 28.3 5520 153250 6 28.3 5420 5380
8.5-Sack 163710 6 28.3 5780 151020 6 28.3 5340 156890 6 28.3 5540 5550

26
Table 3-4: Compressive Strength Test Data for 28-Day Curing from Preliminary Testing
28-day Compression Test Compression
Force (lbs)
Diameter
(in)
Cross-Sectional
Area (in^2)
Compression Strength (psi)
Average Compression Strength (psi)
8-Sack 174500 6 28.3 6170 172000 6 28.3 6080 174500 6 28.3 6170 6140
8.5-Sack 172000 6 28.3 6080 174500 6 28.3 6170 171500 6 28.3 6060 6100
Table 3-5: Compressive Strength Test Data for 56-Day Curing from Preliminary Testing 56-day Compression Test
Compression
Force (lbs)
Diameter
(in)
Cross-Sectional
Area (in^2)
Compression Strength (psi)
Average Compression Strength (psi)
8-Sack 192000 6 28.3 6780 183250 6 28.3 6480 184250 6 28.3 6510 6590
8.5-Sack 184500 6 28.3 6520 197000 6 28.3 6960 187500 6 28.3 6630 6700
Table 3-6: Compressive Strength (psi) at 7, 14, 25 and 28-Days from Field-Testing Curing Time 8-sack 8.5-sack
7-day 2562 3186 14-day 3834 4511 25-day 5754 6590 28-day 6787 7128

27
Table 3-7: Compressive Strength Test Data for 7-Day Curing from Field-Testing 7-day Compression Test
Compression
Force (lbs)
Diameter
(in)
Cross-Sectional
Area (in^2)
Compression Strength (psi)
Average Compression Strength (psi)
8-Sack 58000 6 28.3 2049.469965 78500 6 28.3 2773.85159 81000 6 28.3 2862.190813 2562
8.5-Sack 90750 6 28.3 3206.713781 87500 6 28.3 3091.872792 92250 6 28.3 3259.717314 3186
Table 3-8: Compressive Strength Test Data for 14-Day Curing from Field-Testing
14-day Compression Test Compression
Force (lbs)
Diameter
(in)
Cross-Sectional
Area (in^2)
Compression Strength (psi)
Average Compression Strength (psi)
8-Sack 103000 6 28.3 3639.575972 111000 6 28.3 3922.261484 111500 6 28.3 3939.929329 3834
8.5-Sack 125000 6 28.3 4416.961131 124500 6 28.3 4399.293286 133500 6 28.3 4717.314488 4511
Table 3-9: Compressive Strength Test Data for 25-Day Curing from Field-Testing 28-day Compression Test
Compression
Force (lbs)
Diameter
(in)
Cross-Sectional
Area (in^2)
Compression Strength (psi)
Average Compression Strength (psi)
8-Sack 160000 6 28.3 5654 165000 6 28.3 5830 163500 6 28.3 5777 5754
8.5-Sack 177500 6 28.3 6272 190000 6 28.3 6714 192000 6 28.3 6784 6590

28
Table 3-10: Compressive Strength Test Data for 28-Day Curing from Field-Testing 28-day Compression Test
Compression
Force (lbs)
Diameter
(in)
Cross-Sectional
Area (in^2)
Compression Strength (psi)
Average Compression Strength (psi)
8-Sack 189044 6 28.3 6680 200081 6 28.3 7070 187063 6 28.3 6610 6787
8.5-Sack 205175 6 28.3 7250 201250 6 28.3 7111 198750 6 28.3 7023 7128
Table 3-11: Compressive Strength for Cylinders Cut From 10-ft PVC Pumped Tubes
Area Cut
From
Compression
Force (lbs)
Diameter
(in)
Cross-Sectional
Area (in^2)
Compression Strength (psi)
Average Compression Strength (psi)
8-Sack Top 185,190 6 28.3 6540 Middle 210130 6 28.3 7430 Bottom 153350 6 28.3 5420 6460 Top 219540 6 28.3 7760 Middle 218970 6 28.3 7740 Bottom 215980 6 28.3 7630 7710
8.5-Sack Top 216960 6 28.3 7670 Middle 212180 6 28.3 7500 Bottom 215050 6 28.3 7600 7590 Top 212960 6 28.3 7530 Middle 227040 6 28.3 8020 Bottom 225220 6 28.3 7960 7840
Table 3-12: Federal Highway Administration Performance Grades (16)
Shrinkage Grades FHWA HPC Performance Grade Description of Grade Shrinkage (microstrains)
3 good <400 2 moderate 400-600 1 poor 600-800 0 very poor >800

29
Table 3-13: Preliminary Testing Length Changes
Accumulative Length Changes 8-Sack 7-day 14-day 28-day 8-wks 12-wks 16-wks moist cured 1 35 49 39 50 37 39
2 56 63 45 63 58 63 3 -51 -38 -60 -41 -52 -46
air cured 4 33 64 78 124 127 132 5 34 68 82 125 132 134 6 22 64 82 120 128 133
8.5-Sack moist cured 1 49 60 48 65 38 62
2 -43 -41 30 48 51 54 3 58 51 3 -31 53 61
air cured 4 51 70 95 145 151 153 5 52 77 98 163 251 255 6 58 79 100 168 249 263
*The negative (-) indicates expansion. Table 3-14: Field-Testing Length Changes
Accumulative Length Change 8-Sack 7-day 14-day 28-day moist cured 1 -31 -28 -26
2 -30 -25 -22 3 -56 -53 -51
air cured 4 42 76 92 5 47 83 109 6 61 90 107
8.5-Sack moist cured 1 -15 -12 -10
2 -6 -14 -7 3 -12 -14 -7
air cured 4 59 89 104 5 58 88 101 6 55 84 103
*The negative (-) indicates expansion

30
Table 3-15: Length Change Data from Preliminary Testing Length Change Test Data
8-sack 1-day 7-day 14-day 28-day 8-wks 12-wks 16-wks moist cured 1 0.2065 0.203 0.2016 0.2026 0.2015 0.2028 0.2026
2 0.1993 0.1937 0.193 0.1948 0.193 0.1935 0.193 3 0.2014 0.2065 0.2052 0.2074 0.2055 0.2066 0.206
air cured 4 0.1987 0.1954 0.1923 0.1909 0.1863 0.186 0.1855 5 0.2011 0.1977 0.1943 0.1929 0.1886 0.1879 0.1877 6 0.205 0.2028 0.1986 0.1968 0.193 0.1922 0.1917
8.5-Sack moist cured 1 0.2062 0.2013 0.2002 0.2014 0.1997 0.2024 0.2
2 0.2057 0.21 0.2098 0.2027 0.2009 0.2006 0.2003 3 0.2183 0.2125 0.2132 0.218 0.2214 0.213 0.2122
air cured 4 0.2147 0.2096 0.2077 0.2052 0.2002 0.1996 0.1994 5 0.1986 0.1934 0.1909 0.1888 0.1823 0.1735 0.1731
6 0.2175 0.2117 0.2096 0.2075 0.2007 0.1926 0.1912
Table 3-16: Length Change Data from Field-Testing
Length Change Test Data 8-sack 1-day 7-day 14-day 28-day moist cured 1 0.2006 0.2037 0.2034 0.2032
2 0.1957 0.1987 0.1982 0.1979 3 0.1985 0.2041 0.2038 0.2036
air cured 4 0.3115 0.3073 0.3039 0.3023 5 0.1572 0.1525 0.1489 0.1463 6 0.2087 0.2026 0.1997 0.198
8.5-Sack moist cured 1 0.1951 0.1966 0.1963 0.1961
2 0.1948 0.1954 0.1962 0.1955 3 0.198 0.1992 0.1994 0.1987
air cured 4 0.2024 0.1965 0.1935 0.192 5 0.2052 0.1994 0.1964 0.1951 6 0.2075 0.202 0.1991 0.1972
Table 3-17: Slump Flow Data
Slump Flow Data Diameter (in)
8-Sack 13 13
8.5-Sack 13 13

31
Figure 1-1: Cross-Section of Steel Arch’s Structural Tubes at the Four Corners
Figure 2-1: Pedestrian Bridge Supported by Steel Tube Filled with Concrete (9)

32
Figure 2-2: 10-ft x 6-in Diameter PVC Pipe Apparatuses
Figure 2-3: Cross-Section of Cut Cylinder from PVC Pipe Specimens

33
Figure 2-4: 12-in x 6-in Diameter Cylinder Grout Specimens
Figure 2-5: 12-in x 6-in Diameter Cylinder Being Tested in Compression
34
Figure 2-6: 3-in x 3-in x 11.25-in Prism Molds for the Length Change Test
Figure 2-7: Length Comparator with Shrinkage Specimen

35
Figure 2-8: Specimens Curing in Moisture Room
Figure 2-9: Specimens Air Curing

36
Figure 2-10: Metal Bucket and Cover for Bleed Water Test
Figure 2-11: Trailer Line Pump
37
Figure 2-12: Structural Tubes Resting on Ground and Frame Support
Figure 2-13: Frame System to Support Structural Tubes, Section A-A
38
Figure 2-14: Frame System Attached to Wall, Section B-B
Figure 2-15: Actual Steel Frame Mounted to Wall

39
Figure 2-16: Pump attached at the bottom of the tube and pumping the grout mix up
Figure 2-17: The 80-ft Structural Steel Tubes Prior to Being Pumped Full with the Grout Mixes
40
Figure 2-18: The cuts in the 80-ft Structural Tube
Figure 2-19: 4 x 4 x 1/8 Structural Tube Designed for the Vertical Testing Machine

41
Figure 2-20: Specimen in the Vertical Testing Machine
Figure 2-21: Slump Flow Test

42
2000
3000
4000
5000
6000
7000
8000
0 7 14 21 28 35Days
Com
pres
sive
Str
engt
h (p
si)
8-Sack
8.5-Sack
Figure 3-1: Compressive Strength Comparison for Preliminary Testing
Figure 3-2: Compressive Strength Comparison for Field-Testing
4000
4500
5000
5500
6000
6500
7000
0 7 14 21 28 35 42 49 56 63
Days
Com
pres
sive
Str
engt
h (p
si)
8-Sack
8.5-Sack

43
Figure 3-3: Cross-section of Steel Tube with the Grout Mix Design containing 8-sack of Cement, Section III
Figure 3-4: Cross-section of Steel Tube with the Grout Mix Design containing 8-sack of
Cement, Section IV

44
Figure 3-5: Cross-section of Steel Tube with the Grout Mix Design containing 8-sack of Cement, Section V
Figure 3-6: Cross-section of Steel Tube with the Grout Mix Design containing 8.5-sack of Cement, Section III

45
Figure 3-7: Cross-section of Steel Tube with the Grout Mix Design containing 8.5-sack of Cement, Section IV
Figure 3-8: Cross-section of Steel Tube with the Grout Mix Design containing 8.5-sack of Cement, Section V

46
Figure 3-9: The Structural Steel Tubes Starting to Get Cut
Figure 3-10:The Structural Steel Tubes Being Cut with the Larger Blade

47
Figure 3-11:The Structural Steel Tubes Cut in 15-foot Segments
Figure 3-12: 60-inch Tubes Curing After Ends Burned Off and Filled

48
0
20
40
60
80
100
120
140
160
180
200
0 0.001 0.002 0.003 0.004 0.005 0.006
Strain
Com
pres
sive
For
ce (k
ips)
Laser Strain
Strain Based on Actuator(60 in gage length,includes grip slip and localbuckling)
Figure 3-13: Test One-Axial Force vs. Strain
Figure 3-14: Test Two-Axial Force vs. Strain
0
20
40
60
80
100
120
140
160
180
200
0 0.001 0.002 0.003 0.004 0.005 0.006 0.007
Strain
Com
pres
sive
For
ce (k
ips)
Laser Extensometer Strain
Strain Based on Actuator(60 in gage length,includes grip slip and localbuckling)

49
0
2
4
6
8
10
12
14
0.000 0.002 0.004 0.006 0.008Strain
Stre
ss (k
si)
Test OneTest Two
Figure 3-15: Comparison of the Stress vs. Strain Curves
Figure 3-16: First Test Local Buckling at Bottom
50
Figure 3-17: First Test Local Buckling Close-Up
Figure 3-18: Second Test Local Buckling at Bottom

51
Figure 3-19: Second Test Local Buckling All Four Sides
Figure 3-20: Concrete Exposed at Location of Buckling

52
Appendix
A-1: Sample survey prepared for surrounding states 53
A-2: Information gathered from survey from surrounding states 59
A-3: Information gathered from local interview 61

53
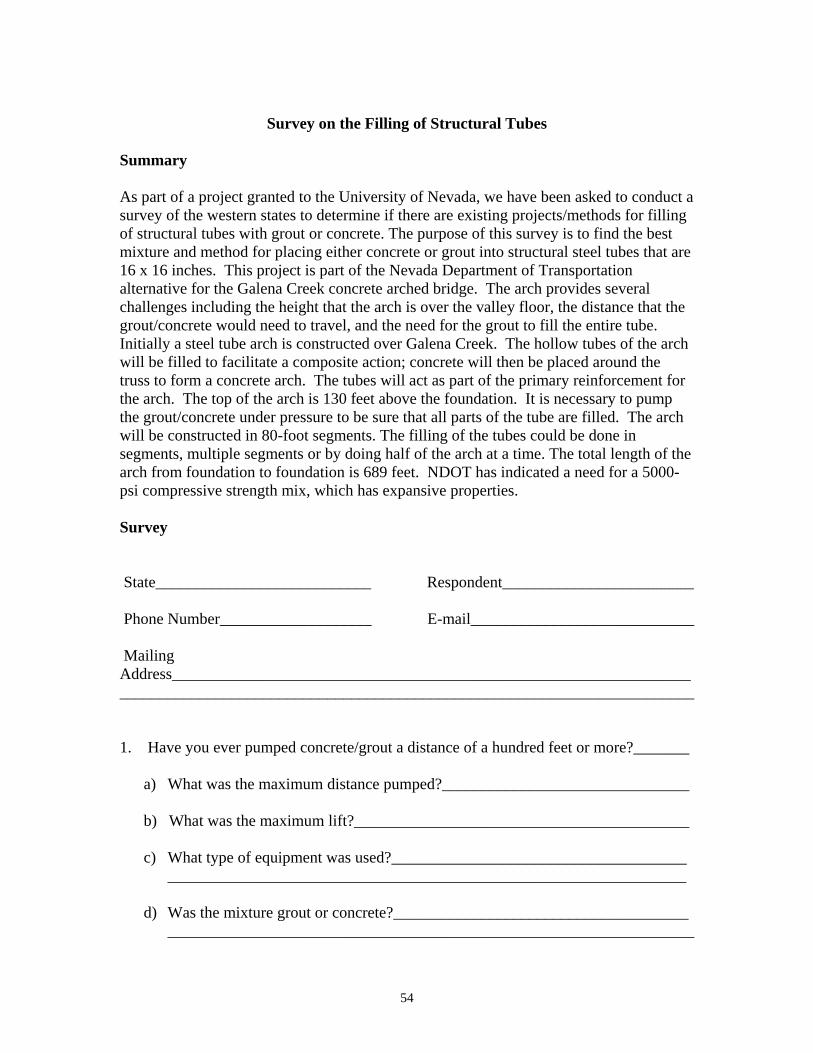
A-1: Sample Survey Prepared for Surrounding States
Department of Civil Engineering/258 College of Engineering University of Nevada Reno, NV 89557 (775) 784-4288 Fax (775) 784-1390 June 20, 2001 To Whom It May Concern: Enclosed is a survey on the filling of structural tubes. The survey is designed to help us in our research here at the University of Nevada, Reno. As part of a project granted to the University of Nevada, Reno; we have been asked to conduct a survey of the western states to determine if there are existing projects/methods for the filing of structural tubes. This project is part of the Nevada Department of Transportation alternative for the Galena Creek concrete arched bridge. The arch provides several challenges and we hope to find a little insight on techniques and design measures through these surveys taken by other DOT’s. The survey itself consists of two pages. A third page is given to show a superimposed image of what the arched bridge will look like when it is done and also a cross-section of the arch is provided showing the four structural tubes at the corners. Thank you for your time and knowledge this will be very beneficial to our success in completing this project. Please return survey by July 15, 2001. Sincerely, Ambere Banghart Civil engineering undergrad
54
Survey on the Filling of Structural Tubes
Summary As part of a project granted to the University of Nevada, we have been asked to conduct a survey of the western states to determine if there are existing projects/methods for filling of structural tubes with grout or concrete. The purpose of this survey is to find the best mixture and method for placing either concrete or grout into structural steel tubes that are 16 x 16 inches. This project is part of the Nevada Department of Transportation alternative for the Galena Creek concrete arched bridge. The arch provides several challenges including the height that the arch is over the valley floor, the distance that the grout/concrete would need to travel, and the need for the grout to fill the entire tube. Initially a steel tube arch is constructed over Galena Creek. The hollow tubes of the arch will be filled to facilitate a composite action; concrete will then be placed around the truss to form a concrete arch. The tubes will act as part of the primary reinforcement for the arch. The top of the arch is 130 feet above the foundation. It is necessary to pump the grout/concrete under pressure to be sure that all parts of the tube are filled. The arch will be constructed in 80-foot segments. The filling of the tubes could be done in segments, multiple segments or by doing half of the arch at a time. The total length of the arch from foundation to foundation is 689 feet. NDOT has indicated a need for a 5000-psi compressive strength mix, which has expansive properties. Survey
State___________________________ Respondent________________________ Phone Number___________________ E-mail____________________________ Mailing Address_________________________________________________________________________________________________________________________________________ 1. Have you ever pumped concrete/grout a distance of a hundred feet or more?_______
a) What was the maximum distance pumped?_______________________________ b) What was the maximum lift?__________________________________________
c) What type of equipment was used?_____________________________________ _________________________________________________________________
d) Was the mixture grout or concrete?_____________________________________ __________________________________________________________________
55
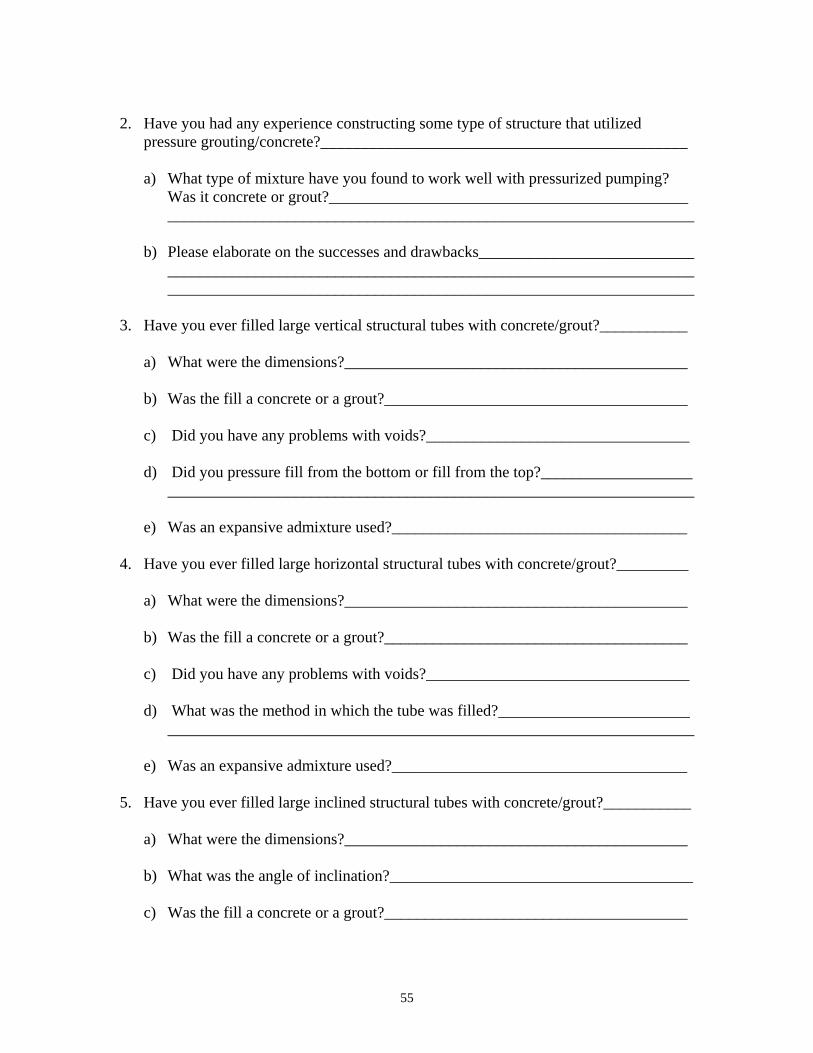
2. Have you had any experience constructing some type of structure that utilized
pressure grouting/concrete?______________________________________________
a) What type of mixture have you found to work well with pressurized pumping? Was it concrete or grout?_____________________________________________ __________________________________________________________________
b) Please elaborate on the successes and drawbacks___________________________
__________________________________________________________________ __________________________________________________________________
3. Have you ever filled large vertical structural tubes with concrete/grout?___________
a) What were the dimensions?___________________________________________
b) Was the fill a concrete or a grout?______________________________________
c) Did you have any problems with voids?_________________________________
d) Did you pressure fill from the bottom or fill from the top?___________________ __________________________________________________________________
e) Was an expansive admixture used?_____________________________________
4. Have you ever filled large horizontal structural tubes with concrete/grout?_________
a) What were the dimensions?___________________________________________
b) Was the fill a concrete or a grout?______________________________________
c) Did you have any problems with voids?_________________________________
d) What was the method in which the tube was filled?________________________
__________________________________________________________________
e) Was an expansive admixture used?_____________________________________ 5. Have you ever filled large inclined structural tubes with concrete/grout?___________
a) What were the dimensions?___________________________________________ b) What was the angle of inclination?______________________________________
c) Was the fill a concrete or a grout?______________________________________

56
d) Did you have any problems with voids?_________________________________
e) Did you pressure fill from the bottom or fill from the top?___________________ __________________________________________________________________
f) Was an expansive admixture used?_____________________________________
6. Based on your experience can you suggest any type of mixture for the filling of large
tubes in this project?____________________________________________________ __________________________________________________________________________________________________________________________________________
7. What types of equipment would you use to facilitate such a project?______________ _____________________________________________________________________ _____________________________________________________________________
10. Any other suggestions or comments?_______________________________________
__________________________________________________________________________________ _______________________________________________________________________________
We would really appreciate it if you could return this survey by July 20, 2001. Thank you for your time and cooperation. Ambere Banghart Email: [email protected], Phone (775) 771-5859 Civil Engineering Student David Sanders Email: [email protected], Phone (775) 784-4288, Fax (775) 784-1390 Associate Professor of Civil Engineering Department of Civil Engineering/258 College of Engineering University of Nevada Reno, Nevada 89557
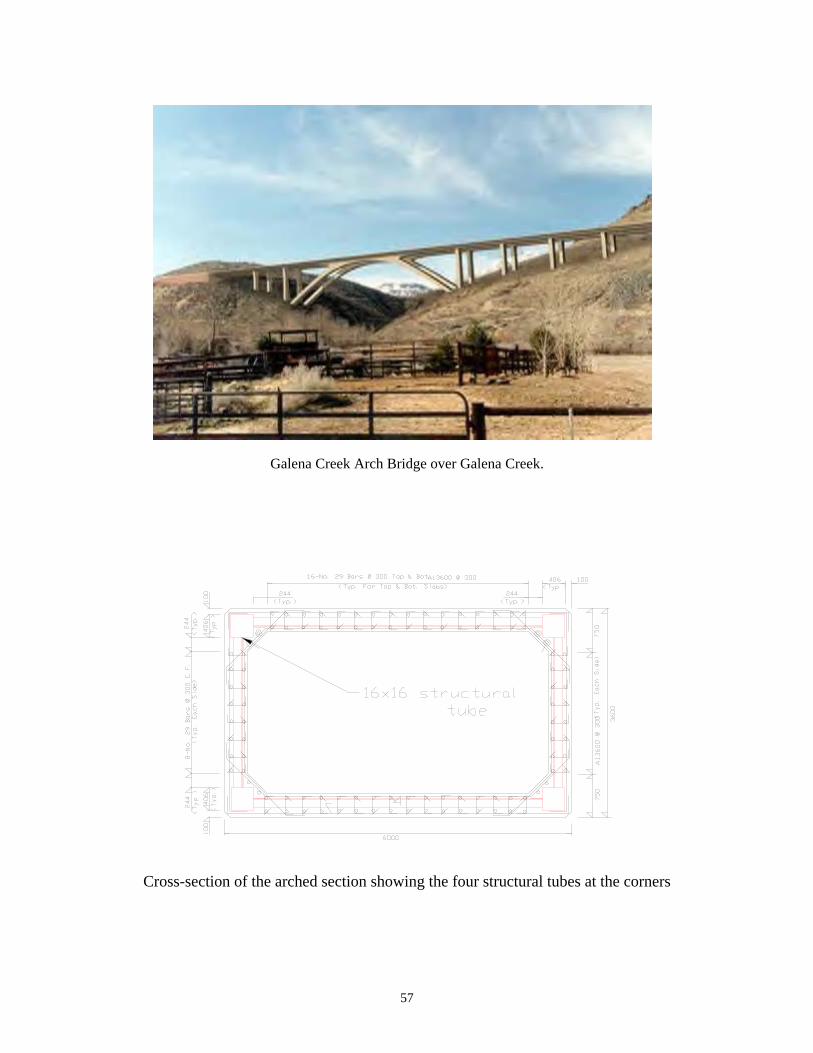
57
Galena Creek Arch Bridge over Galena Creek.
Cross-section of the arched section showing the four structural tubes at the corners


A-2: Information gathered from survey on surrounding states
Reference Max pumped
Maximum lift
Type of Mix Pressurized Pumping Mixture Experience With Vertical Tubes Experience with Horizontal Tubes
Alaska 150' 5' concrete Caltrans grout spec.for steel jacketed r/c
column retrofit Has filled 48" pipe piles with concrete from the top
Has pressure grouted 2' x 3' voided space 2" max
Arizona 280'-300' 5' grout, type II portland cement and water
cement and water, grout *concerns-leaks when pressurized, concern w/ setting time during hot weather
no Has filled pipes with a max 4" dia with grout from the lower elevation, problems with dams
Arizona Arizona California California California California California
Colorado 400' <100' concrete no no Colorado Colorado Idaho Idaho Idaho Montana Montana Montana New Mexico 900' 30' concrete A properly porportioned concrete mix Has filled 10' dia pipes with concrete from
the bottom Has filled 10' dia pipes with concrete by pumping
New Mexico 105 ' 50' concrete With post tensioning ducts-pure cement-water mixture w/o sand. Pressure grouting exterior of Jacked Casing-w/ z sack slurry *had to watch for over pressurization of soil exterior of jacked casing
no no
New Mexico Oregon Oregon Oregon 150' 30' Concrete w/ a
Schweg 4" concrete pump
commercial concrete bag- shotconcrete, flowable concrete bridge repair
Has drilled shafts- 36" to 96" w/ concrete, used tremies from the bottom *had problems w/ voids
Has grouted around annular space between existing culvert and plastic insert, 24" to 72" w/ a low pressure grouting pump
Utah Utah UCSD Washington 3600' 50' grout w/ grout pump
into 4" dia p/t tube continuously
grout no no
Washington Washington Washington Washington
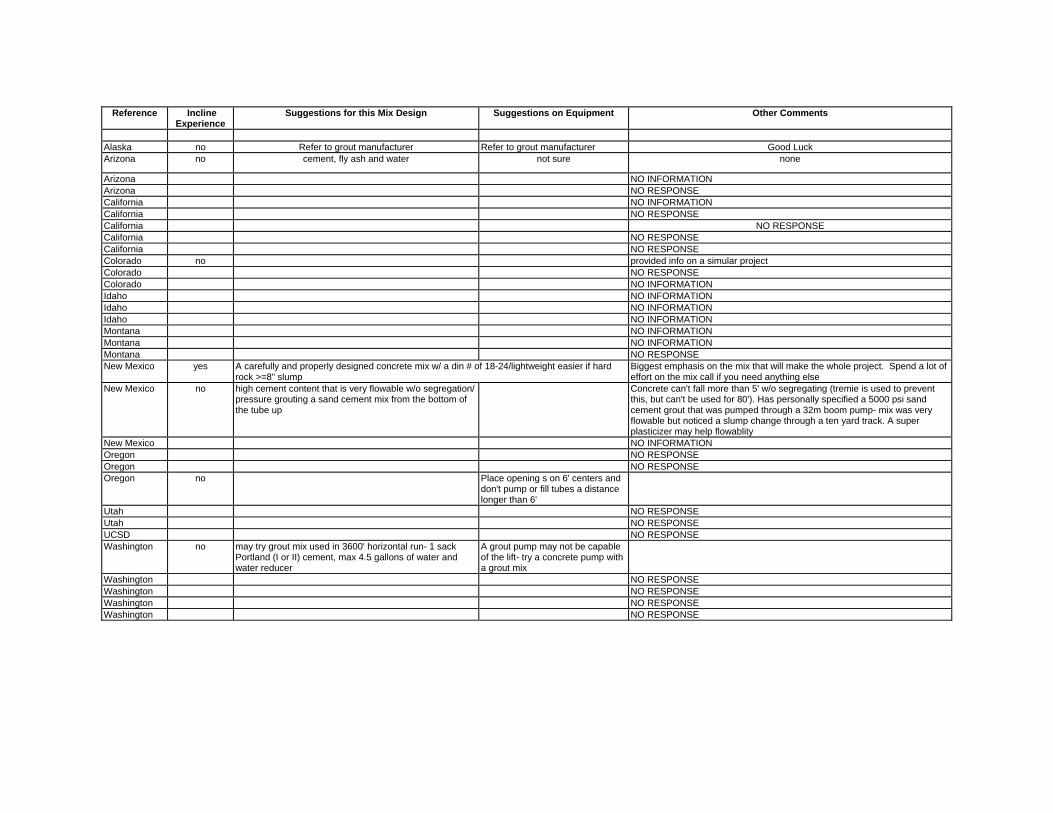
Reference Incline Experience
Suggestions for this Mix Design Suggestions on Equipment Other Comments
Alaska no Refer to grout manufacturer Refer to grout manufacturer Good Luck Arizona no cement, fly ash and water not sure none
Arizona NO INFORMATION Arizona NO RESPONSE California NO INFORMATION California NO RESPONSE California NO RESPONSE California NO RESPONSE California NO RESPONSE Colorado no provided info on a simular project Colorado NO RESPONSE Colorado NO INFORMATION Idaho NO INFORMATION Idaho NO INFORMATION Idaho NO INFORMATION Montana NO INFORMATION Montana NO INFORMATION Montana NO RESPONSE New Mexico yes A carefully and properly designed concrete mix w/ a din # of 18-24/lightweight easier if hard
rock >=8" slump Biggest emphasis on the mix that will make the whole project. Spend a lot of effort on the mix call if you need anything else
New Mexico no high cement content that is very flowable w/o segregation/ pressure grouting a sand cement mix from the bottom of the tube up
Concrete can't fall more than 5' w/o segregating (tremie is used to prevent this, but can't be used for 80'). Has personally specified a 5000 psi sand cement grout that was pumped through a 32m boom pump- mix was very flowable but noticed a slump change through a ten yard track. A super plasticizer may help flowablity
New Mexico NO INFORMATION Oregon NO RESPONSE Oregon NO RESPONSE Oregon no Place opening s on 6' centers and
don't pump or fill tubes a distance longer than 6'
Utah NO RESPONSE Utah NO RESPONSE UCSD NO RESPONSE Washington no may try grout mix used in 3600' horizontal run- 1 sack
Portland (I or II) cement, max 4.5 gallons of water and water reducer
A grout pump may not be capable of the lift- try a concrete pump with a grout mix
Washington NO RESPONSE Washington NO RESPONSE Washington NO RESPONSE Washington NO RESPONSE

A-3: Information gathered from local interview
References Maximum pumped
Maximum lift Type of Mix Pressurized Pumping Mixture
Experience With Vertical Tubes Experience with Horizontal Tubes
Company A 350' Concrete Has used non shrink grout
Company B
Company C
Company D 470' 171' Concrete- 6 sack, 4000 psi w/ fibers pumped w/ 52-m Lucky Concrete boom pump
Has filled sonnet tubes w/ dia 2' to 6'- concrete w/ plasticizer poured in lifts from the top and vibrated to eliminate air voids
Company E 300' Concrete w/ a 56-m boom pump
Has filled 3' dia 30' long tubes from top and vibrated/ used a plasticizer
Company F 300'-500'
Company G 500' 30' Concrete w/ a Schwinn Stationary Pump
3/4" max aggregate Has filled w/ grout from the bottom up, used hydration stabilizer
Company H 1000' 2' Concrete w/ a Putzmeister
Has filled tubes w/ a 24" dia w/ concrete from the top using a plasticizer
Company I 400' 170' Used a 45-m Schwinn Pump
7 sack grout works well Has filled tubes -earthquake proofing columns, filled from the top- rock pocketing due to bad vibrating methods, mix was 7 sack, 3/4" 6500 psi w/ plasticizer
Has filled 3x3 squares 24' long- used grout did not fill properly at the top
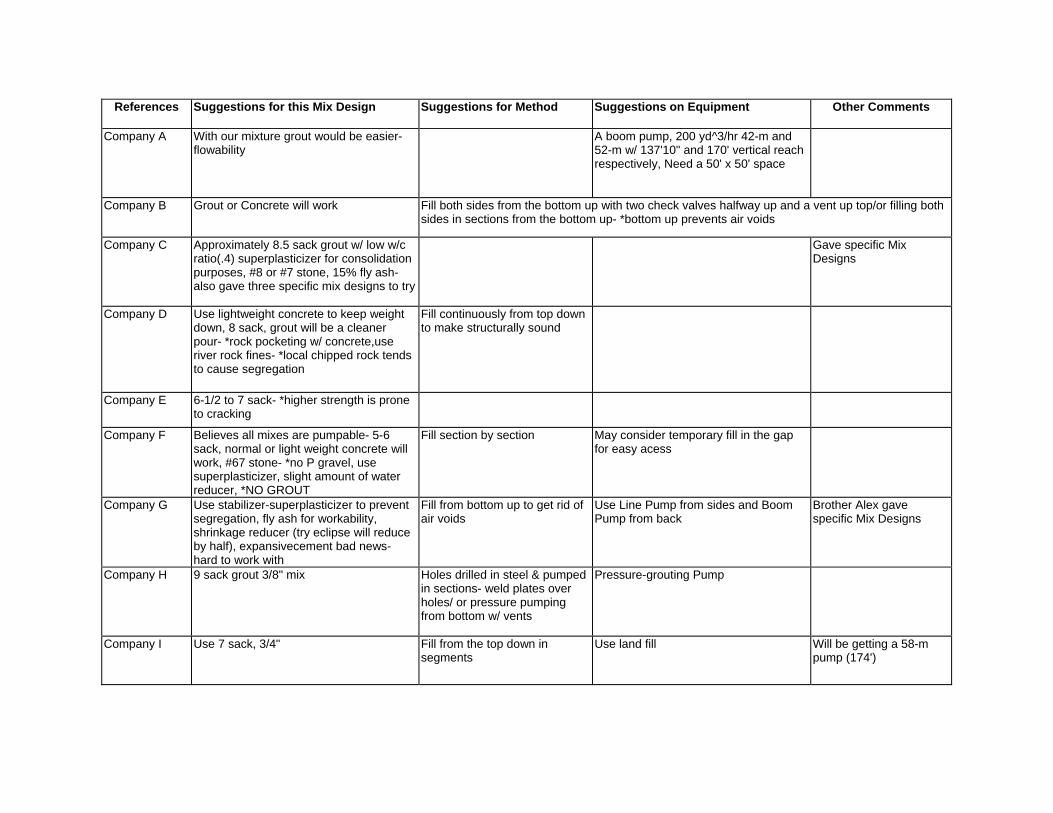
References Suggestions for this Mix Design Suggestions for Method Suggestions on Equipment Other Comments
Company A With our mixture grout would be easier-flowability
A boom pump, 200 yd^3/hr 42-m and 52-m w/ 137'10" and 170' vertical reach respectively, Need a 50' x 50' space
Company B Grout or Concrete will work Fill both sides from the bottom up with two check valves halfway up and a vent up top/or filling both sides in sections from the bottom up- *bottom up prevents air voids
Company C Approximately 8.5 sack grout w/ low w/c ratio(.4) superplasticizer for consolidation purposes, #8 or #7 stone, 15% fly ash- also gave three specific mix designs to try
Gave specific Mix Designs
Company D Use lightweight concrete to keep weight down, 8 sack, grout will be a cleaner pour- *rock pocketing w/ concrete,use river rock fines- *local chipped rock tends to cause segregation
Fill continuously from top down to make structurally sound
Company E 6-1/2 to 7 sack- *higher strength is prone to cracking
Company F Believes all mixes are pumpable- 5-6 sack, normal or light weight concrete will work, #67 stone- *no P gravel, use superplasticizer, slight amount of water reducer, *NO GROUT
Fill section by section May consider temporary fill in the gap for easy acess
Company G Use stabilizer-superplasticizer to prevent segregation, fly ash for workability, shrinkage reducer (try eclipse will reduce by half), expansivecement bad news- hard to work with
Fill from bottom up to get rid of air voids
Use Line Pump from sides and Boom Pump from back
Brother Alex gave specific Mix Designs
Company H 9 sack grout 3/8" mix Holes drilled in steel & pumped in sections- weld plates over holes/ or pressure pumping from bottom w/ vents
Pressure-grouting Pump
Company I Use 7 sack, 3/4" Fill from the top down in segments
Use land fill Will be getting a 58-m pump (174')

Nevada Department of Transportation
Jeff Fontaine, P.E. Director Prepared by Research Division
Tie He, Research Division Chief (775) 888-7803
[email protected] 1263 South Stewart Street
Carson City, Nevada 89712