Embed Size (px)
Citation preview

Strojniški vestnik - Journal of Mechanical Engineering 66(2020)2, 142-152 Received for review: 2019-09-03© 2020 Journal of Mechanical Engineering. All rights reserved. Received revised form: 2019-11-18DOI:10.5545/sv-jme.2019.6313 Short Scientific Paper Accepted for publication: 2019-12-19
*Corr. Author’s Address: University of Maribor, Faculty of Mechanical Engineering, Smetanova 17, Maribor, Slovenia, [email protected]
Evaluation of Clogged Hydropower Plant Trash Rack LossesHribernik, A.
Aleš Hribernik*
University of Maribor, Faculty of Mechanical Engineering, Slovenia
A trash rack is applied in front of the turbine to restrict the entrance of significantly sized material present in the water. It obstructs the free flow, and produces energy-losses by generating eddies induced partially by the trash rack bars and partially by the debris collected on it. While the additional static forces due to debris accumulation are considered in the trash rack design process, the debris caused energy losses taking place during plant operation are usually neglected, although a rather simple model was developed to account for them. However, the long term application of this model demands an extensive set of trash rack clogging data and, therefore, no such application has been documented so far. Thus, an analysis was performed to acquire the debris accumulation intensity with time and to evaluate the extra energy losses they caused. Data on one year operation of a hydropower plant aggregate i.e. flow rate and trash rack head losses measured at 15 minute intervals, were acquired and used to build a rack clogging model. Using this model, it was possible to distinguish clearly between debris and rack structure caused head losses, and to analyse different cleaning strategies. It was shown that cumulative debris contributed to almost one half of head losses although the rack was cleaned frequently. This shows clearly that debris caused head losses may not be neglected, moreover, debris removal has to be planned carefully and carried out efficiently. Analyses of acquired data confirmed that incomplete debris removal increased head losses by 18 %, and proved how important regular and thorough rake cleaning is. Moreover, it was found out that the actually applied periodical rake cleaning was not optimal, and that the circumstances required cleaning strategy performed much better. It resulted in similar head losses, while the number of rack cleanings was reduced by 60 %.Keywords: hydropower plant, trash rack, debris, head losses
Highlights• A trash rack clogging model was developed using the time dependent debris collection rate acquired from a measured head
loss-time series.• Debris caused head losses contribute substantially to overall head losses of a trash rack, even when the rack is cleaned
frequently.• Different trash rack cleaning strategies were proposed and analysed from both the technical and economical points of view.• A circumstances required cleaning strategy clearly surpasses the commonly applied periodically performed trash rack cleaning
by reducing number of rack cleanings significantly at the same head losses.
0 INTRODUCTION
The application of alternative, and especially renewable, energy sources is growing from year to year. It is stimulated by raising the prices of conventional energy sources, the striving of individual countries to reduce their dependence on imported energy sources, and implementing the Kyoto Protocol Directives for the reduction of global emissions from greenhouse gases [1]. Hydropower has a very high potential regarding renewable energy sources, and its share in total electricity production from renewable energy sources exceeds 90 % in many countries [2]; however, the remaining potential of high power Hydro Power Plants (HPPs) is very limited, and the possible investors are now focused on small units and other renewable energy sources. Any efficiency improvement of the existing HPP operation also counts to this category, since it increases energy production without any further impact on the environment and with minimal investment cost. Improving the cleaning strategy of HPP trash racks is a simple example of such measures.
Trash racks are a vital part of each HPP. They are installed in front of the turbine in order to restrict the entrance of any material present in the water (like drifting debris, ice or trash), which can damage vital parts of a HPP. A substantial amount of debris, ice and trash drifting in a river can damage vital parts of a HPP. Trash racks are, therefore, used to restrict the entrance of significantly sized material present in the water. The trash rack obstructs the free flow and produces energy-losses by generating large-scale flow structures or eddies, induced partially by the trash rack bars and partially by the debris collected on them [3]. The latter can be reduced significantly when the trash rack is cleaned regularly. Debris is usually removed from a rack by raking. Mechanised rakes are used on large HPPs, while much cheaper manually operated rakes are usually applied on medium and mini size HPPs [4]. Thus, rakes` operation can be fully automated, or they can be operated manually. Application of rakes does not disturb the plant operation much, and racks may be cleaned as frequently as needed, which is definitely the fact when the mechanised racks are used. However, when the manually operated rakes are

Strojniški vestnik - Journal of Mechanical Engineering 66(2020)2, 142-152
143Evaluation of Clogged Hydropower Plant Trash Rack Losses
used a team of workers is needed, and their frequent interventions may increase the operation cost of the HPP significantly. It is, therefore, very important to find an optimal strategy for trash rack cleaning in order to keep the cleaning costs low to moderate on one hand, and not to increase too much the energy losses caused by the collected debris on the other hand.
An extensive number of references on trash rack design and trash rack energy losses can be found in the literature [5] to [14], however, the authors mostly neglected the debris caused losses, and only Meusburger [7] considered them in his work. This lack of investigation on debris caused losses is surprising, especially nowadays, when the migratory fish protection law dictates new, fish friendly trash rack design which reduces the clear spacing between the rack bars extensively (values of 10 mm to 30 mm are recommended [15]), as well as lowers the rack inclination below 30° relative to the horizontal [16]. These measures, especially the clear spacing reduction, increase the trash rack losses [11] and [17], as well as the danger of clogging.
Meusburger [7] developed a rather simple model to evaluate clogged trash rack losses. However, the application of his model demands an extensive set of trash rack clogging data and, therefore, no such application has been documented so far. Thus, an analysis was performed to acquire the debris accumulation intensity with time and to evaluate any extra energy losses they caused. In the first step, an analysis was performed to evaluate extra energy losses caused by the debris collected on the trash rack over several months` operations. Our goal was to distinguish clearly between the contribution of the rack itself and collected debris to the total energy losses of a clogged trash rack. Data on one year`s operation of the selected HPP unit, i.e. flow rate and trash rack head losses measured at 15 minute intervals, were used to calculate cumulative energy losses. Since the aggregate was under general refit at the beginning of the year and its trash rack was inspected, repaired and cleaned manually, measured head losses of the trash rack during the first days of operation corresponded to clean, debris free operation, and were applied to build a (clean) rack energy losses model. When applied later in the year, this model predicted clean rack head losses, and the debris contributed head losses were estimated by deducting them from the measured total head losses. It was shown that cumulative debris contributed to 48 % of total trash rack head losses, despite the fact that the trash rack was cleaned frequently. This shows clearly that debris
caused head losses may not be omitted, moreover, they may cause an important reduction in electricity production when the debris removal is not managed correctly.
In order to manage debris removal properly, one has to compare different trash rack cleaning strategies, and any trash rack clogging simulation model may be of great support. Such a model should predict the realistic debris accumulation, i.e. trash rack clogging with time under any debris removal frequency, and may allow total head loss calculation. The application of correct, i.e. realistic, debris accumulation rate is crucial here; it should mimic actual debris flow in the river. Debris flow intensity is not constant, and may change significantly within both short and long-time scales, i.e. from day to day and seasonally. It can be obtained from the long-term measured data on HPP operation, as already discussed. As mentioned, it was possible to separate the head losses caused by the debris from those induced by the trash rack structure. This resulted in a trash rack clogging rate model which was used to predict the rate of debris accumulation on the trash rack. It was, therefore, very simple to predict the instantaneous area blocked by the accumulated debris and corresponding extra trash rack losses, and check several scenarios of trash rack cleaning. The weaknesses of the existing cleaning strategy were shown clearly, and the possibility was presented how to reduce the total number of trash rack cleanings, i.e. plant operational cost, while keeping the energy losses, i.e. amount of produced electricity, unchanged.
1 METHODS
A trash rack obstructs the free flow and produces unwanted energy-losses, generated partially by the trash rack bars and partially by the accumulated debris. When clean, the trash rack losses are the smallest, and they increase with the amount of trash collected on the rack. Thus, it is possible to distinguish clearly between the rack’s bars and debris caused losses when the clean trash rack losses are known. These can be measured or predicted by one of the empirical equations.
1.1 Trash Rack Losses’ Prediction
Energy losses caused by the trash rack are categorised commonly as a head-loss, and may be calculated from:
∆h vg
= ξ2
2, (1)

Strojniški vestnik - Journal of Mechanical Engineering 66(2020)2, 142-152
144 Hribernik, A.
where ξ is the so-called trash rack head-loss coefficient which has to be determined experimentally or numerically.
Fig. 1. Trash rack
Kirschmer [5] was one of the first who investigated trash rack losses experimentally. He studied different bar thicknesses s and shapes (having a different bar shape coefficient K), assembled with different clear spacing b and inclined under several angles θ (see Fig. 1 for the details). He proposed the following universal formula:
ξ θ=
K sb
3
4
sin , (2)
which, till today, was improved further by many researchers. Levin [6] introduced blockage factor p (Eq. (3)), defined as the ratio of area blocked by the vertical bars ARS and the horizontal spacing and supporting elements AAH and the total area of the trash rack field ARF in order to account for the influence of the transversal elements:
pA AA
RS AH
RF
=+
, (3)
while Meusburger [7] took into account clogging due to the accumulated debris, which further reduced the flow area by AAD:
pA A A
ARS AH AD
RF
=+ +
. (4)
He carried out an extensive set of model tests at the ETH Zurich, Switzerland. Different trash rack designs (bar spacing) were investigated and 16 different types of clogging considered. He proposed a rather simple equation:
ξ θ=−
K pp1
3
2
sin , (5)
which correlated well with the experimental data for almost any type of clogging and satisfied the boundary condition ξ → ∞ when p → 1. There are several other formulae available for estimating head loss through trash racks. Josiah et. al [8] focused on a circular bar trash rack commonly used in Sri Lanka. Osborne [9] developed a model for rectangular bars, with simplified blockage factor p = b/(b+s) neglecting supporting elements, which was then improved further by Clark et. al [10] by considering bar shape. The latter influences head losses significantly, which may be reduced by more than 50 % when streamlined profile cross-section bars are used instead of rectangular bars according to Tsikata et. al [14]. Raynal et al. in [11], [12] and [13] investigated fish-friendly trash racks with inclined [11], angled [12] and streamwise oriented [13] trash racks having significantly reduced clear spacing b. They made a comprehensive comparison of different equations, and stated that the head losses calculated with the original Kirschmer equation (Eq. (2)) were too low in all cases, while the equations proposed in [7], [9], and [10] produced good results for larger spaces between bars (b/s > 2), which are characteristic for the most of already installed trash racks today. According to this, the Eq. (5) proposed in [7] and already adapted to account for the influence of debris accumulated on the trash rack, was applied in our study.
1.2 Trash Rack Losses’ Measurement
Trash rack losses may be measured accurately in a laboratory, where so-called model-tests are performed, and head-loss is calculated from the energy conservation equation:
h vg
h vg
h hl1
1
2
2
2
2
2 2+ = + + +∆ ∆ , (6)
where h1 and h2 are the measured upstream and downstream water depth, and ∆hl is the measured channel head-loss. Both flow velocities v1 and v2 are determined from the measured flow rate, taking into account actual flow areas A1 and A2, respectively. Although the tests are performed under laboratory conditions, the common head-loss measurement uncertainty is up to 3 mm, as reported in [11].
Field measurements, reported here, were carried out on HPP Vuhred, which is one of the eight HPPs on the Drava river in Slovenia owned by the company DEM d.o.o. managing the operation of all eight HPPs working in a chain mode. HPP Vuhred is a medium size impoundment type facility with 13 km long reservoir containing 10 million m3 of water, of which

Strojniški vestnik - Journal of Mechanical Engineering 66(2020)2, 142-152
145Evaluation of Clogged Hydropower Plant Trash Rack Losses
22 % can be used for generating electric power. HPP Vuhred makes use of a 17.4 m available head, and reaches a net capacity of 72 MW at the installed flow rate of 550 m3/s. The dam structure contains three turbine piers placed between four spillways and left and right bank buildings. Vertical Kaplan turbines are built into the turbine piers with generators overhead. Special equipment for controlling individual units is installed in each turbine pier. HPP unit 1 was instrumented with two level transmitters, as shown in Fig. 2, in order to measure flow rate and trash rack loss simultaneously. The entrance of the inflow channel is 12 m high and 14 m wide. It is divided by a supporting pier, thus, two equal trash racks are applied, each at one side of the pier. The entrance of the inflow channel is 12 m high and 14 m wide. It is divided by a supporting pier, thus, two equal trash racks are
applied, each at one side of the pier. Trash racks were assembled from rectangular bars 12 mm thick (s) and 130 mm deep (t). Steel rods were inserted through the bars at a regular distance of 700 mm. Circular spacers with 30 mm diameter were installed around the rods to obtain 100 mm clear spacing (b) between the bars. The rack is attached to the sides of the flume and supported by three horizontal beams. The trash rack is submersed, and there is no free water surface behind it to apply non-intrusive water level measurement such as the laser scaning reported in [18]. Two horizontal boreholes were, therefore, drilled through the supporting pier, one at each side of the trash racks. Another two inclined borings were made to reach the horizontal boreholes from the upper plateau of the HPP. Submersible level transmitters were inserted into the inclined borings, for water depth measurements h1 and h2, respectively, which is presented schematically in Fig. 2. Two temperature compensated Hydrobar I sensors with long-term stability less than 0.1 % from the adjusted range, produced by Klay-Instruments [15], were used in our case. A level transmitter measures hydrostatic pressure at the selected depth h0. The venting tube in the centre of the transmitter cable makes reference to the atmospheric pressure, which means that barometric changes do not cause any shift. As reported in [11], the common head-loss measurement uncertainty was up to 3 mm under laboratory conditions. However, under field conditions, i.e. when the measurements are carried out on an actual HPP unit, measurement uncertainty may increase significantly. In order to evaluate it, both type A and type B measurement uncertainty have to be considered. Type A standard measurement uncertainty is defined by the standard deviation of acquired results under similar conditions. In our case, this means under the same flow conditions, which are dictated by the flow rate and debris accumulation. It was, therefore, decided to use one week’s data, acquired immediately after the general refit when the trash rack was almost perfectly clean. All the data within 120 m3/s < Q < 130 m3/s interval (the interval having the highest frequency over one year`s operation) were used to calculate the standard deviation of head loss. This was 1.77 mm, and represented type A standard measurement uncertainty. The level transmitter accuracy specified by the producer is 0.1 % from the adjusted range. The latter was set to 4 m (approx. 0.4 bar), thus, the type B measurement uncertainty amounted to 2.31 mm. Combined standard measurement uncertainty was, thus, 2.91 mm and the expanded one approximately 5.8 mm at P = 95 %. Fig. 2. Schematic of trash rack head losses’ measurement

Strojniški vestnik - Journal of Mechanical Engineering 66(2020)2, 142-152
146 Hribernik, A.
According to Eq. (6), the channel head-loss has to be deducted from the total measured head loss, in order to obtain the trash rack caused head loss. While under laboratory conditions the trash rack is simply removed and the channel head loss is measured, but this is not possible (allowed) under field tests of an HPP unit. Thus, the channel loss has to be estimated. In [16], the following equation is suggested:
∆h v vgl l=−
ξ 2
2
1
2
2, (7)
where ξl is the head-loss coefficient which shall be assumed to vary from 0.1 for gradual contractions to 0.5 for abrupt contractions. The former (ξl = 0.1) takes place in our case, since the distance between the two hydrostatic pressure readings is only two metres, and the channel cross-section is reduced by less than 5 %. This way, the channel head loss was estimated to 0.7 mm at nominal (maximal) flow rate 185 m3/s, which was much less than the head loss measurement uncertainty. The channel head loss was, therefore, simply neglected.
Fig. 3. Measured flow rate and trash rack loss and computed head loss coefficient
Instantaneous water flow rate was determined from the turbine operation diagram with the accuracy 1 % from the nominal flow rate. Simultaneously, the signals from the level transmitters were acquired via a computer every 15 minutes, and saved, together with the water flow rate, to the computer’s hard disk. It was, therefore, possible to apply Eq. (6) and calculate total head-loss at 15 minutes intervals. Fig. 3 shows the characteristic head-loss and flow rate time-history acquired during a 3 day period. There are three long operation periods and four short periods when the aggregate stood still and flow rate was 0. Significantly high variations in the flow rate were observed during the aggregate’s operation and, therefore, the variations of head loss, which changes with the second power of velocity (Eq. (1)), are even higher. Their frequency and amplitude agree well with the flow rate variations,
and prove that the sensors were chosen correctly and that the measurements were performed adequately. Also shown, is a computed head loss coefficient which follows from Eq. (1). Its mean value is approximately 0.79, while its fluctuations within ± 0.1 interval (σ = 0.04) correspond to measurement uncertainty.
1.3 Clogged Trash Rack Losses
Comparison between the theoretical head loss using Kirschmer’s development and laboratory tests have found that, for a clean rack, the theory underestimated the head loss by a factor of 1.75 to 2 [4]. This factor, which is increased greatly when the rack begins to become clogged with debris, was found to be as high as 4 with 50 % clogging [4]. As already mentioned in Section 1.2, Meusburger [7] carried out an extensive set of model tests and proposed Eq. (4) to account for the flow area blocked by the accumulated debris AAD. Using Eqs. (5) and (4) it is, therefore, possible to calculate blockage factor:
p K
K
= ⋅
+⋅
ξθ
ξθ
sin
sin
,
2
3
2
3
1
(8)
when the head loss coefficient is known, and then estimate AAD:
A p A A AAD RF RS AH= ⋅ − +( ). (9)
If the Eqs. (8) and (9) are applied for a set of experimental data acquired during a longer time period, one can obtain the debris accumulation variation with time. However, it is important to start the computation at the moment when the trash rack is 100 % clean (AAD = 0 m2), which is only after the general refit, otherwise the history of debris accumulation is not known, and any debris wedged permanently between the bars which cannot be removed by standard rack cleaning, may deteriorate results significantly. Thus, it was decided to skip the results measured before the general refit (October till February) and use the rest of the experimental data acquired within the 8 month operation period between February 21 and October 1, starting immediately after the general refit of the aggregate. During the refit, the trash rack was dismounted for any necessary repairs and cleaning. After the refit, the trash rack operated in a clean state for a period long enough to acquire data on its operation and adopt Eq. (5) for correct energy loss prediction of the clean trash rack (AAD =

Strojniški vestnik - Journal of Mechanical Engineering 66(2020)2, 142-152
147Evaluation of Clogged Hydropower Plant Trash Rack Losses
0 m2). One week of data on the flow rate and head losses measured immediately after the refit were used in our case. The blockage area of a clean trash rack (Eq. (4) at AAD = 0 m2) was adjusted step-wise until the measured head loss coefficient and the one predicted by Eq. (5) fit together well (R2 > 0.999), and the correct total blockage area of a clean trash rack was acquired, corresponding only to the bars and horizontal spacing elements (ARS + AAH). This was then applied in Eq. (9) to calculate the blockage area caused by the debris AAD for any measured point. Fig. 4 shows the variation of AAD within the observed period. The results are highly scattered, the first two weeks’ standard deviation is approximately 1 m2. Therefore, moving average was applied to represent the data more clearly, as well as an approximation line was added to point out some important features, like periodic trash rake cleaning. For the first two weeks the trash rake was operating clean. It was winter time, when the river, as well as the debris concentration, is low. The first rack clogging is observed in early spring, when melting snow increases the flow in lowland tributaries, and pushes some of the collected debris into the river. Frequent cleaning, every end of the week (see saw like shape of AAD), keeps the amount of the collected debris low. Much more intense rack clogging takes place in mid spring and early summer, when frequent rain and thunderstorms spill debris collected in the surrounding forests during the winter into the river. Moreover, the water level is high during this period, due to melting snow in the Alps, with a lot of drifting debris originating from over-flooded river banks.
The debris collection rate is high during this period, and, although cleaned frequently, the rack clogging is substantial, even more, the rack cleaning is aggravated, and some debris remain on the rack after cleaning. The blockage factor p increases up to 45 % and almost never decreases below 30 % during
this period, which increases head losses substantially and reduces electricity production. In mid-August, an intervention rack cleaning took place, and, after that, the cleaning was shifted from Friday to Tuesday and the cleaning period was increased to two weeks in September, which is seen clearly in Fig. 4.
2 RESULTS AND DISCUSION
2.1 Debris Caused Head Losses
Hribernik [17] and [18] showed how to predict debris caused head losses when a clean trash rack head loss model is known. A simpler approach to account for debris caused head losses is to apply Eqs. (4) and (5) and set the AAD to zero, and deduct this way calculated clean trash rack losses from the measured ones. A result is shown in Fig. 5, where the cumulative one year energy losses and the variation of the flow rate are presented. The losses are flow rate dependent, thus, the increase in cumulative losses is the highest in the autumn high water season and, at the same time, due to the high concentration of drifting trash such as dead algae and leaves, the influence of the collected debris on cumulative losses is the highest too. During one year of operation, debris causes up to 135 MWh of electricity losses, which is 48 % of all losses, and 60 % of all these losses take place in the relatively short three-month-long autumn high water period. Fig. 5 also shows that the aggregate was not operating between January 25 and February 21 when the refit took place.
2.2 Trash Rack Clogging
Trash rack clogging is a random process which is not easy to predict. However, as already shown in Section 1.3, an analysis of trash rack clogging is possible if one calculates the blockage area caused by the debris
Fig. 4. Variation of AAD and blockage factor p between February 21 and October 1

Strojniški vestnik - Journal of Mechanical Engineering 66(2020)2, 142-152
148 Hribernik, A.
AAD for any measured point of the HPP aggregate head loss-time history. Moreover, the rate of growth of the area blocked by the accumulated debris dAAD/dt can be estimated simply by differentiating AAD; time history shown in Fig. 4. Numerical differentiation was applied in our case. Since a too small time step may cause high variations due to the head loss measurement uncertainty, the time interval used was one week, which agreed with the trash rack cleaning period; trash rack cleaning took place every Friday. The results are presented in Fig. 6. Again, only the results after the aggregate general refit are shown, when the rack is clean and AAD = 0 m2 apply. In the first 2 weeks after the refit, the debris concentration in the river was low, and the debris accumulation rate equals 0. This is the winter period of low water when the concentration of debris in water is almost zero. In the middle of March, the snow starts to melt in the lowlands and moderately increased water spills the debris from the river bank into the river. Melting snow in nearby hills prolongs this process into April and, at the beginning of May, the highest spike in debris accumulation took place. It is mid-spring, when frequent rain and thunderstorms spill debris collected
in surrounding forests during the winter into the river and its tributaries. During the summer months June and July, the heavy rains become rare, however, the water flow remains high due to snow melting in the Alps and the debris accumulation is still very vivid with the average blockage rate over 5·10-4 m2/min. It then reduces a bit in August and September.
2.3 Debris Accumulation Simulation
A simple model was developed which applies the experimentally obtained rate of growth of AAD (area blocked by the accumulated debris) presented in Fig. 6 to predict accumulation of debris between the successive debris removals. It is possible to predict the instantaneous AAD simply by integrating its rate of growth in time, and starting with AAD = AAD,0 (AAD,0 = 0 m2 if all the debris have been removed successfully during cleaning) each time the debris was removed from the trash rack. As presented in Fig. 4, the rake cleaning effectiveness was not always 100 % and, from May on, some of the debris remained on the rake after cleaning. Thus AAD,0 was not simply set to 0, but it was allowed to be adjusted in order to reflect actual cleaning efficiency. A simple example is presented next to explain the application of the AAD growth model in the 9 month period from March till October 2015. Four quasi-constant flow rates were assumed, with three intervals of zero flow (aggregate standstill). The trash rack cleaning interval was set to 1 week and 3 weeks, respectively, and 100 % debris removal was assumed (AAD,0 = 0 m2). Results are presented in Fig. 7. The growth of head losses proportional to the 1.5 power of blockage factor, as well as AAD (see Eqs. (4) and (5)), may be observed in both cases. Head losses drop to 0.017 m when the trash rack is cleaned, and then the growth, with increasing amount of accumulated debris, takes place
Fig. 5. Energy losses caused by a clean trash rack and by collected debris
Fig. 6. Week to week change of average rate of growth of AAD
Strojniški vestnik - Journal of Mechanical Engineering 66(2020)2, 142-152
149Evaluation of Clogged Hydropower Plant Trash Rack Losses
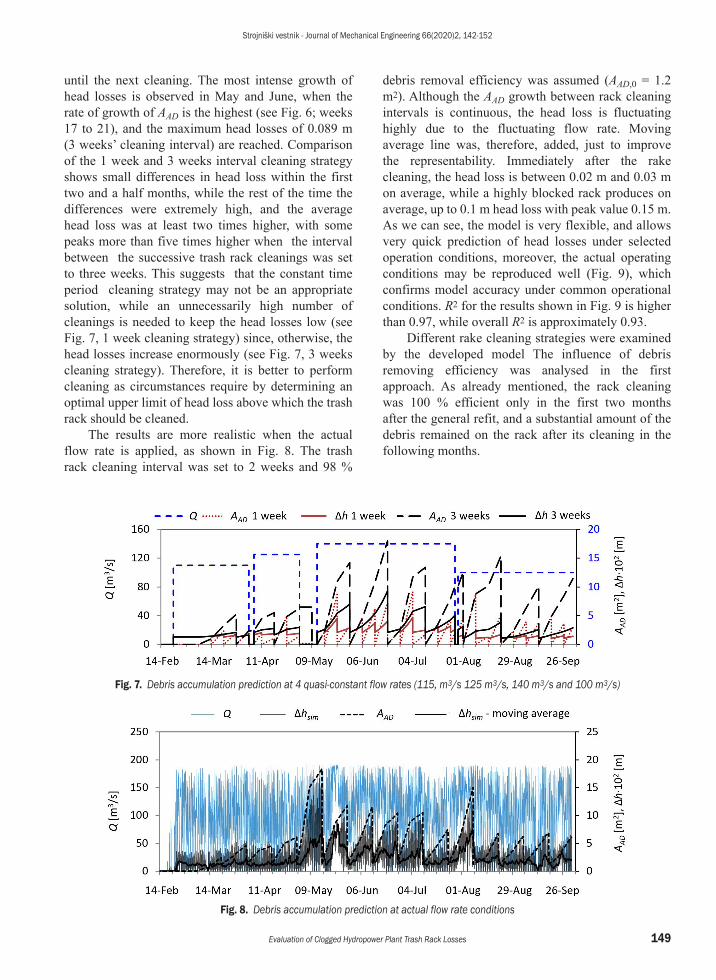
until the next cleaning. The most intense growth of head losses is observed in May and June, when the rate of growth of AAD is the highest (see Fig. 6; weeks 17 to 21), and the maximum head losses of 0.089 m (3 weeks’ cleaning interval) are reached. Comparison of the 1 week and 3 weeks interval cleaning strategy shows small differences in head loss within the first two and a half months, while the rest of the time the differences were extremely high, and the average head loss was at least two times higher, with some peaks more than five times higher when the interval between the successive trash rack cleanings was set to three weeks. This suggests that the constant time period cleaning strategy may not be an appropriate solution, while an unnecessarily high number of cleanings is needed to keep the head losses low (see Fig. 7, 1 week cleaning strategy) since, otherwise, the head losses increase enormously (see Fig. 7, 3 weeks cleaning strategy). Therefore, it is better to perform cleaning as circumstances require by determining an optimal upper limit of head loss above which the trash rack should be cleaned.
The results are more realistic when the actual flow rate is applied, as shown in Fig. 8. The trash rack cleaning interval was set to 2 weeks and 98 %
debris removal efficiency was assumed (AAD,0 = 1.2 m2). Although the AAD growth between rack cleaning intervals is continuous, the head loss is fluctuating highly due to the fluctuating flow rate. Moving average line was, therefore, added, just to improve the representability. Immediately after the rake cleaning, the head loss is between 0.02 m and 0.03 m on average, while a highly blocked rack produces on average, up to 0.1 m head loss with peak value 0.15 m. As we can see, the model is very flexible, and allows very quick prediction of head losses under selected operation conditions, moreover, the actual operating conditions may be reproduced well (Fig. 9), which confirms model accuracy under common operational conditions. R2 for the results shown in Fig. 9 is higher than 0.97, while overall R2 is approximately 0.93.
Different rake cleaning strategies were examined by the developed model The influence of debris removing efficiency was analysed in the first approach. As already mentioned, the rack cleaning was 100 % efficient only in the first two months after the general refit, and a substantial amount of the debris remained on the rack after its cleaning in the following months.
Fig. 7. Debris accumulation prediction at 4 quasi-constant flow rates (115, m3/s 125 m3/s, 140 m3/s and 100 m3/s)
Fig. 8. Debris accumulation prediction at actual flow rate conditions

Strojniški vestnik - Journal of Mechanical Engineering 66(2020)2, 142-152
150 Hribernik, A.
Fig. 9. Comparison of predicted and measured head losses
Fig. 10. Trash rack cleaning efficiency
The trash rack cleaning efficiency may be defined as:
ηclRF RS AH AD
RF RS AH
A A A AA A A
=− + +( )
− +( ),.
0 (10)
When all debris are removed from the rack, then AAD,0 = 0 m2 and the rack cleaning efficiency is 100 %, otherwise it is lower. Fig. 10 shows the rack cleaning efficiency within an 8 month period after the general aggregate refit. The concentration of the debris in the river, as well as the rack clogging, was low to moderate in the first 10 weeks of operation, and the debris removal from the rack was 100 % efficient. The debris removal efficiency reduces with increasing debris concentration and rack clogging. Its average value was approximately 95 %, with eventual drop off below 90 %. In order to evaluate the effect of imperfect rack cleaning, the simulation of head loss was performed with AAD,0 set to 0 for all performed rack cleanings. Comparison shows that the ideal rack cleaning reduces cumulative energy losses within the 8 months’ period by 18 %, and proves how important regular and thorough rake cleaning is in order to keep head losses low to moderate.
Of course, it is possible to analyse any other cleaning scenario. One of the possibilities is to apply rake cleaning every time the rake blockage factor
exceeds a certain value. The clean rake blockage factor is approximately 25 %, thus the simulations were carried out with upper blockage factor values pmax within the range 30 % and 60 %. Rack cleaning efficiency was set to 100 % in all cases. Results are presented in Fig. 11. Both energy losses and number of cleanings necessary to keep the blockage factor below pmax are highly pmax dependent. The energy losses increase while the number of cleanings reduces exponentially with pmax. Thus, almost thirty rake cleanings are necessary when pmax is set to 0.3, where the energy losses are the lowest, while already at pmax = 0.35, the number of cleanings reduces by 50 %. However, the energy losses increase by only 25 %. At pmax = 0.5, the energy losses double, while the number of cleanings reduces to 5. Any further pmax increase does not reduce the number of cleanings significantly, while the energy losses increase enormously.
Fig. 11. Trash rack losses and number of cleanings necessary to keep the blockage factor below pmax
From the economical point of view, both energy losses and number of cleanings should be kept low, especially when manually operated rakes are used, which is a common practice on medium size HPPs, and is also applied on the observed HPP where a team of two workers operates the rakes. The total cost of their interventions can be transformed into the electric energy equivalent and added to the energy losses for any pmax set. Optimal pmax may then be found simply by searching the minimum sum of energy losses and energy equivalent of the performed rake cleanings.
Fig. 12 shows three possible examples where the energy equivalent was set to 10 MWh, 20 MWh and 30 MWh, respectively, per one rake cleaning. In all three cases, the optimal pmax is between 0.4 and 0.5, where higher pmax values correspond to higher cleaning costs, and vice versa. However, the differences in total energy equivalent loss are very small within this interval for any of the three examples. It is advisable, therefore, to operate with lower pmax values, in order to keep the maximum amount of debris accumulated

Strojniški vestnik - Journal of Mechanical Engineering 66(2020)2, 142-152
151Evaluation of Clogged Hydropower Plant Trash Rack Losses
on the trash rack, as well as the mechanical load implied on the trash rack, smaller, without worsening the rack operation`s economy too much.
Fig. 12. Optimal trash rack cleaning strategy
According to Fig. 11, it is necessary to perform 9 rack cleanings if pmax is set to 0.4, which is an almost 3 times lower value than the number of cleanings actually carried out between February 21 and October 1 (see Figs. 4 and 8). Cumulative energy losses of this period are estimated to 133 MWh, and 37 % of these losses are caused by the debris, and, as already stated, 18 %, i.e. one half of them, can be avoided if the debris removal was always 100 %. It is possible to achieve the same result with only eleven 100 % effective rake cleanings, which should always take place when the blockage factor exceeds 0.375 (pmax = 0.375). Comparison of the proposed and actually carried out rack cleaning processes is presented in Fig. 13. Variation of AAD shows that any rack cleaning before April 18 may be skipped, while, later on, only approximately every second rack cleaning is necessary; however, their timing should be circumstances dependent (pmax = 0.375) and not periodical, as it was in the actual case. This way, the total number of rack cleanings reduces from 25 to 11, while total cumulative energy losses remain the
same. By keeping the blockage factor below 0.375, the maximal amount of collected debris, as well as mechanical load of the trash rack, is kept low. As shown in Fig. 13, the maximal rack area blocked by the debris is 10 m2 when pmax is set to 0.375, while it exceeded 16 m2 in the actual case.
3 CONCLUSIONS
Trash rack head losses of a 20 MW HPP aggregate were obtained and analysed experimentally. Using a rack clogging model, it was possible to distinguish clearly between the rack structure and collected debris caused losses. The latter contribute 48 % of total head losses, although the trash rack was cleaned frequently. Periodical - once a week cleaning was performed. The most severe rack clogging was observed in the spring and autumn high water periods, when the rake blockage exceeded 50 %. This worsens the aggregate economy and increases mechanical load. An attempt was, therefore, made to improve the rake cleaning strategy. Debris accumulation and the rack clogging model were applied and different cleaning strategies were examined. It was found that commonly applied periodical cleaning did not suit actual rack clogging intensity. More than 50 % of the performed debris removals were not necessary, while a one week cleaning period was too long during high water conditions. A circumstances required cleaning strategy was, therefore, suggested. Maximal allowed blockage factor was set to 0.375, and the cleaning was performed any time this value was exceeded. This way, the total number of rack cleaning was reduced from 25 to 11, while total cumulative energy losses remained the same. Moreover, the maximal amount of collected debris, as well as the imposed mechanical load of trash rack, was 40 % lower.
Fig. 13. Comparison of proposed and actually carried out rack cleaning processes
Strojniški vestnik - Journal of Mechanical Engineering 66(2020)2, 142-152
152 Hribernik, A.
4 ACKNOWLEDGMENTS
The research described in this paper was supported financially by the hydropower plant electricity production company DEM Dravske Elektrarne Maribor d.o.o. Its support is greatly appreciated.
5 REFERENCES
[1] Markovic-Hribernik, T., Murks, A. (2007). Slovenia’s climate policy efforts: CO2 tax and implementation of EU ETS. Climate Policy, vol. 7, no. 2, p. 139-155, DOI:10.1080/14693062.2007.9685643.
[2] Rakić, N.Ž., Gordić, D.R., Šušteršič, V.M., Josijević, M.M., Babić, M.J. (2018). Renewable electricity in Western Balkans: Support policies and current state. Thermal Science, vol. 22, no. 6A, p. 2281-2296, DOI:10.2298/TSCI180512169R.
[3] Hribernik, A., Fike, M., Markovič-Hribernik, T. (2013). Economical optimization of a trash rack design for a hydropower plant. Proceedings 17th International Research Conference TMT, p. 457-460.
[4] Bradley, J., Richards, D., Bahner, C. (2005). Debris Control Structures - Evaluation and Countermeasures. Department of Transportation: Federal Highway Administration, Salem.
[5] Kirschmer, O. (1926). Untersuchungen über den Gefällsverlust an Rechen, Mitteilungen des hydraulischen Instituts der TH München, vol. 1., Munich, DOI:10.1515/9783486752953-003.
[6] Levin, L. (1968). Formulaire des conduites forcées oléoducs et conduits d’aération [Handbook of Pipes, Pipelines and Ventilation], Dunod, Paris.
[7] Meusburger, H. (2002). Energieverluste an Einlaufrechen von Flusskraftwerken, PhD thesis, Bau-Ing., ETH-Zürich, Zürich.
[8] Josiah, N.R., Tissera, H.P.S., Pathirana, K.P.P. (2016). An experimental investigation of head loss through trash racks in conveyance systems. Engineer: Journal of the Institution of Engineers, Sri Lanka, vol. 49, no. 1, p. 1-8, DOI:10.4038/engineer.v49i1.6913.
[9] Osborn, J.F. (1968). Rectangular-bar trash rack and baffle head losses. Journal of the Power Division, vol. 94, no. 2, p. 111-123.
[10] Clark, S.P., Tsikata, J.M., Haresign, M. (2010). Experimental study of energy loss through submerged trash racks. Journal of Hydraulic Research, vol. 48, no. 1, p. 113-118, DOI:10.1080/00221680903566026.
[11] Raynal, S., Courret, D., Chatellier, L., Larinier, M., David, L. (2013). An experimental study on fish-friendly trashracks -
Part 1. Inclined trashracks. Journal of Hydraulic Research, vol. 51, no. 1, p. 56-66, DOI:10.1080/00221686.2012.753646.
[12] Raynal, S., Chatellier, L., Courret, D., Larinier, M., David, L. (2013). An experimental study on fish-friendly trashracks - Part 2. Angled trashracks. Journal of Hydraulic Research, vol. 51, no. 1, p. 67-75, DOI:10.1080/00221686.2012.753647.
[13] Raynal, S., Chatellier, L., Courret, D., Larinier, M. David, L. (2014). Streamwise bars in fish-friendly angled trashracks. Journal of Hydraulic Research, vol. 52, no. 3, p. 426-431, DOI:10.1080/00221686.2013.879540.
[14] Tsikata, J.M., Tachie, M.F., Katopodis, C. (2014). Open-channel turbulent flow through bar racks. Journal of Hydraulic Research, vol. 52, no. 5, p. 630-643, DOI:10.1080/00221686.2014.928805.
[15] Böttcher, H., Gabl, R., Aufleger, M. (2019). Experimental hydraulic investigation of angled fish protection systems—Comparison of circular bars and cables. Water, vol. 11, no. 5, art. ID 1056, DOI:10.3390/w11051056.
[16] Tomanova, S., Courret, D., Alric, A., De Oliveira, E., Lagarrigue, T., Tétard, S. (2018). Protecting efficiently sea-migrating salmon smolts from entering hydropower plant turbines with inclined or oriented low bar spacing racks. Ecological Engineering, vol. 122, p. 143-152, DOI:10.1016/j.ecoleng.2018.07.034.
[17] Szabo-Meszaros, M., Navaratnam, C.U., Aberle, J., Silva, A.T., Forseth, T., Calles, O., Fjeldstad, H.-P., Alfredsen, K. (2018). Experimental hydraulics on fish-friendly trash-racks: an ecological approach. Ecological Engineering, vol. 113, p. 11-20, DOI:10.1016/j.ecoleng.2017.12.032.
[18] Rak, G., Hočevar, M., Steinman, F. (2018). Construction of water surface topography using LIDAR data. Strojniški vestnik - Journal of Mechanical Engineering, vol. 64, no. 9, p. 555-565, DOI:10.5545/sv-jme.2017.4619.
[19] Klay Systems (2017), from http://www.klay-instruments.com/hydrobar-i.html, accessed on 2017-04-19.
[20] Standards/Manuals/Guidelines series for Small Hydropower Development (2013), 2.2 and 2.3 Civil Works– Hydraulic and Structural Design, Alternate Hydro Energy Center Indian Institute of Technology Roorkee.
[21] Hribernik, A. (2017). Optimization of a hydropower plant trash rack cleaning frequency. Proceedings 2017 World Congress on Advances in Nano, Bio, Robotics and Energy (ANBRE17).
[22] Hribernik, A. (2016). Influence of debris collected on a trash rack on the economics of a hydropower plant. Proceedings 20th International Research Conference TMT, p. 277-280.

![Workshop Hydropower and Fish.pptx [Schreibgeschützt] - Workshop Hydropower and Fish... · Workshop Hydropower and Fish Existing hydropower facilities: ... spawning grounds and shelter](https://img.dokumen.tips/doc/110x75/5a8733247f8b9afc5d8da3c5/workshop-hydropower-and-fishpptx-schreibgeschtzt-workshop-hydropower-and-fishworkshop.jpg)