Embed Size (px)
Citation preview

Evaluation of a Tactical Surface Metering Tool for Charlotte Douglas International Airport via Human-
in-the-Loop Simulation
Savita Verma, Hanbong Lee, Lynne Martin, Lindsay Stevens, Yoon Jung
NASA Ames Research Center Moffett Field, CA, USA
Victoria Dulchinos, Eric Chevalley, Kim Jobe, Bonny Parke San Jose State University
NASA Ames Research Center Moffett Field, CA, USA
Abstract—NASA has been working with the FAA and aviation industry partners to develop and demonstrate new concepts and technologies that integrate arrival, departure, and surface traffic management capabilities. In March 2017, NASA conducted a human-in-the-loop (HITL) simulation for integrated surface and airspace operations, modeling Charlotte Douglas International Airport, to evaluate the operational procedures and information requirements for the tactical surface metering tool, and data exchange elements between the airline controlled ramp and ATC Tower. In this paper, we focus on the calibration of the tactical surface metering tool using various metrics measured from the HITL simulation results. Key performance metrics include gate hold times from pushback advisories, taxi-in/out times, runway throughput, and departure queue size. Subjective metrics presented in this paper include workload, situational awareness, and acceptability of the metering tool and its calibration
Keywords—air traffic management, integrated operations, tactical surface metering, human-in-the-loop simulation
I. INTRODUCTION Managing departure operations in busy airport and airspace
environments, with limited data sharing and system integration, can significantly reduce efficiency and predictability. Stakeholders, including air carriers and air navigation service providers, have their own objectives in managing traffic, and often these objectives compete with one another. Also, decisions in managing traffic are often made in a reactive manner with short planning horizons due to operational uncertainties and a lack of common situation awareness between Flight Operators and service providers. For example, during periods when demand exceeds capacity at the airport, service providers manage traffic using the First Come, First Serve (FCFS) paradigm, where they serve the flights that first call in as ready for pushback. With many airlines having similar ticketed departure times, this leads to surface congestion. A departure metering tool that could meter the traffic while considering arrivals, runway crossings, etc. in a tactical manner could potentially alleviate the problem. Research on one such tool, the Spot and Runway Departure Advisor (SARDA) [1, 2] was conducted at NASA Ames Research Center. Other tools that perform departure metering include those deployed at sites such as John F. Kennedy (JFK) airport and are focused on
providing Target Movement Area entry Times (TMATs) to the airlines several hours in advance, making the tool primarily strategic in nature [3]. The tool deployed at JFK provides departure metering capability with a longer planning horizon, i.e., several hours into the future, and it also allows the users to update flight ready times and request swap flights as they know the situation better. There exists a need for a departure metering tool that is more tactical in nature and can handle the changing demand and capacity over a relatively short time horizon.
NASA is collaborating with the Federal Aviation Administration (FAA) and aviation industry partners to develop and demonstrate new concepts and technologies to solve some of these complex problems in the Integrated Arrival, Departure, and Surface (IADS) traffic management capabilities under the Airspace Technology Demonstration 2 (ATD-2) subproject. The primary goal of ATD-2 is to improve the predictability and the operational efficiency of the air traffic system in metroplex environments while maintaining or improving throughput by enhancing and integrating arrival, departure, and surface prediction, scheduling, and management systems. The IADS capabilities defined in the ATD-2 project are built upon the previous NASA research, including the Spot and Runway Departure Advisor (SARDA) [1, 2], the Precision Departure Release Capability (PDRC) [4], and the Terminal Sequencing and Spacing (TSAS) capability [5]. Benefit analysis results indicated substantial opportunities to reduce taxi delays for both departures and arrivals and increase throughput and predictability by integrating these capabilities [6].
The ATD-2 subproject is a five-year research activity that will run through 2020. In Phase 1 of the project, the Baseline IADS capability will be demonstrated at Charlotte Douglas International Airport (CLT) in 2017. In this first phase, the tactical surface scheduling capability and the user interfaces for ramp controllers and ramp traffic managers will be implemented for ramp operations. The tactical surface scheduler or metering tool was developed based on previous research conducted on NASA’s SARDA tool [1, 2]. Its key capability is the initial integrated system of tactical surface scheduling that incorporates Surface Collaborative Decision Making (S-CDM) [7, 8] principles and tactical departure scheduling to an enroute meter point that will help insert departures into the overhead departure
https://ntrs.nasa.gov/search.jsp?R=20170011256 2018-11-15T22:01:55+00:00Z
stream. This paper focuses on the Tactical Surface Scheduler, also referred to as the Metering Tool.
The tool described in this paper is tactical in nature and works over a relatively short time horizon. It is meant to provide the airline ramp controller with aircraft pushback advisories that reduce surface congestion and to respond to surface and airspace constraints that become known with greater certainty in the next 10 minutes. For this purpose, the tactical surface metering tool first estimates the capacity of current and near-future runway resources from flight schedule and surveillance data. With demand forecasts and predicted taxi trajectories, this tool computes an efficient runway schedule of aircraft within the planning horizon based on their flight readiness, Earliest Off-Block Times (EOBTs), according to a ration by schedule (RBS) rule. The tool then generates gate pushback and recommended hold time advisories to meet the runway schedule. These advisories are shown on the user interfaces for the ramp controller and the ramp traffic manager, called Ramp Traffic Console (RTC) and Ramp Manger Traffic Console (RMTC), respectively. RTC and RMTC were developed as part of the SARDA project and the research found they could successfully replace the paper strips for the ramp controllers [2].
The tactical scheduler is expected to run all the time, but the ramp manager can turn the metering on and off, according to their strategy for demand/capacity balancing. When the ramp manager decides to turn on time-based metering, he or she can choose the level of gate holding from three options - ‘Nominal hold,’ ‘Less hold,’ or ‘More hold’ - depending on the traffic situation. The ‘Nominal hold’ option seeks to utilize the existing runway capacity with the available demand. It aims to provide a gate hold level that is associated with ‘nominal’ or acceptable queues in the Airport Movement Area (AMA). Discussions with Subject Matter Experts (SMEs) at CLT provided eight aircraft in a queue as a good starting number for quantifying the ‘nominal’ level of hold. This number became the basis for the experiment matrix discussed later. The ‘Less hold’ option allows flights to spend more time on the airport surface (movement area) when compared to nominal level, whereas the ‘More hold’ option allows the flights to be held at their gates longer, thus resulting in less delay or excess queue time on the surface or movement area. These gate hold levels are associated with a metering value that defines the level of delay or excess queue time that will be incurred in the AMA.
In March 2017, NASA conducted a human-in-the-loop (HITL) simulation that integrated airspace and surface operations for CLT airport. The objectives of the HITL simulation were to evaluate the operational procedures and information requirements for the tactical surface metering tool, APproval REQuest (APREQ)/Call For Release (CFR) procedures between the Air Traffic Control Tower (ATC-T) and the Air Route Traffic Control Center (or Center), and data exchange elements between the Ramp and the ATC Tower. The results of the APREQ/CFR procedures are discussed elsewhere [9]. One of main goals in this simulation was determining the parameters to set the level of gate holding for the tactical surface scheduler’s delay propagation logic. As described above, three different levels of gate holding (and the resultant excess queue time) were manipulated for each scenario in the HITL simulation.
This paper evaluates and describes the effectiveness of the tactical surface metering tool and the results of the calibration of the gate holds by analyzing the HITL simulation results for CLT. Section II briefly provides an overview of the airport surface and airspace operations at CLT, the target test site for the simulation. Section III describes the HITL simulation method, including traffic scenarios, participants, simulation facilities and equipment, and the surface metering tool. Sections IV and V discuss the objective and subjective performance metrics from the simulation. Lastly, Section VI provides the closing remarks.
II. CLT OPERATIONS OVERVIEW According to the recent airport activity report, CLT
accommodates about 1,400 operations per day and was the seventh busiest airport in aircraft movements worldwide in 2016 [10]. Because CLT is one of the main hub airports for American Airlines (AAL), AAL and its regional air carriers operate nearly 93% of the flights into and out of the airport. The remaining operations are comprised of other regional carriers, mainline flights operated by Southwest, Delta, United and Jet Blue, military flights, business and general aviation, and air cargo. As the dominant carrier, AAL manages all ramp operations at the airport, whereas air traffic on the airport movement area (AMA) is controlled by the ATC Tower (ATC-T).
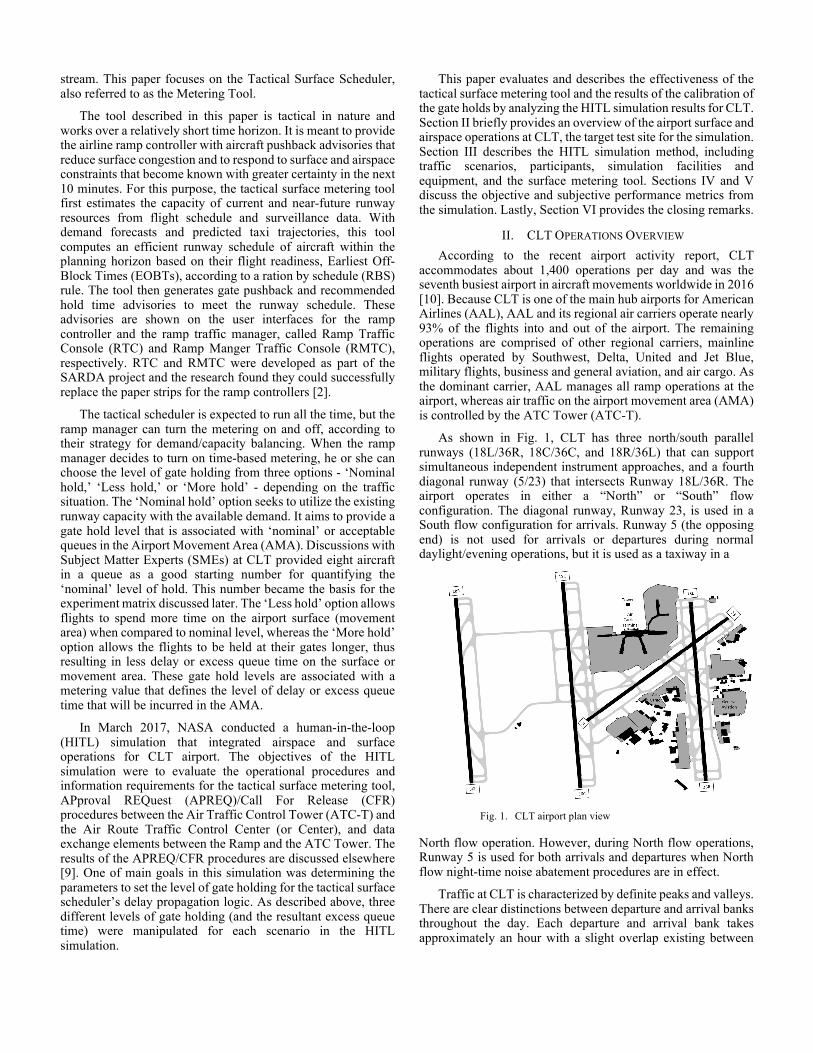
As shown in Fig. 1, CLT has three north/south parallel runways (18L/36R, 18C/36C, and 18R/36L) that can support simultaneous independent instrument approaches, and a fourth diagonal runway (5/23) that intersects Runway 18L/36R. The airport operates in either a “North” or “South” flow configuration. The diagonal runway, Runway 23, is used in a South flow configuration for arrivals. Runway 5 (the opposing end) is not used for arrivals or departures during normal daylight/evening operations, but it is used as a taxiway in a
Fig. 1. CLT airport plan view
North flow operation. However, during North flow operations, Runway 5 is used for both arrivals and departures when North flow night-time noise abatement procedures are in effect.
Traffic at CLT is characterized by definite peaks and valleys. There are clear distinctions between departure and arrival banks throughout the day. Each departure and arrival bank takes approximately an hour with a slight overlap existing between

banks. Ramp Control strives to clear the departures from the gates before an arrival bank builds up, so that ramp congestion and gate conflicts can be minimized. The ramp area is divided into four sectors (e.g., West, South, East, and North sectors). The corresponding ramp controller controls the traffic in each sector. The ramp operations at CLT are constrained due to physical limitations of the ramp, such as limited ramp space with alleys between concourses, single-direction taxiways, and limited holding areas (hardstands).
Situated between the Washington DC metroplex and the Hartsfield-Jackson Atlanta International Airport (ATL), CLT underlies one of the busiest air corridors in the U.S. This location significantly influences operations at CLT because many flights from CLT are destined to constrained airspace and airports on the East Coast. That makes CLT the subject of frequent traffic flow management constraints for managing overhead stream insertion for flights heading to both the Washington metroplex and New York metroplex areas.
Various Traffic Management Initiatives (TMIs) are used to regulate air traffic flows for managing imbalances between demand and capacity in the National Airspace System (NAS). TMIs can be divided into strategic and tactical categories, based on the impact level of the constraint and who initiates the restriction. An example of a strategic TMI is where flights are assigned departure times, known as Expect Departure Clearance Times (EDCTs), which in turn regulate their arrival time at the impacted airport. Tactical TMIs are issued by local facility traffic management personnel such as Center, Terminal Radar Approach Control (TRACON), and ATC Tower traffic management coordinators. Tactical TMIs resolve local demand/capacity imbalances in the NAS. Two widely used tactical TMIs are Miles-in-Trail (MIT) and APREQ/CFR restrictions.
III. HUMAN-IN-THE-LOOP SIMULATION METHOD This study evaluates the Tactical Surface Scheduler or
Metering Tool and determine the level of gate holds that are acceptable to both the Ramp and ATC Tower. This research effort involved both retired and active ramp controllers, one ramp manager from CLT and several pseudo pilots to effectively manage traffic. This high-fidelity simulation was conducted in the NASA Ames’ Future Flight Central (FFC) that can generate a 360-degree out-the-window view of the airport. This study also simulated FAA’s Air Traffic Control Tower (ATC-T), where the participants set runway utilization intent into the system that enables the system to automatically estimate runway capacity. From the estimated runway capacity, the surface metering tool generates Target Off Block Times (TOBTs) for individual flights and provides the controllers with its pushback advisories to throttle demand that results in mitigating surface congestion. These TOBTs are depicted on the decision support tool- Ramp Traffic Console (RTC) described in the next section.
Tools and Equipment 1. Ramp Traffic Console (RTC) and Ramp Manager
Traffic Console (RMTC)
The Ramp Traffic Console (RTC) and Ramp Manager Traffic Console (RMTC) are decision support tools developed
for the ramp controllers and ramp managers, respectively. These tools provide a display that depicts the map of the ramp area with flight strips positioned at each gate for departures. The ramp controllers can provide flight intent information, such as pushback, holding a flight, changing the spot the flight is going to, changing its gate, and marking the flight if it is sent to the hard stand, by interacting with the tool. Double clicking on the flight strip allows the user to open the Flight Menu where the user can change assignment of a flight’s spot, gate, or runway, and mark it as temporarily out of service or mark it as being sent to the hardstand. Gate pushback intent information can also be provided by the ramp controller: swiping the flight strip away from the gate marks the flight as pushback cleared, depicted with an engine symbol, whereas swiping the flight strip towards the gate marks the flight on hold by putting a red border around the flight strip (see Fig. 2). The color of the flight strips and icons shows the direction they are going to, the blue strips have destinations in the east direction whereas the brown are flying in the west direction. Arrivals are depicted as green color aircraft icons.
Flights that are moving and tracked are shown as solid aircraft icons and those that are moving but not detected by surveillance are shown as hollow aircraft icons (see Fig. 2). Tactical Surface Scheduler/ Metering Tool recommended advisories are shown next to the flight strips (see Fig. 5).
Fig. 2. Different states for flight strips and icons on RTC
The ramp manager has the ability to turn on Time-Based Metering, i.e., the Metering Tool, via the user interface provided by the RMTC (see Fig. 3). If the Time-Based Metering option is selected, the ramp manager is required to select the preferred hold level as shown in the same user interface. The input made by the ramp manager regarding gate holds provides the variable for this research. Details on the Metering Tool and how the advisories are depicted on the flight strips on RTC is described in the following section on the Metering Tool. The details on the definition of these hold levels is described in the Experiment Matrix subsection.

Fig. 3. Window on RMTC to set time based metering and level
of holds
2. Metering Tool/ Tactical Scheduler for Surface
The surface metering tool calculates Target Off-Block Times (TOBT) and provides gate hold recommendations to the ramp controller. For each departure flight, the tactical scheduler generates the Target Takeoff Time (TTOT) that would meet constraints, including runway separation criteria and TMI constraints. Next, the time a flight is required to be at a spot, called TMAT (Target Movement Area entry Time), is computed by subtracting the nominal or undelayed taxi time in the AMA with a delay buffer from the TTOT. Similarly, the nominal taxi time in the Ramp with a delay buffer is subtracted from TMAT to get TOBT for flights that are being metered. Based on the flight’s TOBT, a gate hold recommendation is provided on RTC. The delay buffer, also called ‘metering value,’ is specified in the tactical scheduler’s delay propagation logic and is used for calculation of TMATs and TOBTs. The purpose of the metering value is to control the amount of excess queue time that the flights are predicted to experience in the AMA. The larger delay buffer causes the flights to spend more time in the queue or AMA before takeoff, and therefore, allows the aircraft to push back earlier from the gate. The gate hold level (as shown in Fig. 3) selected by the ramp manager determines the value of this delay buffer.
Fig. 4. Metering Tool advisories on RTC
Flights can be marked as exempted from metering or as a
priority flight on RTC or RMTC, and the metering tool treats them accordingly. International and General Aviation (GA) flights may also be marked as exempt from metering.
The tactical scheduler regards EOBT as a flight’s ready time and uses that to generate gate hold advisories. EOBT is
calculated by the airline based on various factors such as percentage of passengers boarded, baggage loaded and more.
The tactical surface scheduler allocates runway departure slots on the timeline according to the flight’s schedule, with the order of consideration applied based on the quality of the flight’s EOBT. The tactical surface scheduler places flights in different groups based on their predictability in runway time prediction, i.e., Uncertain/Planning/Ready/Out/Taxi/Queue in ascending order. The definitions of the groups are shown in Table I.
TABLE I. DEFINITIONS OF SCHEDLING GROUPS
Group Definition Uncertain Flights with poor quality EOBT or EOBT – current
time > 10 min Planning Flights within 10 min of EOBT (i.e., EOBT – current
time <= 10 min) Ready Flights that have called in ready for pushback
Out Flights that are in pushback state Taxi Flights that are cleared for taxi
Queue Flights waiting in the runway queue Flights that are further than 10 minutes from their EOBTs
or have poor quality EOBTs (i.e., high prediction errors) are marked in the Uncertain group (Fig. 5). The flight is considered to be part of the Planning group when it is 10 minutes from its EOBT. Gate hold advisories will be shown on RTC for the flights in the Planning group. When the pilot calls in ready to push, the ramp controller is expected to swipe the flight strip for pushback or hold according to the advisory shown on the display, and at this point the scheduler marks the flight in the Ready group (see Fig. 5). When the flight is cleared for pushback by the ramp controller, it is considered to be in the Out group, and in the Taxi group when it starts taxiing. Similarly, it is considered in the Queue group when it is waiting in a queue at the runway getting ready for take-off.
Fig. 5. Different Metering tool groups and associated advisories on RT
The RTC shows a hashtag for flights in Uncertain group (Fig. 5) instead of providing a gate hold advisory. This is done to avoid fluctuations in the gate hold advisories due to the uncertainty in flight ready time. However, this does not prevent a pilot from calling in for pushback. When this happens the ramp controller can click the hashtag, and the tactical scheduler instantaneously returns the gate hold advisory and display on RTC. Flights can be moved from the Ready group to the

Uncertain group, if the flight called ready to push but did not pushback within five-minutes after its TOBT.
The tactical surface metering tool updates every 10 seconds and adjusts the schedule to accommodate uncertainties and changes in the traffic situation.
Airspace and Scenario The tactical surface scheduler and level of holds were tested
using a simulation of CLT surface operations. The CLT Ramp area is a south facing, large, semicircular area situated between runways 18L and 18C, see Fig. 1. The ramp surrounds five concourses that make up the passenger terminals at CLT, and comprises seven alleys, with 99 gates at which the airplanes park, and two hardstand areas, one on the southwest corner and the other on the northwest corner. CLT ramp control has four sectors marked as West, South, East and North as shown in Fig. 6. In the simulation, the ramp manager was seated between the West and South sector positions in the ramp.
The ramp tower was simulated in the high-fidelity Future Flight Central (FFC) tower simulation facility at NASA Ames Research Center. The tower simulator offers a 360-degree field of view provided by twelve projectors giving a realistic moving image to the viewer.
Simulation scenarios were designed to have a concentrated mix of traffic with, on average during the hour-long run under clear weather, Instrument Meteorological Conditions (IMC). The North-flow scenario had traffic fed to controllers at a rate of 75 arrivals and 65 departures per hour. In the South-flow scenario, traffic was fed at a rate of 92 arrivals and 80 departures per hour. These rates match the operational rates at CLT airport. The actual number of flights that departed and landed is shown in Table III.
Several additional events that CLT Ramp controllers regularly have to work with and that impact the metering tool’s schedule, were also built into the scenarios reflecting a number of gate conflicts, two requested changes in taxi route, and an unanticipated delay pushback (e.g., due to maintenance). Several flights were subject to tactical TMIs such as APREQ/CFRs and strategic TMIs such as EDCTs.
In this simulation, operations in the airspace surrounding the CLT ATC-T and TRACON were simulated via a mini tower created using eight monitors that provided a 220-deg field of view of the airport where the eye-point corresponded to that of the ATC-T.
Participants Five ramp controllers took part in the simulation, two were
retired and three were current American Airlines CLT ramp personnel. Participants’ years of experience as active ramp controllers (excluding training) ranged from 1-11 years (M=4.2, SD=4.0). All were generally experienced in aviation, having either worked in an ATC Tower or worked for the airline in other capacities before working as a ramp controller. In the simulation, four of the participants served as ramp controllers and one of them worked as a ramp manager for the
duration of the experiment, while the other four participants rotated through the four ramp controller positions.
The controller participants were paired with four pseudo pilots who conducted standard pilot pushback and taxi tasks, controlling the aircraft in accordance with controller instructions via simulated radio communication.
The Traffic Management Coordinator (TMC) position in the ATC-T was also staffed by active TMCs from CLT. The ATC-T TMC’s primarily role was to exercise and evaluate the APREQ process using the tools. But they also evaluated the level of holds that the flights exercised at the gates and how it impacted the queue in the AMA. There were also four ATC Tower controllers that managed the flights in the AMA.
Fig. 6. Sectors in CLT Ramp Area
Experiment Matrix The independent experiment variables used to evaluate and
calibrate the tactical surface scheduler/metering tool were runway configuration and level of hold/metering value. The runway configuration used in the simulation scenarios were North and South flow. The second independent variable, level of hold/metering value used in the metering tool, was set as 8, 10 and 12 minutes. As explained earlier, the nominal value suggested by the subject matter experts was eight, so that was used as the starting point for the metering values that were tested. The metering value specified the delay buffer or excess queue time or taxi-out time taken on the airport surface, including both ramp and AMA. The smaller metering value was associated with larger gate holds. For example, the metering value of 8 minutes was associated with ‘more gate holds’ and 12 minutes was associated with ‘less gate holds.’ The metering value of 10 minutes was associated with ‘nominal hold.’ These values were entered to the tactical scheduler via the ‘Set Metering Mode’ interface of the tool as shown in Fig. 3. One of the purposes of this study was to evaluate the metering value for the tool by getting feedback from both the ramp personnel and the ATC Tower TMCs. Table II shows the experiment matrix and the associated six simulation runs that were exercised in a random fashion.

TABLE II. EXPERIMENT MATRIX
Metering Value
Level of Gate Hold
Runway Configuration
North South 8 min More N_8 S_8
10 min Normal N_10 S_10
12 min Less N_12 S_12
IV. SIMULATION RESULTS Both objective and subjective data from the HITL simulation were analyzed to evaluate the effect of the metering value in the Metering Tool’s delay propagation logic. These were exercised under the two runway configurations - North and South flow.
Objective Measurements Table III shows simulation run information for each of six
runs, including runway configuration, metering value, run duration, number of departures and arrivals. Each run has different simulation run time ranging from 50 to 67 minutes due to limited simulation schedule. As shown in the table, these various run durations resulted in different numbers of departures and arrivals that have completed takeoffs and reached the gates, respectively.
TABLE III. SIMULATION RUN INFORMATION
Run name
Runway Configuration
Metering value (min)
Run duration (min)
Departure number (OFF)
Arrival number (IN)
N_8 North
flow
8 66.3 44 38
N_10 10 50.2 27 26
N_12 12 67.2 54 50
S_8 South
flow
8 53.4 42 28
S_10 10 52.4 41 34
S_12 12 56.3 49 43
During the simulation, the metering tool provided ramp controllers with pushback advisories, which can be either immediate push or n minutes of gate holding. The gate holding times of departures and TOBT compliance of ramp controllers were evaluated by looking at the relationship of the EOBTs, TOBTs and Actual Off-Block Times (AOBTs) of individual departures. In this study, the gate holding time of a departing aircraft is calculated by subtracting the EOBT from the AOBT. The TOBT compliance is measured by the difference between the AOBT and TOBT values.
Fig. 7 shows the mean gate holding time and the TOBT compliance for each run, with whiskers representing standard deviations. Fig. 7 shows that there is a noticeable decrease in the gate holding times for South flow runs as the metering value increases from 8 to 12 minutes. This is as expected from the tactical scheduler (i.e., the more gate holding with the lower metering value). For North flow runs, however, it seems that the gate holding time is not
Fig. 7. Mean time difference between AOBT and EOBT/TOBT for each run
associated with the metering value, nor is it affected by other factors varied in the study. The time differences between AOBTs and TOBTs are within one minute for all runs in Fig. 7. This indicates that the ramp controllers tried to follow the pushback advisories from the tactical scheduler, unless there was either a safety issue or a TMI constraint involved. In fact, the negative mean values result from the EDCT and/or APREQ/CFR flights, which ramp controllers tend to push back earlier than the recommended pushback times so as to meet the given scheduled release times. When these TMI flights are excluded from the analysis, the mean difference between AOBT and TOBT are closer to zero as seen for South 12 (S_12) condition.
Taxi-out times in the ramp area and AMA are illustrated in Fig. 8 with whiskers showing the standard deviations of the total taxi-out times. As the metering value increases it was expected that the taxi-out time in the movement area would increase because more flights would wait in the departure queue instead of being held at the gates. In South flow runs, there is slight increase in the mean AMA taxi times (4.4 min for S_8, 5.4 min for S_10, and 5.8 min for S_12) associated with the larger metering value.
In North flow runs, on the other hand, the ramp taxi times appear to be similar, but there is no clear trend on the AMA taxi times with the metering value. It seems that the taxi-out times are affected by other factors, such as simulation run time, changes of runway assignment, and TMI constraints. For instance, the total taxi time for the N_10 run is relatively short, and the shorter taxi-out time may be related to the fewer departures that completed takeoffs within the shorter run duration. Since the traffic scenarios represent one bank having a peak, the taxi delay can be further propagated to the flights scheduled in the later time window after the peak. This result depicts that the change in metering value has the potential for distributing the delay differently between the AMA and ramp area, because the metering value impacts the delay taken in the AMA.

Fig. 8. Average taxi-out time in ramp area and AMA for each run
The stacked bars in Fig. 9 show the ramp and AMA taxi-in times per arriving aircraft for each run. For South flow runs, the ramp taxi-in time decreases as the metering value increases. This can be explained by the interaction between departures and arrivals for gate utilization. More holding at the gate for departures can cause arrivals assigned to the same or adjacent gates to be delayed to avoid gate conflicts, leading to the increased taxi-in time (S_8 in Fig. 9). For North flow runs, however, it seems that the taxi times for arrivals are affected by other factors, such as run duration, runway changes, and interaction with departures. Since the taxi distance from Runway 18R/36L to the main terminal is relatively long, runway changes by a tower controller can impact the average taxi-in times
significantly. Fig. 9. Average taxi-in time in ramp area and AMA for each run
To assess departure runway throughput performance, the number of flights that take off in a given time period was compared (Fig. 10 and 11). There was no significant difference in the runway throughput for the different metering values. This implies that the tactical surface metering can maintain the current runway throughput without any loss of runway usage.
Fig. 10. Number of departures taxiing in AMA for North flow runs
Fig. 11. Number of departures taxiing in AMA for South flow runs
Data was collected on the number of departures taxiing in the movement area in order to measure the congestion level on the surface, as shown in Fig. 10 and 11. This metric represents the departure queue size for takeoffs. In the beginning of the bank in the scenarios, the surface counts look very similar, regardless of the metering value. However, as the traffic demand gets close to the peak, the aircraft counts in the AMA vary by the metering value. In both North and South flow operations, more departures are observed in AMA when the metering value is higher. This is a direct result from surface metering with different levels of gate holding.
The analysis results on the gate holding and taxi times shown above imply that those metrics are affected by the simulation run time. Fig. 12 plots the run duration with the corresponding mean gate holding and taxi-out times. Although the sample size is very limited, the mean values of taxi out times seem proportional to the run duration for North and South flow runs. Gate Hold times increase with the length of the simulation for North Flow but this trend is not clear in the South Flow. As seen in Figs. 10 and 11, the departure demand increases when the simulation time progresses. In the later part of the bank, therefore, the mean taxi-out time could increase, and the tactical scheduler would put more holding at the gates to mitigate the surface congestion.
Whereas the previous HITL simulation for SARDA [2] had assumed a fixed runway assignment, our simulation allowed tower controllers to change the assigned runway, if needed.

Fig. 12. Relations between run duration and gate holding/taxi-out times
This change can also affect the airport performance, such as runway throughput, queue lengths, and taxi times. Table IV shows the number of runway changes between Eastbound (18L/36R) and Westbound (18C/36C) departure runways for each run. For runway balancing and airport efficiency, frequent runway changes were made by the Tower or TRACON TMCs during the simulation runs. In North flow cases, for example, Runway 36R is used for the mixed operations of departures and arrivals. When consecutive arrivals were expected, several departures originally bound for 36R were sent to the Westbound runway (Runway 36C), which is mostly used for departures, but has a longer taxi time. This can explain one reason why the N_10 case shows the shorter taxi-out time on average, compared to other runs. Similarly, the runway changes for arrivals can make some impacts on the taxi-in times as well.
TABLE IV. DEPARTURE RUNWAY CHANGES DURING SIMULATION
Runway changes N_8 N_10 N_12 S_8 S_10 S_12
Eastbound to Westbound 9 4 9 5 6 9
Westbound to Eastbound 0 0 3 3 1 2
Total 9 4 12 8 7 11
Subjective measurement The study also collected subjective data such as workload,
situational awareness, acceptability of the tools and the advisories. In general, no statistical differences were seen between the North and South flow configurations. The results have been aggregated to focus on the metering value only.
Participants provided workload ratings at the end of every run using the NASA Task load index (TLX) on a scale of 1 (low)
Fig. 13. Aggregate workload ratings by metering value
to 5 (high). Fig. 13 shows the mean ratings for the subscales of workload provided by the ramp controllers and manager based on their perception of their workload at the busiest time in the run. The graph shows similar mean ratings between the different metering values (gate hold time) conditions. The trend shows that the participants perceived slightly higher mental demand, physical demand, and time pressure in the lower metering value (8 min) because it translates to higher level of holds at the gates. The trend also shows that the participants perceived lower demand, better success (reverse scale) and lower frustration with the higher metering value of 12 min associated with the lower gate holds. This data was further substantiated with verbal feedback from the participants who referred to the runs with the higher metering value (12 min) as “normal operations in the field.”
Fig. 14. Aggregate Situational Awareness ratings by metering value
Participants also provided subjective situational awareness ratings using the Situational Awareness Rating Technique (SART) that uses three subscales: understanding of the situation, demand on attention and attentional resources provided by the displays where 1 is at the lowest end and 5 is at the the highest end of the scale. Fig. 14 shows that similar mean ratings between the different metering values. However, the trend shows a slight improvement in the situational awareness on the two subscales – understanding and attentional resources

for the metering value of 12 min associated with the lower gate holds. Attentional demands were similar under all metering value conditions.
Fig. 15. Ratings for did the ‘recommended’ gate hold times make sense?
Participants were asked to rate how often they found the gate hold recommendations "making sense." The results of the data on that question are provided in Fig. 15. The smaller metering value provided longer gate holds and was also seen as "making sense" when compared to the other conditions, even though none of these values were statistically significant. In their verbal feedback, the users mentioned that the gate hold times were “just” right for all the three conditions, most of times and they generally complied with them. They mentioned that they would have changed the gate hold times on one or two flights only in the entire scenario runs.
Fig. 16. Ratings for Accepatibility of departure demand by ramp and tower participants
Participants from the ramp and ATC Tower were asked to assess the acceptability of the metering tool by asking the following questions at the end of each run. Ramp controllers were asked – “During your busiest time, how acceptable was the departure demand at the spots?” The Tower participants were asked – “During your busiest time, how acceptable was the flow of departing aircraft onto the AMA (out from the spots)? “ Their responses are shown in Fig. 16. There were no statistically significant differences between the diferrent
metering values. The graph shows that the Ramp personnel found the metering value of 10 min as slightly more acceptable whereas the ATC Tower participants found the metering value of 12 min (less gate holds) as more acceptable.
The participants were asked to assess the acceptability of the departure queue at their busiest time, at end of each run. The metering value directly impacted the departure queue size in the AMA. The data is depicted in Fig. 17, it shows that overall both ramp and tower participants found the queue close to ‘just right’. In their verbal feedback, both sets of partcipants mentioned that they preffered the queue size with the metering value of 12 min. In most cases the metering tool’s gate hold recommendations did not exceed 10 min.
Fig. 17. Ratings for Accepatibility of departure queue by ramp and tower participants
V. DISCUSSION The objective of the study was to evaluate the tactical surface
metering tool and evaluate the metering value associated with delay propagation. For the purpose of the evaluation, the metering tool was tested under three different metering values (8, 10 and 12 min) that were associated with the gate hold levels. The higher the metering value, the lower the corresponding gate hold levels recommended by the metering tool on the RTC decision support tool. To establish the best metering value that could be used as a nominal metering value, six runs were conducted in the simulated CLT airport and airspace in both the North and South flow airport configurations.
Objective results verified that higher metering values resulted in lower gate hold times. Ramp controllers adhered to the gate hold recommendations as much as possible unless there was a safety issue or TMI constraint to meet. This compliance was shown by both objective and subjective results. They found the gate hold times as ‘just right’ in all conditions. It was found that there is a potential for distributing the delay differently between the AMA and ramp area, because the metering value impacts the delay taken in the AMA. Clear trends could not be established due to lack of sufficient data points and simulation run duration. The higher metering value had the potential for increasing the taxi time in the AMA, and decreasing the taxi time in the ramp or non-movement area.
It was also found that there was no significant difference in the runway throughput when analyzed for metering value. This

implies that the tactical surface metering can maintain the current runway throughput without any loss in runway usage. This is an important finding because it means that the longer gate holds only change the distribution of where the excess taxi-out time is taken – gate or runway queue, but does not impact runway throughput.
Subjective results show that both ramp controllers and ATC-T TMCs favored the higher metering values. In this collaborative effort both the ramp and ATC Tower personnel decided that using a metering value of 12 min as the nominal level of hold would be a good starting point for the ATD-2 IADS systems at the time of deployment in the operational environment. Workload and situational awareness had similar mean ratings across the metering values, but trends did show slight improvement in both metrics as metering value increased.
During the verbal debrief sessions, controllers and TMCs provided suggestions for improving RTC and the metering tool. They mentioned losing awareness of the flight’s pushback status when the flights transferred to the Uncertain group, where flights were categorized when they did not pushback within five minutes after having been cleared. The authors also found a scheduler design issue that the metering tool always metered flights to all runways even if only one runway experiences demand capacity imbalance. This issue was found when the participants pointed that the tool was metering to a runway that had no demand. The ramp personnel also expressed the need for a predictive tool that could help them decide when to turn the metering on and off, and even play with the different metering values to see the effect of the tool on gate holds. Subject feedback was valuable and helped with further improving the system.
VI. CONCLUSIONS This study focused on studying the effectiveness of the
metering tool during a simulation evaluation, and to establish a metering value that was acceptable to both the FAA ATC Tower and American Airlines Ramp based at CLT. Both groups preferred the higher metering value as the ‘nominal hold’ in the metering tool. In general, the participants found the metering tool and its advisories acceptable. They provided feedback on improving the metering tool and the decision support tool. It is expected that this tool will undergo another level of calibration when used in the operational environment.
ACKNOWLEDGMENT The authors thank all the participants in the human-in-the-
loop simulation, including active ramp controllers and a ramp manager from American Airlines, CLT FAA ATC Tower TMCs, & FLMs, retired tower controllers, and pseudo pilots.
REFERENCES [1] Y. Jung, W. Malik, L. Tobias, G. Gupta, T. Hoang, et al., “Performance evaluation of SARDA: an individual aircraft-based advisory concept for surface management,” Air Traffic Control Quarterly, Vol. 22, Number 3, 2015, pp. 195-221. [2] M. Hayashi, T. Hoang, Y. Jung, M. Malik, H. Lee, et al., “Evaluation of pushback decision-support tool concept for Charlotte Douglas International Airport ramp operations,” 11th USA/Europe Air Traffic Management R&D Seminar (ATM2015), Lisbon, Portugal, June 23-26, 2015. [3] S. Stroiney, B. Levy, H. Khadilkar, and H. Balakrishnan, “Assessing the impacts of the JFK ground management program,” 32nd Digital Avionics Systems Conference (DASC), Syracuse, NY, October 2013. [4] S. Engelland, A. Capps, K. Day, M. Kistler, F. Gaither, et al., “Precision Departure Release Capability (PDRC) final report,” NASA/TM-2013-216533, June 2013. [5] J. Thipphavong, J. Jung, H. Swenson, K. Witzberger, L. Martin, et al., “Evaluation of the controller-managed spacing tools, flight-deck Interval management and terminal area metering capabilities for the ATM Technology Demonstration #1,” 10th USA/Europe ATM R&D Seminar (ATM2013), Chicago, Illinois, 10-13 June 2013. [6] R. Coppenbarger, Y. Jung, E. Chevalley, T. Kozon, A. Farrahi, et al., “Benefit opportunities for integrated surface and airspace departure scheduling: a study of operations at Charlotte-Douglas International Airport,” 35th Digital Avionics Systems Conference (DASC), Sacramento, California, September 25-29, 2016. [7] FAA Surface Operations Office, "Processes, Procedures, and Policy (P3) Initiative," July Plenary Meeting, July 2014. [8] FAA Air Traffic Organization Surface Operations Directorate, “U.S. Airport Surface Collaborative Decision Making Concept of Operations (ConOps) in the Near-Term: Application of the Surface Concept at United States Airports,” July, 2013. [9] L. Stevens, L. Martin, K. Jobe, B. Parke, E. Chevalley, et al., “Evaluation of Approval Request /Call for Release coordination procedures for Charlotte Douglas International Airport,” 36th Digital Avionics Systems Conference (DASC), in press. [10] Charlotte Douglas International Airport, Fast Facts and Aviation Activity Reports, April 2017. http://www.cltairport.com/News/Pages/FactsandFigures.aspx


![Tactical Surface Metering Procedures and Information Needs ... · the Spot and Runway Departure Advisor (SARDA) [2, 3] has been conducted at NASA Ames Research Center. This tool was](https://img.dokumen.tips/doc/110x75/5e812b0055330307be6556a9/tactical-surface-metering-procedures-and-information-needs-the-spot-and-runway.jpg)