Embed Size (px)
Citation preview

Case Study
Evaluation, learning and action: A case study of Targeting Ultra-Poor program
South Asian Regional Impact Evaluation Workshop Dhaka, Bangladesh April 27 2014
Munshi Sulaiman, Yale University

Making impact: An ongoing process
Action
Impact Evaluation
Learning

Brief overview of Targeting Ultra-Poor Program
• Objective – Livelihood development of the ultra-poor
• Target group – Economically active ultra-poor
• Intervention package – Asset transfer, inputs for micro-enterprise, hand-
holding, weekly stipends, health supports, social development, mobilize local supports,
• Duration – 2 years (graduate out of extreme poverty)

Targeting ultra-poor Program: Development and phases
2002 2007 2012
Microfinance experience
Lessons from IGVGD program
Phase 1 of TUP Phase 2 of TUP
Non-randomized Impact evaluation
Randomized impact evaluation
Operational research
Phase 3
CGAP’s graduation program, pilots in 8 countries…
Research on program
optimization
Why & what? How?

Start of Targeting Ultra-Poor program?
• Microfinance do not reach the ultra-poor
• Results in exclusion from other linked services (Rahman and Razzaque, 2000)
• Do not benefit even if they participate (Zaman, 2000)

Start of Targeting Ultra-Poor program?
• Need for sequencing of multiple services (IGVGD program)

Start of Targeting Ultra-Poor program?
• Experiences with IGVG program
• Do these numbers show impact of IGVGD?
75
717
415
0
100
200
300
400
500
600
700
800
1994 (pre-prog) 1996 (end-prog) 1999 (+3 years)
Mo
nth
ly in
com
e o
f IG
VG
m
em
be
r h
ou
seh
old
s

Start of Targeting Ultra-Poor program?
• Program design Component Purpose
1. Integrated targeting methodologies Effective targeting of the extreme poor
2. Income generating asset transfer Build economic asset base
3. Training and regular refreshers Ensure good return from asset
4. Technical follow-up of enterprise Ensure good return from asset
5. Provision of all support inputs Ensure good return from asset
6. Weekly stipends Reduce opportunity cost
7. Health support Reduce costly morbidity
8. Social development Awareness of rights and justice
9. Mobilizing local elite support Create an enabling environment

What are the expected outcomes of TUP interventions?
• Each component can have its own ‘theory of change’, for example
Weekly food stipend
Encourage savings
Increased financial assets
Increase food intake
Improve productivity
Reduce incentive to work
Livelihood Outcomes
- Income - Consumption - Assets - Vulnerability

A ‘black-box’ impact evaluation
Package of inputs
Asset Skills Aspirations Incentives
Impact indicators - Income - Consumption - Assets - Vulnerability
Employment Productivity

TUP impact evaluation: Phase 1
Many outcome indicators! Graph shows per capita daily food expenditure (2002 price)
TUP
Comparison group
Tk 2.8

Discussion point:
• Are these the ‘true’ impacts of the program?
• Need to know who are the comparison group to answer this question.

Participatory Wealth Ranking
Geographical Targeting
TUP impact evaluation: Phase 1
Not ultra-poor
Ultra-poor
Screening by poverty indicators

Discussion point:
• Are these the ‘true’ impact of the program?
• Not necessarily
– They may have been on different income growth paths
– Indirect effects of the interventions within the villages

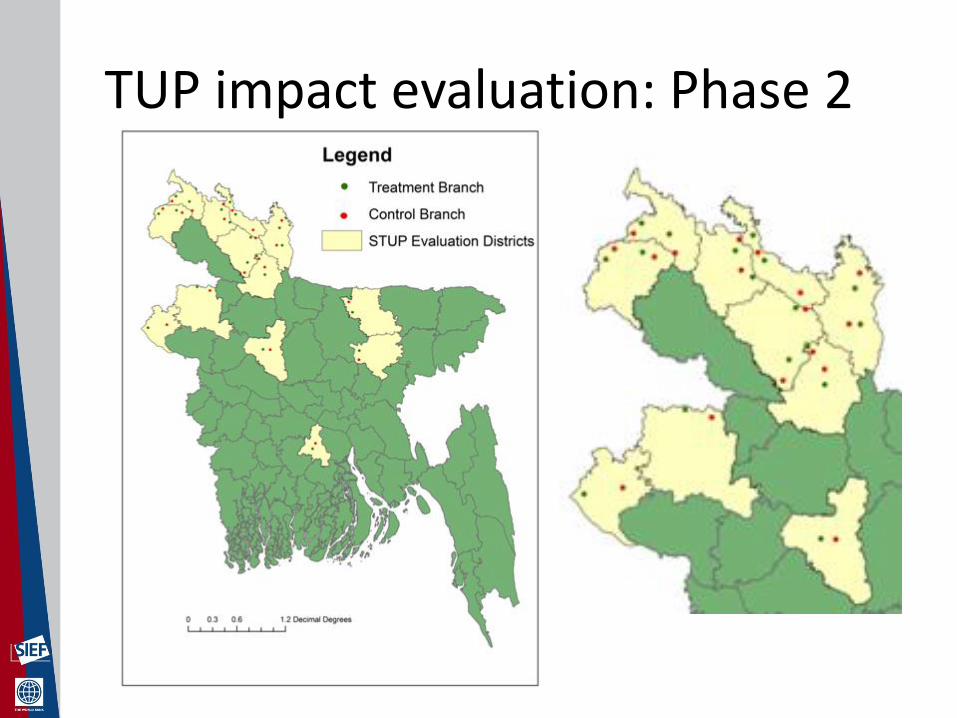
TUP impact evaluation: Phase 2
• Let’s randomize… • How?
– Randomized rollout
• At what level (household vs. village vs. branch) – Operational feasibility (village/branch) – Statistical power (household) – Spillover effects (village/branch) – Anticipation or discouragement effects (branch) – Contamination (branch) – Research costs (household)
TUP impact evaluation: Phase 2

TUP impact evaluation: Phase 2
• Targeting done in all branches in same fashion
• Compare baseline (2007) balance Characteristics Average Normalized
Difference Number of obs Control Treat
Household size 3.105 3.376 0.114 6,819 Number of children below 10 0.729 0.878 0.107 6,819
Male headed HH 0.523 0.628 0.151 6,816 Main female never been in an NGO 0.857 0.886 0.061 6,818 Whether received any govt. benefit 0.191 0.202 0.018 6,819
Respondent is literate 0.067 0.076 0.026 6,789 Years of schooling of main female respondent 0.522 0.599 0.033 6,789
Per capita calorie intake 903.200 901.741 -0.003 6,377 Per capita food expenditure 2877.362 2969.947 0.050 6,377
Per capita non-food expenditure 1034.110 1024.761 -0.004 6,478 Per capita total expenditure 3910.114 3997.606 0.027 6,369 log of wealth 7.038 6.967 -0.031 6,417

TUP impact evaluation: Phase 2
• Maintain compliance with design
– Branch level randomization almost eliminated possibility of contamination
– Less than 1% control households received intervention by 2nd follow-up (in 2011)
• Attrition
– 13% of the eligible households

TUP impact evaluation: Phase 2
0
1000
2000
3000
4000
5000
6000
7000
8000
9000
10000
Baseline 2-year after 4-year after
Pe
r ca
pit
a an
nu
al in
com
e
(in
20
07
BD
T)
Treatment Control
Impact on per capita annual income: - Tk. 807 in 2 years - Tk. 1,379 in 4 years

TUP impact evaluation: Phase 2
• The program has impact beyond target households
– Wage rates for house maid job increase by 10% in intervention communities
– Wage employment of other non-beneficiary ultra-poor increases by 8%
– Their total earning increased by 6%

Cost-effectiveness
• Program costs 20,700TK per HH, yields 1754 TK per year
• Return on MFI accounts 4-5%
• 20,700 at 4.5% yields 932<1754
• Would be useful to compare to cash transfer