Embed Size (px)
Citation preview

EVALUATION AND COMPARISON OF THE SEALING PERFORMANCE OF
THREE MAJOR TYPES OF JAR LIDS AVAILABLE FOR HOME CANNING
by
GEETHA SIVANANDAM
(Under the Direction of Elizabeth L. Andress)
ABSTRACT
Home canning allows people to preserve seasonal foods and to prepare products
that help meet personal dietary needs. There has been increasing interest among people to
use reusable lids. Currently, there is no scientific evidence on the sealing performance
and reliability of reusable lids. The objective of this study was to evaluate and compare
the sealing performance and retention of food quality of three lid systems (metal, plastic
and glass) during storage (24h, 10d, 1 and 3mo). These lids were subjected to four
different treatments in closing jars (recommended, unwiped, overfilled and combination)
using three different foods (tomatoes, apples and carrots) and a total of 192 of each lid
type were used. Our results demonstrated that all three lid types had acceptable sealing
performance and vacuum levels with all the treatments. However, for best results we
would recommend the traditional two-piece metal lid system for highest confidence in
sealing.
INDEX WORDS: Home canning, lids, sealing performance, reusable lids, tomatoes,
carrots, apples

EVALUATION AND COMPARISON OF THE SEALING PERFORMANCE OF
THREE MAJOR TYPES OF JAR LIDS AVAILABLE FOR HOME CANNING
by
GEETHA SIVANANDAM
B.Sc., Bharathiar University, India, 2005
M.Sc., Bharathiar University, India, 2007
M.Sc., Annamalai University, India, 2009
A Thesis Submitted to the Graduate Faculty of The University of Georgia in Partial
Fulfillment of the Requirement for the Degree
MASTER OF SCIENCE
ATHENS, GEORGIA
2014

© 2014
Geetha Sivanandam
All Rights Reserved

EVALUATION AND COMPARISON OF THE SEALING PERFORMANCE OF
THREE MAJOR TYPES OF JAR LIDS AVAILABLE FOR HOME CANNING
by
GEETHA SIVANANDAM
Major Professor: Elizabeth L. Andress
Committee: Barbara M. Grossman
Judy A. Harrison
Electronic version Approved:
Julie Coffield Interim Dean of the Graduate School The University of Georgia December 2014

iv
DEDICATION
To my husband Dr. Balasubramanian Manickam, my baby boy Ishaan Bala
Manickam, my parents Mr. Nanjunda Sivanandam and Mrs. Vasuki Sivanandam, my in-
laws Mr. Manickam and Mrs. Rajalaxmi Manickam, my brother Mr. Balaji Sivanandam,
and my sister-in-law Mrs. Hemalatha Saravanan and family (especially to my niece Jo).

v
ACKNOWLEDGEMENTS
I would like to express my deepest gratitude to my major advisor, Dr. Elizabeth L.
Andress for her guidance, painstaking efforts, and patience throughout this journey.
Without her, this thesis would be far from complete. I’m greatly indebted for her
confidence in me and teaching me the fundamentals of home canning research. It was a
great privilege to work in her lab, and I’m so grateful for her invaluable suggestions,
constructive criticisms and warm encouragement that truly inspired me and made me
evolve as a better scientist and person.
I’m extremely grateful to my thesis committee members, Dr. Judy A. Harrison
and Dr. Barbara M. Grossman for their valuable suggestions and comments which greatly
helped me in tailoring my thesis research to its present shape.
I owe a special word of thanks with great fondness to Dr. Mary Ann Johnson for
her support and encouragement throughout my period of stay at UGA.
I am thankful to Kasey Christian for her timely help and technical assistance
throughout the study.
I’m sincerely thankful to Carolyn Ainslie, Tamara Myles, Kendall Smith and
Rosemarie Rooker for their support and warm friendship.
I’m extremely thankful to the faculty members of the department of Foods and
Nutrition at the University of Georgia for their kindness and support.

vi
I gratefully acknowledge the timely support rendered by Lainer, Lewis and Carlos
at the Instrumentation division of UGA in designing the vacuum gauge instrument and
Dr. Kim Love-Myers and Hejiao Hu at the UGA Statistics Consulting Center for their
help in statistical analysis for my project.
Words wouldn’t be powerful enough to express my indebtedness to my family for
their unconditional love, unwavering support, advice and blessings in all endeavors of my
life.
This material is based upon work supported by the National Institute of Food and
Agriculture, U.S. Department of Agriculture, under Agreement No. 2011-51110-30995.

vii
TABLE OF CONTENTS
Page
ACKNOWLEDGEMENTS .......................................................................................v
LIST OF TABLES .....................................................................................................xi
LIST OF FIGURES ...................................................................................................xiv
CHAPTER
1 INTRODUCTION .........................................................................................1
2 LITERATURE REVIEW ..............................................................................4
Genesis of Home Canning .......................................................................4
History of Home Canning Lid Closures ..................................................5
Contemporary Interest in Home Canning ................................................8
Botulism ...................................................................................................9
Canners ....................................................................................................12
Processing Times .....................................................................................12
Lid and Jar Selection and Performance ...................................................14
Objectives, Hypothesis and Specific Aims ..............................................18
3 METHODS ....................................................................................................20
Study Design ............................................................................................20
Treatments................................................................................................21
Materials ..................................................................................................23
Lids and Jars ............................................................................................23

viii
Product Evaluation ...................................................................................25
Preparation of Foods for Canning ............................................................30
Canning Process .......................................................................................36
Post Processing Analyses ........................................................................38
Statistical Analyses ..................................................................................41
4 RESULTS .....................................................................................................42
Fill Weight of Foods ................................................................................42
pH Studies ................................................................................................42
Headspace Analyses .................................................................................46
Vacuum Studies .......................................................................................48
Colorimetric Measurements ......................................................................61
5 DISCUSSION ................................................................................................70
Storage at Two Different Temperatures ..................................................70
pH Studies ................................................................................................71
Vacuum Studies .......................................................................................72
Colorimetric Measurements .....................................................................75
6 SUMMARY AND CONCLUSIONS ...........................................................77
Suggestions for Future Research .............................................................81
REFERENCES .........................................................................................................83
APPENDICES ...........................................................................................................89
A SUBJECTIVE VACUUM RATINGS FOR GLASS LIDS ........................89

ix
Table. A.1. Subjective vacuum ratings obtained in foods canned with
glass lids for all closing treatments combined at different
storage periods ...................................................................89
Table. A.2. Subjective vacuum ratings obtained in foods canned with
glass lids using different closing treatments in low-acid
foods processed in a pressure canner vs. high-acid foods
processed in a boiling water canner ..................................90
B ADDITIONAL COLORIMETRIC MEASUREMENTS ...........................91
Table. B.1. Colorimetric comparisons of hot-pack crushed tomatoes
canned with three lid types stored for various periods at
21+1°C, with all closing treatments combined .................91
Table. B.2. Colorimetric comparisons of hot-pack sliced carrots
canned with three lid types stored for various periods at
21+1°C, with all closing treatments combined .................92
Table B.3. Colorimetric comparisons of raw-pack sliced carrots
canned with three lid types stored for various periods at
21+1°C, with all closing treatments combined .................93
C STEP BY STEP PROCESSING OF FOODS .............................................94
Figure C.1. Step-by-step process of canning hot-pack sliced apples ..95
Figure.C.2. Step-by-step process of canning hot-pack crushed
tomatoes ...........................................................................97
Figure C.3. Step-by-step process of canning hot-pack sliced carrots .99
Figure C.4. Step-by-step process of canning raw-pack sliced carrots .101

x
D LIST OF EQUIPMENT AND INGREDIENTS .........................................103
Home Canning Equipment and Supplies .............................................103
Laboratory Equipment .........................................................................103
Food and Ingredients ...........................................................................104
E VACUUM GAUGE ASSEMBLY ..............................................................106
Figure E.1. Parts of the vacuum gauge ................................................106

xi
LIST OF TABLES
Page
Table 2.1: History of canning jar discovery ...........................................................................6
Table 3.1. Headspace and surface cleaning with different treatment and food types ............21
Table 3.2. Lid types and treatment configurations inside 18 canner loads for each food
type .......................................................................................................................22
Table 3.3. Distribution of food types and treatments for each home canning lid type ..........25
Table 3.4. Distribution of the 12 jars within a given treatment across different storage
periods and incubation temperature .....................................................................28
Table 3.5. Target fill weights of food and liquid for four food types in pint or ½ - liter
home canning jars with three different lid types ..................................................32
Table 3.6. Processing times and initial canner water temperature for each food type ..........38
Table 4.1. Average fill weight of food and liquid for different food types and closing
treatments in two jar sizes ....................................................................................44
Table 4.2. pH of raw, cooked and canned foods including various storage intervals for the
canned products ...................................................................................................45
Table. 4.3. Post processing headspace for all food types by treatment with 24 hour and all
storage observations combined ............................................................................47
Table 4.4. Number of seal failures in three lid types by food types during two storage
temperatures .........................................................................................................48

xii
Table 4.5. 24-Hour vacuum levels for all canned foods using different lid types and
closing treatments ................................................................................................49
Table 4.6. Vacuum levels obtained in all jars of foods canned with metal and plastic lids
using four treatments............................................................................................52
Table 4.7. Subjective vacuum ratings for foods canned with glass lids using four
treatments .............................................................................................................53
Table 4.8. Vacuum levels obtained in foods canned with metal and plastic lids for all
closing treatments combined at different storage periods ....................................55
Table 4.9. Vacuum levels obtained in foods canned with metal and plastic lids using
different closing treatments in low-acid foods processed in a pressure canner
vs. high-acid foods processed in a boiling water canner .....................................57
Table 4.10. Comparison of vacuum levels between metal and plastic lids for different
types of canned food for all storage periods and closing treatments combined .58
Table 4.11. Mean colorimetric measurement of foods at 24 hours after canning .................61
Table 4.12. Colorimetric measurement of hot-pack sliced apples canned with three lid
types by storage periods at 21+1°C for all closing treatments combined ..........65
Table 4.13. Colorimetric measurement of hot-pack crushed tomatoes canned with three
lid types by storage periods at 21+1°C for all closing treatments combined .....66
Table 4.14. Colorimetric measurement of hot-pack sliced carrots canned with three lid
types by storage periods at 21+1°C for all closing treatments combined ..........67
Table 4.15. Colorimetric measurement of raw-pack sliced carrots canned with three lid
types by storage periods at 21+1°C for all closing treatments combined ..........68

xiii
Table 4.16 Colorimetric comparisons of hot-pack sliced apples canned with three lid
types stored for various periods at 21+1°C, with all closing treatments
combined ............................................................................................................69

xiv
LIST OF FIGURES
Page
Figure 3.1. Distribution of lid and treatment combinations among three standard canner
configurations .....................................................................................................22
Figure 3.2. Different types of lids ..........................................................................................24
Figure 3.3. Vacuum gauge mount on 5-speed drill press for measuring headspace vacuum
with home canning metal and plastic lid systems ..............................................29
Figure 3.4. Vacuum gauge in use on drill press for measuring headspace vacuum in jars
canned with metal and plastic lid systems ..........................................................30
Figure 3.5. Measuring color of the food using the HunterLab Colorimeter ..........................40
Figure 4.1. Comparison between metal and plastic lids in hot-pack crushed tomatoes for
all storage periods and treatments combined .....................................................59
Figure 4.2. Comparison between metal and plastic lids by treatment for all storage
periods combined ...............................................................................................60

1
CHAPTER 1
INTRODUCTION
Interest in home food canning has increased over the past few years in the United
States (Centers for Disease Control and Prevention 2012). According to one survey (CDC
2012), about 20% of U.S. households can their own food and 65% of those households
can vegetables. Many home canners are unaware of the food safety concerns like risks of
botulism, a fatal foodborne illness that results from improperly canned foods (CDC
2012). Home canned vegetables are frequently associated with botulism outbreaks in the
U.S. CDC (2012) reported 116 outbreaks of foodborne botulism during 1996 to 2008. Of
the 48 outbreaks from home canned foods, 38% were from home-canned vegetables
(Date et al 2011). There are also issues in home canning related to preventing spoilage
and color loss. Simultaneously there has been an increasing interest shown by consumers
in the usage of reusable canning lids available in today’s market place (Andress 2010).
Kuhn and Hamilton (1976) studied the sealing performance for nine different lids in the
1970s, but except for the traditional two-piece metal lids, all the other lids they tested are
not currently available in the market. Although the above study provides preliminary data
about the successful sealing performance of two-piece metal lids, newer reusable lids
lack similar scientific evidence for their successful preservation of food (Andress 2010).
Significant research was done in food preservation during the 1980s and early
1990’s for the United States Department of Agriculture (USDA) and major changes were
introduced (NCHFP 2014; Spurling 2006). USDA (2009) has two processing methods

2
considered acceptable for canning most foods in the home. Fruits, tomatoes and pickled
vegetables may be canned in boiling water using USDA recommended processing times
(USDA 2009) because these foods are considered to be acid enough to protect against
botulism. Foods appropriate for boiling water canning must have a pH ≤4.6. Vegetables,
meats, poultry, seafood and mixtures of foods with a pH>4.6 are considered to be low-
acid foods and must be processed using USDA recommended times in a pressure canner
(weighted-gauge or dial-gauge) to destroy spores of Clostridium botulinum which could
cause botulism poisoning if allowed to survive at these pH levels.
USDA (2009) also has recommendations about jars and lids to be used for
successful home canning. The current procedures recognize the suitability of a
traditional two-piece metal home canning lid; it is the lid system that has been used with
previous USDA research and found to function with good success in the previous work
by Kuhn and Hamilton (1976). USDA also recommends placing properly canned jars in a
cool, dry place to retain best food quality at least for a year. Storing canned foods in
warm places (ex. near hot pipes, direct sunlight or furnace) may result in loss of color as
well as consumable quality within weeks to months depending upon the temperature.
Also, dampness may corrode traditional two-piece metal lids (USDA 2009).
There are two other major home canning jar and/or lid systems in the marketplace
today. One is a lid system with a reusable plastic lid that can be used with any standard
home canning jar and the other is a glass lid system manufactured specifically for jars
from the same manufacturer. They currently are not described in USDA home canning
procedures. The objective of this study was to fill in the knowledge gaps about the
sealing performance of the three major home canning lid systems available in today’s

3
market place through a comparative study. It is essential to scientifically examine the
performance of reusable lids with respect to sealing rates, ease of use and ability to create
and hold vacuum seals before people invest their money into new products to preserve
their foods at home.
The overall hypothesis was that all three lid systems tested will have sealing
performance and retention of food quality to the currently accepted standards. This study
will provide some of the first scientific evidence about the sealing and storage
performance for these lid systems available in the marketplace. The methods used in the
study will serve as a model and will facilitate other research in evaluating and comparing
the performance of lids under other conditions, such as using other food types. Overall
this study is intended to benefit and encourage improved home canning practices in U.S.
households.

4
CHAPTER 2
LITERATURE REVIEW
Genesis of Home Canning
Many of our food preservation techniques date back to as early as 12,000 B.C.
(Nummer 2002), but canning is comparatively one of the newer techniques in food
preservation that dates back to the late 18th century and originated in France (Trafton
2011). In 1795, Emperor Napolean Bonaparte offered 12,000 Francs to develop a new
reliable, safe method of food preservation to feed his continuously travelling army (Can
Manufacturer Institute 2013; Milner 2004; VanGarde and Woodburn 1994). In the
1790’s, a French confectioner, Nicolas Appert (father of canning), demonstrated that food
filled in sealed glass bottles processed in a water bath for a certain temperature and time
can preserve the food inside the container against deterioration similar to wine
preservation (Can Manufacturers Institute 2013; Milner 2004; Nummer 2002). Nicholas
Appert’s principle of canning foods first introduced was successfully tested by the French
Navy in 1806 by feeding their troops every year with about 24,000 large cans (nearly
40,000 pounds) of foods like meat, vegetables, fruits and milk (Can Manufacturers
Institute 2013; Nummer 2002).
In 1810, a British merchant named Peter Durand established a method of
preserving food using an unbreakable tin container based on Appert’s principle. This can
could be sealed in an airtight manner but not break like glass. He received the first patent
on August 25, 1810 by King George III of England (Can Manufacturers Institute 2013;
5
Nummer 2002). In 1813, the tin container was perfected by Bryan Dorkin and John Hall
who built the first commercial canning factory in England (Can Manufacturers Institute
2013). In 1812, Thomas Kensett started a small canning plant in the New York waterfront
and started canning sealed salmon, lobsters, oysters, meats, fruits and vegetables. Soon
they switched to the use of tin containers because glass was expensive, and they also
experienced difficulty in packing glass containers. In 1825, President James Monroe
awarded the U.S. patent to Thomas Kensett and his father-in-law, Ezra Daggett for
preserving food in “vessels of tin” (Can Manufacturers Institute 2013).
History of Home Canning Lid Closures
A century after Napoleon’s food preservation challenge, people understood the
mechanism behind food preservation through canning by Louis Pasteur. Louis Pasteur
demonstrated that growth of microorganisms on food causes food spoilage (Nummer
2002). Simultaneously, during the US civil war times, glass jars, metal clamps and
replaceable rubber rings were invented for food preservation. These jars are currently
used to store dry foods. Mason jars were the most popular fruit jars at the time in the
industry to the extent that they become the common term for fruit jars (Chesswood 2008).
Several discoveries that impacted canning practices were made in the field of food
microbiology in the mid-19th century. Consequently, waxed paper, leather, or skin, cork
stoppers and wax sealers were replaced by the zinc cap. John Landis Mason in 1858
developed and patented a shoulder-seal jar with a zinc screw cap. The threaded neck in
the Mason jars was compatible with the threads in the metal caps in such a way that they
were able to screw up to the shoulder and form a nice seal. It was only in 1869 that a top
seal above the threads and under a glass lid was introduced to the jar (Chesswood 2008;

6
Milner 2004). Descriptions of canning jars and their closures from 1850 through 1915
are presented in Table 2.1 (Milner 2004).
Table 2.1. History of canning jar discovery
Year of discovery/ inventor
Jar type/ innovation Comments/ description
1850 - 1890 Wax-seal closures Simple metal cap sealed into a groove in the bottle rim with wax
1855 Robert Arthur Glass groove-ring wax sealer
Originally produced in metal, which the manufacturer poured around the mouth of the container. All the food preparer had to do was heat the lid and press it into the cement. A few others patented similar techniques of sealing tin cans without soldering.
1896 - 1912 Wax-seal closures Ball Standard jars with wax sealed closures were made
1858 Mason jar (patent) A glass container with a thread molded into its top and a zinc lid with a rubber ring.
1861 (patented by John M. Whitall, Philadelphia)
Thumb screw clamp and glass lid design (The
Millville Atmospheric Fruit Jar)
The large yoke-shaped cast metal clamp holds down a glass lid which fits over a grooved mouth or into the jar neck. Around the lid the user laid an India rubber gasket which affected the seal. Significance in this jar is the metal never touches the food.
1863 – 1870’s (Adam R. Samuel at his Keystone Glass Works in Philadelphia, manufactured many of the jars employing the Kline patent).
Kline Stopper A gasket sealed the jar between the solid glass stopper and inside of the jar mouth. As the jar cooled a vacuum formed, pulling the stopper into the mouth of the jar. Needless to say, this

7
system proved to be frustrating when it came to pulling out the stopper.
1870 Mr. Mason (produced by the Consolidated Fruit Jar Company of New York and of New Brunswick, New Jersey)
New kind of threaded-top jar
Jar employed a glass lid and a screw band. Similar to the thumb screw.
1882 Henry William Putnam of Bennington, Vermont
Lightning jars A glass lid and a metal clamp to hold the lid in place. Many similar glass lid and wire-bail scheme of the Lightning jar were produced for home canning into the 1960s and are still found on novelty jars today.
1800 – 1964 (Hazel-Atlas Glass Company)
Atlas E-Z seal It is a type of lightning jar. The difference is a raised lip to help keep the jar from cracking
1903 (Alexander H. Kerr, Hermetic Fruit Jar Company) (Patents given to 2 people, one to Alexander H. Kerr, and the other to Julius Landsberger)
Economy and self-sealing jar
A metal lid with a permanently attached gasket. The lids were easy to use and inexpensive. The Economy jars had wide mouths and were easy to fill.
1903 – 1909 (The Illinois-Pacific glass company made the early economy jars)
Economy jars
1915 Kerr A smaller, flat metal disk with the same permanent composition gasket. The lid sealed in the top of a mason jar; a threaded metal ring held the lid down during the hot water processing. This allowed re-use of old canning jars together with inexpensive and easy to use disposable lids. This two-part lid system transformed home canning safety and still is in use today.

8
Later in the 1900’s, various types of home canning jars and lid closures were used
for studies about lid closure practices, lid venting, liquid loss and residual oxygen
retention. Fellers et al (1937) documented the liquid loss caused by home canning bail-
type wire closures using a pressure canner. In the 1940’s, Esselen and Fellers (1948)
studied venting and liquid loss using different processing procedures in jars available at
the time which included bail-type jars, two-piece metal lids and three-piece glass lids.
Kuhn and Hamilton (1976) studied the functioning of lids in the marketplace at that time,
documenting 9 different types being sold; only the two-piece metal lid system from that
study is still in use. Several sources have documented that the majority of home canners
in the U.S. have used the two-piece metal lids the past few decades (D’Sa et al 2007;
Kuhn and Hamilton 1976). Some consumers in the U.S. use a glass lid system made in
Germany that is also the primary jar used in parts of Europe (Weck 2010). In 1976, one
U.S. manufacturer (S&S Innovations 2013) introduced a reusable plastic lid system that
has received renewed interest from home canners in the past few years.
Contemporary Interest in Home Canning
The 1970’s saw a growing national awareness regarding high food costs, energy
supplies, and possible food shortages creating interest in home food preservation (Kuhn
and Hamilton 1976). More recently, Lackey (2010) reported a growing interest in home
food preservation and small scale preservation of farm produced fruits and vegetables.
Jarden Corporation (2012) reported a 31% increase in the sales of home canning
products. Jarden Corporation (2010) previously found that 93% of consumers believed
that home-made food was healthier, and 88% accepted that freshly preserved food at
home tasted good. The survey also reported that 48% of the respondents were already

9
canning at home and they also showed interest in gaining more insights for canning
safely at home. According to one other survey (Centers for Disease Control and
Prevention 2012), about 20% of U.S. households can their own food and 65% of those
households can vegetables. Davis (2010) stated that people are concerned about knowing
what goes into their foods and minimizing salt, sugar and preservatives while canning at
home. With all the activity in home canning, it is important to have scientific
recommendations to prevent food disease outbreaks from home canning (Pennsylvania
Department of Health, 2008).
Botulism
CDC (2012) reported that many home canners were unaware of the risk of
botulism, a fatal foodborne illness that results from improperly canned foods. Home
canned vegetables are frequently associated with botulism outbreaks in the U.S. CDC
(2012) reported 116 outbreaks of foodborne botulism during 1996 to 2008. Of the 48
outbreaks from home canned foods, 38% were from home-canned vegetables (Date et al
2011). Date et al (2011) reported that outbreaks due to improper canning of home foods
were from people not following the recommended canning methods as well as being
unaware of spoilage in their preserved foods. These outbreaks demonstrated the need for
evaluating the current practice in home canning and targeting the education of home
canners on the importance of following recommended methods (Date et al 2011).
The pH of Tomatoes and Required Acidulation
Historically, tomatoes were considered to be an acid fruit for canning purposes.
However, studies beginning in the 1970’s started documenting that tomatoes can have
natural pH values above 4.6 (Powers 1976; Sapers et al 1978). A survey from Utah

10
reported that 249 fresh samples ranged in pH from 3.78 to 4.55 and 156 canned tomato
samples ranged pH from 3.81 to 4.53 with an average pH of 4.13 (Anderson and
Mendenhall 1978). Gutheil et al (1980) reported that tomatoes grown in the eastern
portion Washington had a higher pH than those in other locations due to warmer and
drier conditions. To prevent C. botulinum in home canned foods processed in boiling
water, a pH below 4.6 is required (Powers 1976), which can be achieved by addition of
acids to tomatoes prior to canning (Sapers et al 1978). USDA (2009) considers tomatoes
as potentially low-acid foods and requires acidification for using its published processing
times.
Addition of ¼ teaspoon of citric acid monohydrate or one tablespoon of bottled
lemon juice per pint jar to tomatoes kept the pH of canned low-acid tomatoes in one
study under 4.6 (Sapers et al 1978). However, addition of acids may change the flavor
and acceptability of canned tomato products. A sensory panel was used to compare
canned tomatoes with and without addition of acids. The result of this sensory panel
stated that by the addition of ¼ teaspoon of citric acid per pint jar, the tomatoes had
excellent color retention but were less favorable for taste compared to non-acidified
tomatoes (Skelton and Marr 1978).
Mold growth that could occur in under-processed acid tomatoes has been another
issue of pH concern and study in home canned tomatoes. In 1976, Huhtanen et al (1976)
and Odlaug and Pflug (1979) reported that when mold was allowed to grow in tomato
juice and acid foods, growth of C. botulinum was allowed in association with the mold
and pH increases in the food. Mundt (1978) observed and reported that 58 species of
molds grown on tomato juice raised the pH from 4.1 to sometimes 9.0 in 35 days when

11
stored at 22°C. The safety of home-canned tomato products being consumed after mold is
scraped off is a concern and supports the need for using recommended science-based
processes. Other studies have looked at the pH-raising effect of a spore-forming
bacterium, Bacillus licheniformis, if it survives a canning process. B. licheniformis is a
facultative anaerobe and was found in a high number (30%) of home-canned tomato
samples (Fields et al, 1977). Montville (1982) further explored and documented concerns
that if B. licheniformis spores could survive in under-processed tomatoes, the pH could
be elevated to greater than 5.2 under aerobic but not anaerobic conditions. This supports
the need to use up-to-date recommended scientific canning processes and the need for
good air removal from the headspace before jars seal.
Current USDA Recommendations for Canning Tomatoes
USDA (2009) also currently recommends only disease free, vine-ripened and firm
tomatoes for canning purposes. This is to keep tomatoes from having extraordinarily
high pH values before canning. Also, the recommendation for canning includes addition
of 2 tablespoons of bottled lemon juice or ½ teaspoon of citric acid per quart and 1
tablespoon of bottled lemon juice or ¼ teaspoon citric acid per pint while canning whole,
crushed or juiced tomatoes. Either a boiling water canner or a pressure canner can be
used, but acidification is still needed. To prevent botulism, non-acidified tomatoes would
need to be canned under pressure, but USDA does not have processing times for non-
acidified low-acid tomatoes.

12
Canners
USDA (2009) recommends two types of canners for home canning – boiling
water canners and pressure canners. Pressure canners are the only option to process low-
acid foods with a pH>4.6 (such as most vegetables, meats, poultry and seafood) to
prevent botulism (USDA 2009). Boiling water canners are used to process high-acid
foods with pH ≤4.6, like fruits. Pressure can also be used to process high-acid foods, but
is not necessary to ensure safe preservation by canning (Andress 2011, USDA 2009).
Different types of boiling water canners are available in today’s market place like
aluminum, porcelain-covered steel or stainless steel (USDA 2009; Andress 2011). To
process food in the boiling water canner, canners must have tight fitted lids and wire
racks (Andress 2011). Before the 1970’s, pressure canners were heavy-walled kettles
with clamp-on or turn-on lids which were fitted with a dial gauge, a petcock, or covered
with a counterweight, and a safety fuse (USDA 2009). Modern pressure canners can be
lightweight, thin-walled kettles with turn-on lids with gaskets, removable racks, an
automatic vent, steam vent, and safety fuse (Andress 2011). A pressure canner will either
have a dial gauge or weighted gauge to indicate and/or regulate pressure (Andress 2011).
Appropriate management of the steps in either boiling water or pressure canning with
specific controls is important to achieving the desired heating of foods while in the
canner to make them safe for room temperature storage (USDA 2009).
Processing Times
Following appropriate processing time is a very important procedure in home
canning to avoid the growth of microorganisms in high and low acid foods (USDA
2009). To avoid spoilage, foods processed in a boiling water canner should be processed

13
with the USDA recommended time period in boiling water and then cooling the jars at
room temperature. As altitude increases, the process time is increased in order to achieve
the equivalent heating to the required minutes at 100°C (212°F) for killing
microorganisms. Likewise, foods processed in a pressure canner should be processed
using the USDA recommended time period and correct pressure. Almost all home
canning pressure processes are standardized for the required time at 115.6°C (240°F)
which is obtained by 10 pounds of pressure at sea level. As altitude increases, pressure
must be increased to achieve equal heating. How pressure canners cool and are allowed
to depressurize is also important to food safety (USDA 2009). VanGarde and Woodburn
(1994) reported that according to a Minnesota survey, 20% of the timers on kitchen
ranges were inaccurate; they recommend using an appropriate timer for processing foods
because accuracy in the canning time and temperature is so important to food safety.
A survey by the National Center for Home Food Preservation stated the
importance of using appropriate equipment for home canning (Andress 2002; Pakola
2002). Taube and Sater (1948) reported that canning in small home pressure cookers of
the time could not provide the required heat to destroy pathogenic microorganisms; they
also cool faster than pressure canners typically used for home canning, increasing the risk
of foodborne illness. These limitations were also documented with later pressure cookers
by Walsh and Bates (1978). Issues about pressure canner size and cooling related to food
safety still exist (Andress and Kuhn 1983; Pakola 2002) so USDA continues to
recommend specifics regarding minimum pressure canner size (2009).

14
Lid and Jar Selection and Performance
USDA recommends Mason-type jars with self-sealing lids as the best choice for
home canning (USDA, 2009). Similarly, VanGarde and Woodburn (1994) reported that
glass jars are inert, non-metallic, reusable, transparent and hence best suited for home.
USDA (2009) further recommends that the two-piece metal lids are best suited for home
canning applications. It is the lid system that was found to function with good success in
lid studies by Kuhn and Hamilton (1976) and has been used with all UDSA process
research for the past several decades. The two-piece metal lids have an attached sealing
compound around the edge. They function by creating an absolute barrier when the jar
seals, thus preventing the entry of microorganisms and gaseous exchange inside the jar
(VanGarde and Woodburn 1994). They also are meant to allow for air, but not liquid or
food, to be expelled from the jar during processing when the ring band tightened over
them is applied with the right force. When the jars cool and the contents contract, a
vacuum is formed and holds the lid on the jar. In addition to preventing any air exchange
during storage, the vacuum reduces the possibility of internal lid corrosion (Kuhn and
Hamilton 1976). Use of correct headspace at the tops of jars and proper tightening of the
ring bands over the lids so they function correctly during canning allows for good
vacuum levels in the sealed jars. A higher vacuum represents lower retained oxygen and
is associated with better food quality during storage (Esselen and Fellers 1948).
Recent interest in a reusable plastic lid and glass lid has revealed a lack of
available research on their sealing performance and retention of food quality during
storage. Both these lid systems (S& S Innovations 2013; Weck 2010) use a separate
rubber ring, manufactured specifically for each lid type, to create the airtight seal and

15
vacuum upon cooling of jars after canning. One is tightened with a metal ring band while
the other is held in place during canning with metal clips placed over the glass lid on the
jar. Both system are intended to allow for venting of air from jars during processing in
the canner and creation of an air-tight vacuum seal to hold the lid on the jar during
storage.
Previous Study with Lid Comparisons using Different Closing Treatments
According to Kuhn and Hamilton (1976), interest in home canning and other
preservation techniques started increasing in early 1974 due to high food costs, energy
supplies, and possible food shorages. At that time many new home-canning product
manufacturers entered the market for the first time. Additionally, there were no industry
regulations and recommended standards for equipment and supplies available for people
who were interested in canning their foods at home.
Kuhn and Hamilton (1976) reported that there was emerging evidence regarding
home canners following incorrect methods to process food, choosing wrong equipment
and storing processed food improperly. During 1975 people started to demand
information about preventing canning failures. The authors decided to test the sealing
performance of 9 different lid types available at that time. The lids were subjected to
four different treatments with apples (boiling-water canner) and green beans (pressure
canner).The authors tested a total of 576 lids with 64 lids of each of the 9 brands and
concluded that four brands of lids in the boiling-water canner and five of the brands in a
pressure canner had seal failure problems. Consequently, lids with less than desirable
characteristics have previously made it to the marketplace.

16
Kuhn and Hamilton (1976) also laid out four treatments in filling jars to test the
lid performance. They documented that there were no scientific references available for
evaluating home canning lid performance. So, it was necessary for them to design a
method to evaluate the lids used in home canning practice. Treatment 1, labeled as
Regular, used a recommended headspace of one half-inch for apples, and one inch for
green beans; the rim of the jar was cleaned before placing lid on it. Treatment 2, labeled
Uncleaned, used the recommended headspace for both the foods but the jar rim was not
cleaned before applying lids. Treatment 3, labeled Overfills, reduced the headspace by
half and jar rim was cleaned. In Treatment 4, labeled Combination, the headspace was
also reduced by half and the rim was not cleaned. After heat-sterilization, the jars were
checked for sealing performance. They concluded that 50% of the lids were defective and
their results clearly showed that four lids in the boiling-water canner and five lids in a
pressure canner had sealing failure. Preserving foods processed in faulty lids will lead to
spoilage and possibly foodborne illness.
Acceptable Standards for Canning Lids
Longtime industry experience and previous home canning studies have shown
that appropriate final vacuum levels for boiling water canning should be approximately
18-22 inches of mercury (in Hg) and for pressure canning they should be around 22-26 in
Hg (Andress 2012). Ideally, there should be no visible discoloration of foods up to 1 year
when stored at 50-70°F. There should be no leakage during processing or overflow when
jar is removed from the canner. There should be no loss of vacuum or seals during
storage. If the lid would allow re-entry of air, it could lead to discoloration and/or
spoilage (USDA 2009; VanGarde and Woodburn 1994).

17
Retention of Food Quality
Esselen and Fellers (1948) studied the retention of color in home canned foods by
measuring the volume of entrapped air inside the jar after processing by a water
displacement method. The authors reported that jars with a hot fill and recommended
headspace are required for better release of entrapped air and for retention of food
quality. Although the lid systems used by Esselen and Fellers (1948) are no longer
manufactured, these researchers documented that lid functioning is crucial to successful
retention of food quality. National Presto Industries, Inc. (2012) confirms that
maintaining recommended headspace in the jar will prevent under-processing and
discoloration of canned food. The United States Department of Agriculture (2009)
documented that the food particles trapped between the jar and lid will lead to seal failure
and allow the reentry of oxygen into the jar which can result in food spoilage. Therefore,
to retain color and flavor of the canned food, oxygen must be removed from food tissues
and inside the jar, food enzymes must be quickly inactivated, high jar vacuums must be
obtained and proper storage locations need to be used (USDA 2009; Esselen and Fellers
1948).
Headspace
Headspace is the completely empty space between the top of food and/or liquid
and the underside of the lid in a canning jar. Downing (1996) and USDA (2009)
documented that headspace management is important to successful canning. Too little or
large of a headspace can cause improper sealing and product deterioration during storage.
Too little headspace can result in liquid coming out of the jar during canning due to

18
expansion of the food when it is heated. Too much headspace can result in excessive
retention of air in the jar and the possibility of vacuum seals not forming.
Reduction of Liquid Loss
Foods that are not covered by liquid after canning and during storage can discolor
and/or dry out (USDA 2009; VanGarde and Woodburn, 1994). Fellers et al (1937) and
Esselen and Fellers (1948) work investigated liquid loss from jars during pressure
canning of foods at home as it was recognized as an important index of successful lid
functioning and important to the quality of stored canned foods. Both these studies used
jar closure systems not in use today but documented that use of correct headspace and
management of the pressure canner to prevent temperature fluctuations result in
successful retention of liquid levels. Esselen and Fellers (1948) also compared the liquid
loss of fully and partially sealed jars processed in a heavy aluminum pressure canner for
slow cooling and a stainless steel pressure canner for rapid cooling. They reported that
maintaining a constant pressure during processing and allowing natural cooling will help
minimize the loss of liquid inside the jar, regardless of the canner type.
Objectives, Hypothesis and Specific Aims
The objective of the study was to evaluate and compare the sealing performance
of three lid systems to the accepted standards for successful preservation and food
quality.
Overall Hypothesis
All three lid systems will perform to the accepted standards for successful
preservation and food quality.

19
Specific Aims
The overall hypothesis will be tested with two-piece metal lids and reusable lids
(plastic and glass) by following USDA recommendations for home canning (USDA
2009).
1. Determine the sealing success rate and the vacuum levels achieved inside the
jar with all three lid systems. It is hypothesized that the reusable lids will have
the same rate of sealing and vacuum levels as the standard two-piece metal lid,
because of apparent consumer satisfaction.
2. Determine the relationship of sealing performance of lids and food quality
during storage. It is hypothesized that lids with low sealing performance will
be associated with discoloration of food, because of entrapped air or excessive
liquid loss.
3. Determine the retention of vacuum levels during storage. It is hypothesized that
none of the lid systems will lose vacuum during storage, because of their
manufacturing specifications.

20
CHAPTER 3
METHODS
Study Design
The purpose of this study was to evaluate and compare the sealing performance of
three different lid types subjected to four jar filling and closing treatments. The
treatments were 1) regular (recommended headspace of 12.7 mm (½ in) for apples and
tomatoes, 25.4 mm (1 in) for carrots; jar sealing surface wiped before adding lids), 2)
unwiped sealing surface (headspace same as treatment named regular; sealing surface not
cleaned before adding lid), 3) overfilled (recommended headspace reduced by one-half;
jar sealing surface cleaned before adding lid) and 4) combination (recommended
headspace reduced by one-half; jar sealing surface not wiped before adding lid).
Headspace for all the food types and different treatments is listed in Table 3.1. Foods
packed with these four treatments were hot-pack sliced apples, hot-pack crushed
tomatoes, and hot-pack and raw-pack sliced carrots. Tomatoes and apples are high acid
foods and were processed in a new boiling water canner (Ball® Collection Elite® 21
Quart) and carrots which represent low acid foods were processed in a new weighted
gauge pressure canner (Presto® 16 Quart, model 01745).
Apples represent a home canned food with the potential for retaining a large
amount of occluded (trapped) air depending on preparation of the product and venting of
the air from the jar during processing. Carrots are a common pressure-canned food and
represent an item that should result in similar raw and hot pack vacuum levels after

21
pressure processing. The tomatoes are also a very commonly home canned food and
represent the potential for seed entrapment in the sealing area if lids do not function as
expected to retain food during processing.
Table 3.1. Headspace and surface cleaning with different treatment and food types
Treatment T1 T2 T3 T4
Wiping rim Yes No Yes No
Headspace (in) Hot Apples ½ ½ ¼ ¼
Hot Tomatoes ½ ½ ¼ ¼
Hot Carrots 1 1 ½ ½
Raw Carrots 1 1 ½ ½
T1 – Regular, T2 – Unwiped, T3 – Overfilled, T4 – Combination
Treatments
Each lid type, food and treatment combination was replicated 12 times. Therefore,
for 3 lid types, 4 food types and 4 different treatments, a total of 576 jars were used. For
each replication, a canner load of 8 pint jars with different combinations of lid types and
treatments were processed and evaluated for their sealing performance. Three different
configurations for placing jars in the canners were used and repeated 6 times each (Figure
3.1, Table 3.2).

22
Table 3.2. Lid types1 and treatment2 configurations inside 18 canner loads for each food type
Canner Configuration
Canner number Jars arrangement
01 01, 04, 07, 10, 13, 16 2 GL (T1), 2 PL (T2), 2 ML (T3), 2 ML (T4)
02 02, 05, 08, 11, 14, 17 2 ML (T1), 2 GL (T2), 2 PL (T3), 2 PL (T4)
03 03, 06, 09, 12, 15, 18 2 PL (T1), 2 ML (T2), 2 GL (T3), 2 GL (T4) 1 GL – Glass Lids, ML – Metal Lids, PL – Plastic Lids 2 T1 – Regular, T2 – Unwiped, T3 – Overfilled, T4 – Combination
Figure 3.1. Distribution of lid and treatment combinations among three standard
canner configurations
Configuration 2 Configuration 1
Configuration 3

23
Materials
The canning equipment and methods used were those appropriate to USDA home
canning methods and recommendations. Laboratory equipment and ingredient
specifications are listed in Appendix D.
Lids and Jars
Three different home canning lids (two-piece metal lids, reusable plastic lids and
reusable glass lids) were used for the above treatments (Figure 3.2). The two-piece metal
lids system consists of a flat metal lid, with raised edges and plastisol sealing compound
permanently adhered, and a metal ring band, both supplied by the same manufacturer.
The reusable plastic lid system consists of a flat plastic lid with raised edges and a
separate rubber ring supplied by the same manufacturer. These lids are tightened down
over the rubber ring by manual application of a metal ring band purchased from another
source. This study used the same ring band as manufactured for the metal lid system. The
reusable glass lid system consists of a flat glass lid with a raised edge, rubber ring and
metal clips supplied by the same manufacturer. Two metal clips spaced equally around
the lid were used to secure the glass lid on each of these jars, per manufacturer’s
directions.
Metal and plastic lids were applied to the same brand of glass pint jars with a
“regular” jar mouth diameter (the jars are sold as “regular” or “wide-mouth”). The glass
lids were applied to ½ - liter “mold” style jars manufactured and sold as a set with the lid.
New lids were used for each of the replications; 192 lids of each type were tested (Table
3.3). For metal and plastic lids, the turn-on-torque of the metal ring bands was
standardized using the Secure PakTM Spring Torque Tester. Although the home canner

24
does not use a machine for turning on ring bands, this was done experimentally to
eliminate a user variable which can influence seal rates and vacuums.
Figure 3.2. Different types of lids
a) Metal lid system b) Plastic lid system
c) Glass lid system
25
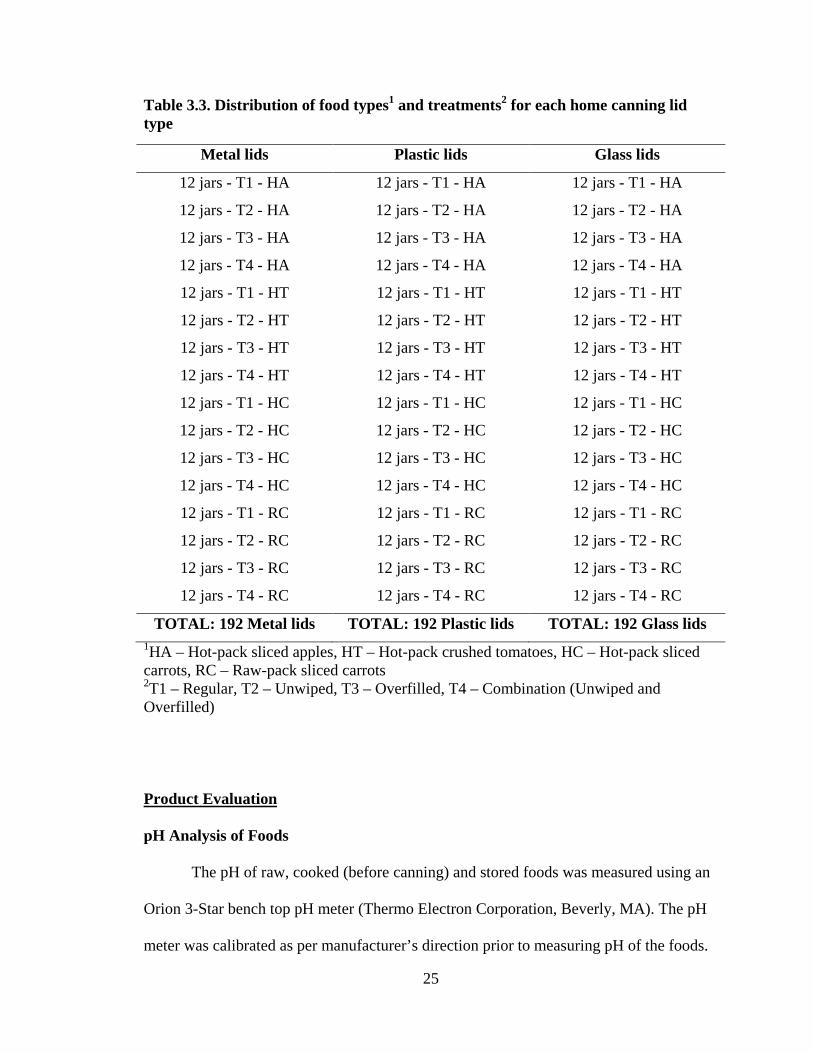
Table 3.3. Distribution of food types1 and treatments2 for each home canning lid type
Metal lids Plastic lids Glass lids
12 jars - T1 - HA 12 jars - T1 - HA 12 jars - T1 - HA
12 jars - T2 - HA 12 jars - T2 - HA 12 jars - T2 - HA
12 jars - T3 - HA 12 jars - T3 - HA 12 jars - T3 - HA
12 jars - T4 - HA 12 jars - T4 - HA 12 jars - T4 - HA
12 jars - T1 - HT 12 jars - T1 - HT 12 jars - T1 - HT
12 jars - T2 - HT 12 jars - T2 - HT 12 jars - T2 - HT
12 jars - T3 - HT 12 jars - T3 - HT 12 jars - T3 - HT
12 jars - T4 - HT 12 jars - T4 - HT 12 jars - T4 - HT
12 jars - T1 - HC 12 jars - T1 - HC 12 jars - T1 - HC
12 jars - T2 - HC 12 jars - T2 - HC 12 jars - T2 - HC
12 jars - T3 - HC 12 jars - T3 - HC 12 jars - T3 - HC
12 jars - T4 - HC 12 jars - T4 - HC 12 jars - T4 - HC
12 jars - T1 - RC 12 jars - T1 - RC 12 jars - T1 - RC
12 jars - T2 - RC 12 jars - T2 - RC 12 jars - T2 - RC
12 jars - T3 - RC 12 jars - T3 - RC 12 jars - T3 - RC
12 jars - T4 - RC 12 jars - T4 - RC 12 jars - T4 - RC
TOTAL: 192 Metal lids TOTAL: 192 Plastic lids TOTAL: 192 Glass lids 1HA – Hot-pack sliced apples, HT – Hot-pack crushed tomatoes, HC – Hot-pack sliced carrots, RC – Raw-pack sliced carrots 2T1 – Regular, T2 – Unwiped, T3 – Overfilled, T4 – Combination (Unwiped and Overfilled)
Product Evaluation
pH Analysis of Foods
The pH of raw, cooked (before canning) and stored foods was measured using an
Orion 3-Star bench top pH meter (Thermo Electron Corporation, Beverly, MA). The pH
meter was calibrated as per manufacturer’s direction prior to measuring pH of the foods.

26
Raw and drained cooked or canned foods were blended to a puree in a mini food
processor (Cuisinart® Mini-Prep® Plus Model DLC-2ABC) prior to pH measurement.
The puree was transferred to a small glass sample cup for insertion of the pH electrode.
Cooked and canned foods were drained for 2 minutes using a 8-mesh stainless steel food
analysis sieve at a 45 degree angle.
Raw Foods: Whole foods were washed with tap water as a consumer would do in the
home prior to canning. Distilled water was used sparingly as needed during blending of
foods to obtain a puree. The washed, peeled, and cored apple slices as ready to cook
were pureed. Washed, peeled tomatoes were used for raw product pH. Likewise, carrots
were washed, peeled and sliced as ready to cook for raw pH measurements.
Cooked Foods: Apples, tomatoes and hot pack carrots were preheated in preparation for
canning per USDA recommendations (USDA 2009). A small aliquot (approximately 6
oz) was removed from each batch and allowed to cool to room temperature prior to
blending for pH measurement. Apples and carrots were drained; crushed tomatoes were
blended without draining.
Canned Foods: After canned foods cooled for 24 hours, one jar from each treatment in
the canner load was opened for pH measurements. Apples and carrots were drained;
crushed tomatoes were blended without draining. After storing food for a specific period
of time (10 d, 1 mo and 3 mo), jars removed for vacuum and color analysis were used for
pH measurements. Apples and carrots were drained; crushed tomatoes were blended
without draining.

27
24-Hour Analyses
Jars were removed from the canner after processing foods as per USDA
recommendations and allowed to cool at room temperature for 24 hours. Jars were coded
as to canner number, lid type, treatment and food type and placed into storage conditions
described below. Jars labelled as 24 h samples were analyzed for fill weights, seal rate,
headspace, vacuum levels, pH and color.
Storage and Sealing Evaluation
After 24 hours of cooling, seven sealed jars of each treatment were placed at
21.1°C (70°F) in a closed closet to achieve the recommended dark conditions (USDA
2009). The seals were reevaluated after 10 days (10 d), 1 month (1 mo) and 3 months (3
mo). In addition, four sealed jars of each treatment were placed in an incubator (Fischer
Scientific, Model 650D) at 35°C (95°F) for 10 d and 1 mo to accelerate the rate of
spoilage if it were to occur. The distribution of total jars for each food type, lid type and
treatment group is described below (Table 3.4).

28
Table 3.4. Distribution of the 12 jars within a given treatment across different storage periods and incubation temperature
Jars stored at 21.1°C Jars stored at 35°C
Storage period No. of jars Storage period No. of jars
24 hours 1
10 days 1 10 days 2
1 month 2 1 month 2
3 months 2
9 months1 1
12 months1 1 1Will be used for future analysis
All the jars from both storage conditions were evaluated for seal performance,
discoloration and vacuum levels after 10 d and again after 1 mo. The jars at 21°C were
also evaluated after 3 mo. Headspace was measured before and after opening sealed jars.
After measuring vacuum levels, lids were removed, noting the ease of removal. Lids
were visually checked for evidence of corrosion (in metal lids) and other defects. Cuts or
deformation of the rubber rings with plastic lids were documented as the manufacturer
indicates that the rubber rings can be reused. The vacuum levels in metal and plastic lids
were measured using an Ashcroft vacuum gauge (Model 2074) mounted on an instrument
custom designed by The University of Georgia Instrumentation Design and Fabrication
Shop (Figures 3.3 and 3.4). Vacuum levels for metal and plastic lids were measured in
inches of mercury (Hg) as read directly off the gauge. The vacuum levels with use of
glass lids were subjectively measured on a 0–5 point scale (0= seal failure, 1=very poor,
2= poor, 3= good, 4= very good, 5= excellent). The rating was determined by ease of

29
pulling on the rubber ring to break the vacuum; a higher vacuum (excellent) puts up
greater resistance. The same researcher conducted all the ratings for consistency.
Figure. 3.3. Vacuum gauge mount on 5-speed drill press for measuring headspace vacuum with home canning metal and plastic lid systems

30
Figure 3.4. Vacuum gauge in use on drill press for measuring headspace vacuum in jars canned with metal and plastic lid systems
Preparation of Foods for Canning
A. Preparation of Hot Pack Sliced Apples
A.1. Preparation of Sugar Syrup
The USDA procedures for hot packs of apples offer a variety of packing syrup
choices. Cooking fruits with sugar syrup will help to retain their color, flavor and shape
even though sugar syrup by itself does not help to microbiologically preserve canned
fruits. In this study, a medium sugar syrup described by USDA (2009) was used. For one
canner load, 2-1/4 cups of sugar was mixed with 5-1/4 cups of tap water and brought to a
boil before apple slices were added.
Vacuum gauge
Drill bit piercing lid

31
A.2. Preparation of Ascorbic Acid Solution
To avoid discoloration of sliced apples, the peeled and sliced apples were placed
into tap water containing ascorbic acid. The standard solution of 3 grams ascorbic acid to
one gallon of cold water was used (USDA 2009).
A.3. Preparation of Apples and Filling Jars
Fuji apples were obtained from a local supermarket every few days over a 9-week
time period. An average of 12–13 pounds of Fuji apples as purchased were weighed,
washed, peeled, and cored for each canner load. Apples were sliced using an 8-segment
corer/slicer manually applied to each apple. Sliced apples were placed back into the
ascorbic acid solution to prevent discoloration until all apples were prepared (or for 5
minutes). Well-drained apples were then placed in the stockpot with the boiling sugar
syrup. Apple slices were boiled 15 to 20 minutes uncovered, with occasional stirring to
prevent burning.
New empty jars were weighed, washed and kept warm in hot water. Hot jars were
filled with the prepared hot apple slices leaving ½-inch headspace for treatments 1 and 2,
and ¼-inch headspace for treatments 3 and 4. Headspace is the completely empty space
from top of the jar to the top of the food and/or liquid. Fill weights of apples were
recorded. The apples were then covered with boiling sugar syrup, leaving the same
headspace requirements. A plastic bubble freer was used to remove trapped air bubbles
and headspace was adjusted as needed. Jar sealing surfaces were wiped with a clean
dampened paper towel for treatments 1 and 3. Filled jars were then weighed again. Target
fill weights for food plus liquid are described in Table 3.5. Lids were applied and
tightened as appropriate to each type. Ring bands for metal and plastic lids were turned

32
on to 20 inch-lbs using the torque tester (Jarden Corporation 2012). Metal clips were
placed over glass lids on jars (See Figure C.1 in Appendix C). The final weight of the jar
with lids was then also recorded.
Table 3.5. Target fill weights of food and liquid for four food types in pint or ½ - liter home canning jars with three different lid types
Food Type Treatment3
Pint Jars1
(Fill weight in g) Half-liter Mold Jars2
(Fill weight in g) T1, T2 T3, T4 T1, T2 T3, T4
Hot Apples 430 460 500 530
Hot Tomatoes 454 473 503 543
Hot Carrots 425 455 445 510
Raw Carrots 423 455 430 505 1 Jars used for metal and plastic lids 2 Jars used for glass lids 3 T1 – Regular, T2 – Unwiped, T3 – Overfilled, T4 – Combination (Unwiped and Overfilled)
B. Preparation of Hot Pack Crushed Tomatoes
B.1. Preparation of Tomatoes and Filling Jars
High quality Roma-type tomatoes were used for this study. Freshly harvested
tomatoes were purchased from a local farm, Native Sun Farms, in Athens, GA and
Buford International Market, Buford, GA, who obtained tomatoes from another
southeastern state, over a period of 10 weeks. An average of 14 pounds of fresh tomatoes
was used per canner load. Fully ripened tomatoes were washed and dipped in boiling
water for 1 minute or until skins cracked open. Tomatoes were then removed from the

33
boiling water and placed immediately in a bowl of half ice and half water. Skins were
slipped off, cores were removed and any bruised or discolored flesh was also removed.
The peeled tomatoes were quartered and one-sixth of them were quickly transferred to a
large stockpot. Tomatoes were crushed using a metal mallet until they exuded juice and
heated to boiling with occasional stirring to prevent burning. When the tomatoes started
to boil, the remaining quartered tomatoes were gradually added and stirred continuously.
These tomatoes did not require crushing; instead they softened with stirring and heat.
This process was repeated until all the quartered tomatoes were added. The total pot of
tomatoes was then boiled gently for 5 minutes before filling jars.
New empty jars were weighed, washed and kept warm in hot water. Canning salt
(1/2 teaspoon) and citric acid (1/4 teaspoon) were added to empty jars just prior to adding
the cooked tomatoes. The hot cooked tomatoes were filled into jars, leaving ½-inch
headspace for treatments 1 and 2, and ¼-inch headspace for treatments 3 and 4. Fill
weights were recorded; target fill weights are described in Table 3.5. A plastic bubble
freer was used to remove trapped air bubbles and headspace was adjusted as needed. Jar
sealing surfaces were wiped with a clean dampened paper towel for treatments 1 and 3.
Filled jars were then weighed again. Lids were applied and tightened as appropriate for
each type. Ring bands for metal and plastic lids were turned on to 20 inch-lbs using the
torque tester. Metal clips were placed over glass lids on the jars (See Figure C.2 in
Appendix C). The final weight of the jars with lids was then also recorded.
B.2. Acidification of Tomatoes
Some tomatoes have low pH which might cause safety issues when processed in a
boiling water canner. For safety, ¼ teaspoon citric acid sold for home canning was added

34
to each jar. As recommended for flavor, ½ teaspoon of salt was added to each jar. Acid
and salt were added directly to the jars before filling with tomatoes.
C. Preparation of Hot Pack Sliced Carrots
High quality refrigerated raw carrots were purchased from a local supermarket in
Athens, GA over a period of 8 weeks. An average of 12 pounds (without tops and
bottom) was used per canner load. Small carrots of 1- to 1-1/4 inch diameter were
washed, peeled, rewashed and weighed. Carrots were evenly sliced to ¼-inch rounds,
added to a stockpot and covered with tap water. They were then brought to a boil and
simmered for 5 minutes as described for the USDA hot pack (USDA 2009).
New empty jars were weighed, washed and kept warm in hot water. Canning salt
(1/2 teaspoon) was added to the hot jars immediately before filling with prepared carrots.
Fill weights of sliced carrots were recorded. The carrots were then covered with cooked
liquid, leaving 1- inch headspace for treatments 1 and 2, and ½ - inch headspace for
treatments 3 and 4. A plastic bubble freer was used to remove trapped air bubbles and
headspace was adjusted as needed. Jar sealing surfaces were wiped with a clean
dampened paper towel for treatments 1 and 3. Filled jars were then weighed again. Target
fill weights for carrots plus liquid are described in Table 3.5. Lids were applied and
tightened as appropriate to each type. Ring bands for metal and plastic lids were turned
on to 20 inch-lbs using the torque tester. Metal clips were placed over glass lids on the
jars (See Figure C.3 in Appendix C). The final weight of the jar with lids was then also
recorded.

35
D. Preparation of Raw Pack Sliced Carrots
High quality refrigerated raw carrots were purchased from a local supermarket in
Athens, GA over a period of 9 weeks. An average of 12 pounds (without tops and
bottom) was used per canner load. Small carrots of 1- to 1-1/4 inch diameter were
selected, washed, peeled, rewashed and weighed. Carrots were evenly sliced to ¼-inch
rounds. Fresh tap water was boiled in a stockpot for the covering liquid.
New empty jars were weighed, washed and kept warm in hot water. Canning salt
(1/2 teaspoon) was added to the hot jars immediately before filling with prepared raw
carrot slices. Fill weights of sliced carrots were recorded. The carrots were then covered
with boiling water, leaving 1 - inch headspace for treatments 1 and 2, and ½ - inch
headspace for treatments 3 and 4. A plastic bubble freer was used to remove trapped air
bubbles and headspace was adjusted as needed. Jar sealing surfaces were wiped with a
clean dampened paper towel for treatments 1 and 3. Filled jars were then weighed again.
Target fill weights for food plus liquid are described in Table 3.5. Lids were applied and
tightened as appropriate to each type. Ring bands for metal and plastic lids were turned
on to 20 inch-lbs using the torque tester. Metal clips were placed over glass lids on the
jars (See Figure C.4 in Appendix C). The final weight of the jar with lids was then also
recorded.

36
Canning Process
Boiling Water Processing
Management of the canning process followed USDA procedures (USDA 2009).
Water was preheated in the boiling water canner to 82.2°C (180°F) for hot packed apples
and hot packed tomatoes. Closed filled jars were then placed into the canner using a
canning jar lifter. Jars were kept upright at all times. The canner water level was adjusted
such that there was 1 inch (for apples) and 2 inches (for tomatoes) above the jar tops. It is
recommended that for processing times over 30 minutes, the canner water level should be
2 inches above the jar tops at the start. This is to ensure that the water level will not drop
below 1 inch any time during processing (USDA 2009). The gas burner was turned to its
highest setting and the lid was placed on the canner. To process food as per USDA
recommendations, a timer was set to 20 minutes for apples and 35 minutes for tomatoes
(Table 3.6), after water in the canner came to a vigorous boil. The canner was visually
monitored to ensure the water never stopped boiling during the process time. When the
recommended time for processing apples or tomatoes was reached, the burner was turned
off and the canner lid removed. After 5 minutes resting time, jars were removed from the
canner, using a jar lifter to hold them upright, and placed on a folded towel leaving 1- to
2-inches spacing between them. The jars closed with plastic lids required additional ring
band tightening before cooling. The manufacturer’s directions called for tightening the
metal ring band firmly immediately upon removal from the canner. Jars with metal and
glass lids had no further adjustments to lids after processing. Jars were allowed to cool at
room temperature for 24 hours, labeled and stored accordingly.

37
Pressure Processing
Management of the pressure canning process also followed USDA
recommendations (USDA 2009). A visual check was conducted to be sure that all vent
pipes in the canner lid were clear of debris or food residues. The canner rack was placed
into the bottom of the canner. Hot water was added to a depth of 3 inches in the canner
and preheated to 82.2°C (180°F) for hot packed sliced carrots and 60°C (140°F) for raw
packed sliced carrots. Closed filled jars were placed inside the prepared pressure canner
using a jar lifter. Jars were kept upright at all times. The canner lid was securely fastened.
The gas burner was turned to its highest setting. Once a visible funnel shape of steam
came out of the open vent pipe, continuous steam was allowed to flow freely for 10
minutes to vent air out of the canner. The weighted gauge configured for 10 pounds of
pressure (psig) was placed on the vent pipe to allow the canner to pressurize. 10 psig is
used to reach the required processing temperature of 115.6°C (240°F) for low-acid foods.
Once the weighted gauge began to jiggle, a timer was set for the process time of 25
minutes (for raw-pack and hot-pack carrots, Table 3.6). The canner was visually
monitored to ensure the pressure never dropped (the gauge never stopped jiggling)
throughout the entire process time. At the end of the process, the heat was turned off and
the canner was allowed to cool naturally to 0 pounds pressure. After depressurizing the
canner completely, the weight was removed from the vent pipe and the timer set for a
resting period of 10 minutes before the lid was removed. Jars were then removed from
the canner using the jar lifter to keep them upright, and placed on a towel to cool, leaving
1- to 2- inches spacing between them. The jars closed with plastic lids required additional
ring band tightening before cooling. The manufacturer’s directions called for tightening

38
the metal ring band firmly immediately upon removal from the canner. Jars with metal
and glass lids had no further adjustments to lids after processing. Jars were allowed to
cool at room temperature for 24 hours, labeled and stored accordingly.
Table 3.6. Processing times and initial canner water temperature for each food type
Food Type Process Temperature/ Process
Process Time (Pint jars)
Canner temperature when
jars loaded Hot-pack sliced apples
Boiling water 20 82.2°C/180°F
Hot-pack crushed tomatoes
Boiling water 35 82.2°C/180°F
Hot-pack sliced carrots
10 psig1 25 82.2°C/180°F
Raw-pack slice carrots
10 psig1 25 60°C/140°F
1 10 psig measured by a weighted gauge
Post Processing Analyses
As previously described under “Product Evaluation,” in addition to fill weights
being recorded after 24 hours of cooling, storage studies also included recording weights
after their respective storage periods (10 d, 1 mo and 3 mo). Filled jars were weighed
with and without lids in place. Canned apples and canned raw and hot- packed carrots
were drained using the sieve and a drained food weight was also recorded. Headspace
was measured in the sealed jar. After weighing and recording headspace, vacuum levels
were evaluated. Vacuum levels were measured in jars with metal and plastic lids using

39
the drill with attached vacuum gauge. The vacuum in jars with glass lids was rated
subjectively by the force needed to pull the rubber ring until the vacuum was broken. The
manufacturer describes determination of vacuum by pulling the protruding tab of the
rubber ring and listening for a hissing sound of air being sucked into the jar (Weck 2010).
Therefore, in addition to the force required to release the seal, the volume of the sound
was factored into the subjective rating. The rating scale ranged from 0 to 5. Seal failure
was rated “0”. A “5” represented a very strong sound and very firm force required (rated
as an excellent), “4” represented a strong sound and firm force (rated as very good), “3”
represented medium sound and somewhat firm (rated as good), “2” represented a weak
sound and gentle force (rated as poor) and “1” represented a very weak sound and hardly
any force required (rated as very poor). After measuring vacuum levels, the height of
both food and liquid components was also recorded as headspace evaluation. After
weighing, vacuum and headspace measurements were recorded, jars were drained for pH
and color measurement. pH methodology is described above under “Product Evaluation”.
Measurement of Color
The color of the foods was measured objectively using the HunterLab MiniScan
XE Plus colorimeter. Drained foods were placed on the HunterLab calorimeter sample
cup without any gap or air bubble to quantify the color (Figure 3.5). A three-dimensional
scale (L* a* b*) was used to objectively quantify color values. L* represents a lightness
axis from black to white (0 to 100). a* represents the red-green axis where positive values
are red and negative values are green. b* represents the yellow-blue axis where positive
values are yellow and negative values are blue. The results are discussed as an
assessment of the color difference (d=delta) from a known standard, in this study the 24-

40
hour L* a* b* measurement. The difference in lightness/darkness values is represented as
dL. The difference in the red/green axis is representes as da. The difference in the
yellow/blue axis is represented as db. These analyses allowed for detection of changes
over time from the original canned food color. Lower vacuum levels are related to more
trapped oxygen in the headspace than with higher vacuums. Retained oxygen can lead to
darkening of lighter-colored foods over time in storage.
The color of drained carrot and apple slices was also measured subjectively using
a series of color chips selected from paint store samples. Beginning at 24 hours after
canning and at each storage intervals, the name of the closest color in the series was
recorded. This method was a means to detect any practical visual change similar to
judgments a consumer could make. This method was not used for crushed tomatoes
because a suitable color chip series was not available.
Figure. 3.5. Measuring color of the food using the HunterLab Colorimeter

41
Statistical Analyses
Analysis of Variance (ANOVA) using the general linear model procedure (SAS
Version 9.4, SAS Institute Inc., Cary, NC) was performed to compare the following
across vacuum levels and colorimetric measurements: treatment, storage period, food
types and incubation temperature. ANOVA using the general linear model procedure was
performed to compare between metal and plastic lids. The independent variables are lid
types, treatment types, food types, storage periods and incubation temperatures. The
dependent variables are vacuum levels (metal and plastic lids), vacuum ratings (glass
lids) and colorimetric measurements (dL, da, db). The level of statistical significance was
defined at P < 0.05.

42
CHAPTER 4
RESULTS
Fill Weight of Foods
Efforts were put forth to use foods with similar shape, size and consistency to
ensure that every jar would be packed as similarly as possible for the same food type.
However, some natural variation occurs when working with large quantities of foods. For
example, apple diameter was slightly variable, some tomato variation occurred in solid
versus juice content, and diameter of carrots had natural variations. Foods were selected
and prepared by the same researcher for all canner loads to ensure as even and consistent
distribution sizes as possible.
The average fill weight of different food types in different treatment are listed in
Table 4.1. Target fill weights are shown in Chapter 3, Table 3.4. The ½-liter jars have a
slightly larger volume than pint jars as well as a different shape and can hold a slightly
more food. Fill weights for T1 and T2 jars within a food type should be almost the same,
as should fill weights for T3 and T4 jars. T3 and T4 packs were purposely overfilled jars
and should have higher fill weights than T1 and T2 jars within a food type. Recorded
weights document these controls were maintained.
pH Studies
pH values of raw foods were monitored to document that the foods were within
the parameters set forth by USDA for their canning recommendations. pH of processed
foods was also documented to ensure the foods remained stable and no indications of

43
spoilage or error could be detected by major shifts in pH. Table 4.2 shows that the pH of
raw, peeled apples was 3.87+0.28. The pH of cooked apples and canned apples remained
within the range obtained for raw apples. The pH of raw tomatoes was 4.22+0.16; for
cooked and canned tomatoes it was 4.28+0.23 and 3.95+0.20 respectively. The pH of
canned tomatoes is lower due to the addition of citric acid to the jars. The pH of raw
carrots used was for hot pack was 5.76+0.29; pH of raw carrots used for raw packs was
5.86±0.28. The pH of all canned carrots was lower than that of raw carrots, most likely
due to the heat processing and storage in slightly acidic tap water. No added acidifiers
were used in the canning of carrots, yet the lowered post-processing pH was a very
consistent finding. There were no particular patterns detected in pH variations among
different sources or purchase dates of produce as evidenced by small standard deviations
in pH of the raw produce.

44
Table 4.1. Average fill weight of food and liquid for different food types and closing treatments in two jar sizes
Fill weights (g) Jar Type Pint (n = 320) ½ - Liter (n = 160) Treatment1 T1 T2 T3 T4 T1 T2 T3 T4 Food Type Hot Apples 432.89+3.76 435.68+4.105 460.29+3.58 460.59+3.14 501.37+1.81 499.30+2.31 530.38+0.81 530.51+1.01
(n) 20 20 20 20 10 10 10 10
Hot Tomatoes
454.09+0.22 454.28+0.35 473.09+0.37 473.03+0.60 503.27+0.17 503.27+0.18 543.11+0.15 543.11+0.07
(n) 20 20 20 20 10 10 10 10
Hot Carrots
425.23+0.35 425.61+1.74 455.31+0.56 455.55+0.67 444.106+0.57 443.96+1.97 510.33+0.58 510.24+0.31
(n) 20 20 20 20 10 10 10 10
Raw Carrots
423.56+1.58 423.59+1.40 455.17+0.36 455.15+0.62 429.77+1.23 429.73+1.24 505.06+0.20 505.39+0.45
(n) 20 20 20 20 10 10 10 10 1 T1 – Regular, T2 – Unwiped, T3 – Overfilled, T4 – Combination (Overfilled and unwiped)

45
Table 4.2. pH of raw, cooked and canned foods including various storage intervals for the canned products
Food N pH (mean+SD) Apples - Raw 3.87 + 0.28
18 Cooked (Ready to fill) 3.70 + 0.22
12 Canned 24 h 3.72 + 0.15
36 Canned 10 d 3.86 + 0.09
48 Canned 1 mo 3.86 + 0.21
24 Canned 3 mo 4.09 + 0.18
120 Average for all canned apples 3.89 + 0.21
Tomatoes - Raw 4.22 + 0.16
18 Cooked (Ready to fill) 4.28 + 0.23
12 Canned 24 h 4.16 + 0.15
36 Canned 10 d 4.09 + 0.05
48 Canned 1 mo 3.82 + 0.21
24 Canned 3 mo 3.98 + 0.09
120 Average for all canned tomatoes 3.95 + 0.20
Carrots, Hot Pack
- Raw 5.76 + 0.29
18 Cooked (Ready to fill) 6.04 + 0.60
12 Canned 24 h 4.80 + 0.35
36 Canned 10 d 5.00 + 0.06
48 Canned 1 mo 5.06 + 0.09
24 Canned 3 mo 5.09 + 0.06
120 Average for all canned hot pack carrots 5.02 + 0.17
Carrots, Raw Pack
- Raw 5.86 + 0.28
12 Canned 24 h 4.70 + 0.51
36 Canned 10 d 4.105 + 0.32
48 Canned 1 mo 4.100 + 0.24
24 Canned 3 mo 5.14 + 0.12
120 Average for all canned raw pack carrots 4.104 + 0.31
46
Headspace Analyses
All foods demonstrate a lower headspace after canning and cooling which is
typical due to contraction of contents. With both jar types, hot pack apples demonstrated
much lower liquid levels than food height, with the lowest liquid levels being observed
with glass lids. The lowest liquid levels in all canned apples were found in overfilled (T3
and T4) ½-liter jars. Loss of liquid in glass lid jars of apples was visually observed
immediately upon removal of jars at the end of process time. Apples canned with glass
lids also had lower food heights after processing which could be a result of the liquid
loss.
No major loss of headspace was observed for hot pack tomatoes or hot pack
carrots for any treatment or jar type. The same is true for regular fill raw pack carrots (T1
and T2). However, overfilled jars of raw pack carrots experienced lowered food and
liquid levels with the lowest levels observed in pint jars. The final headspace values,
despite some decrease after filling, would not be a major concern for food quality in
storage except in the case of apples. Liquid levels from ¾ inch to 1 inch or more lower
than the food can lead to browning of the food above the liquid during storage (Table
4.3).

47
Table. 4.3. Post processing headspace for all food types by treatment with 24 hour and all storage observations combined
Headspace (inches) Jar Type Pint ½ - Liter Treatments1
T1 T2 T3 T4 T1 T2 T3 T4 Food Type Initial Headspace 0.5 0.5 0.25 0.25 0.5 0.5 0.25 0.25
Hot Apples
(n)2
18
19
20
20
10
10
10
10
Food 0.66+0.27 0.68+0.28 0.43+0.20 0.48+0.22 1.11+0.34 1.04+0.91 1.04+0.23 0.96+0.13 Liquid 1.59+0.34 1.49+0.23 1.33+0.30 1.33+0.34 1.95+0.54 1.61+0.46 2.15+0.31 2.15+0.33 Hot
Tomatoes(n)
20
20
20
20
10
10
9
10
Food 0.63+0.00 0.63+0.41 0.38+0.05 0.43+0.11 0.51+0.04 0.51+0.04 0.40+0.12 0.44+0.09 Initial Headspace 1.0 1.0 0.5 0.5 1.0 1.0 0.5 0.5
Hot Carrots
(n)
20
20
20
19
10
10
10
9
Food 1.00+0.00 1.01+0.03 0.56+0.13 0.57+0.10 0.88+0.12 0.99+0.04 0.61+0.11 0.60+0.12 Liquid 1.04+0.06 1.03+0.05 0.72+0.17 0.68+0.16 1.03+0.08 1.01+0.04 0.75+0.13 0.67+0.11 Raw Carrots
(n)
20
20
20
20
10
10
10
10
Food 1.04+0.10 1.09+0.24 0.93+0.16 0.94+0.15 1.04+0.06 1.05+0.09 0.73+0.14 0.69+0.14 Liquid 1.04+0.10 0.99+0.10 0.81+0.18 0.84+0.14 1.00+0.00 1.04+0.12 0.70+0.21 0.60+0.08 1 T1 = Regular, T2 = Unwiped, T3 = Overfilled, T4 = Combination 2 The total number of jars for pint jars would be 20 and 10 for ½ - liter jars. Seal failure was observed when a sample size lower than those is indicated

48
Vacuum Studies
Sealing Rates
There were a total of 6 seal failures during the time period of this study (Table 4.4). No seal failure were observed in
the 160 jars canned with metal lids analyzed through 3 months of storage period. Initial seals in four jars canned with plastic
lids were lost at either 1 mo (2 jars) or 3 mo (2 jars). Loss of seals in foods canned with glass lids occurred at 10 d (1 jar) and 1
mo (1 jar).
Table 4.4. Number of seal failures in three lid types by food types during storage at two storage temperatures
Lid Type1 Hot Apples Hot Tomatoes Hot Carrots Raw Carrots Total Storage
Temperature 21.1°C 35°C 21.1°C 35°C 21.1°C 35°C 21.1°C 35°C
Metal Lids 0 0 0 0 0 0 0 0 0
Plastic Lids 1 2 0 0 1 0 0 0 4
Storage (3 mo) (1 mo) (3 mo)
Glass Lids 0 0 0 1 0 1 0 0 2
Storage (1 mo) (10 d)
Total 3 1 2 0 6 1 N = 160 for each lid types

49
Initial Vacuum Levels
All jars sealed after 24 h of cooling. The initial vacuum levels obtained are in Table 4.5.
The values for metal and plastic lids fall within the expected ranges for home canned
foods for T1 and T2, which are the jars with recommended headspace.
Table 4.5. 24-Hour vacuum levels for all canned foods using different lid types and closing treatments
Average Vacuum Levels1/ Vacuum Ratings2
Food Type N3 Lid Type4 Treatment5
T1 T2 T3 T4
Hot Apples 4 ML 16.96 18.24 10.50 11.63
4 PL 18.27 16.95 11.00 12.92
4 GL 5.00 5.00 5.00 5.00
Hot Tomatoes 4 ML 16.84 16.87 16.07 15.77
4 PL 13.22 20.38 11.01 12.26
4 GL 5.00 5.00 5.00 5.00
Hot Carrots 4 ML 18.14 24.02 24.59 20.23
4 PL 25.07 26.51 22.91 8.66
4 GL 5.00 5.00 3.00 3.00
Raw Carrots 4 ML 25.01 20.16 19.96 18.52
4 PL 18.98 18.90 25.71 25.54
4 GL 5.00 5.00 5.00 5.00 1 Inches of Hg 2 Vacuum ratings 0 = seal failure, 1 = very poor, 2 = poor, 3 = good, 4 = very good and 5 = excellent 3 One jar was opened for each treatment and lid type. There were 4 jars for each lid type 4 ML = Metal lids, PL = Plastic lids, GL = Glass lids 5 T1 = Regular, T2 = Unwiped, T3 = Overfilled, T4 = Combination

50
Vacuum Levels by Treatment
Comparisons were made among vacuum levels by food and lid type in all jars
opened from 24 h through 3 mo time intervals.
Metal Lids
When vacuum levels were compared in all the treatment types with different
foods, hot-pack sliced apples showed a statistically significant difference (p = 0.0358) in
vacuum level among different treatments. The overfilled jars had lower vacuum levels
compared to other treatments. The Tukey test was not able to demonstrate a difference
among vacuum level, however. Even though the F-test indicates a significant difference
at p<0.05, the Tukey mean separation cannot always detect a difference as the p value
approaches 0.05. With a smaller p value, there is a greater chance for the Tukey test to
determine differences among means.
Hot-pack crushed tomatoes showed a statistically significant difference (p =
0.0116) in vacuum levels among different treatments also. In this case, the Tukey test did
demonstrate that the combination treatment (which is a combination of overfilled and
unwiped) had lower vacuum levels compared to the recommended treatment. Vacuum
levels in hot tomatoes for all treatments were lower using plastic lids than metal lids.
Hot-pack sliced carrots showed a statistically significant difference (p = 0.0315)
in vacuum level among different treatments. Both overfilled and combination jars had
lower vacuum levels compared to recommended treatments when metal lids were used.
Raw-pack sliced carrots showed a statistically significant (p = 0.0391) difference in
vacuum level among treatments, also. In this case again, the Tukey test could not

51
demonstrate any differences among treatments. However, there was a lower mean
vacuum level observed in overfilled and combination treatments (Table 4.6).
Plastic Lids
Comparison of vacuum levels in hot-pack sliced apples using plastic lids showed
a statistically significant difference (p = 0.0315) in vacuum level while the Tukey test did
not find a difference among treatments. A lower vacuum level was observed in overfilled
and combination treatments. In all the other food types with plastic lids there were no
significant differences in vacuum levels among treatments. However, lower vacuum
levels were observed in overfilled and combination treatments in all the food types
compared to recommended treatments (Table 4.6).
Glass Lids
As described previously, vacuum level was tested subjectively for glass lids. The
researcher rated the ease of breaking the vacuum on sealed jars. For all food types, the
initial 24 h vacuum levels rated very highly with a range of 4 to 5 on the 5-point scale.
Ratings are shown in Table 4.7.

52
Table 4.6. Vacuum levels obtained in all jars of foods canned with metal and plastic lids using four treatments
Average Vacuum Level1 (inches of Hg)
Food Types Hot Apples Hot Tomatoes Hot Carrots Raw Carrots
Lid Types2 ML PL ML PL ML PL ML PL
Treatment3
16.07+1.66a*
16.10+4.10a
17.52+2.26a
13.68+2.16a
23.15+2.27a
23.10+2.08a
23.08+1.54a
22.52+1.55a T1
(n)4 10 8 10 10 10 10 10 10
T2 16.21+1.92a 16.05+2.22a 17.08+1.27ab 14.58+3.82a 23.57+1.64a 23.18+2.50a 22.18+1.89a 21.88+2.58a
(n) 10 9 10 10 10 10 10 10
T3 13.58+2.34b 12.03+3.51a 15.25+2.22ab 13.24+2.35a 20.65+3.22b 21.38+3.01a 20.88+1.44a 20.34+3.14a
(n) 10 10 10 9 10 10 10 10
T4 14.09+3.31a 13.70+3.17a 14.103+2.04b 11.34+4.106a 21.23+2.57b 20.38+4.104a 20.89+2.62a 21.71+1.69a
(n) 10 10 10 10 10 9 10 10
p – value 0.0358 0.0315 0.0116 0.229 0.0315 0.188 0.0391 0.2198 1 Means in the same column with different letters are significantly different at p < 0.05 (Tukey test). 2 ML – Metal Lids, PL – Plastic Lids 3 T1 = Regular, T2 = Unwiped, T3 = Overfilled, T4 = Combination 4 Total number of jars for each treatment would be 10 jars; seal failure was observed with plastic lids where a sample size of less than 10 jars is indicated.

53
Table 4.7. Subjective vacuum ratings for foods canned with glass lids using four treatments
Average Vacuum Ratings1,2
Food Types Hot Apples Hot Tomatoes
Hot Carrots Raw Carrots
Treatment3
5.00+0.00a
5.00+0.00a
4.80+0.63a
5.00+0.00a T1
(n)4 10 10 10 10
T2 4.60+1.26a 4.80+0.63a 5.00+0.00a 5.00+0.00a
(n) 10 10 10 10
T3 5.00+0.00a 5.00+0.00a 4.60+0.84a 4.80+0.63a
(n) 10 9 10 10
T4 4.80+0.63a 5.00+0.00a 4.56+0.88a 4.40+1.35a
(n) 10 10 9 10
p – value 0.539 0.4206 0.464 0.247 1 Means in the same column with different letters are significantly different at p < 0.05 (Tukey test). 2 Vacuum ratings 0=seal failure, 1=very poor, 2=poor, 3=good, 4=very good and
5=excellent 3 T1 = Regular, T2 = Unwiped, T3 = Overfilled, T4 = Combination 4 Total number of jars for each treatment would be 10 jars; seal failure was observed with glass lids where a sample size of less than 10 jars is indicated.
Vacuum Level by Storage
Vacuum levels were measured for one jar of each food with each treatment and
lid type after storage periods of 24 h, 10 d, 1 mo and 3 mo. Comparisons were made for
vacuum levels with all treatments combined.
Metal Lids
A significant difference in vacuum levels was observed for some storage periods
with hot-pack sliced apples (p = 0.0309) and hot-pack sliced carrots (p <0.0001). For hot-

54
pack apples, lower vacuum levels were observed at 3 mo compared to 10 d and 1 mo of
storage, although the only significance difference was between 10 d and 3 mo. The mean
vacuum level at 24 h is based on a sample size of only 4 jars and this could be a factor in
there being no significant difference in vacuum compared to the storage periods. With the
hot-pack carrots, the only significant difference in vacuum level occurred after 10 d of
storage, when the measured mean vacuum level was higher than at other times. No
difference in vacuum level was observed with different storage period with crushed
tomatoes and raw-pack sliced carrots (Table 4.8).
Plastic Lids
Lower vacuum levels (p = 0.0089) were observed with hot-pack sliced carrots at
24 h period than in any storage period. However, the standard deviation for the 24 h
readings was high. There were no significant difference in vacuum levels from 10 d
through 3 mo; however, the highest mean vacuum level was observed at 10 d storage.
There was a significant difference (p = 0.0373) in vacuum levels for raw-pack sliced
carrots among storage period, but the Tukey test could not detect differences. No
difference in vacuum level was observed at different storage periods with hot-pack sliced
apples and crushed tomatoes (Table 4.8).
Glass Lids
No difference in objective vacuum ratings was observed at 24 h or among
different storage periods for all the food types (see Table A.1. in Appendix A)

55
Table 4.8. Vacuum levels obtained in foods canned with metal and plastic lids for all closing treatments1 combined at different storage periods
Average Vacuum Level2 (inches of Hg)
Food Types
Hot Apples Hot Tomatoes Hot Carrots Raw Carrots
Lid Types3
ML PL ML PL ML PL ML PL
Storage
period
14.33+3.83ab
14.78+3.40a
16.39+0.55a
14.22+4.21a
21.74+3.08b
20.79+8.22b
20.91+2.83a
22.28+3.86a 24 h
(n) 4 4 4 4 4 4 4 4
10 d 16.22+2.20a 13.44+4.61a 16.32+2.20a 14.00+2.15a 24.67+1.38a 24.00+1.89a 22.38+2.37a 22.83+1.67a
(n) 12 12 12 12 12 12 12 12
1 mo 15.13+1.87ab 15.52+3.22a 15.61+2.74a 12.43+3.31a 21.33+2.06b 21.36+2.45ab 21.63+1.50a 20.98+2.22a
(n) 16 144 16 16 16 16 16 16
3 mo 13.18+3.02b 13.27+2.06a 17.09+1.38a 13.07+5.49a 20.20+2.76b 21.01+2.08ab 21.49+2.40a 20.71+2.40a
(n) 8 74 8 8 8 74 8 8
p – value 0.0309 0.3726 0.488 0.6860 <0.0001 0.0089 0.5539 0.0373 1 Treatments included regular closing procedure (T1), unwiped (T2), overfilled (T3) and combination (T4) 2 Means in the same column with different letters are significantly different at p < 0.05 (Tukey test) 3 ML – Metal Lids, PL – Plastic Lids 4 Seal failures lowered the sample size compared to the n for metal lids at these storage periods.

56
Vacuum Level Comparisons for High-acid versus Low-acid Foods
Metal and Plastic lids
A significant difference in vacuum levels (p < 0.0001) was observed for metal or
plastic lids with low-acid (pressure canner) versus high-acid (boiling water canner) foods
for each treatment looking at all storage periods combined. Higher vacuum levels were
observed in low-acid foods (hot-pack sliced carrots and raw-pack sliced carrots)
processed in a pressure canner compared to high-acid foods (hot-pack sliced apples and
hot-pack crushed tomatoes) processed in a boiling water canner (Table 4.9).
Glass lids
There was no significant difference in subjective vacuum ratings observed with
low-acid versus high-acid foods with any of the treatments in the jars with glass lids (see
Table A.2 in Appendix A).

57
Table 4.9. Vacuum levels obtained in foods canned with metal and plastic lids using different closing treatments in low-acid foods processed in a pressure canner vs. high-acid foods processed in a boiling water canner
Average Vacuum Level1 (inches of Hg)
Treatment2 T1 T2 T3 T4
Lid Types3 ML PL ML PL ML PL ML PL
Food Type
16.07+1.66b*
16.10+4.10b
16.21+1.92b
16.05+2.22b
13.58+2.34b
12.03+3.51b
14.09+3.31b
13.70+3.17b Hot Apples
(n) 10 84 10 94 10 10 10 10
Hot Tomatoes
17.52+2.26b 13.68+2.16b 17.08+1.27b 14.58+3.82b 15.25+2.22b 13.24+2.35b 14.103+2.04b 11.34+4.106b
(n) 10 10 10 10 10 94 10 10
Hot Carrots 23.15+2.27a* 23.10+2.08a 23.57+1.64a 23.18+2.50a 20.65+3.22a 21.38+3.01a 21.23+2.57a 20.38+4.104a
(n) 10 10 10 10 10 10 10 84
Raw Carrots
23.08+1.54a 22.52+11.56a 22.18+1.89a 21.88+2.59a 20.88+1.44a 20.34+3.14a 20.89+2.62a 21.71+1.69a
(n) 10 10 10 10 10 10 10 10
p – value <0.0001 <0.0001 <0.0001 <0.0001 <0.0001 <0.0001 <0.0001 <0.0001 1 Means in the same column with different letters are significantly different at p < 0.05 (Tukey test) 2 T1 = Regular, T2 = Unwiped, T3 = Overfilled, T4 = Combination 3 ML = Metal Lids, PL = Plastic Lids 4 Total number of jars for each treatment would be 10 jars; seal failure was observed with plastic lids where a sample size size of less than 10 jars is indicated.

58
Comparison of Sealing Performance between Metal and Plastic Lids
A significant difference (p < 0.0001) in vacuum level was observed between
metal and plastic lids in hot-pack crushed tomatoes when jars from all storage periods
and treatments were analyzed together (Figure 4.1). There was a lower vacuum level in
jars with plastic lids compared to jars with metal lids. There was no difference in vacuum
level between these two lids in all the other food types (Table 4.10). In all the food types,
there was a significant difference in vacuum level was observed among treatments (Table
4.10). The lowest vacuum levels were measured in overfilled and combination treatments
for all food types with both metal and plastic lids (Figure 4.2).
Table 4.10. Comparison of vacuum levels between metal and plastic lids for different types of canned food for all storage periods and closing treatments combined
Food Types
(n)
Lid type comparison Treatment1
p – value p – value
Hot Apples 77 0.3631 0.0006
Hot Tomatoes 80 <0.0001 0.0113
Hot Carrots 79 0.8894 0.0063
Raw Carrots 80 0.7751 0.0112 1 Treatments included regular closing procedure (T1), unwiped (T2), overfilled (T3) and combination (T4)

59
Figure 4.1. Comparison between metal and plastic lids in hot-pack crushed tomatoes for all storage periods and treatments1 combined
1 Treatments included regular closing procedure (T1), unwiped (T2), overfilled (T3) and combination (T4)

60
Figure 4.2. Comparison between metal and plastic lids1 by treatment2 for all storage periods combined
1 ML = Metal lids, PL = Plastic lids 2 T1 = Regular, T2 = Unwiped, T3 = Overfilled, T4 = Combination
a) Hot-pack sliced apples b) Hot-pack crushed tomatoes
c) Hot-pack sliced carrots d) Raw-pack sliced carrots

61
Colorimetric Measurements
The mean colorimetric scales for all food types at 24 h after processing are listed
in the Table 4.11. These were used as the standard (L*, a*, and b*)for later comparisons
at storage intervals. For each storage interval of 10 d, 1 mo and 3 mo, color change is
recorded as the difference from this standard value and represented as dL, da and db
scales. If the mean dL, da and db value has a negative sign, that is an indication that color
of the food is slightly darker than the 24 h food color value. If it has a positive sign, then
it indicates that the color of the food is slightly lighter than 24 h food color value (Hunter
Associates Laboratory).
Table 4.11. Mean colorimetric measurement1 of foods at 24 hours after canning
Food Types (n) L* a* b*
Hot Apples 12 65.24 1.78 33.76
Hot Tomatoes 12 33.91 33.89 32.69
Hot Carrots 12 53.83 34.65 72.71
Raw Carrots 12 54.1 36.43 75.2 1 L* - Lightness, a* - Redness/greenness, b* - Yellowness/blueness
Colorimetric Measurement of Hot-pack Sliced Apples by Storage Periods at 21+1°C
The dL (lightness) scale is more appropriate for colorimetric measurements in
apples. The differences in dL scale measurements were not statistically significant for
metal or plastic lids. This indicates that the deviation in lightness scale did not differ
much during different storage periods when stored at 21+1°C. However, there was a

62
statistically significant difference with glass lids. The color change indicated some
darkening in apples with glass lids may have been due to the absorption of sugar syrup by
apple slices during storage which changed their opaqueness (Table 4.12). The db
(yellowness) scale is also appropriate for use with apples but there were no significant
differences across storage periods with any of the lid types.
Colorimetric Measurement of Hot-pack Crushed Tomatoes by Storage Periods at
21+1°C
The da (redness) scale is appropriate for colorimetric measurement in tomatoes.
The differences in the da scale measurement were not statistically significant for metal or
plastic lids. This indicates that the red color in tomatoes did not differ much during
different storage periods when stored at 21+1°C. The da scale showed a statistically
significant darkening at 1 mo for tomatoes canned with the glass lid. This color change
could be due to difference in sampling this product. Unlike the other foods this is a
mixture of solids and liquids versus solid food only that was not completely
heterogeneous. If the samples were scooped out of the jar with more solids they might
give darker redness than if scooped with more liquids to measure color (Table 4.13).
Even though significance was demonstrated, there is not a practical difference in color.
The random collection of sample from the jar also depends on the ease in scooping out
the sample. It is also noted that the glass jars used with glass lids a wide-mouth opening
compared to pint jars used with metal and plastic lids and this influenced ease of
sampling.

63
Colorimetric Measurement of Hot-pack Sliced Carrots by Storage Periods at
21+1°C
The dL, da and db values are all relevant when analyzing color in carrots. A slight
deviation in da (redness) and db (yellowness) scales was observed with different storage
periods (Table 4.14). Color of the carrots at 10 d was darker than at 24 h as measured on
the db scale. Throughout the next two storage periods, there were no statistically
significant changes in the db value from 10 d. However, there was an observed trend of
darkening as storage time increased as evidenced by the increasingly negative db values. .
As measured on the da scale, starting at 10 d, the carrots were lighter than they had been
at 24 h. There were no statistically significant changes in the da values during further
storage for any of the three lids. However, for metal and plastic lids a trend towards the
carrot slices becoming lighter in color due to the yellowness increasing. This trend was
not observed with glass lids; however. This lightening could be due to the leaching of
color into the covering liquid.
There was a significant difference in the dL scale over time with all three lid
types. After initial slight differences between 24 h and 10 d, all hot pack carrots
demonstrated a darkening on this scale as storage time increased. Even though statistics
indicated a difference, the degree is not of practical significance and could be attributed
to natural variations in the carrots and sample size. No color difference was observed
with color chip series.

64
Colorimetric Measurement of Raw-pack Sliced Carrots by Storage Periods at
21+1°C
There was no change in color on the dL scale at 10 d compared to 24 h. Slight
deviation in dL and db values was observed for metal lids only. The carrots became
slightly darker and more yellow over time, but again the differences were very small. No
other changes for any lids or storage periods were significant (Table 4.15).
Colorimetric Comparisons among Lid Types by Storage Period
When the color changes within a food type were compared over storage intervals
by lid type, there were no significant differences among lids except for hot pack apples
stored 3 mo (p = 0.0131). Apples stored for 3 months in jars with glass lids were
significantly darker than those stored in both plastic and glass lids were darker than those
stored in metal lids (Table 4.16). There were no significant differences in color for any
other foods regardless of the lid type or storage period (See Tables B.1, Table B.2, Table
B.3 in Appendix B).

65
Table 4.12. Colorimetric measurements of hot-pack sliced apples canned with three lid types by storage periods at 21+1°C for all closing treatments1 combined
Mean Colorimetric Measurements2,3
Lid
Types
Metal lids Plastic lids Glass lids
Storage
Periods
dL db dL db dL db
10 d -4.033a -1.602a -5.647a -2.185a -4.250a -1.128a
SD +2.72 +2.78 +3.52 +2.45 +1.81 +0.62
(n) 4 4 4
1 mo -7.228a -2.549a -7.218a -2.513a -7.778b -3.382a
SD +3.06 +3.22 +02.38 +1.37 +3.11 +2.71
(n) 8 8 8
3 mo -6.593a -0.676a -8.520a -1.039a -9.390b -1.163a
SD +2.29 +4.66 +1.47 +2.14 +1.22 +2.51
(n) 8 7 8
p - value 0.1774 0.6261 0.1820 0.3372 0.0068 0.1528 1 Treatments included regular closing procedure (T1), unwiped (T2), overfilled (T3) and combination (T4) 2 Means in the same column with different letters are significantly different at p < 0.05 3 dL = Lightness/darkness scale, db = Yellowness/blueness scale. If the mean dL and db value has a negative sign, that is an indication that color of the food is slightly darker than the 24 h food color value

66
Table 4.13. Colorimetric measurements of hot-pack crushed tomatoes canned with three lid types by storage periods at 21+1°C for all closing treatments1 combined
Mean Colorimetric Measurement2,3
Lid Types Metal lids Plastic lids Glass lids
Storage
Periods
da da da
10 d -0.188a 0.155a 1.100a
SD +1.09 +1.12 +1.47
(n) 4 4 4
1 mo -1.474a -2.026a -1.683b
SD +1.50 +1.97 +1.44
(n) 8 8 8
3 mo -0.995a -1.494a -0.319ab
SD +0.92 +1.91 +0.70
(n) 8 8 8
p - value 0.2544 0.1740 0.0046 1 Treatments included regular closing procedure (T1), unwiped (T2), overfilled (T3) and combination (T4) 2 Means in the same column with different letters are significantly different at p < 0.05 (Tukey test) 3 da = Redness/Greenness scale. If the mean da value has a negative sign, that is an indication that color of the food is slightly darker than the 24 h food color value
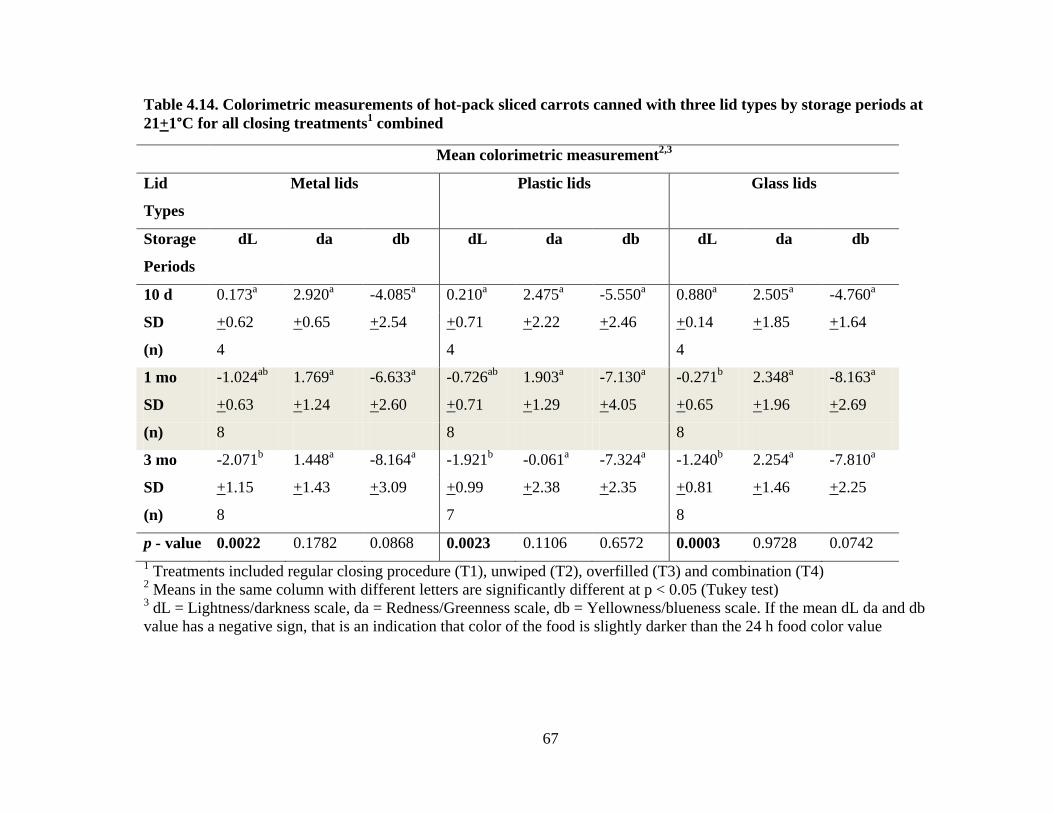
67
Table 4.14. Colorimetric measurements of hot-pack sliced carrots canned with three lid types by storage periods at 21+1°C for all closing treatments1 combined
Mean colorimetric measurement2,3
Lid
Types
Metal lids Plastic lids Glass lids
Storage
Periods
dL da db dL da db dL da db
10 d 0.173a 2.920a -4.085a 0.210a 2.475a -5.550a 0.880a 2.505a -4.760a
SD +0.62 +0.65 +2.54 +0.71 +2.22 +2.46 +0.14 +1.85 +1.64
(n) 4 4 4
1 mo -1.024ab 1.769a -6.633a -0.726ab 1.903a -7.130a -0.271b 2.348a -8.163a
SD +0.63 +1.24 +2.60 +0.71 +1.29 +4.05 +0.65 +1.96 +2.69
(n) 8 8 8
3 mo -2.071b 1.448a -8.164a -1.921b -0.061a -7.324a -1.240b 2.254a -7.810a
SD +1.15 +1.43 +3.09 +0.99 +2.38 +2.35 +0.81 +1.46 +2.25
(n) 8 7 8
p - value 0.0022 0.1782 0.0868 0.0023 0.1106 0.6572 0.0003 0.9728 0.0742 1 Treatments included regular closing procedure (T1), unwiped (T2), overfilled (T3) and combination (T4) 2 Means in the same column with different letters are significantly different at p < 0.05 (Tukey test) 3 dL = Lightness/darkness scale, da = Redness/Greenness scale, db = Yellowness/blueness scale. If the mean dL da and db value has a negative sign, that is an indication that color of the food is slightly darker than the 24 h food color value

68
Table 4.15. Colorimetric measurements of raw-pack sliced carrots canned with three lid types by storage periods at 21+1°C for all closing treatments1 combined
Mean colorimetric measurement1
Lid
Types
Metal lids Plastic lids Glass lids
Storage
Periods
dL da db dL da db dL da db
10 d 0.045a 0.673a -4.675a -0.193a -0.610a -6.240a -0.413a -0.378a -7.686a
SD +0.33 +0.47 +1.91 +0.52 +1.03 +1.50 +1.22 +2.40 +2.67
(n) 4 4 4
1 mo -0.735ab 0.441a -8.556ab -0.631a 1.014a -9.399a 0.241a 1.203a -9.525a
SD +0.81 +1.06 +3.38 +0.94 +0.59 +2.81 +0.45 +0.93 +3.54
(n) 8 8 8
3 mo -1.601b 0.188a -9.319b -1.176a 0.336a -9.936a -1.106a 0.410a -8.966a
SD +1.04 +0.80 +2.67 +1.04 +1.54 +2.58 +0.77 +1.08 +2.78
(n) 8 8 8
p - value 0.0171 0.6540 0.0480 0.2242 0.0939 0.0744 0.0950 0.1806 0.6887 1 Treatments included regular closing procedure (T1), unwiped (T2), overfilled (T3) and combination (T4) 2 Means in the same column with different letters are significantly different at p < 0.05 (Tukey test) 3 dL = Lightness/darkness scale, da = Redness/Greenness scale, db = Yellowness/blueness scale. If the mean dL da and db value has a negative sign, that is an indication that color of the food is slightly darker than the 24 h food color value

69
Table 4.16. Colorimetric comparisons of hot-pack sliced apples canned with three lid types stored for various periods at 21+1°C, with all closing treatments1 combined
Mean colorimetric measurement2,3
Lid Types4
10 d 1 mo 3 mo
Storage Periods
dL db dL db dL db
ML -4.033a -1.602a -7.228a -2.549a -6.593a -0.676a
SD +2.72 +2.78 +3.06 +3.22 +2.29 +4.66
(n) 4 8 8
PL -5.647a -2.185a -7.218a -2.513a -8.520ab -1.039a
SD +3.52 +2.45 +02.38 +1.37 +1.47 +2.14
(n) 4 8 7
GL -4.250a -1.128a -7.778a -3.382a -9.390b -1.163a
SD +1.81 +0.62 +3.11 +2.71 +1.22 +2.51
(n) 4 8 8
p-Value 0.6818 0.7931 0.9056 0.7466 0.0131 0.9557 1 Treatments included regular closing procedure (T1), unwiped (T2), overfilled (T3) and combination (T4) 2 Means in the same column with different letters are significantly different at p < 0.05 (Tukey test) 3 dL = Lightness/darkness scale, db = Yellowness/blueness scale. If the mean dL and db value has a negative sign, that is an indication that color of the food is slightly darker than the 24 h food color value 4 ML = Metal lids, PL = Plastic lids, GL = Glass lids

70
CHAPTER 5
DISCUSSION
Storage at Two Different Temperatures
All jars of canned foods were stored at two different temperatures; recommended
storage was represented by 21.1°C (70°F) and was used for all storage intervals. USDA
(2009) recommends storage temperatures between 10 to 21.1°C (50 – 70°F) for all home
canned foods. Additional jars were incubated at 35°C (95°F) up to 1 month to accelerate
the rate of spoilage from molds or some mesophilic bacteria if the process had been
inadequate or jars not sealed. In addition, this represents the maximum temperature for
storing home canned foods without risking spoilage from some thermophilic bacteria
(USDA 2009). Incubation of jars at 35°C (95°F) in this study did not indicate any visible
spoilage concerns or rise in pH. Discoloration of foods was only noted for apples, which
was true also at 21.1°C. Therefore, the incubation confirmed that no gross deviations in
applying the recommended canning processes should have occurred.
Jars stored at 21+1°C (70+1°F) were kept in a closed closet because USDA
recommends dark conditions for best quality foods (USDA 2009). Exposure to light can
lead to changes in food colors over time, especially for light-colored foods. If foods had
been under-processed or unsealed even at this temperature, visible mold, if not other
spoilage, could have been detected but was not. Mundt (1978) documented that mold
growth led to a rise in pH of home canned tomatoes. No rise in pH was detected in this
study, as expected since no mold growth occurred.
71
pH Studies
The canner to be used to process food depends on acidity of the food. Some foods
such as fruits may have naturally high acidity. Low-acid foods, like vegetables and meats,
have natural pH values higher than 4.6. Foods that have a pH value less than or equal to
4.6 are considered to be acid foods for canning purposes. These pH values from natural
acids do not let botulinum spores germinate and produce toxin even if present. The
botulinum spores in low-acid foods must be inactivated by heat during canning;
otherwise they could germinate and produce toxin at room temperature. This inactivation
can be achieved by using a pressure canner; all low-acid foods must be processed using
this type of canner (USDA 2009). Apples used in the study are naturally high-acid foods
and were processed in a boiling water canner (Andress and Harrison 2006). The pH of
some tomatoes used in this study was either close to or above 4.6; some raw tomatoes
had a pH of 4.4 and cooked tomatoes (prior to cooking) had a pH of 4.64. The pH of
canned tomatoes decreased from the initial pH of raw tomatoes due to our acidification
process. Even though tomatoes are canned as an acid food, some varieties can have a pH
greater than 4.6 (Powers 1976; Sapers 1978). To can them safely without any spoilage
(Sapers 1978), tomatoes in this study were acidified by adding ¼ tsp of citric acid to each
jar of crushed tomatoes (USDA 2009). Acidification was done to prevent the outgrowth
of Clostridium botulinum bacteria and toxin production. The pH of carrots used in this
study was above 4.6, so all carrots were processed in a pressure canner (Andress and
Harrison 2006; USDA 2009).

72
Vacuum Studies
Vacuum Level by Treatment and Lid Types
When comparing measurements made with metal or plastic lids at 24 h post
processing, lower vacuum levels were observed most often in overfilled and combination
treatments in all food types compared to recommended treatments with headspace. This
study showed that maintaining recommended headspace will give a better vacuum.
Reduced headspace may result in contents of the jar boiling out during processing
(Andress and Harrison 2006) and also a lack of sufficient space required for the
expansion of food as they are processed (USDA 2009; Gavin and Weddig 1995).
Additionally, maintaining recommended headspace is very important to form a vacuum
in cooled jars (USDA 2009; Gavin and Weddig 1995). Overfilled jars of high oxygen-
containing foods like apples might require longer processing to displace air being forced
out of the food (Gavin and Weddig 1995). In addition, when jars have a very small
headspace, there is less empty space to contract and create the vacuum. Failure to wipe
jar surface did not impact the vacuum level, but it was not expected to unless food had
become trapped in the seal. As jars were opened, a visual inspection did not reveal any
trapped food or seeds. There were inconsistent results for the food types used in this
study as to whether metal or plastic lids demonstrated higher vacuum levels. When
canning the hot tomatoes only, vacuum levels with plastic lids were significantly lower
than with metal lids. However, there is no apparent scientific explanation that would
explain this happening with only tomatoes. Glass lids did not show any difference in
subjective vacuum ratings; other methods would be needed to demonstrate any
differences, if they exist.

73
Vacuum Level by Storage
With hot-pack sliced apples, lower vacuum levels were observed with the 3 mo
storage period in metal lids and plastic lids when compared to 24 h and 1 mo. Lowest
vacuum level were observed with apples which was expected due to excessive air content
in the tissues of the fruit compared to other fruits and vegetables (Gavin and Wedding
1995). In hot-pack sliced carrots, the lowest vacuum level was observed at 24 h with all
three types of lids compared to other storage periods. This unexpected result might be
due to the fact that fewer jars were opened at 24 h than during the storage periods. In
addition, unique jars are opened each time, and every jar may not have achieved the same
vacuum after canning.
Vacuum Level by Food Type
The higher vacuum level achieved with low-acid foods was expected due to being
processed in a pressure canner. The expansion of food during processing is related to the
food type and also to the processing temperature. The higher the temperature, the greater
the expansion that occurs to remove the air within the jar. The higher processing
temperature in a pressure canner of 115.6°C (240°F) is much higher compared to boiling
water (USDA 2009). For all treatments combined, there was little difference in vacuum
levels obtained in canned carrots whether hot- or raw-packed. All vacuum levels obtained
for carrots are within the desired range (22–26 inches Hg) for pressure canned foods.
Summary for Vacuum Levels Studies
No consistent differences were demonstrated in vacuum levels obtained by metal
or plastic lids, except in hot pack tomatoes. Further work is indicated to investigate some
of the trends for lower vacuum levels observed. For example, larger sample sizes may be

74
needed to have additional data at each storage period and for each treatment. Even though
analyses after 3 months were not included in the full comparisons reported here, some
additional jars remained in storage and could be analyzed for apples. The results so far
have revealed lower vacuum levels at 9 months than were found at 3 months. In
particular, vacuum levels as low as 7 and 9 inches Hg have been observed in hot pack
apples with plastic and metal lids, respectively. Loss of vacuum may occur over storage
time with different lid types for certain kinds of foods. Therefore, there could be a
different picture for retention of adequate vacuum over the recommended storage time of
one year.
This study also supports the USDA recommendation for using self-sealing metal
lids for canning foods to achieve higher vacuum levels. In a previous study (Kuhn and
Hamilton 1976), many lids available in the market place at that time showed significant
numbers of lid seal failures. Our study showed only few seal failures with plastic and
glass lids, out of 160 samples with each lid. Home canners need to decide if that loss is
acceptable. Ideally no seal failure should be expected. This study also demonstrated that
the faulty practice of overfilling foods while canning at home might compromise lid
sealing performance and vacuum level. A lower vacuum level and weak sealing
performance of lids might result in discoloration of food. Failure to wipe the sealing
surface of the jars did not affect the vacuum level. However, not wiping a sealing surface
contaminated with obvious seeds or other food particles might influence vacuum level
and result in seal failure (USDA 2009).

75
Colorimetric Measurements
Hot-pack Sliced Apples
The discoloration of canned apples in storage was most likely due to the presence
of air in the tissues despite using a hot pack. Apples are naturally high in tissue oxygen
but cannot be overheated during preparation or the slices will fall apart. The browning of
apple slices occurred with all lids used. The greater difference with the dL (lightness)
value for the glass lids may be due sampling unique jars each time. Future research could
increase sample sizes and look at the interaction with lower liquid levels also being in
glass lid jars. In addition, canned apples had the lowest initial vacuum levels in this study
compared to other foods. The texture of apple slices processed with the glass lids was
also observed to be less firm when sample cups were being filled for colorimetric
measurements.
Hot-pack Crushed Tomatoes
A slight darkening of color (redness) was observed over time with tomatoes
canned with both metal and plastic lid, with the trend being more darkening with plastic
lids. However, none of the differences were statistically significant. No color changes in
tomatoes were visually observed. As noted in the results chapter, the variable consistency
and size of the crushed tomatoes, as well as the amount of tomato juice present in each
jar, could have influenced the color measurement. Due to weather conditions affecting
the supple of tomatoes from the initial source, tomatoes had to be purchased from
additional source. These tomatoes, while fresh were of a different variety and not quite as
firm as the earlier tomatoes. It could have been a better measure to select juice or pieces
only. It also is possible that visual observations are just as important in determining

76
acceptability of color changes, if not more important. All canned tomatoes showed
excellent color retention which is similar to results found in canned tomatoes by Skelton
and Marr (1978).
Hot- and Raw-pack Sliced Carrots
An increased value of ‘da’ (drop in redness) and also decreased value of ‘db’
(drop in yellowness) occurs with cooking of carrots due to leaching of pigments. Cooking
carrots at high temperature has been shown to remove or leach out red tones (Sun and
Temelli 2002). As red tone decreases, yellow tone increases. In the current study, the
differences in color with hot- or raw-pack sliced carrots did not show a statistically
significant change over time. Both retained good color up to 3 months of dark storage.
Summary for Colorimetric Measurement
This study continues to document that release of entrapped air during processing
is very important for the retention of food color as did earlier studies (Esselen and Fellers
1948). Heating food prior to filling jars and maintaining recommended headspace help to
release a good amount of entrapped air in the jar and prevent under-processing.
Insufficient removal of oxygen from the food tissues (hot-pack sliced apples) and/or
liquid levels lower than the food most likely resulted in darkening of the stored apples in
this study. No particular changes could be attributed to the food being stored with metal
or plastic lids. The greater darkening in apples with glass lids was most likely a result of
oxygen remaining in the jar and/or lower liquid levels in these jars. Although the glass
lids may allow more exposure to light, this was controlled by storage in the closed dark
closet.

77
CHAPTER 6
SUMMARY AND CONCLUSIONS
Many consumers are interested in home canning their fruits and vegetables so
they can enjoy their canned food year round. Home canning is defined as packing raw or
preheated foods into jars with various types of liquids and then heat processing the filled
jars in a boiling water canner or pressure canner. The process temperature and time
combinations are scientifically determined for each food and jar type to prevent
foodborne illness and spoilage. Canning allows consumers to store their finished product
at room temperature for a long period of time. There are many canning procedures that
are published in cookbooks, on websites and in blogs. Some consumers may modify
tested methods or make up their own recipes for canning and process them in a manner
that is not scientifically tested. These practices can put consumers at risk for food
spoilage (loss), foodborne illness or even death from botulism poisoning.
USDA provides many home canning procedures which are scientifically
developed and readily available to consumers who wish to can their foods at home
(NCHFP 2014, USDA 2009). In addition, the nationwide landgrant university system
makes science-based home canning recommendations available through the Cooperative
Extension System, publications, websites, social media and community educational
programs and offices. The University of Georgia publishes a book,“So Easy to Preserve,”
and has a series of free factsheets which have many scientifically tested recipes for
consumers to use in preserving food at home. One of the reasons to recommend that

78
consumers follow a reliable source of information to preserve food at home is to prevent
growth and survival of spoilage or pathogenic microorganisms (especially Clostridium
botulinum). Unfortunately, individuals are able to publish and share their own home
canning advice which may not be based on sound science and are using books and the
Internet to do so.
With the increasing popularity of home canning in the past few years, interest has
also increased in the variety of home canning supplies available. There are three major
types of jar sealing systems in use today in the U.S. The purpose of this study was to
determine the sealing success rate and the vacuum levels achieved inside the jar with all
three lid systems (metal, plastic and glass). The second goal was to determine the
relationship of sealing performance of lids and food quality during storage (colorimetric
study), and the final goal was to determine the retention of vacuum levels during storage
(24 h, 10 d, 1 mo and 3 mo).
Four types of foods were prepared as per USDA home canning recommendations.
These foods were individually packed into pint- or half-liter size glass jars and closed
with the three different types of lids. Jar sealing methods included USDA recommended
procedures as well as experimental treatments representing common faulty practices that
may be followed by some home canners which could influence sealing of lids, such as
overfilling and not wiping sealing surfaces clean before applying lids. Jars were
processed in either a boiling water canner (acid foods) or pressure canner (low-acid
foods) for the USDA recommended process time. After processing and 24 hours of
cooling, sealed jars were stored for three storage intervals (10 d, 1 mo and 3 mo) in two
different locations (a dark closet maintained at 21+1°C or an incubator maintained at

79
35+1°C). Initial analyses of sealing success and vacuum level were made at 24 h. At 10
d, 1 mo and 3 mo, jars were removed from the storage areas for analyses. These analyses
included presence of intact seals and vacuum levels; vacuum levels were measured
objectively for metal and plastic lids and subjectively for glass lids. The foods at all
intervals were also analyzed for color retention using a HunterLab MiniScan XE Plus
colorimeter.
Our results demonstrated that all three lid types had acceptable sealing
performance and vacuum levels not only with recommended jar closing procedures
(regular treatment) but also with the experimental jar filling and closing treatments. No
denting or rust formation occurred with metal lids up to the 3 months of storage used for
analyses in this study. No unnatural deformation or cuts in the rubber rings used with
plastic and glass lids were noted. All jars sealed initially after 24 hours of cooling.
It was observed that 100 percent sealing and maintenance of vacuum during
storage up to 3 months was found only with the traditional two-piece metal lid system.
Although some seal failures during storage were observed with plastic and glass lids, it
was a total of four for plastic lids and two for glass lids, four of these failures occurred at
the elevated storage temperature of 35+1°C which is above the recommended range of 10
to 21.1°C (50 to 70°F) for best quality of stored canned foods (USDA 2009). Since three
of the seal failures were discovered after 1 month storage (2 in plastic lids and 1 in glass
lids) and two were discovered after 3 months storage (both with plastic lids), it is
recommended that future studies continue to look at storage intervals and longer storage
periods than 3 months, especially with lid systems using rubber rings.

80
Some issues with color retention over time were noted but only for the canned
apples. Hot pack apples, which should have acceptable color retention at least up to one
year in recommended conditions, had observable browning with all lid and treatment
types starting at 1 month. This is not always noted in home canned apples following
USDA recommendations. The preheating period for hot packing apple slices can be very
variable for removing maximum oxygen before filling jars, however. Color changes in
the canned tomatoes and carrots were not noticeably different when jars were analyzed.
Differences picked up through analysis with the Hunter colorimeter could be attributed to
possible natural variation in the foods.
These findings continue to demonstrate the expected success with the traditional
two-piece metal lid system while not discouraging the use of the plastic and glass lids.
Maintenance of seals and vacuum levels throughout storage as well as good food color
were observed with the metal lids except in the case of canned apples. In addition, the
metal lid system used does have a visual indication of vacuum in the sealed flat lid that is
missing in the plastic and glass lids. (In the plastic and glass lids, presence of vacuum is
determined by the inability to lift the lid free of the rubber ring.)
This study provides scientific evidence about the sealing and storage performance
for three lid systems available in the marketplace for the first time. The methods will
serve as a model and will facilitate other research to evaluate and compare lid
performance under other conditions, such as other food types and jar filling procedures.
Overall this study benefits and encourages successful home canning.

81
Suggestions for Future Research
This study compared and evaluated lid performance in the home canning of hot
pack apples, hot pack crushed tomatoes and carrots subjected to certain processing times.
These foods were chosen to represent specific challenges to home canning lid systems.
However, testing these limited food types and their processing times will not be
representative and generalizable for all types of foods. Only two different types of
canners were used in this study, but there are several different types of canners in the
market. This study also used only qualitative parameters like discoloration of foods and
visual observation of the rubber gasket to assess food spoilage and lid quality
respectively, instead of some quantitative tests like microbiological evaluation of foods,
or mechanically assessing the deformation and strength of the rubber gasket or ring.
Previous studies have shown that these methods provide reliable data with the foods
chosen to test the lid performances (Kuhn and Hamilton 1976); however, these results
may not detect all issues with the canning lid systems.
All the rubber rings used with plastic lids had permanent impressions on both
sides, the side placed against the surface of the jar as well as that against the plastic lid.
The manufacturer claims that their lids and rubber rings are both reusable; the lids forever
and the rubber rings until the consumer decides they should no longer be used because of
deformation or cuts. There is not a specific recommendation of how many times they
should be reused. In our study we did not reuse the lids or rubber rings and hence we do
not know whether the continued use of these rubber rings will yield the same results for
sealing and vacuum as found in our study. Future studies should explore the reuse of
these rubber rings with regard to sealing success and vacuum levels obtained.

82
Our methods did not allow for objective measurement of vacuum levels achieved
with glass lids or actual oxygen retention with any of the lids. Methods currently used in
various settings for measuring vacuum levels in canned foods involve punching holes in
metal lids to measure headspace vacuum. Our study adapted this style of measurement to
a vacuum gauge attached to a drill to accommodate the plastic lids. Future research could
develop and use mechanical methods for the measurement of vacuum with the glass lid
system; these methods were not possible within the available funding for this study.
Addressing and incorporating all the above considerations or limitations was not
practically feasible within the scope of this study. In addition, data indicate that carrying
out the storage studies past 3 months would be important in any future studies of seal
failures and retention of vacuum levels in storage. Using larger sample sizes for each
food would allow for more comparisons at each storage interval for each treatment.
However, this study showed the feasibility of our approach and has successfully provided
valuable data for other researchers interested in studying additional conditions of lid use.
It also supports the use of any of these three lid systems in home canning with respect to
sealing rates and maintenance of vacuum for at least 3 months of food storage.

83
REFERENCES
Anderson, D., and V. T. Mendenhall. 1978. A survey of tomatoes home-canned in Utah. J Food Prot. 41(7):514-517.
Andress, E. L., and G.D. Kuhn. 1983. Critical Review of Home Food Preservation Literature and Current Research. Report to U.S. Department of Agriculture, Extension Service, Washington, DC. Part I: 189 pp., Part II: 71 pp.
Andress., E. L., and R. Tauxe. 2011. Three outbreaks of foodborne botulism caused by unsafe home canning of vegetables – Ohio and Washington, 2008 and 2009. J Food Prot;74:2030-2096. doi: 10.4315/0362-028X.JFP-11-128.
Andress, E. L. 2002. A national survey of current home canning practices in the US. National Center for Home Food Preservation, Department of Foods and Nutrition, The University of Georgia, Athens, GA.Available at: http://nchfp.uga.edu/papers/2002/canning_survey.html. Accessed 13 February 2013.
Andress, E. L. 2010. Personal email correspondence with Brad Stieg, President of S&S Innovations, Corp.
Andress, E. L. 2011. Preserving Food: Using Pressure Canners. The University of Georgia Cooperative Extension.
Andress, E. L.2011. Preserving Food: Using Boiling Water Canners. The University of Georgia Cooperative Extension.
Andress, E. L. Personal email correspondence with David Watson, Jarden Corporation, October 2012.
Andress, E. L., and J. A. Harrison (ed.). 2006. So easy to preserve. 5th ed. Athens, GA: Cooperative Extension Service, University of Georgia.

84
Can Manufacturer Institute. 2013. Invention. Can Manufacturer Institute. Available at: http://www.cancentral.com/content/nicolas-appert-father-canning. Accessed 20 August 2013.
Centers for Disease Control and Prevention (CDC). 2012. Home canning and botulism. Available at: http://www.cdc.gov/features/homecanning. Accessed 03 February 2013.
Chesswood. 2008. The History of Food Canning. Available at: http://thetruthaboutstuff.com/pdf/(46)%20History%20of%20Commercial%20and%20Home%20Canning.pdf. Accessed 20 August 2013.
Date, K., R. Fagan, S. Crossland, D. MacEachern, B. Pyper, R. Bokanyi, Y. Houze, E. L. Andress, and R. Tauxe. 2011. Three outbreaks of foodborne botulism caused by unsafe home canning of vegetables – Ohio and Washington, 2008 and 2009. J Food Prot. 74:2030-2096. doi: 10.4315/0362-028X.JFP-11-128.
Davis, R. 2010. Interest in home canning grows in Montgomery County. Gazette.net (Maryland Community Newspaper Online). Available at: http://ww2.gazette.net/stories/10062010/potonew210833_32546.php. Accessed 06 February 2013.
Downing, D. L. 1996. Fundamental Information on Canning. In A Complete Course in Canning, 13th. ed. Timonium, MD: CTI Publications.
D’Sa, E. M., E. L. Andress, J. A. Harrison, and M. A. Harrison. 2007. Survey of Home Canning Practices and Safety Issues in the U.S. National Center for Home Food Preservation, Department of Foods and Nutrition, The University of Georgia, Athens, GA. Available at: http://nchfp.uga.edu/papers/2007/canning_survey.html. Accessed 10 February 2013.
Esselen, W. B. Jr., and C. R. Fellers. 1948. Effect of different processing procedures on venting and loss of liquid from home canning jars. Food Tech. 2:222-227.
Esther. 2012. The History of Home Canning. Off The Grid News. Available at: http://www.offthegridnews.com/2012/09/06/the-history-of-home-canning/#. Accessed 20 August 2013.

85
Fields, M. L., A. F. Zamora, and M. Bradsher. 1977. Microbiological analysis of home-canned tomatoes and green beans. J Food Sci. 42:931.
Gavin, A., and L. M. Weddig (ed.). 1995. Canned Foods – Principles of Thermal Process Control, Acidification and Container Closure Evaluation, 6th Edition. The Food Processors Institute, Washington, D.C.
Gill, M. I., J. R. Gorny, and A. A. Kader. 1998. Responses of ‘Fuji’ Apple Slices to Ascorbic Acid Treatments and Low-oxygen Atmospheres. Hortscience. 33(2):305-309.
Gutheil, R. A., L. G. Price, B. G. Swanson. 1980. pH, acidity, and vitamin C content of fresh and canned homegrown Washington tomatoes. J Food Prot. 43(5):366-369.
Huhtanen, C. N., J. Nashski, C.S. Custer, and R. W. Russell. 1976. Growth an toxin production by Clostridium botulinum in moldy tomato juice. Appl Environ Microbiol. 32:711.
Hunter Associates Laboratory. Undated. MiniScan® EZ User’s Manual. Version 1.2. Hunter Associates Laboratory, Inc, Virginia 20190.
Jarden Corporation. 2010. Consumers turn to home canning to eat local, healthy, homemade. PR Newswire [online]. Available at: http://www.prnewswire.com/news-releases/consumers-turn-to-home-canning-to-eat-local-healthy-homemade-95504554.html. Accessed 06 February 2013.
Jarden Corporation. 2012. Home canning is season’s hottest food trend; consumers preserve the fresh flavors of summer in growing numbers. PR Newswire [online]. Available at: http://www.prnewswire.com/news-releases/home-canning-is-seasons-hottest-food-trend-consumers-preserve-the-fresh-flavors-of-summer-in-growing-numbers-167020925.html. Accessed 10 January 2013.
Kuhn, G. D., and L. W. Hamilton. 1976. Sealing performance of jar lids for home canning. University Park, PA: Agricultural Experiment station, Pennsylvania State University. [Progress Report 357.].

86
Lackey, K. 2010. Local food movement spurs canning trend: Get those jars ready. USA Today [online]. Available at: http://usatoday30.usatoday.com/yourlife/food/2010-09-22-canning22_ST_N.htm. Accessed 08 January 2013.
Milner, M. 1978. Fruit Jars – A history worth remembering. Bottles and extras 2004. Available at: http://www.fohbc.org/PDF_Files/Milner_FruitJars.pdf. Accessed 20 August 2013.
Mundt, J. O. 1978. Effect of mold growth on the pH of tomato juice. J Food Prot. 41(4):267-268.
Montville, T. J. 1982. Metabiotic effect of Bacillus licheniformis on Clostridium botulinum: implications for home-canned tomatoes. Appl Environ Microbiol. 44:34.
National Center for Home Food Preservation (NCHFP). 2014.Website. Available at: nchfp.uga.edu. Accessed 12 March 2014.
National Presto Industries Inc. 2012. Pressure canning. Available at: http://www.gopresto.com/recipes/canning/faq.php#9. Assessed 06 February 2013.
Nummer, B. A. 2002. Historical origins of food preservation. National Center for Home Food Preservation 2002. Available at: http://nchfp.uga.edu/publications/nchfp/factsheets/food_pres_hist.html. Accessed 20 August 2013.
Odlaug, T. E. and I. J. Pflug. 1978. Clostridium botulinum and acid foods. J Food Prot. 41:566.
Pakola, R. J. 2002. Heat penetration studies of stewed tomatoes in 6, 8, and 17 quart household pressure retorts. Master Thesis. The University of Georgia.
Pennsylvania Department of Health. 2008. Health department warns consumers of home-canned soup linked to Potter county restaurant. Harrisburg, PA: Dept of Health. [News release. 03 January 2008).

87
Powers, J. J. 1976. Effect of acidification of canned tomatoes on quality and shelf life. CRC Crit Rev Food Sci. 7:371-396.
Sapers, G. A. M., J. G. Phillips, F. B. Talley, J. Panasiuk, Carre. 1978. Acidulation of home canned tomatoes. J Food Sci. 43:1079-1082.
S&S Innovations, Corp. 2013. Reusable Canning Lids. Website. Available at: http://www.reusablecanninglids.com/. Accessed 21 August 2013).
Skelton, M. M., and C. W. Marr. 1978. Ascorbic acid content, pH, and acceptability of tomatoes processed by different home canning methods. Home Econ Res J. 6(4):305-311.
Spurling, C, P. 2006. Food safety No. 1 priority for home canners. The Spokesman-Review. Available at: www.spokesman.com/stories/2006/sep/20/food-safety-no-1-priority-for-home-canners. Accessed on 15 March 2013.
Sun, M., and F. Temelli. 2002. Supercritical CO2 extraction of carotenoids from carrots and evaluation of products. J Supercrit Fluids, Vol. 37, No. 3. pp. 397-408. doi:10.1016/j.supflu.2006.01.008.
Taube, K., and V. E. Sater. 1948. Canning vegetables in the pressure saucepan. J Home Econ 1948. 40:197-198.
Trafton, A. 2011. Canned, good – More than 100 years ago, 2 pioneering scientists figured out how to keep canned food safe. MIT news. Available at: http://web.mit.edu/newsoffice/2011/timeline-canning-0112.html. Accessed 20 August 2013.
United States Department of Agriculture. 2009. Complete Guide to Home Canning. Washington, DC: National Institute of Food and Agriculture-USDA [USDA Agriculture Information Bulletin No. 539.].
VanGarde, S. J., and M. Woodburn. 1994. Food Preservation and Safety – Principles and Practice. Iowa State University Press, Iowa 50014.

88
Walsh, B. H., and R. P. Bates. 1978. Safety of home canning procedures for low-acid foods. J Food Sci. 43:139.
Weck Jars. 2010. Website. Available at: http://weckjars.com/about.php. Accessed 21 August 2013.

89
APPENDIX A
SUBJECTIVE VACUUM RATINGS FOR GLASS LIDS
Table A.1. Subjective vacuum ratings obtained in foods canned with glass lids for all closing treatments1 combined at different storage periods
Average vacuum ratings2,3
Food Types Hot Apples Hot Tomatoes Hot Carrots Raw Carrots
Storage period
24 h 5.00+0.00a 5.00+0.00a 4.00+1.15b 5.00+0.00a
(n) 4 4 4 4
10 d 4.83+0.58a 5.00+0.00a 5.00+0.00a 4.33+1.30a
(n) 12 12 114 12
1 mo 4.75+1.00a 4.87+0.52a 4.63+0.81ab 5.00+0.00a
(n) 16 154 16 16
3 mo 5.00+0.00a 5.00+0.00a 5.00+0.00a 5.00+0.00a
(n) 8 8 8 8
p – value 0.8701 0.7543 0.0482 0.0616 1 Treatments included regular closing procedure (T1), unwiped (T2), overfilled (T3) and combination (T4) 2 Means in the same column with different letters are significantly different at p < 0.05 (Tukey test) 3 Vacuum ratings 0 – seal failure, 1- very poor, 2 – poor, 3 – good, 4 – very good and 5 – excellent 4 Seal failures lowered the aample size compared to the n for metal lids at these storage periods.

90
Table A.2. Subjective vacuum ratings obtained in foods canned with glass lids using different closing treatments in low-acid foods processed in a pressure canner vs. high-acid foods processed in a boiling water canner
Average vacuum ratings1,2
Treatment3 T1 T2 T3 T4
Food Type
Hot Apples 5.00+0.00a 4.60+1.26a 5.00+0.00a 4.80+0.63a
(n) 10 10 10 10
Hot Tomatoes
5.00+0.00a 4.80+0.63a 5.00+0.00a 5.00+0.00a
(n) 10 10 94 10
Hot Carrots 4.80+0.63a 5.00+0.00a 4.60+0.84a 4.56+0.88a
(n) 10 10 10 94
Raw Carrots 5.00+0.00a 5.00+0.00a 4.80+0.63a 4.40+1.35a
(n) 10 10 10 10
p – value 0.4040 0.5390 0.5390 0.4375 1 Means in the same column with different letters are significantly different at p < 0.05 (Tukey test) 2 Vacuum ratings 0 – seal failure, 1- very poor, 2 – poor, 3 – good, 4 – very good and 5 – excellent 3 T1 = Regular, T2 = Unwiped, T3 = Overfilled, T4 = Combination 4 Total number of jars for each treatment would be 10 jars; Seal failure was observed with glass lids that has less than 10 jars in each treatment

91
APPENDIX B
ADDITIONAL COLORIMETRIC MEASUREMENTS
Table B.1. Colorimetric comparisons of hot-pack crushed tomatoes canned with three lid types stored for various periods at 21+1°C, with all closing treatments1 combined
Mean colorimetric measurement2,3
Lid Types4 10 d 1 mo 3 mo
Storage Periods
da da da
ML -0.188a -1.474a -0.995a
SD +1.09 +1.50 +0.92
(n) 4 8 8
PL 0.155a -2.026a -1.494a
SD +1.12 +1.97 +1.91
(n) 4 8 8
GL 1.100a -1.683a -0.319a
SD +1.47 +1.44 +0.70
(n) 4 8 8
p-Value 0.3561 0.7980 0.2115 1 Treatments included regular closing procedure (T1), unwiped (T2), overfilled (T3) and combination (T4) 2 Means in the same column with different letters are significantly different at p < 0.05 (Tukey test) 3 dL = Lightness/darkness scale, db = Yellowness/blueness scale. If the mean dL and db value has a negative sign, that is an indication that color of the food is slightly darker than the 24 h food color value 4 ML = Metal lids, PL = Plastic lids, GL = Glass lids

92
Table B.2. Colorimetric comparisons of hot-pack sliced carrots canned with three lid types stored for various periods at 21+1°C, with all closing treatments1 combined
Mean colorimetric measurement2,3
Storage Period
10 d 1 mo 3 mo
Lid Type4
dL da db dL da db dL da db
ML 0.173a 2.920a -4.085a -1.024a 1.769a -6.633a -2.071a 1.448a -8.164a
SD +0.62 +0.65 +2.54 +0.63 +1.24 +2.60 +1.15 +1.43 +3.09
(n) 4 8 8
PL 0.210a 2.475a -5.550a -0.726a 1.903a -7.130a -1.921a -0.061a -7.324a
SD +0.71 +2.22 +2.46 +0.71 +1.29 +4.05 +0.99 +2.38 +2.35
(n) 4 8 7
GL 0.880a 2.505a -4.760a -0.271a 2.348a -8.163a -1.240a 2.254a -7.810a
SD +0.14 +1.85 +1.64 +0.65 +1.96 +2.69 +0.81 +1.46 +2.25
(n) 4 8 8
p-Value 0.1806 0.9196 0.665 0.981 0.7342 0.6254 0.2300 0.0794 0.8246 1 Treatments included regular closing procedure (T1), unwiped (T2), overfilled (T3) and combination (T4) 2 Means in the same column with different letters are significantly different at p < 0.05 (Tukey test) 3 dL = Lightness/darkness scale, da = Redness/Greenness scale, db = Yellowness/blueness scale. If the mean dL, da and db value has a negative sign, that is an indication that color of the food is slightly darker than the 24 h food color value 4 ML = Metal lids, PL = Plastic lids, GL = Glass lids

93
Table B.3. Colorimetric comparisons of raw-pack sliced carrots canned with three lid types stored for various periods at 21+1°C, with all closing treatments1 combined
Mean colorimetric measurement2,3
Storage Period
10 d 1 mo 3 mo
Lid Type4
dL da db dL da db dL da db
ML 0.045a 0.673a -4.675a -0.735a 0.441a -8.556a -1.601a 0.188a -9.319a
SD +0.33 +0.47 +1.91 +0.81 +1.06 +3.38 +1.04 +0.80 +2.67
(n) 4 8 8
PL -0.193a -0.610a -6.240a -0.631a 1.014a -9.399a -1.176a 0.336a -9.936a
SD +0.52 +1.03 +1.50 +0.94 +0.59 +2.81 +1.04 +1.54 +2.58
(n) 4 8 8
GL -0.413a -0.378a -7.686a 0.241a 1.203a -9.525a -1.106a 0.410a -8.966a
SD +1.22 +2.40 +2.67 +0.45 +0.93 +3.54 +0.77 +1.08 +2.78
(n) 4 8 8
p-Value 0.7242 0.4793 0.1518 0.4102 0.0720 0.8131 0.5456 0.9834 0.7663 1 Treatments included regular closing procedure (T1), unwiped (T2), overfilled (T3) and combination (T4) 2 Means in the same column with different letters are significantly different at p < 0.05 (Tukey test) 3 dL = Lightness/darkness scale, da = Redness/Greenness scale, db = Yellowness/blueness scale. If the mean dL, da and db value has a negative sign, that is an indication that color of the food is slightly darker than the 24 h food color value 4 ML = Metal lids, PL = Plastic lids, GL = Glass lids

94
APPENDIX C
STEP BY STEP PROCESSING OF FOODS

95
a. Soaking apples in ascorbic acid b. Cooking apples in sugar syrup
c. Apples are ready to fill into the jars d. Preparing plastic lids and rubber rings
e. Measuring headspace f. Jars are ready to can
Figure C.1. Step-by-step process of canning hot-pack sliced apples

96
g. Jars arranged in a canner rack h. Jars lowered into the canner
i. Processing apples j. Jars removed from canner
k. Jars stored at 21+1°C l. Jars stored at 35+1°C
Figure C.1. Step-by-step process of canning hot-pack sliced apples

97
a. Prepared tomatoes b. Blanching
c. Tomatoes are quartered d. Initial layer of tomatoes are cooked
e. Second batch of quartered tomatoes f. Preparing plastic lids and rubber rings added and cooked
Figure.C.2. Step-by-step process of canning hot-pack crushed tomatoes

98
g. Jars arranged in a canner rack h. Jars lowered into the canner
i. Processing tomatoes j. Jars removed from canner
k. Jars stored at 21+1°C l. Jars stored at 35+1°C
Figure.C.2. Step-by-step process of canning hot-pack crushed tomatoes

99
a. Boiling water to cook carrots b. Filling prepared carrots into jars
c. Measuring fill weight of carrots d. Jars filled with carrots
e. Preparing plastic lids and rubber rings f. Ready to can jars
Figure C.3. Step-by-step process of canning hot-pack sliced carrots

100
g. Screw band tightened using h. Jars lowered into the canner Torque tester
i. Processing carrots j. Jars removed from canner
k. Jars stored at 21+1°C l. Jars stored at 35+1°C
Figure C.3. Step-by-step process of canning hot-pack sliced carrots

101
a. Boiling water to add into the jar b. Filling prepared carrots into jars
c. Measuring fill weight of carrots d. Jars filled with carrots
e. Preparing plastic lids and rubber rings f. Jars are ready to can
Figure C.4. Step-by-step process of canning raw-pack sliced carrots

102
g. Screw band tightened using h. Jars lowered into the canner Torque tester
i. Processing Carrots j. Jars removed from canner
k. Jars stored at 21+1°C l. Jars stored at 35+1°C
Figure C.4. Step-by-step process of canning raw-pack sliced carrots

103
APPENDIX D
LIST OF EQIPMENT AND INGREDIENTS
Home Canning Equipment and Supplies
Aluminum weighted gauge pressure canner with rack
(National Presto Industries, Inc. Eau Claire, Wisconsin 54703)
16 quart Pressure canner, Model 01745
Stainless steel boiling water canner with rack
(Jarden Home Brands, Daleville, IN 47334)
21 quart canner, Collection elite, Model 229682
Ball jars and ringbands, regular mouth pints, for use with Ball and Tattler lids
Ball metal lids, regular mouth
(Jarden Home Brands, Daleville, IN 47334)
Tattler plastic lids and rubber rings
(S&S Innovations, Corp. Fruita, CO 81521)
Weck jars with glass lids and rubber rings, ½ liter mold jar, Model 742
(Weck Jars, Crystal Lake, IL 60014)
Jar lifter, bubble freer, measuring gauge, 8 –segment apple slicer/corer
Laboratory Equipment
Incubators, Model 650D (Large)
(Fischer Scientific, Marietta, OH 45750)

104
Torque tester, Digital Teflon Model D-2874TFE
(Secure Pak, Maumee, OH 43537)
Orion benchtop pH meter, Model 3-STAR
(Thermo Electron Corporation, Beverly, MA 01915)
Balance, Model VP4101CN
(Voyager, Ohaus Corporation)
Mini food processor, Mini-Prep® Plus Model DLC-2ABC
(Cuisinart®, Stamford, CT)
Stainless steel sieve, Mesh No. 8, S/N: 03206633
(Fisher Scientific Company)
Original headspace vacuum gauge system, consisting of
o Headspace vacuum gauge, Model 2074
(Ashcroft, Stratford, CT)
o 5 Speed Drill Press, Model 125-1072)
(Enco, Fernley, NV)
Standard household gas range, Model FGF368CJSB
(Frigidaire)
HunterLab MiniScan XE Plus Colorimeter
(Hunter Associates Laboratory, Inc, Reston, VA)
Food and Ingredients
Sugar, Canning salt
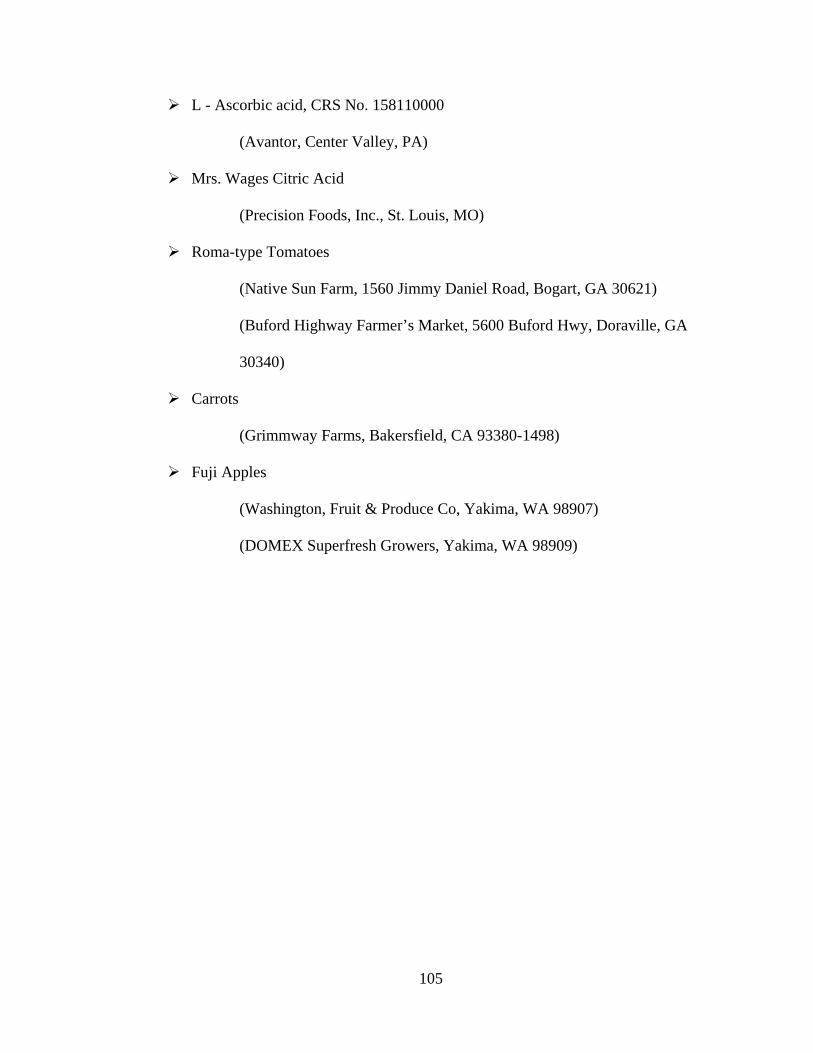
105
L - Ascorbic acid, CRS No. 158110000
(Avantor, Center Valley, PA)
Mrs. Wages Citric Acid
(Precision Foods, Inc., St. Louis, MO)
Roma-type Tomatoes
(Native Sun Farm, 1560 Jimmy Daniel Road, Bogart, GA 30621)
(Buford Highway Farmer’s Market, 5600 Buford Hwy, Doraville, GA
30340)
Carrots
(Grimmway Farms, Bakersfield, CA 93380-1498)
Fuji Apples
(Washington, Fruit & Produce Co, Yakima, WA 98907)
(DOMEX Superfresh Growers, Yakima, WA 98909)

106
APPENDIX E
VACUUM GAUGE ASSEMBLY
Figure E.1. Parts of the vacuum gauge