Embed Size (px)
Citation preview
WebPerf: Evaluating “What-If” Scenarios forCloud-hosted Web Applications
Yurong Jiang†, Lenin Ravindranath‡, Suman Nath‡, Ramesh Govindan†
†University of Southern California ‡Microsoft Research†{yurongji,ramesh}@usc.edu ‡{lenin, sumann}@microsoft.com
Abstract— Developers deploying web applications in thecloud often need to determine how changes to service tiersor runtime load may affect user-perceived page load time.We devise and evaluate a systematic methodology for ex-ploring such “what-if” questions when a web applicationis deployed. Given a website, a web request, and “what-if” scenario, with a hypothetical configuration and runtimeconditions, our methodology, embedded in a system calledWebPerf, can estimate a distribution of cloud latency of therequest under the “what-if” scenario. In achieving this goal,WebPerf makes three contributions: (1) automated instru-mentation of websites written in an increasingly popular taskasynchronous paradigm, to capture causal dependencies ofvarious computation and asynchronous I/O calls; (2) an al-gorithm to use the call dependencies, together with online-and offline-profiled models of various I/O calls to estimate adistribution of end-to-end latency of the request; and (3) analgorithm to find the optimal measurements to take within alimited time to minimize modeling errors. We have imple-mented WebPerf for Microsoft Azure. In experiments withsix real websites and six scenarios, the WebPerf’s medianestimation error is within 7% in all experiments.
CCS Concepts•Networks → Network performance analysis; •Softwareand its engineering→ Application specific development en-vironments;
KeywordsInstrumentation; Async-Await; Dependency; What-if
1. INTRODUCTIONMany popular web applications have complex cloud ar-
chitectures, with multiple tiers and inter-related compo-
Permission to make digital or hard copies of all or part of this work for personalor classroom use is granted without fee provided that copies are not made ordistributed for profit or commercial advantage and that copies bear this noticeand the full citation on the first page. Copyrights for components of this workowned by others than ACM must be honored. Abstracting with credit is per-mitted. To copy otherwise, or republish, to post on servers or to redistribute tolists, requires prior specific permission and/or a fee. Request permissions [email protected].
SIGCOMM ’16, August 22-26, 2016, Florianopolis , Brazil© 2016 ACM. ISBN 978-1-4503-4193-6/16/08. . . $15.00
DOI: http://dx.doi.org/10.1145/2934872.2934882
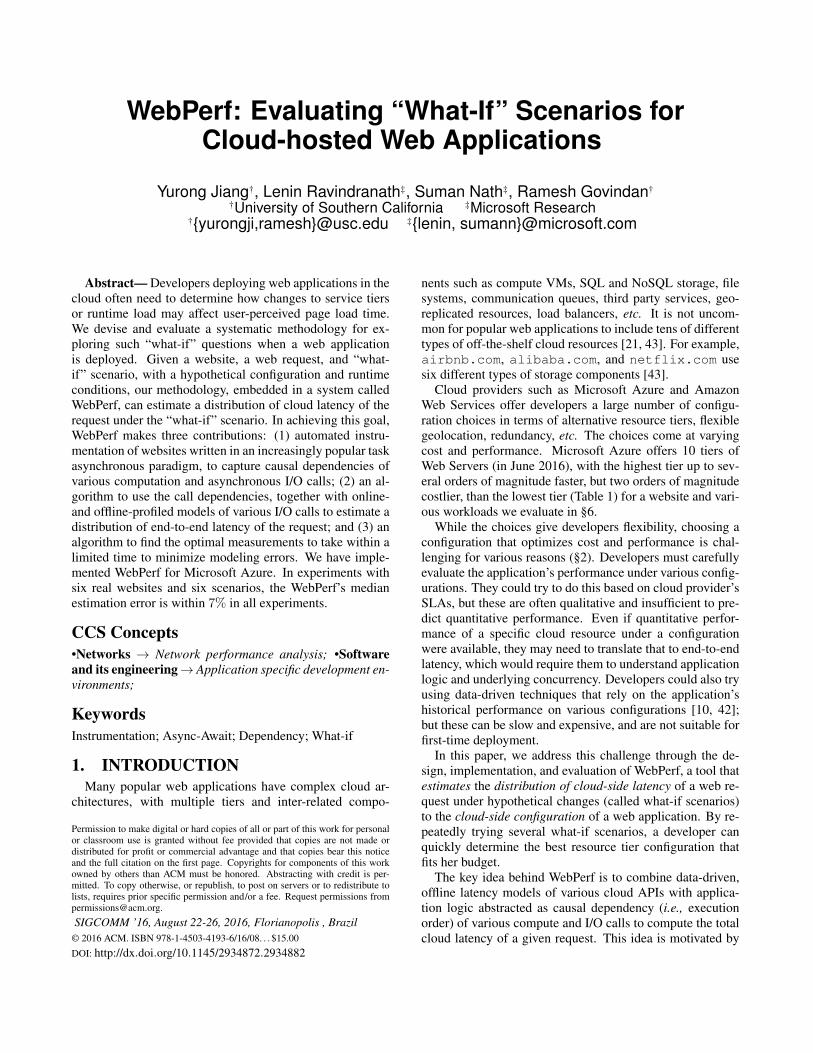
nents such as compute VMs, SQL and NoSQL storage, filesystems, communication queues, third party services, geo-replicated resources, load balancers, etc. It is not uncom-mon for popular web applications to include tens of differenttypes of off-the-shelf cloud resources [21, 43]. For example,airbnb.com, alibaba.com, and netflix.com usesix different types of storage components [43].
Cloud providers such as Microsoft Azure and AmazonWeb Services offer developers a large number of configu-ration choices in terms of alternative resource tiers, flexiblegeolocation, redundancy, etc. The choices come at varyingcost and performance. Microsoft Azure offers 10 tiers ofWeb Servers (in June 2016), with the highest tier up to sev-eral orders of magnitude faster, but two orders of magnitudecostlier, than the lowest tier (Table 1) for a website and vari-ous workloads we evaluate in §6.
While the choices give developers flexibility, choosing aconfiguration that optimizes cost and performance is chal-lenging for various reasons (§2). Developers must carefullyevaluate the application’s performance under various config-urations. They could try to do this based on cloud provider’sSLAs, but these are often qualitative and insufficient to pre-dict quantitative performance. Even if quantitative perfor-mance of a specific cloud resource under a configurationwere available, they may need to translate that to end-to-endlatency, which would require them to understand applicationlogic and underlying concurrency. Developers could also tryusing data-driven techniques that rely on the application’shistorical performance on various configurations [10, 42];but these can be slow and expensive, and are not suitable forfirst-time deployment.
In this paper, we address this challenge through the de-sign, implementation, and evaluation of WebPerf, a tool thatestimates the distribution of cloud-side latency of a web re-quest under hypothetical changes (called what-if scenarios)to the cloud-side configuration of a web application. By re-peatedly trying several what-if scenarios, a developer canquickly determine the best resource tier configuration thatfits her budget.
The key idea behind WebPerf is to combine data-driven,offline latency models of various cloud APIs with applica-tion logic abstracted as causal dependency (i.e., executionorder) of various compute and I/O calls to compute the totalcloud latency of a given request. This idea is motivated by
two key insights. First, causal dependencies of compute andI/O calls for a request remain relatively stable for the largeclass of what-if scenarios that WebPerf supports. Thus, it ispossible to determine the dependencies once, and to reuseit for repeated what-if evaluations. Second, latencies of I/Ocalls to many cloud resources can be reliably modeled asfunctions of workload parameters such as storage table sizeand configuration parameters such as geolocation and re-source tier, but independent of application logic. Therefore,WebPerf can build application-independent models of vari-ous cloud APIs offline, as a function of workload and con-figuration parameters, and use these models during what-ifestimation.
Implementing the above idea for cloud-based web appli-cations raises several challenges, which we address. First,while prior work has explored techniques to track causaldependencies in asynchronous applications [32, 33], mod-ern web applications are written using task asynchronousparadigm [2] that prior work has not considered. We developtechniques to track causalities in such applications.
Second, predicting overall cloud latency by combiningcausal dependencies with latency models of cloud APIs ischallenging for various reasons. Dependencies among com-pute and I/O calls in real applications can be complex. More-over, latency models of cloud APIs are best represented as adistribution rather than as fixed values, and hence the predic-tion algorithm needs to combine the distributions. WebPerfuses a novel algorithm that hierarchically convolves thesedistributions, in a manner guided by the causal dependence.Finally, there are many other practical considerations that areneeded for accurate prediction. A request may have nonde-terministic causal dependency (e.g., due to CDN hit or miss).Cloud resources can impose concurrency limits and henceintroduce queueing delays. Latencies of some data-centricAPIs (e.g., to a SQL database) may depend on applicationand workload properties. WebPerf’s prediction algorithmuses several techniques to handle such cases.
While WebPerf’s primary goal is to predict an applica-tion’s cloud-side latency, its prediction can be combinedwith network latency and client-side latency (predicted byexisting tools such as WebProphet [25]) to produce an end-to-end predicted latency distribution. WebPerf proposes aMonte Carlo simulation-based algorithm to achieve this.
Finally, WebPerf must be fast so that a developer canquickly explore various what-if scenarios. Given a what-if scenario, WebPerf needs to build latency models for allcomputation and I/O calls in the application to reason aboutits baseline performance. To operate within a fixed measure-ment time limit, WebPerf formulates the measurement prob-lem as an integer programming problem that decides howmany measurements of various requests should be taken tooptimize total modeling error (the process is similar to op-timal experiments design [31, 44]). Our experiments showthis can minimize modeling errors by 5× on average.
We have implemented WebPerf for Microsoft Azure andevaluated it on six websites and six what-if scenarios.WebPerf’s median estimation error was within < 7% in allcases.
2. BACKGROUND AND MOTIVATIONPlatform as a Service (PaaS) cloud providers such as
Amazon AWS and Microsoft Azure let developers rapidlybuild, deploy, and manage powerful websites and web ap-plications. A typical cloud application has multiple tiers.(See [21, 43] for example architectures of real-world appli-cations.) The back-end data tier consists of various data stor-age services, such as SQL databases, key-value stores, blobstores, Redis caches [34], etc. The front-end contains thecore application logic for processing client requests. It mayalso include various cloud resources such as VMs, commu-nication queues, analytics services, authentication services,etc. The front-end of a web application also includes a webserver that generates HTML webpages to be rendered onbrowsers.
2.1 The need for what-if analysisCloud providers offer multiple resources for computation,
storage, analytics, networking, management, etc. For exam-ple, Microsoft Azure offers 48 resource types in 10 differ-ent categories.1 Each resource is usually offered in multipletiers at different price, performance, and isolation level—for a Web server alone, Azure offers 30 different resourcetiers (a few are shown in Table 1). Finally, cloud providersalso permit redundancy and geolocation of resources. Asingle website may use multiple resources; for example,airbnb.com, alibaba.com, and netflix.com eachuse six different types of storage components [43]. Thus, adeveloper is faced with combinatorially many resource con-figuration choices in terms of the number of resource tiers,the degree of performance isolation across these tiers, theredundancy of resources, and geolocation of resources.
In this paper, we are primarily concerned with cloud la-tency, the time a user request spends in the cloud. Someof this latency is due to the network (when the front-end andback-end are not geographically co-located) and some of thislatency is due to compute and storage access. Not surpris-ingly, the choice of a web application’s cloud configurationcan significantly impact cloud latency. A developer needs tobe able to efficiently search the space of configurations toselect a configuration that satisfies the developer’s goal suchas minimizing cloud latency of a request given a budget ormeeting a deadline while minimizing the cost.
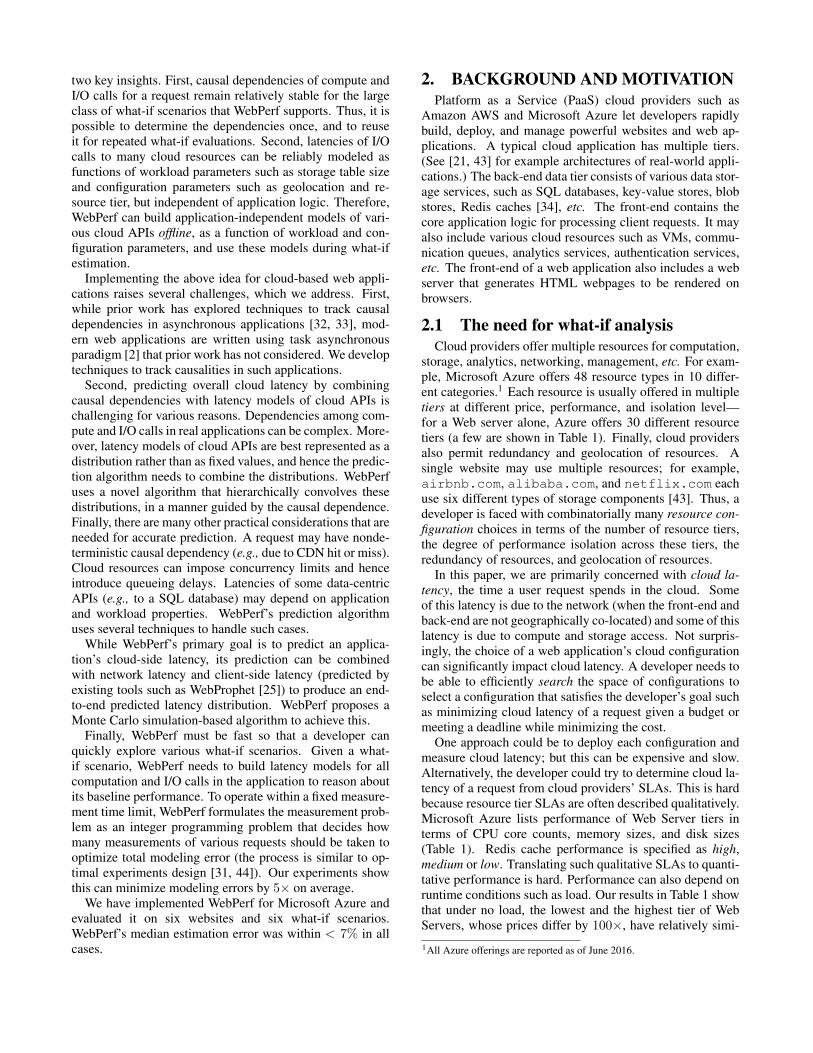
One approach could be to deploy each configuration andmeasure cloud latency; but this can be expensive and slow.Alternatively, the developer could try to determine cloud la-tency of a request from cloud providers’ SLAs. This is hardbecause resource tier SLAs are often described qualitatively.Microsoft Azure lists performance of Web Server tiers interms of CPU core counts, memory sizes, and disk sizes(Table 1). Redis cache performance is specified as high,medium or low. Translating such qualitative SLAs to quanti-tative performance is hard. Performance can also depend onruntime conditions such as load. Our results in Table 1 showthat under no load, the lowest and the highest tier of WebServers, whose prices differ by 100×, have relatively simi-
1All Azure offerings are reported as of June 2016.
Web Server Tier Price Configuration Avg. Response Time/Request (ms)(USD/month) 1 req. 100 concurrent reqs. 90% CPU
Standard A0 15 1 Core, 0.75 GB Memory, 20 GB Disk 107.51 123837.6 283.6Standard A1 67 1 Core, 1.75 GB Memory, 70 GB Disk 99.6 15770.8 210.3Standard D2 208 2 Cores, 7 GB Memory, 100 GB Disk 97.4 2371.0 190.4Standard A3 268 4 Cores, 7 GB Memory, 285 GB Disk 93.4 1720.70 142Standard D12 485 4 Cores, 28 GB Memory, 200 GB Disk 96.2 1275.52 130.4Standard D14 1571 16 Cores, 112GB Memory, 800GB Disk 90.1 752 115
Table 1—A few tiers of Microsoft Azure Web Server: Price, Configuration, and Performance under various conditions. Response times are measured from aclient in California to the index page of the SocialForum website (§ 6), deployed at a Web Server in US West.
lar latency; but with 100 concurrent clients, the lowest tieris 164× slower than the highest tier. Finally, even if it werepossible to accurately quantify latency of a specific resourcetier, estimating its impact on the total cloud latency requiresunderstanding how I/O calls to the resource interleave withother I/O calls and how they affect the critical path of theweb request. This is nontrivial.
To efficiently search the space of resource configurations,our paper develops WebPerf, a prediction framework thatcan perform what-if analyses—given a hypothetical resourceconfiguration of an application and its workload, it can ac-curately predict a request’s cloud latency without actuallyexecuting the application under the new configuration, andwithout relying on qualitative SLA descriptions, while stillcapturing interleavings between different I/O calls within agiven request.
2.2 Key InsightsUnlike common website optimization tools [17, 45] that
focus on webpage optimization, WebPerf enables develop-ers to find low cloud latency resource configurations. Thecloud latency of an application depends on (1) the causal or-der (i.e., sequential or parallel) in which various computationand I/O calls happen, and (2) the latency of each computa-tion and I/O call. We use the following two key insights tomeasure these two components.I Stable Dependency. Causal dependencies of variouscomputation and I/O calls of a request in an application re-main stable over various what-if scenarios that we consider(Table 2). For example, if a request accesses a key-valuestore followed by accessing a blob store, it accesses them inthe same causal order even when the key-value store or theblob store is upgraded to a different tier. Such determinismallows WebPerf to compute causal dependency for a requestonce and reuse it for repeated what-if analysis.
Of course, there can be nondeterminism in control paths—e.g., a request may or may not query a database dependingon whether a value is present in the cache. In that case,WebPerf issues the request repeatedly to stress various con-trol paths and produces one estimate for each unique causaldependency. Such non-determinism, however, is relativelyinfrequent—in six real applications we evaluate in §6, only10% requests demonstrate such nondeterminism. In §4.3,we describe how WebPerf handles variable latencies due todifferent control paths inside a cloud resource.I Application-independent API latency. The performanceof individual I/O calls to many cloud resources can be re-liably modelled independent of application logic, but as
functions of various workload and configuration parame-ters. For example, latency of a Redis cache lookup API doesnot depend on the application, but on its configuration suchas its geolocation and its resource tier. Similarly, latencyto a NoSQL table query API does not depend on applica-tion logic, but rather on workload parameters such as querytype (e.g., lookup vs. scan) and table size. Therefore, it ispossible to build application-independent statistical models(called profiles) of these APIs offline, as functions of rele-vant workload and configuration parameters, and combineit with application-specific dependency information to esti-mate a request’s cloud latency.
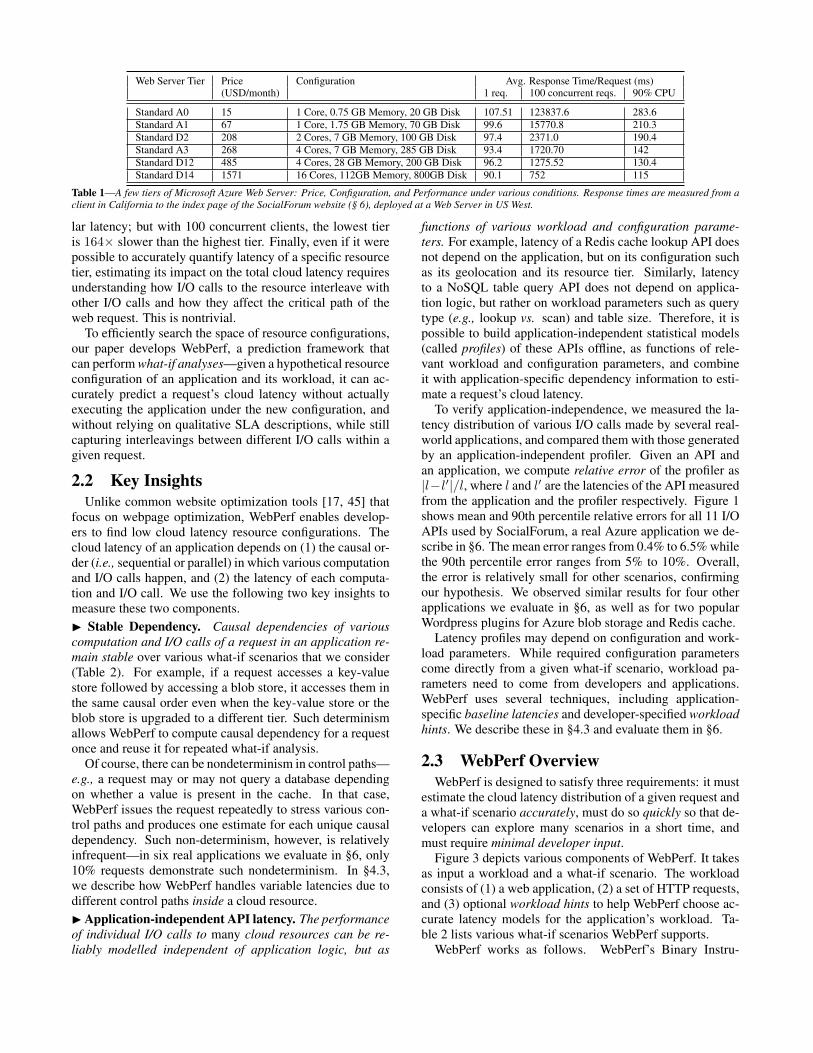
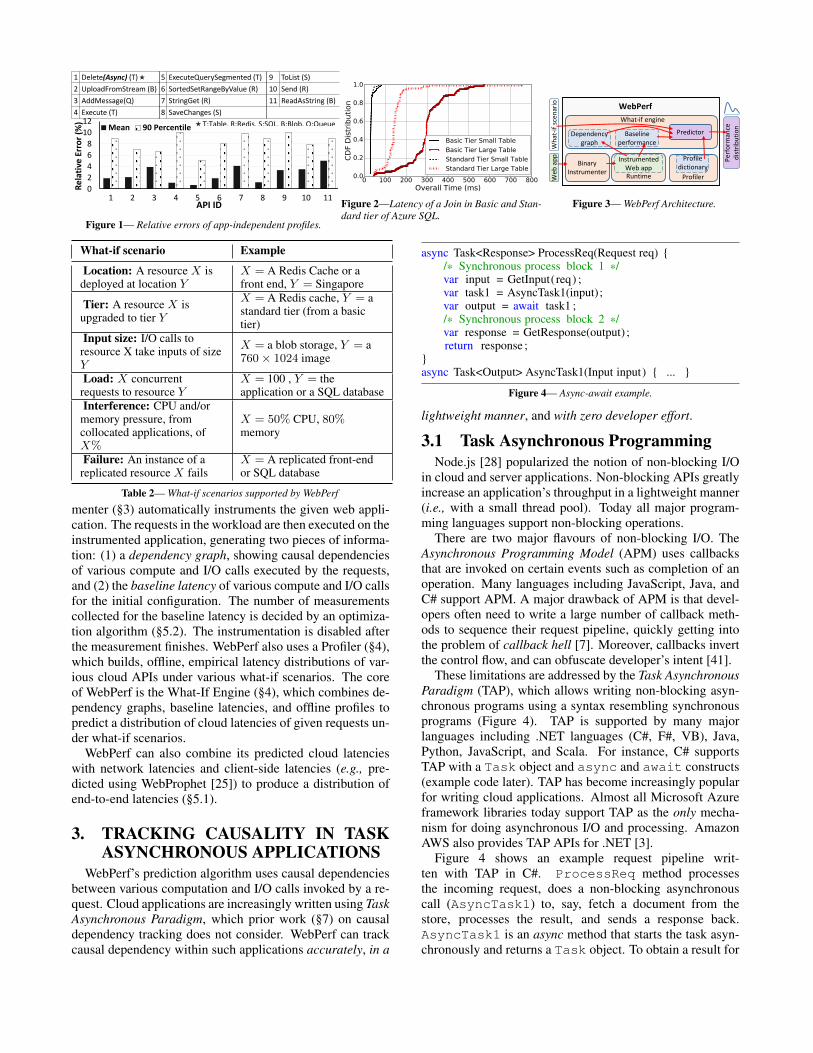
To verify application-independence, we measured the la-tency distribution of various I/O calls made by several real-world applications, and compared them with those generatedby an application-independent profiler. Given an API andan application, we compute relative error of the profiler as|l−l′|/l, where l and l′ are the latencies of the API measuredfrom the application and the profiler respectively. Figure 1shows mean and 90th percentile relative errors for all 11 I/OAPIs used by SocialForum, a real Azure application we de-scribe in §6. The mean error ranges from 0.4% to 6.5% whilethe 90th percentile error ranges from 5% to 10%. Overall,the error is relatively small for other scenarios, confirmingour hypothesis. We observed similar results for four otherapplications we evaluate in §6, as well as for two popularWordpress plugins for Azure blob storage and Redis cache.
Latency profiles may depend on configuration and work-load parameters. While required configuration parameterscome directly from a given what-if scenario, workload pa-rameters need to come from developers and applications.WebPerf uses several techniques, including application-specific baseline latencies and developer-specified workloadhints. We describe these in §4.3 and evaluate them in §6.
2.3 WebPerf OverviewWebPerf is designed to satisfy three requirements: it must
estimate the cloud latency distribution of a given request anda what-if scenario accurately, must do so quickly so that de-velopers can explore many scenarios in a short time, andmust require minimal developer input.
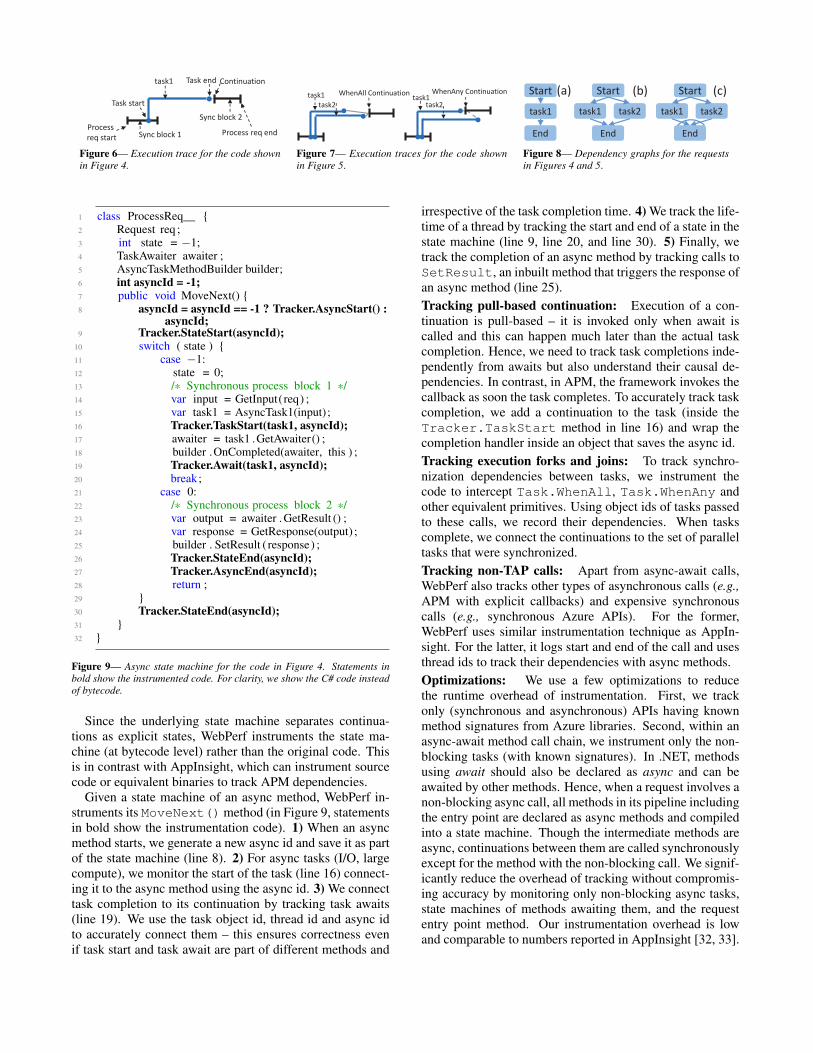
Figure 3 depicts various components of WebPerf. It takesas input a workload and a what-if scenario. The workloadconsists of (1) a web application, (2) a set of HTTP requests,and (3) optional workload hints to help WebPerf choose ac-curate latency models for the application’s workload. Ta-ble 2 lists various what-if scenarios WebPerf supports.
WebPerf works as follows. WebPerf’s Binary Instru-
0
2
4
6
8
10
12
1 2 3 4 5 6 7 8 9 10 11
Re
lati
ve E
rro
r (%
)
API ID
Mean 90 Percentile T:Table, R:Redis, S:SQL, B:Blob, Q:Queue
1 Delete(Async) (T)
2 UploadFromStream (B)
3 AddMessage(Q)
4 Execute (T)
5 ExecuteQuerySegmented (T)
6 SortedSetRangeByValue (R)
7 StringGet (R)
8 SaveChanges (S)
9 ToList (S)
10 Send (R)
11 ReadAsString (B)
Figure 1— Relative errors of app-independent profiles.
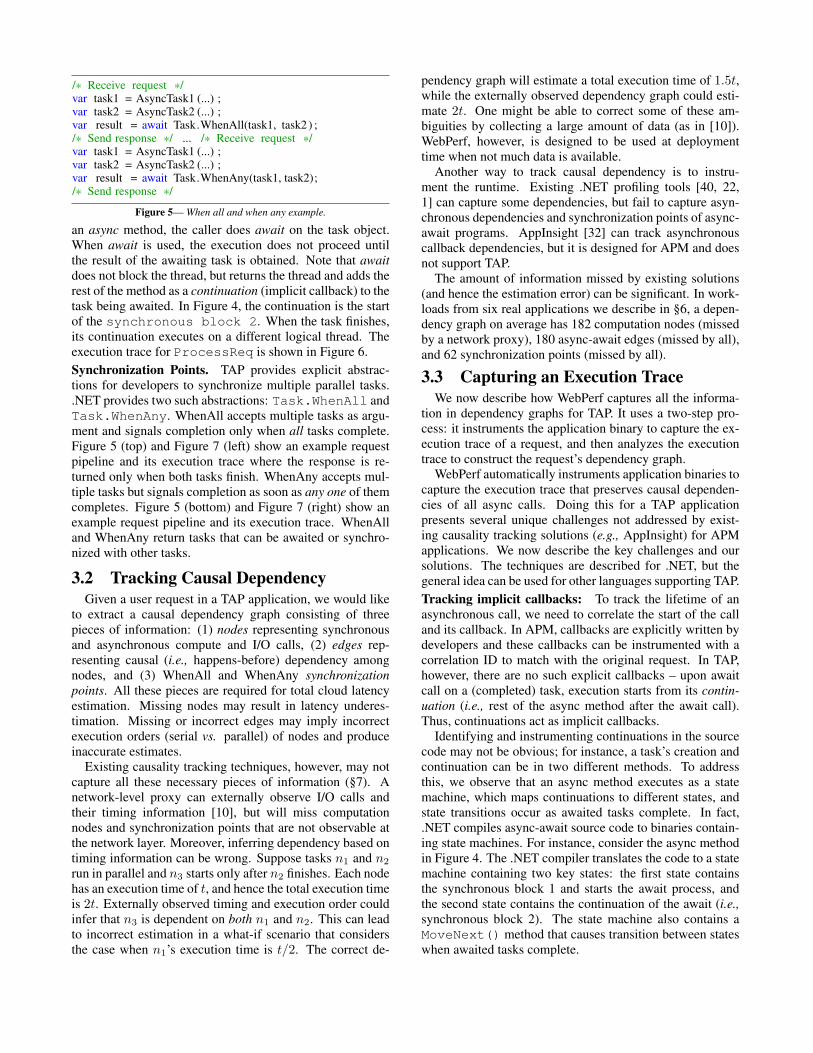
Figure 2—Latency of a Join in Basic and Stan-dard tier of Azure SQL.
Web
ap
pW
hat
-if
sce
nar
io
Binary Instrumenter
Runtime
InstrumentedWeb app
Profiler
Profiledictionary
Dependency graph
Baseline performance
What-if engine
Predictor
Per
form
ance
d
istr
ibu
tio
n
WebPerf
Figure 3— WebPerf Architecture.
What-if scenario Example
Location: A resource X isdeployed at location Y
X = A Redis Cache or afront end, Y = Singapore
Tier: A resource X isupgraded to tier Y
X = A Redis cache, Y = astandard tier (from a basictier)
Input size: I/O calls toresource X take inputs of sizeY
X = a blob storage, Y = a760× 1024 image
Load: X concurrentrequests to resource Y
X = 100 , Y = theapplication or a SQL database
Interference: CPU and/ormemory pressure, fromcollocated applications, ofX%
X = 50% CPU, 80%memory
Failure: An instance of areplicated resource X fails
X = A replicated front-endor SQL database
Table 2— What-if scenarios supported by WebPerf
menter (§3) automatically instruments the given web appli-cation. The requests in the workload are then executed on theinstrumented application, generating two pieces of informa-tion: (1) a dependency graph, showing causal dependenciesof various compute and I/O calls executed by the requests,and (2) the baseline latency of various compute and I/O callsfor the initial configuration. The number of measurementscollected for the baseline latency is decided by an optimiza-tion algorithm (§5.2). The instrumentation is disabled afterthe measurement finishes. WebPerf also uses a Profiler (§4),which builds, offline, empirical latency distributions of var-ious cloud APIs under various what-if scenarios. The coreof WebPerf is the What-If Engine (§4), which combines de-pendency graphs, baseline latencies, and offline profiles topredict a distribution of cloud latencies of given requests un-der what-if scenarios.
WebPerf can also combine its predicted cloud latencieswith network latencies and client-side latencies (e.g., pre-dicted using WebProphet [25]) to produce a distribution ofend-to-end latencies (§5.1).
3. TRACKING CAUSALITY IN TASKASYNCHRONOUS APPLICATIONS
WebPerf’s prediction algorithm uses causal dependenciesbetween various computation and I/O calls invoked by a re-quest. Cloud applications are increasingly written using TaskAsynchronous Paradigm, which prior work (§7) on causaldependency tracking does not consider. WebPerf can trackcausal dependency within such applications accurately, in a
async Task<Response> ProcessReq(Request req) {/* Synchronous process block 1 */var input = GetInput(req) ;var task1 = AsyncTask1(input);var output = await task1 ;/* Synchronous process block 2 */var response = GetResponse(output) ;return response ;
}async Task<Output> AsyncTask1(Input input) { ... }
Figure 4— Async-await example.
lightweight manner, and with zero developer effort.
3.1 Task Asynchronous ProgrammingNode.js [28] popularized the notion of non-blocking I/O
in cloud and server applications. Non-blocking APIs greatlyincrease an application’s throughput in a lightweight manner(i.e., with a small thread pool). Today all major program-ming languages support non-blocking operations.
There are two major flavours of non-blocking I/O. TheAsynchronous Programming Model (APM) uses callbacksthat are invoked on certain events such as completion of anoperation. Many languages including JavaScript, Java, andC# support APM. A major drawback of APM is that devel-opers often need to write a large number of callback meth-ods to sequence their request pipeline, quickly getting intothe problem of callback hell [7]. Moreover, callbacks invertthe control flow, and can obfuscate developer’s intent [41].
These limitations are addressed by the Task AsynchronousParadigm (TAP), which allows writing non-blocking asyn-chronous programs using a syntax resembling synchronousprograms (Figure 4). TAP is supported by many majorlanguages including .NET languages (C#, F#, VB), Java,Python, JavaScript, and Scala. For instance, C# supportsTAP with a Task object and async and await constructs(example code later). TAP has become increasingly popularfor writing cloud applications. Almost all Microsoft Azureframework libraries today support TAP as the only mecha-nism for doing asynchronous I/O and processing. AmazonAWS also provides TAP APIs for .NET [3].
Figure 4 shows an example request pipeline writ-ten with TAP in C#. ProcessReq method processesthe incoming request, does a non-blocking asynchronouscall (AsyncTask1) to, say, fetch a document from thestore, processes the result, and sends a response back.AsyncTask1 is an async method that starts the task asyn-chronously and returns a Task object. To obtain a result for
/* Receive request */var task1 = AsyncTask1 (...) ;var task2 = AsyncTask2 (...) ;var result = await Task.WhenAll(task1, task2 ) ;/* Send response */ ... /* Receive request */var task1 = AsyncTask1 (...) ;var task2 = AsyncTask2 (...) ;var result = await Task.WhenAny(task1, task2);/* Send response */
Figure 5— When all and when any example.
an async method, the caller does await on the task object.When await is used, the execution does not proceed untilthe result of the awaiting task is obtained. Note that awaitdoes not block the thread, but returns the thread and adds therest of the method as a continuation (implicit callback) to thetask being awaited. In Figure 4, the continuation is the startof the synchronous block 2. When the task finishes,its continuation executes on a different logical thread. Theexecution trace for ProcessReq is shown in Figure 6.Synchronization Points. TAP provides explicit abstrac-tions for developers to synchronize multiple parallel tasks..NET provides two such abstractions: Task.WhenAll andTask.WhenAny. WhenAll accepts multiple tasks as argu-ment and signals completion only when all tasks complete.Figure 5 (top) and Figure 7 (left) show an example requestpipeline and its execution trace where the response is re-turned only when both tasks finish. WhenAny accepts mul-tiple tasks but signals completion as soon as any one of themcompletes. Figure 5 (bottom) and Figure 7 (right) show anexample request pipeline and its execution trace. WhenAlland WhenAny return tasks that can be awaited or synchro-nized with other tasks.
3.2 Tracking Causal DependencyGiven a user request in a TAP application, we would like
to extract a causal dependency graph consisting of threepieces of information: (1) nodes representing synchronousand asynchronous compute and I/O calls, (2) edges rep-resenting causal (i.e., happens-before) dependency amongnodes, and (3) WhenAll and WhenAny synchronizationpoints. All these pieces are required for total cloud latencyestimation. Missing nodes may result in latency underes-timation. Missing or incorrect edges may imply incorrectexecution orders (serial vs. parallel) of nodes and produceinaccurate estimates.
Existing causality tracking techniques, however, may notcapture all these necessary pieces of information (§7). Anetwork-level proxy can externally observe I/O calls andtheir timing information [10], but will miss computationnodes and synchronization points that are not observable atthe network layer. Moreover, inferring dependency based ontiming information can be wrong. Suppose tasks n1 and n2run in parallel and n3 starts only after n2 finishes. Each nodehas an execution time of t, and hence the total execution timeis 2t. Externally observed timing and execution order couldinfer that n3 is dependent on both n1 and n2. This can leadto incorrect estimation in a what-if scenario that considersthe case when n1’s execution time is t/2. The correct de-
pendency graph will estimate a total execution time of 1.5t,while the externally observed dependency graph could esti-mate 2t. One might be able to correct some of these am-biguities by collecting a large amount of data (as in [10]).WebPerf, however, is designed to be used at deploymenttime when not much data is available.
Another way to track causal dependency is to instru-ment the runtime. Existing .NET profiling tools [40, 22,1] can capture some dependencies, but fail to capture asyn-chronous dependencies and synchronization points of async-await programs. AppInsight [32] can track asynchronouscallback dependencies, but it is designed for APM and doesnot support TAP.
The amount of information missed by existing solutions(and hence the estimation error) can be significant. In work-loads from six real applications we describe in §6, a depen-dency graph on average has 182 computation nodes (missedby a network proxy), 180 async-await edges (missed by all),and 62 synchronization points (missed by all).
3.3 Capturing an Execution TraceWe now describe how WebPerf captures all the informa-
tion in dependency graphs for TAP. It uses a two-step pro-cess: it instruments the application binary to capture the ex-ecution trace of a request, and then analyzes the executiontrace to construct the request’s dependency graph.
WebPerf automatically instruments application binaries tocapture the execution trace that preserves causal dependen-cies of all async calls. Doing this for a TAP applicationpresents several unique challenges not addressed by exist-ing causality tracking solutions (e.g., AppInsight) for APMapplications. We now describe the key challenges and oursolutions. The techniques are described for .NET, but thegeneral idea can be used for other languages supporting TAP.Tracking implicit callbacks: To track the lifetime of anasynchronous call, we need to correlate the start of the calland its callback. In APM, callbacks are explicitly written bydevelopers and these callbacks can be instrumented with acorrelation ID to match with the original request. In TAP,however, there are no such explicit callbacks – upon awaitcall on a (completed) task, execution starts from its contin-uation (i.e., rest of the async method after the await call).Thus, continuations act as implicit callbacks.
Identifying and instrumenting continuations in the sourcecode may not be obvious; for instance, a task’s creation andcontinuation can be in two different methods. To addressthis, we observe that an async method executes as a statemachine, which maps continuations to different states, andstate transitions occur as awaited tasks complete. In fact,.NET compiles async-await source code to binaries contain-ing state machines. For instance, consider the async methodin Figure 4. The .NET compiler translates the code to a statemachine containing two key states: the first state containsthe synchronous block 1 and starts the await process, andthe second state contains the continuation of the await (i.e.,synchronous block 2). The state machine also contains aMoveNext() method that causes transition between stateswhen awaited tasks complete.
Sync block 2
Sync block 1
Continuationtask1 Task end
Task start
Process req endProcess
req start
Figure 6— Execution trace for the code shownin Figure 4.
WhenAll Continuationtask1
task2
WhenAny Continuationtask1
task2
Figure 7— Execution traces for the code shownin Figure 5.
Start
task1
End
task1
Start
task2
End
task1
Start
task2
End
(a) (b) (c)
Figure 8— Dependency graphs for the requestsin Figures 4 and 5.
1 class ProcessReq__ {2 Request req ;3 int state = −1;4 TaskAwaiter awaiter ;5 AsyncTaskMethodBuilder builder;6 int asyncId = -1;7 public void MoveNext() {8 asyncId = asyncId == -1 ? Tracker.AsyncStart() :
asyncId;9 Tracker.StateStart(asyncId);
10 switch ( state ) {11 case −1:12 state = 0;13 /* Synchronous process block 1 */14 var input = GetInput(req) ;15 var task1 = AsyncTask1(input);16 Tracker.TaskStart(task1, asyncId);17 awaiter = task1 .GetAwaiter() ;18 builder .OnCompleted(awaiter, this ) ;19 Tracker.Await(task1, asyncId);20 break;21 case 0:22 /* Synchronous process block 2 */23 var output = awaiter .GetResult () ;24 var response = GetResponse(output) ;25 builder . SetResult ( response) ;26 Tracker.StateEnd(asyncId);27 Tracker.AsyncEnd(asyncId);28 return ;29 }30 Tracker.StateEnd(asyncId);31 }32 }
Figure 9— Async state machine for the code in Figure 4. Statements inbold show the instrumented code. For clarity, we show the C# code insteadof bytecode.
Since the underlying state machine separates continua-tions as explicit states, WebPerf instruments the state ma-chine (at bytecode level) rather than the original code. Thisis in contrast with AppInsight, which can instrument sourcecode or equivalent binaries to track APM dependencies.
Given a state machine of an async method, WebPerf in-struments its MoveNext()method (in Figure 9, statementsin bold show the instrumentation code). 1) When an asyncmethod starts, we generate a new async id and save it as partof the state machine (line 8). 2) For async tasks (I/O, largecompute), we monitor the start of the task (line 16) connect-ing it to the async method using the async id. 3) We connecttask completion to its continuation by tracking task awaits(line 19). We use the task object id, thread id and async idto accurately connect them – this ensures correctness evenif task start and task await are part of different methods and
irrespective of the task completion time. 4) We track the life-time of a thread by tracking the start and end of a state in thestate machine (line 9, line 20, and line 30). 5) Finally, wetrack the completion of an async method by tracking calls toSetResult, an inbuilt method that triggers the response ofan async method (line 25).Tracking pull-based continuation: Execution of a con-tinuation is pull-based – it is invoked only when await iscalled and this can happen much later than the actual taskcompletion. Hence, we need to track task completions inde-pendently from awaits but also understand their causal de-pendencies. In contrast, in APM, the framework invokes thecallback as soon the task completes. To accurately track taskcompletion, we add a continuation to the task (inside theTracker.TaskStart method in line 16) and wrap thecompletion handler inside an object that saves the async id.Tracking execution forks and joins: To track synchro-nization dependencies between tasks, we instrument thecode to intercept Task.WhenAll, Task.WhenAny andother equivalent primitives. Using object ids of tasks passedto these calls, we record their dependencies. When taskscomplete, we connect the continuations to the set of paralleltasks that were synchronized.Tracking non-TAP calls: Apart from async-await calls,WebPerf also tracks other types of asynchronous calls (e.g.,APM with explicit callbacks) and expensive synchronouscalls (e.g., synchronous Azure APIs). For the former,WebPerf uses similar instrumentation technique as AppIn-sight. For the latter, it logs start and end of the call and usesthread ids to track their dependencies with async methods.Optimizations: We use a few optimizations to reducethe runtime overhead of instrumentation. First, we trackonly (synchronous and asynchronous) APIs having knownmethod signatures from Azure libraries. Second, within anasync-await method call chain, we instrument only the non-blocking tasks (with known signatures). In .NET, methodsusing await should also be declared as async and can beawaited by other methods. Hence, when a request involves anon-blocking async call, all methods in its pipeline includingthe entry point are declared as async methods and compiledinto a state machine. Though the intermediate methods areasync, continuations between them are called synchronouslyexcept for the method with the non-blocking call. We signif-icantly reduce the overhead of tracking without compromis-ing accuracy by monitoring only non-blocking async tasks,state machines of methods awaiting them, and the requestentry point method. Our instrumentation overhead is lowand comparable to numbers reported in AppInsight [32, 33].
3.4 Extracting dependency graphsThe dependency graph of a request is a directed acyclic
graph with three types of nodes: Start, End, and Task.Start and End denote the start and the end of the request.Task nodes represent async API calls, as well as other syn-chronous and asynchronous compute and I/O calls that wewant to profile and predict. An edge A→B means that B canstart only after A finishes. Multiple tasks originating from asingle task indicate parallel tasks. Multiple tasks terminatingat a task indicates a WhenAll or WhenAny dependency.
WebPerf processes the execution trace from start to endto construct a dependency graph. It constructs a Task nodefor each unique async call, compute or I/O call with knownsignatures, and expensive computation. It constructs anedge t → t′ when it encounters in the execution trace atask t′ starting in the continuation of another task t. Notethat the same continuation thread of a task t may con-tain start of multiple tasks t1, t2, · · · , resulting in paralleledges t → t1, t → t2, · · · . On encountering WhenAllor WhenAny method call with tasks (t1, t2, · · · ) as inputTask arguments, WebPerf constructs a synchronization Taskt representing the continuation of the method, and edgest1 → t, t2 → t, · · · representing synchronization dependen-cies. Synchronization tasks also contain information aboutwhether the dependency is WhenAll or WhenAny, the in-formation is show as an arc over all incoming edges (or noarc) for WhenAny (or WhenAll respectively).
Figure 8a–c shows dependency graphs for the executiontraces in Figure 6, 7 (left), and 7 (right) respectively. Weput an arc over incoming edges for WhenAny dependency,to differentiate it from WhenAll dependency. Note that theexecution trace also contains timings for compute threads(black horizontal lines); hence, WebPerf can profile largecompute components, in addition to synchronous and asyn-chronous tasks, without knowing their semantics.
4. EVALUATING WHAT-IF SCENAR-IOS
WebPerf estimates the cloud latency of a request undera what-if scenario in three steps: (1) building application-independent and parameterized latency profiles of variousAPIs offline; (2) computing the dependency graph of a givenrequest (§3) and application-specific baseline latency distri-butions of various tasks in the request; (3) predicting thecloud latency by combining the dependency graph, baselinelatencies, and latency profiles for the given what-if scenario.
4.1 Application-independent ProfilingWebPerf maintains a profile dictionary, containing pro-
files or statistical models of latencies of different cloud APIsunder various configurations and inputs. In our implementa-tion, profiles are modeled by nonparametric latency distribu-tions and are stored as histograms. WebPerf uses two typesof profiles: independent and parameterized, differentiatedby whether they depend on workload parameters or not.Workload-independent profiles. Independent profiles
model APIs whose performance does not depend on appli-cations or workloads, but may depend on configurations.
To profile an API for a specific cloud resource R (e.g., aRedis cache), WebPerf repeatedly calls the API until it getsa good enough latency distribution (i.e., when the samplemean is within two standard errors of the true mean with95% confidence level [37]). For all Microsoft Azure APIs,WebPerf needs fewer than 100 measurements. To supportvarious what-if scenarios, WebPerf’s profiler builds profilesfor each API under different configurations of R, input pa-rameters of the API, system loads, etc., as well as at dif-ferent times incrementally to capture temporal variabilities.Table 2 shows various what-if scenarios WebPerf currentlysupports. To build profiles for location, tier, input size, andload, the profiler deploysR at different locations or tiers, andissues requests to them with different input sizes and concur-rent loads, respectively. For the CPU interference scenario,WebPerf builds profiles for client side CPU processing over-head of calling the APIs. It also empirically builds a map-ping between CPU time and wall clock time under differentbackground CPU stresses, which it uses to convert the CPUtime profiles to wall clock time profiles. To profile replicafailure scenarios, WebPerf computes expected increase inloads on working instances of R and uses the load profilesto approximate failure profiles.Parameterized profiles. Performance of a small number ofcloud APIs depends on workloads. For instance, the queryAPI to Azure SQL exhibits different latencies based on thespecific query (e.g., whether it has a join) and table size. Acloud resource can also exhibit variable latencies due to dif-ferent control paths based on an application’s workload (e.g.,CDN latency for cache hit vs cache miss). WebPerf buildsmultiple profiles for each of these APIs, parameterized byrelevant workload parameters. WebPerf allows developers toprovide workload hints, based on which it chooses the rightprofile for an API. WebPerf exposes to developers a list ofAPIs for which workload hints can be provided.
For example, WebPerf profiles Azure CDN’s latency astwo distributions, one for cache hits and one for misses, andallows developers to specify a target cache hit rate as a work-load hint. WebPerf then appropriately samples from the twoprofiles to generate a (bimodal) distribution of latencies un-der the specified hit rate. §6.6 shows an example. For thequery API to Azure Table storage and SQL, WebPerf buildsmultiple profiles, one for each table size (e.g., < 1MB,< 10MB, etc.) and query complexity (e.g., lookup, scan,or join). The developer can provide workload hints in termsof table size and query complexity, and WebPerf chooses ap-propriate profiles based on those workload parameters.2
Note that building profiles for all APIs under all hypo-thetical configurations and workload scenarios can be veryexpensive and slow. WebPerf therefore seeds its profile dic-tionary with profiles for only a few popular APIs under afew common what-if scenarios and workload parameters; it2WebPerf’s SQL profiles are only crude approximations. SQL query per-formance can depend on factors such as indexing, query optimization, etc.that are beyond the scope of the paper. Therefore, WebPerf’s predictions forscenarios involving SQL are not as accurate as those for other scenarios.
task1
Start
task2 task3
task4
task1 task2
task3
task4
…
…
Start
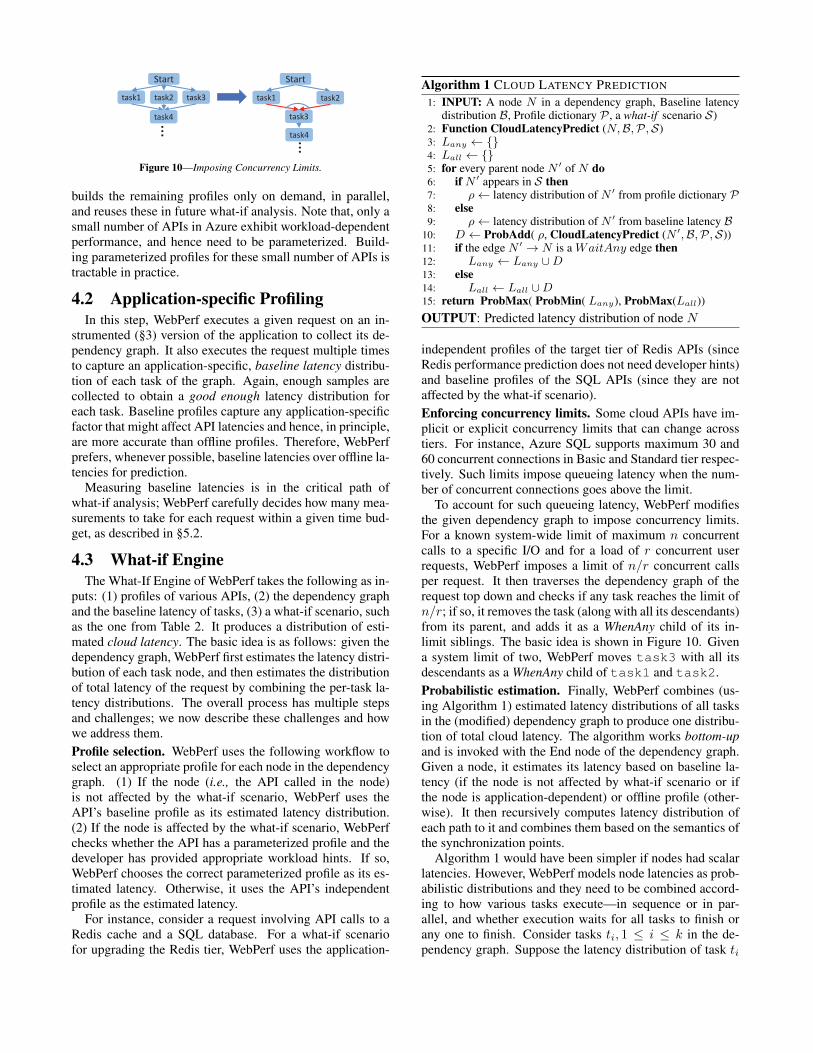
Figure 10—Imposing Concurrency Limits.
builds the remaining profiles only on demand, in parallel,and reuses these in future what-if analysis. Note that, only asmall number of APIs in Azure exhibit workload-dependentperformance, and hence need to be parameterized. Build-ing parameterized profiles for these small number of APIs istractable in practice.
4.2 Application-specific ProfilingIn this step, WebPerf executes a given request on an in-
strumented (§3) version of the application to collect its de-pendency graph. It also executes the request multiple timesto capture an application-specific, baseline latency distribu-tion of each task of the graph. Again, enough samples arecollected to obtain a good enough latency distribution foreach task. Baseline profiles capture any application-specificfactor that might affect API latencies and hence, in principle,are more accurate than offline profiles. Therefore, WebPerfprefers, whenever possible, baseline latencies over offline la-tencies for prediction.
Measuring baseline latencies is in the critical path ofwhat-if analysis; WebPerf carefully decides how many mea-surements to take for each request within a given time bud-get, as described in §5.2.
4.3 What-if EngineThe What-If Engine of WebPerf takes the following as in-
puts: (1) profiles of various APIs, (2) the dependency graphand the baseline latency of tasks, (3) a what-if scenario, suchas the one from Table 2. It produces a distribution of esti-mated cloud latency. The basic idea is as follows: given thedependency graph, WebPerf first estimates the latency distri-bution of each task node, and then estimates the distributionof total latency of the request by combining the per-task la-tency distributions. The overall process has multiple stepsand challenges; we now describe these challenges and howwe address them.Profile selection. WebPerf uses the following workflow toselect an appropriate profile for each node in the dependencygraph. (1) If the node (i.e., the API called in the node)is not affected by the what-if scenario, WebPerf uses theAPI’s baseline profile as its estimated latency distribution.(2) If the node is affected by the what-if scenario, WebPerfchecks whether the API has a parameterized profile and thedeveloper has provided appropriate workload hints. If so,WebPerf chooses the correct parameterized profile as its es-timated latency. Otherwise, it uses the API’s independentprofile as the estimated latency.
For instance, consider a request involving API calls to aRedis cache and a SQL database. For a what-if scenariofor upgrading the Redis tier, WebPerf uses the application-
Algorithm 1 CLOUD LATENCY PREDICTION
1: INPUT: A node N in a dependency graph, Baseline latencydistribution B, Profile dictionary P , a what-if scenario S)
2: Function CloudLatencyPredict (N,B,P,S)3: Lany ← {}4: Lall ← {}5: for every parent node N ′ of N do6: if N ′ appears in S then7: ρ← latency distribution of N ′ from profile dictionary P8: else9: ρ← latency distribution of N ′ from baseline latency B
10: D ← ProbAdd( ρ, CloudLatencyPredict (N ′,B,P,S))11: if the edge N ′ → N is a WaitAny edge then12: Lany ← Lany ∪D13: else14: Lall ← Lall ∪D15: return ProbMax( ProbMin( Lany), ProbMax(Lall))OUTPUT: Predicted latency distribution of node N
independent profiles of the target tier of Redis APIs (sinceRedis performance prediction does not need developer hints)and baseline profiles of the SQL APIs (since they are notaffected by the what-if scenario).Enforcing concurrency limits. Some cloud APIs have im-plicit or explicit concurrency limits that can change acrosstiers. For instance, Azure SQL supports maximum 30 and60 concurrent connections in Basic and Standard tier respec-tively. Such limits impose queueing latency when the num-ber of concurrent connections goes above the limit.
To account for such queueing latency, WebPerf modifiesthe given dependency graph to impose concurrency limits.For a known system-wide limit of maximum n concurrentcalls to a specific I/O and for a load of r concurrent userrequests, WebPerf imposes a limit of n/r concurrent callsper request. It then traverses the dependency graph of therequest top down and checks if any task reaches the limit ofn/r; if so, it removes the task (along with all its descendants)from its parent, and adds it as a WhenAny child of its in-limit siblings. The basic idea is shown in Figure 10. Givena system limit of two, WebPerf moves task3 with all itsdescendants as a WhenAny child of task1 and task2.Probabilistic estimation. Finally, WebPerf combines (us-ing Algorithm 1) estimated latency distributions of all tasksin the (modified) dependency graph to produce one distribu-tion of total cloud latency. The algorithm works bottom-upand is invoked with the End node of the dependency graph.Given a node, it estimates its latency based on baseline la-tency (if the node is not affected by what-if scenario or ifthe node is application-dependent) or offline profile (other-wise). It then recursively computes latency distribution ofeach path to it and combines them based on the semantics ofthe synchronization points.
Algorithm 1 would have been simpler if nodes had scalarlatencies. However, WebPerf models node latencies as prob-abilistic distributions and they need to be combined accord-ing to how various tasks execute—in sequence or in par-allel, and whether execution waits for all tasks to finish orany one to finish. Consider tasks ti, 1 ≤ i ≤ k in the de-pendency graph. Suppose the latency distribution of task ti
is represented by an i.i.d. random variable Xi with distri-bution function fi(x). Suppose Z is the random variablerepresenting the total execution time of all tasks. Z can beestimated based on how the tasks execute and how the appli-cation waits for their execution to finish.
If all tasks run sequentially (Figure 8(a)), Z =∑ki=1Xi.
Then the distribution function f(z) of Z is given by f(z) =f1(x) ∗ f2(x) ∗ . . . fk(x), where ∗ denotes the convolu-tion operator. For k = 2, f(z) = f1(x) ∗ f2(x) andPr(Z = z) =
∑w Pr(X1 = w) Pr(X2 = z − w). Since
convolution is associative and commutative, the computationcan be extended to k > 2.
With parallel execution, there are three cases dependingon whether the application needs to wait for all or any of thetasks to finish. (1) Wait for all to finish (Figure 8(b)): In thiscase Z = maxki=1Xi. The distribution function for Z canbe computed as follows: Pr(Z ≤ w) = Pr(X1 ≤ w,X2 ≤w, . . . ,Xk ≤ w) =
∏1≤i≤k Pr(Xi ≤ w). (2) Wait for
any to finish (Figure 8(c)): In this case, Z = minki=1(Xi)The distribution function of Z can be computed in a sim-ilar manner to the Max function. (3) A combination ofthe above two: Suppose the application waits for any ofX1, . . . , Xm to finish, and all of Xm+1, . . . , Xk to finish;then Z = max(min(X1, . . . , Xm),max(Xm+1, . . . , Xk).The distribution function can be computed by combining theabove distributions for Max and Min.
Algorithm 1 implements the computations using threebuilding blocks that involve operations on discrete distri-butions: ProbMax, ProbMin and ProbAdd. ProbMaxand ProbMin are computed based on (1) and (2) above.ProbAdd for adding two distributions is based on convo-lutions [18] (see associated technical report [23] for details).Given a node, Algorithm 1 recursively computes the latencydistribution for every path to it (by applying ProbAdd onlatency estimation of nodes on the path), and applies Prob-Max or ProbMin to those paths, depending on whether thepaths have WhenAny edges or not.
5. WebPerf EXTENSIONSThis section describes two extensions to WebPerf. We
have implemented them, and we evaluate them in §6.
5.1 End-to-end Latency PredictionWebPerf’s cloud latency estimates can be extended to es-
timate end-to-end latency of a web request. End-to-end la-tency consists of three components: (1) cloud-side latencygiven by the prediction algorithm above, (2) network latencybetween an application’s cloud frontend and the client, and(3) client-side latency within client’s browser, which can bepredicted by tools such as WebProphet [25]. Accuratelymodeling network latency is outside the scope of the pa-per. For simplicity, we model network latency using the RTTdistribution between the client’s browser and the applicationfrontend. WebPerf uses a combination of two techniques toestimate end-to-end latencies: end-to-end tracking and prob-abilistic estimation.End-to-end tracking. To match a client side webpage re-
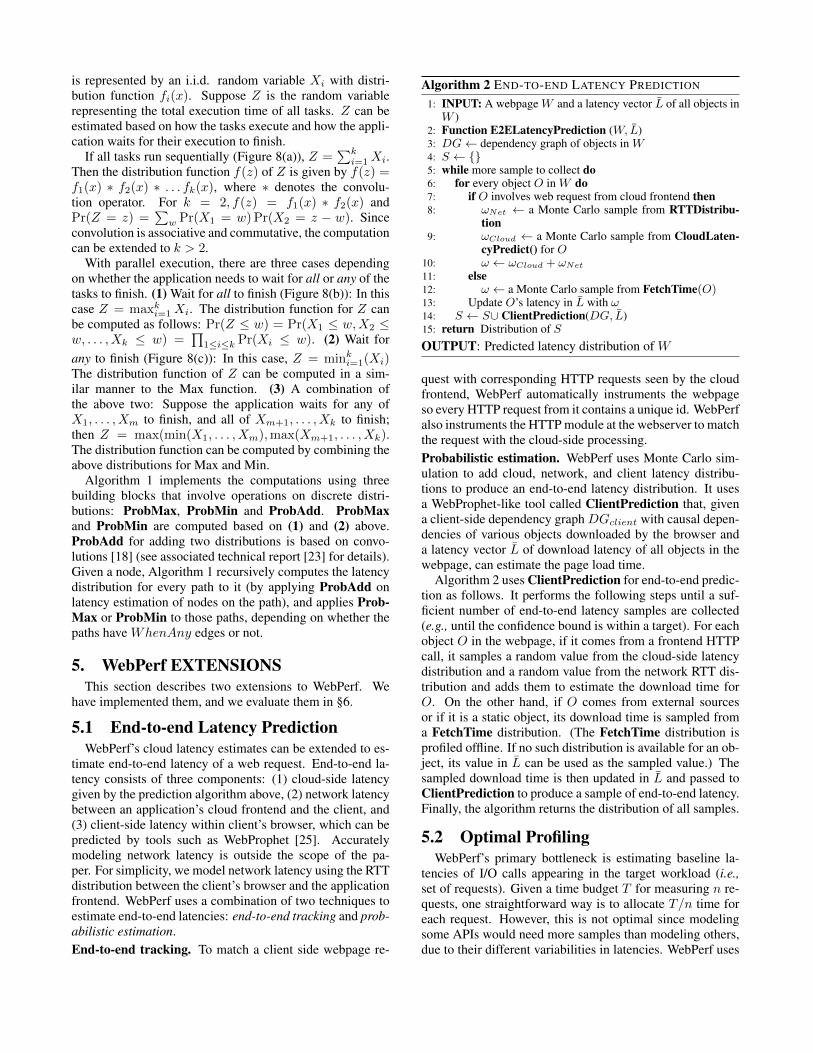
Algorithm 2 END-TO-END LATENCY PREDICTION
1: INPUT: A webpage W and a latency vector L̄ of all objects inW )
2: Function E2ELatencyPrediction (W, L̄)3: DG← dependency graph of objects in W4: S ← {}5: while more sample to collect do6: for every object O in W do7: if O involves web request from cloud frontend then8: ωNet ← a Monte Carlo sample from RTTDistribu-
tion9: ωCloud ← a Monte Carlo sample from CloudLaten-
cyPredict() for O10: ω ← ωCloud + ωNet
11: else12: ω ← a Monte Carlo sample from FetchTime(O)13: Update O’s latency in L̄ with ω14: S ← S∪ ClientPrediction(DG, L̄)15: return Distribution of SOUTPUT: Predicted latency distribution of W
quest with corresponding HTTP requests seen by the cloudfrontend, WebPerf automatically instruments the webpageso every HTTP request from it contains a unique id. WebPerfalso instruments the HTTP module at the webserver to matchthe request with the cloud-side processing.Probabilistic estimation. WebPerf uses Monte Carlo sim-ulation to add cloud, network, and client latency distribu-tions to produce an end-to-end latency distribution. It usesa WebProphet-like tool called ClientPrediction that, givena client-side dependency graph DGclient with causal depen-dencies of various objects downloaded by the browser anda latency vector L̄ of download latency of all objects in thewebpage, can estimate the page load time.
Algorithm 2 uses ClientPrediction for end-to-end predic-tion as follows. It performs the following steps until a suf-ficient number of end-to-end latency samples are collected(e.g., until the confidence bound is within a target). For eachobject O in the webpage, if it comes from a frontend HTTPcall, it samples a random value from the cloud-side latencydistribution and a random value from the network RTT dis-tribution and adds them to estimate the download time forO. On the other hand, if O comes from external sourcesor if it is a static object, its download time is sampled froma FetchTime distribution. (The FetchTime distribution isprofiled offline. If no such distribution is available for an ob-ject, its value in L̄ can be used as the sampled value.) Thesampled download time is then updated in L̄ and passed toClientPrediction to produce a sample of end-to-end latency.Finally, the algorithm returns the distribution of all samples.
5.2 Optimal ProfilingWebPerf’s primary bottleneck is estimating baseline la-
tencies of I/O calls appearing in the target workload (i.e.,set of requests). Given a time budget T for measuring n re-quests, one straightforward way is to allocate T/n time foreach request. However, this is not optimal since modelingsome APIs would need more samples than modeling others,due to their different variabilities in latencies. WebPerf uses

an algorithm to decide how to allocate the time budget op-timally to measure different APIs. The process is similar tooptimal experiments design [31], a statistical technique thatallows us to select the most useful training data points, andhas been used for performance prediction for large-scale ad-vanced analytics [44].
Suppose the developer is interested in what-if analysis ofher application for n different requests: r1, r2, . . . , rn. Letus first start with the simplified assumption that each requestri contains exactly one I/O call ci. We need to determineni, 1 ≤ i ≤ n, the number of times ri should be measuredto build a profile of its I/O call ci. We have two goals. First,the total measurement time3 for all requests must be withina given budget T . Suppose executing request ri takes ti sec-onds; then
∑ni=1 niti ≤ T . Second, the total (or average)
standard error of measurements is minimized. Suppose ex-ecuting request ri takes ti seconds on average, with a stan-dard deviation of σi. Then, the standard error of ni measure-ments of ri is given by σi/
√ni. Thus, we want to minimize∑n
i=1 σi/√ni. In addition to the above two goals, we also
want each request to be measured at least k times, in orderto get meaningful statistics. The above problem can be for-mulated as the following integer program:
min∑
1≤i≤n
σi√ni
s.t.∑
1≤i≤n
niti ≤ T, ni ≥ k ∀i = 1, . . . , n
The problem is in NP, since a simpler version of the prob-lem can be reduced to the Knapsack problem. We proposea linear analytical approximation algorithm based on La-grange multipliers [6] to solve it. We can derive the valuefor each ni = (T ( σi
2ti)
23 )/(
∑i (σi
√ti
2 )23 ), which is a real
number larger than 0. The intuition behind this is that weneed more samples for those APIs with higher variance buttake less time. We approximate them by rounding to closestintegers, which gives the optimal number of requests.
We have generalized our solution [23] to the more realisticsetting where a request can contain multiple I/O calls and anI/O call can appear in multiple requests.6. EVALUATION
We have implemented WebPerf for Microsoft Azure webapps, and we use this to evaluate WebPerf.
6.1 MethodologyImplementation. The WebPerf binary instrumenter is im-plemented as a NuGet package [29] that a developer can ob-tain from Azure Site Extension Gallery [4] and install to herweb app as a site extension. The Profiler is implemented asa collection of web applications and the profile dictionaryis stored in an Azure table. The WebPerf What-if Engineis implemented as a cloud service with a web interface thatallows the developer to specify her web app, workload, andwhat-if scenarios. The engine communicates with the Instru-menter (included in the target web app by the developer) andthe Profiler through HTTP requests. The WebPerf predictioncomponent is written in python (∼ 20K LOC).3The problem can also be formulated with other costs.
Experimental Setup. We have evaluated WebPerf with sixthird party Azure web applications, listed in Table 3, forwhich we could find cloud-side source code or binaries.The key application for which we provide detailed resultsis SocialForum,4 a production-ready Microsoft web appli-cation. It provides Instagram-like social network functional-ity and allows users to create new accounts, create/join fo-rums, post/share/tag/search pictures and comments, etc. Ituses five different Azure services: Azure Blob Storage forstoring large data such as images; Azure Table for storingrelational data; Azure Redis Cache for caching and storingkey-value pairs; Azure Service Bus for queueing backgroundprocessing tasks and Azure Search Service for searching fo-rums. The index page of the SocialForum website consistsof more than 20 objects, and the corresponding HTTP re-quest at the cloud side has a dependency graph consisting of116 async I/O calls to Redis Cache, Table storage, and Blobstorage, with many executing in parallel.
For lack of space we omit the detailed architecture of re-maining five applications in Table 3; these are discussed in[23]. They all are of modest complexity, as hinted by variousAzure resources they use. The requests that we use to all sixapplications are also fairly complex, with large dependencygraphs. On average, a dependency graph has 182 nodes, 180async-await edges, and 62 synchronization points.
6.2 Cloud Latency PredictionWe first evaluate accuracy of WebPerf’s predicted cloud
latency under six what-if scenarios. For each scenario andfor each application, WebPerf predicts a distribution of thecloud latency of loading the index page. To quantify theaccuracy of WebPerf’s prediction, we compare predictedlatency distribution with ground truth latency distributionmeasured by actually deploying the applications under tar-get what-if configurations. Given predicted and groundtruth latency CDFs F1 and F2, we compute the relativeerror distribution—the distribution of vertical deviations(|F1(x) − F2(x)|) of two CDFs, and report statistics suchas maximum, mean, and median of the deviations. (Notethat the maximum of the relative error distribution is the Dstatistic used for Kolmogorov–Smirnov test for comparingtwo distributions.) Ideally, the relative error statistics shouldbe close to zero.
We present detailed results only for SocialForum; resultsfor other applications are summarized in Figure 12. Unlessindicated otherwise, SocialForum is deployed in an AzureUS West datacenter and clients load its specified page in aChrome browser from California.Scenario 1: What-if the Redis cache is upgraded fromthe original Standard C0 tier to Standard C2 tier? Fig-ure 11(a) shows distributions of original latency (with C0Redis), ground truth latency (with C2 Redis), and predictedlatency (for C2 Redis). The result shows that upgrading Re-dis from C0 to C2 significantly changes cloud latency, andhence simply using the baseline performance of C0 tier as
4A pseudonym for the actual product.
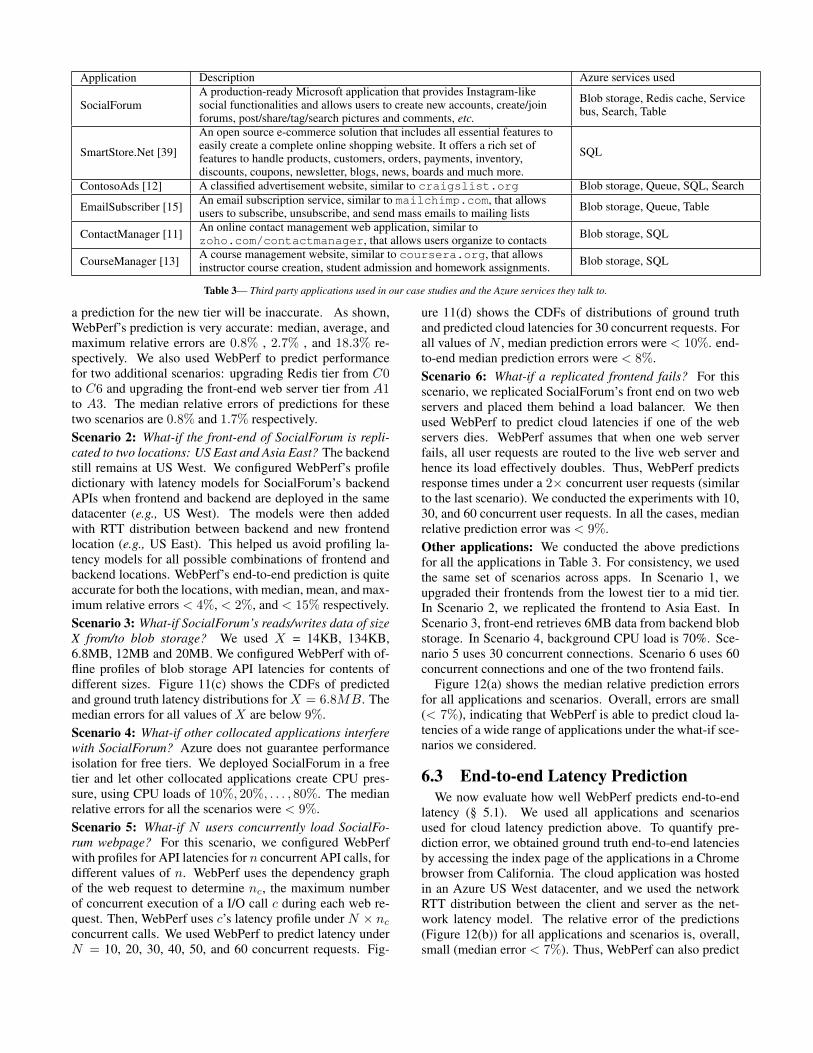
Application Description Azure services used
SocialForumA production-ready Microsoft application that provides Instagram-likesocial functionalities and allows users to create new accounts, create/joinforums, post/share/tag/search pictures and comments, etc.
Blob storage, Redis cache, Servicebus, Search, Table
SmartStore.Net [39]
An open source e-commerce solution that includes all essential features toeasily create a complete online shopping website. It offers a rich set offeatures to handle products, customers, orders, payments, inventory,discounts, coupons, newsletter, blogs, news, boards and much more.
SQL
ContosoAds [12] A classified advertisement website, similar to craigslist.org Blob storage, Queue, SQL, Search
EmailSubscriber [15] An email subscription service, similar to mailchimp.com, that allowsusers to subscribe, unsubscribe, and send mass emails to mailing lists Blob storage, Queue, Table
ContactManager [11] An online contact management web application, similar tozoho.com/contactmanager, that allows users organize to contacts Blob storage, SQL
CourseManager [13] A course management website, similar to coursera.org, that allowsinstructor course creation, student admission and homework assignments. Blob storage, SQL
Table 3— Third party applications used in our case studies and the Azure services they talk to.
a prediction for the new tier will be inaccurate. As shown,WebPerf’s prediction is very accurate: median, average, andmaximum relative errors are 0.8% , 2.7% , and 18.3% re-spectively. We also used WebPerf to predict performancefor two additional scenarios: upgrading Redis tier from C0to C6 and upgrading the front-end web server tier from A1to A3. The median relative errors of predictions for thesetwo scenarios are 0.8% and 1.7% respectively.Scenario 2: What-if the front-end of SocialForum is repli-cated to two locations: US East and Asia East? The backendstill remains at US West. We configured WebPerf’s profiledictionary with latency models for SocialForum’s backendAPIs when frontend and backend are deployed in the samedatacenter (e.g., US West). The models were then addedwith RTT distribution between backend and new frontendlocation (e.g., US East). This helped us avoid profiling la-tency models for all possible combinations of frontend andbackend locations. WebPerf’s end-to-end prediction is quiteaccurate for both the locations, with median, mean, and max-imum relative errors < 4%, < 2%, and < 15% respectively.Scenario 3: What-if SocialForum’s reads/writes data of sizeX from/to blob storage? We used X = 14KB, 134KB,6.8MB, 12MB and 20MB. We configured WebPerf with of-fline profiles of blob storage API latencies for contents ofdifferent sizes. Figure 11(c) shows the CDFs of predictedand ground truth latency distributions forX = 6.8MB. Themedian errors for all values of X are below 9%.Scenario 4: What-if other collocated applications interferewith SocialForum? Azure does not guarantee performanceisolation for free tiers. We deployed SocialForum in a freetier and let other collocated applications create CPU pres-sure, using CPU loads of 10%, 20%, . . . , 80%. The medianrelative errors for all the scenarios were < 9%.Scenario 5: What-if N users concurrently load SocialFo-rum webpage? For this scenario, we configured WebPerfwith profiles for API latencies for n concurrent API calls, fordifferent values of n. WebPerf uses the dependency graphof the web request to determine nc, the maximum numberof concurrent execution of a I/O call c during each web re-quest. Then, WebPerf uses c’s latency profile under N × ncconcurrent calls. We used WebPerf to predict latency underN = 10, 20, 30, 40, 50, and 60 concurrent requests. Fig-
ure 11(d) shows the CDFs of distributions of ground truthand predicted cloud latencies for 30 concurrent requests. Forall values of N , median prediction errors were < 10%. end-to-end median prediction errors were < 8%.Scenario 6: What-if a replicated frontend fails? For thisscenario, we replicated SocialForum’s front end on two webservers and placed them behind a load balancer. We thenused WebPerf to predict cloud latencies if one of the webservers dies. WebPerf assumes that when one web serverfails, all user requests are routed to the live web server andhence its load effectively doubles. Thus, WebPerf predictsresponse times under a 2× concurrent user requests (similarto the last scenario). We conducted the experiments with 10,30, and 60 concurrent user requests. In all the cases, medianrelative prediction error was < 9%.Other applications: We conducted the above predictionsfor all the applications in Table 3. For consistency, we usedthe same set of scenarios across apps. In Scenario 1, weupgraded their frontends from the lowest tier to a mid tier.In Scenario 2, we replicated the frontend to Asia East. InScenario 3, front-end retrieves 6MB data from backend blobstorage. In Scenario 4, background CPU load is 70%. Sce-nario 5 uses 30 concurrent connections. Scenario 6 uses 60concurrent connections and one of the two frontend fails.
Figure 12(a) shows the median relative prediction errorsfor all applications and scenarios. Overall, errors are small(< 7%), indicating that WebPerf is able to predict cloud la-tencies of a wide range of applications under the what-if sce-narios we considered.
6.3 End-to-end Latency PredictionWe now evaluate how well WebPerf predicts end-to-end
latency (§ 5.1). We used all applications and scenariosused for cloud latency prediction above. To quantify pre-diction error, we obtained ground truth end-to-end latenciesby accessing the index page of the applications in a Chromebrowser from California. The cloud application was hostedin an Azure US West datacenter, and we used the networkRTT distribution between the client and server as the net-work latency model. The relative error of the predictions(Figure 12(b)) for all applications and scenarios is, overall,small (median error < 7%). Thus, WebPerf can also predict

0 200 400 600 800 10001200140016001800Overall Time (ms)
0.0
0.2
0.4
0.6
0.8
1.0
CD
F D
istr
ibuti
on
Original Distribution
Redis Tier Change Predicted
Redis Tier Change Measured
0 200 400 600 800 1000 1200 1400Overall Time (ms)
0.0
0.2
0.4
0.6
0.8
1.0
CD
F D
istr
ibuti
on
Original Distribution
Tier Predicted
Tier Measured
1000 2000 3000 4000 5000 6000 7000Overall Time (ms)
0.0
0.2
0.4
0.6
0.8
1.0
CD
F D
istr
ibuti
on
Original Distribution
Input Size Predicted
Input Size Measured
0 200 400 600 800 1000 1200 1400 1600Overall Time (ms)
0.0
0.2
0.4
0.6
0.8
1.0
CD
F D
istr
ibuti
on
Original Distribution
Scalability Predicted
Scalability Measured
(a) Redis tier changed (b) Web Server Tier Upgrade (c) Input size changed (d) ScalabilityFigure 11—Distributions of predicted and ground truth latencies for SocialForum under various what-if scenarios.
1 2 3 4 5 6(b) End to End
0
1
2
3
4
5
6
7
1 2 3 4 5 6
Me
dia
n E
rro
r (%
)
(a) Cloud Side Scenarios
SocialForum ContosoAds
EmailSubscriber CourseManager
SmartStore.Net
ContactManager
Figure 12—Median prediction errors for 5 apps and 6 scenarios.
end-to-end latency, given a good model for network latencybetween client and server and a WebProphet-like tool thatcan predict client-side latency.
Interestingly, WebPerf’s end-to-end prediction is slightlymore accurate than cloud-side prediction. This is because allthe what-if scenarios we considered affect cloud-side laten-cies only, and offline cloud-side latency profiles have higheruncertainty than baseline latencies. In contrast, client-sideprediction relies on baseline HTTP request latencies only,and hence is more accurate.
6.4 Comparative AnalysisAcross all applications and scenarios, WebPerf is accurate
when dependency graphs are small, and latency profiles areless variable and mostly application-independent.Dependency graph complexity. The more I/O nodes in adependency graph, the more the potential prediction errors.ContactManager has simple dependencies, and hence pre-diction for it is more accurate.Profile variability. Profile variabilities manifest as predic-tion errors. In all the apps we evaluated, SocialForum’sbaseline profiles had the least variability (since only thisapp was deployed in dedicated VMs with performance iso-lation). This helped WebPerf generate a better predictionfor SocialForum, despite its highly complicated dependencygraph (each request had 100+ I/O calls). Over all the sce-narios, Scenario 4 and 6 had higher prediction errors due tohigh variabilities in latency profiles used for these scenarios.In Scenario 6, frontend latency was highly variable under alarge number of concurrent connections.Application independence of profiles. Almost all APIs inour applications were application-independent. The only ex-ceptions were ContosoAds and CourseManager, which useexpensive SQL queries on medium sized tables. Other ap-plications use small SQL tables, so latency does not changemuch with tier change (Figure 2). Latencies of queries tomedium/large SQL table change as tiers change, and henceusing baseline latencies as estimates resulted in large errors.The problem can be avoided by using workload hints, as
shown next.
6.5 Using Workload HintsWe now show a few scenarios where workload hints from
developer help WebPerf to improve its prediction.Queries to large SQL tables. CourseManager issues aJoin query on medium-sized SQL tables (10K rows). Us-ing baseline latencies, WebPerf’s prediction had a large er-ror (median error 28.9%), because baseline latencies are notgood estimates across tiers for large tables (Figure 2). How-ever, with workload hints on specific query and table size,WebPerf could reactively build profiles for the given queryand table size and lower error to 4.6%.Nondeterministic caching behavior. Latency distributionsof some APIs can be highly bimodal due to item popularity.For example, latency of accessing an item in Azure CDNdepends on whether it is already in the cache, which in turndepends on application’s workload. WebPerf’s profiling rec-ognizes such bimodal latency and maintains multiple (two inthe CDN example) latency distributions as the profile for theAPI. Using a workload hint on the cache miss rate, WebPerfcan combine these different distributions (using Monte Carlosimulation [26]). We profiled Azure CDN’s data access APIand evaluated a scenario with 1% cache miss rate. Medianprediction error was 3.2%. Without the miss rate hints, theerror was > 40%.Sharding Table storage. For SocialForum, we considered“what-if the Table is sharded into two”. By default (withoutworkload hints), WebPerf’s prediction algorithm assumesthat sharding will result in half the load on each shard, andpredicts total latency based on Table storage’s latency underhalf the load. We considered two workloads: (1) uniformworkload where requests access both shards with roughlyequal probability, in which case WebPerf’s prediction wasvery accurate (median error 1.7%) (2) skewed workloadwhere all requests accessed one shard, and since it receivedthe full load. Without workload hints, WebPerf’s estimation(assuming half load on each shard) has a median error of90.1%; however, with the hint that the workload is highlyskewed towards only one shard, prediction became fairly ac-curate (median error 5.9%).
6.6 Additional ResultsEffect of concurrency limits. For ContosoAds, we consid-ered “what-if we downgrade the SQL server from Standardto Basic tier, with 50 concurrent requests”. The Basic tieronly supports a maximum of 30 concurrent connections, andadditional connections are queued. WebPerf’s prediction is
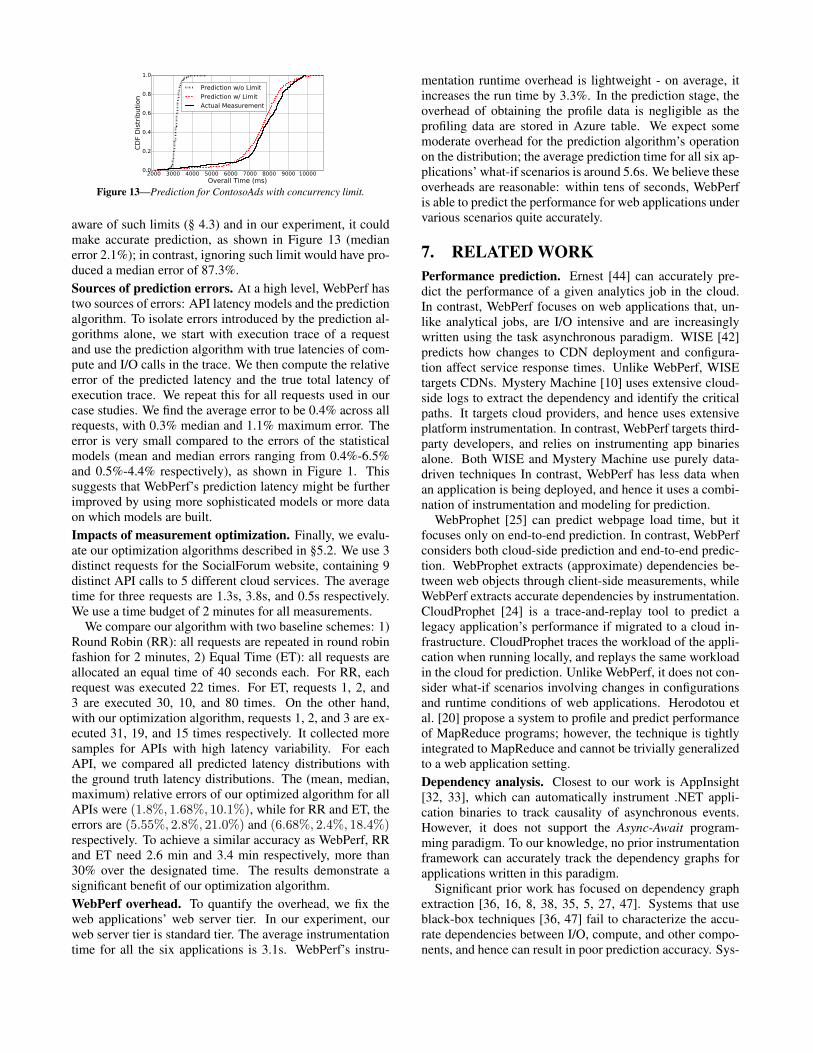
Figure 13—Prediction for ContosoAds with concurrency limit.
aware of such limits (§ 4.3) and in our experiment, it couldmake accurate prediction, as shown in Figure 13 (medianerror 2.1%); in contrast, ignoring such limit would have pro-duced a median error of 87.3%.Sources of prediction errors. At a high level, WebPerf hastwo sources of errors: API latency models and the predictionalgorithm. To isolate errors introduced by the prediction al-gorithms alone, we start with execution trace of a requestand use the prediction algorithm with true latencies of com-pute and I/O calls in the trace. We then compute the relativeerror of the predicted latency and the true total latency ofexecution trace. We repeat this for all requests used in ourcase studies. We find the average error to be 0.4% across allrequests, with 0.3% median and 1.1% maximum error. Theerror is very small compared to the errors of the statisticalmodels (mean and median errors ranging from 0.4%-6.5%and 0.5%-4.4% respectively), as shown in Figure 1. Thissuggests that WebPerf’s prediction latency might be furtherimproved by using more sophisticated models or more dataon which models are built.Impacts of measurement optimization. Finally, we evalu-ate our optimization algorithms described in §5.2. We use 3distinct requests for the SocialForum website, containing 9distinct API calls to 5 different cloud services. The averagetime for three requests are 1.3s, 3.8s, and 0.5s respectively.We use a time budget of 2 minutes for all measurements.
We compare our algorithm with two baseline schemes: 1)Round Robin (RR): all requests are repeated in round robinfashion for 2 minutes, 2) Equal Time (ET): all requests areallocated an equal time of 40 seconds each. For RR, eachrequest was executed 22 times. For ET, requests 1, 2, and3 are executed 30, 10, and 80 times. On the other hand,with our optimization algorithm, requests 1, 2, and 3 are ex-ecuted 31, 19, and 15 times respectively. It collected moresamples for APIs with high latency variability. For eachAPI, we compared all predicted latency distributions withthe ground truth latency distributions. The (mean, median,maximum) relative errors of our optimized algorithm for allAPIs were (1.8%, 1.68%, 10.1%), while for RR and ET, theerrors are (5.55%, 2.8%, 21.0%) and (6.68%, 2.4%, 18.4%)respectively. To achieve a similar accuracy as WebPerf, RRand ET need 2.6 min and 3.4 min respectively, more than30% over the designated time. The results demonstrate asignificant benefit of our optimization algorithm.WebPerf overhead. To quantify the overhead, we fix theweb applications’ web server tier. In our experiment, ourweb server tier is standard tier. The average instrumentationtime for all the six applications is 3.1s. WebPerf’s instru-
mentation runtime overhead is lightweight - on average, itincreases the run time by 3.3%. In the prediction stage, theoverhead of obtaining the profile data is negligible as theprofiling data are stored in Azure table. We expect somemoderate overhead for the prediction algorithm’s operationon the distribution; the average prediction time for all six ap-plications’ what-if scenarios is around 5.6s. We believe theseoverheads are reasonable: within tens of seconds, WebPerfis able to predict the performance for web applications undervarious scenarios quite accurately.
7. RELATED WORKPerformance prediction. Ernest [44] can accurately pre-dict the performance of a given analytics job in the cloud.In contrast, WebPerf focuses on web applications that, un-like analytical jobs, are I/O intensive and are increasinglywritten using the task asynchronous paradigm. WISE [42]predicts how changes to CDN deployment and configura-tion affect service response times. Unlike WebPerf, WISEtargets CDNs. Mystery Machine [10] uses extensive cloud-side logs to extract the dependency and identify the criticalpaths. It targets cloud providers, and hence uses extensiveplatform instrumentation. In contrast, WebPerf targets third-party developers, and relies on instrumenting app binariesalone. Both WISE and Mystery Machine use purely data-driven techniques In contrast, WebPerf has less data whenan application is being deployed, and hence it uses a combi-nation of instrumentation and modeling for prediction.
WebProphet [25] can predict webpage load time, but itfocuses only on end-to-end prediction. In contrast, WebPerfconsiders both cloud-side prediction and end-to-end predic-tion. WebProphet extracts (approximate) dependencies be-tween web objects through client-side measurements, whileWebPerf extracts accurate dependencies by instrumentation.CloudProphet [24] is a trace-and-replay tool to predict alegacy application’s performance if migrated to a cloud in-frastructure. CloudProphet traces the workload of the appli-cation when running locally, and replays the same workloadin the cloud for prediction. Unlike WebPerf, it does not con-sider what-if scenarios involving changes in configurationsand runtime conditions of web applications. Herodotou etal. [20] propose a system to profile and predict performanceof MapReduce programs; however, the technique is tightlyintegrated to MapReduce and cannot be trivially generalizedto a web application setting.Dependency analysis. Closest to our work is AppInsight[32, 33], which can automatically instrument .NET appli-cation binaries to track causality of asynchronous events.However, it does not support the Async-Await program-ming paradigm. To our knowledge, no prior instrumentationframework can accurately track the dependency graphs forapplications written in this paradigm.
Significant prior work has focused on dependency graphextraction [36, 16, 8, 38, 35, 5, 27, 47]. Systems that useblack-box techniques [36, 47] fail to characterize the accu-rate dependencies between I/O, compute, and other compo-nents, and hence can result in poor prediction accuracy. Sys-
tems that modify the framework [16, 8, 38, 35] are hard todeploy in cloud platforms. And techniques that require de-veloper effort [5, 27] are hard to scale. There are also sys-tems that track dependencies of network components [46, 9].WebPerf differs from these frameworks in its target system(cloud-hosted web application).Webpage Analysis. [17, 45, 14, 19, 30] measure web-site performance by analyzing the request waterfall. Page-speed [17] analyzes the webpage source and proposes con-tent optimization. Unlike WebPerf, these systems only focuson the client-side view and not the server-side.
8. CONCLUSIONWe presented WebPerf, a system that systematically ex-
plores what-if scenarios in web applications to help devel-opers choose the right configurations and tiers for their tar-get performance needs. WebPerf automatically instrumentsthe web application to capture causal dependencies of I/Oand compute components in the request pipeline. Togetherwith online- and offline-profiled models of various compo-nents, it uses the dependency graphs to estimate a distribu-tion of cloud and end-to-end latency. We have implementedWebPerf for Microsoft Azure. Our evaluation with six realweb application shows that WebPerf can be highly accurateeven for websites with complex dependencies.Acknowledgements. We thank the reviewers and our shep-herd Ion Stoica for their comments that helped improve thetechnical content and presentation of the paper.
9. REFERENCES[1] ANTS Performance Profiler. http://www.red-gate.com/products/
dotnet-development/ants-performance-profiler/.[2] Asynchronous Programming with Async and Await.
https://msdn.microsoft.com/en-us/library/hh191443.aspx.[3] Amazon Web Services Asynchronous APIs for .NET.
http://docs.aws.amazon.com/AWSSdkDocsNET/V2/DeveloperGuide/sdk-net-async-api.html.
[4] Azure Web Extension Gallery .https://www.siteextensions.net/packages.
[5] P. Barham, R. Isaacs, R. Mortier, and D. Narayanan. Magpie: OnlineModelling and Performance-aware Systems. In HotOS, 2003.
[6] R. Bellman. Dynamic programming and Lagrange multipliers.Proceedings of the National Academy of Sciences of the UnitedStates of America, 1956.
[7] Callback Hell. http://callbackhell.com/.[8] M. Y. Chen, E. Kiciman, E. Fratkin, A. Fox, and E. Brewer. Pinpoint:
Problem determination in large, dynamic internet services. In IEEEDSN, 2002.
[9] X. Chen, M. Zhang, Z. M. Mao, and P. Bahl. Automating NetworkApplication Dependency Discovery: Experiences, Limitations, andNew Solutions. In USENIX OSDI, 2008.
[10] M. Chow, D. Meisner, J. Flinn, D. Peek, and T. F. Wenisch. TheMystery Machine: End-to-end performance analysis of large-scaleInternet services. In USENIX OSDI, 2014.
[11] Contact Manager.https://azure.microsoft.com/en-us/documentation/articles/web-sites-dotnet-deploy-aspnet-mvc-app-membership-oauth-sql-database/.
[12] Contoso Ads. https://azure.microsoft.com/en-us/documentation/articles/cloud-services-dotnet-get-started/.
[13] Course Manager. https://www.asp.net/mvc/overview/getting-started/getting-started-with-ef-using-mvc/creating-an-entity-framework-data-model-for-an-asp-net-mvc-application.
[14] Dareboost Website Analysis and Optimization .https://www.dareboost.com/en/home/.
[15] EmailSubscriber.https://code.msdn.microsoft.com/Windows-Azure-Multi-Tier-eadceb36/sourcecode?fileId=127708&pathId=382208951.
[16] R. Fonseca, G. Porter, R. H. Katz, S. Shenker, and I. Stoica. X-trace:A pervasive network tracing framework. In USENIX NSDI, 2007.
[17] Google PageSpeed Insights.https://developers.google.com/speed/pagespeed/insights/.
[18] C. M. Grinstead and J. L. Snell. Introduction to probability.American Mathematical Soc., 2012.
[19] GTmetrix Website Speed Analysis . https://gtmetrix.com/.[20] H. Herodotou and S. Babu. Profiling, what-if analysis, and
cost-based optimization of mapreduce programs. VLDB, 2011.[21] High Scalability: building bigger, faster, more reliable websites.
http://highscalability.com/.[22] JetBrains dotTrace. http://www.jetbrains.com/profiler/.[23] Y. Jiang, L. Ravindranath, S. Nath, and R. Govindan. Evaluating
“What-If” Scenarios for Cloud-hosted Web Applications. TechnicalReport MSR-TR-2016-36, Microsoft Research, June 2016.
[24] A. Li, X. Zong, S. Kandula, X. Yang, and M. Zhang. CloudProphet:Towards Application Performance Prediction in Cloud. In ACMSIGCOMM, 2011.
[25] Z. Li, M. Zhang, Z. Zhu, Y. Chen, A. G. Greenberg, and Y.-M. Wang.WebProphet: Automating Performance Prediction for Web Services.In USENIX NSDI, 2010.
[26] C. Z. Mooney. Monte carlo simulation. Sage Publications, 1997.[27] New Relic. http://newrelic.com/.[28] Node.js. https://nodejs.org/en/.[29] NUGET Package. https://www.nuget.org/packages.[30] Pingdom Website Speed Test. http://tools.pingdom.com/fpt/.[31] F. Pukelsheim. Optimal design of experiments. SIAM, 1993.[32] L. Ravindranath, J. Padhye, S. Agarwal, R. Mahajan, I. Obermiller,
and S. Shayandeh. AppInsight: Mobile App Performance Monitoringin the Wild. In USENIX OSDI, 2012.
[33] L. Ravindranath, J. Padhye, R. Mahajan, and H. Balakrishnan.Timecard: Controlling user-perceived delays in server-based mobileapplications. In ACM SOSP, 2013.
[34] Redis Cache. https://azure.microsoft.com/en-us/services/cache/.[35] P. Reynolds, C. E. Killian, J. L. Wiener, J. C. Mogul, M. A. Shah, and
A. Vahdat. Pip: Detecting the Unexpected in Distributed Systems. InUSENIX NSDI, 2006.
[36] P. Reynolds, J. L. Wiener, J. C. Mogul, M. K. Aguilera, andA. Vahdat. Wap5: black-box performance debugging for wide-areasystems. In ACM WWW, 2006.
[37] D. J. Rumsey. Statistics For Dummies, 2nd Edition. Wiley, 2011.[38] B. H. Sigelman, L. A. Barroso, M. Burrows, P. Stephenson,
M. Plakal, D. Beaver, S. Jaspan, and C. Shanbhag. Dapper, alarge-scale distributed systems tracing infrastructure. Googleresearch, 2010.
[39] SmartStore.Net. http://www.smartstore.com/net/en/.[40] Stackify. http://stackify.com/.[41] D. Syme, T. Petricek, and D. Lomov. The F# asynchronous
programming model. In Practical Aspects of Declarative Languages.Springer, 2011.
[42] M. Tariq, A. Zeitoun, V. Valancius, N. Feamster, and M. Ammar.Answering what-if deployment and configuration questions withwise. In ACM SIGCOMM CCR, 2008.
[43] TechStacks. http://techstacks.io/stacks.[44] S. Venkataraman, Z. Yang, M. Franklin, B. Recht, and I. Stoica.
Ernest: efficient performance prediction for large-scale advancedanalytics. In USENIX NSDI, 2016.
[45] Webpage Test. http://www.webpagetest.org/.[46] M. Yu, A. G. Greenberg, D. A. Maltz, J. Rexford, L. Yuan,
S. Kandula, and C. Kim. Profiling Network Performance forMulti-tier Data Center Applications. In USENIX NSDI, 2011.
[47] Z. Zhang, J. Zhan, Y. Li, L. Wang, D. Meng, and B. Sang. Preciserequest tracing and performance debugging for multi-tier services ofblack boxes. In IEEE DSN, 2009.