Embed Size (px)
Citation preview

The Centers for Medicare & Medicaid Services' Office of Research, Development, and
Information (ORDI) strives to make information available to all Nevertheless, portions of our
files including charts, tables, and graphics may be difficult to read using assistive technology.
Persons with disabilities experiencing problems accessing portions of any file should contact
ORDI through e-mail at ORDI_508_Compliance@cms hhs gov.
Evaluating the Stability of Physician Efficiency Scores February 2010
Thomas MaCurdy Jason Shafrin Elizabeth Hartmann Maria Ho Lauren Talbot Ken Ueda Zhihao Zhang
CMS Project Officer Frederick Thomas
Acumen, LLC
500 Airport Blvd., Suite 365
Burlingame, CA 94010


EXECUTIVE SUMMARY
The goal of reducing Medicare costs has prompted some policymakers to propose pay-
for-performance schemes targeted at increasing the efficiency of Medicare providers. One
method for assessing physician efficiency uses episode grouping software as a basis for
comparing a provider’s level of resource utilization to that of his peers. Such software constructs
episodes of care from information on medical claims. Given rules for calculating the costs of
episodes and for attributing episodes to the providers responsible for them, one can use episode
costs to formulate physician resource utilization scores. Before Medicare could use these scores
to evaluate physician performance, however, researchers must demonstrate that these proposed
scoring methods are reliable.
Evaluating the stability of these scores over time provides a test concerning whether the
physician resource utilization measures are in fact reliable. Assuming actual provider practice
patterns change little from year to year, observing stable physician efficiency scores provides
evidence of a reliable scoring method. This report investigates score stability using Oregon
Medicare episodes from 2003 and 2005. To construct these episodes from claims data, this
analysis relies on two prominent commercial groupers: Ingenix’s Symmetry Episode Treatment
Groups (ETG) and Thomson Reuters’ Medstat Medical Episode Grouper (MEG). This report
examines the stability of two formulations of efficiency scores: (i) overall (or composite) scores
that combine a provider’s episode-specific scores into a single measure, and (ii) episode-specific
scores that measure a provider’s relative resource use for care associated with particular types of
health conditions,.
Broadly, this report shows that physician scores based on ETG and MEG grouped
episodes display decidedly mixed levels of stability. In particular, the analysis finds that:
• Composite physician resource utilization scores exhibit only modest levels of stability over time. The one-year correlation of physician scores ranges from 0.46 to 0.60. Additionally, physicians classified as the highest-cost providers in a given year have less than a 50% likelihood of being classified as such in a following year.
• Physicians’ episode-specific scores exhibit even less stability. The one-year correlation of physician scores is generally less than 0.45. However, as this calculation requires that a physician have at least 10 episodes per type to be scored, around 90% of episode-specific scores are dropped from the analysis. When no episode minimum is imposed, more physicians receive scores but stability falls even further, with the correlation
Acumen, LLC Evaluating the Stability of Physician Efficiency Scores | February 2010 i
between scores from one year to the next at around 0.15.
Methodology for Constructing Physician Efficiency Scores
The process of constructing physician efficiency scores relies on five steps:
• Grouping claims into episodes; • Attributing episode costs to providers; • Specifying peer groups of comparable providers; • Adjusting episode costs for patient risk factors; and • Assigning providers efficiency scores based on the risk-adjusted episode costs.
Application of the ETG and MEG proprietary software packages carries out the first step,
assigning raw medical claims into episodes that capture courses of treatment for particular health
conditions. In principle, episodes of care for the same condition should be clinically coherent
units of analysis comparable across providers. The groupers “open” an episode with an
initiating event and then aggregate other relevant claims into the episode. The grouping process
is driven primarily by diagnosis codes on claims. ETG and MEG “close” an episode when a
sufficient period of time has passed without any related claims.
Once the episodes have been created, they must be attributed to physicians. In cases
where a patient encountered multiple providers during an episode, this analysis attributes the
episode to the provider with the plurality of the total costs on Part B claims—the “PBmax” rule.
Next, a peer group is specified. This analysis requires that for comparison there be at least 10
physicians within the same specialty. Once a peer group has been determined, episode costs are
risk adjusted to, ideally, eliminate the impact of factors beyond physicians’ control. Finally,
efficiency scores are created based on these risk-adjusted costs.
In our construction of physician resource utilization scores, an average physician within
any specialty receives a score equal to one. Episode-specific scores greater than 1.0 imply high
cost (low efficiency), whereas scores less than 1.0 imply low cost (high efficiency). An
orthopedic surgeon, for instance, with a score of 1.25 for spinal fracture episodes and 0.9 for hip
fracture episodes would have treated spinal fracture episodes in that year in a manner that was
25% more expensive than the average cost for spinal fracture episodes based on all physicians in
his specialty but treated hip fracture episodes in a manner 10% less expensive than the average
Acumen, LLC ii

among orthopedic surgeons.
Once episode-specific scores are calculated based on risk-adjusted costs, our analysis
formulates an overall physician efficiency score by computing a weighted average of the
episode-specific scores earned by the provider, with the weights based on the average cost of
each relevant episode type. If a provider has more than one specialty, then this person (or group
practice) receives a separate overall score for each specialty. The analysis also mandates that
physicians have at least 20 episodes of any type to be eligible for a score.
Modest Stability in Physician Efficiency Scores
To evaluate physician efficiency score stability over time, this report relies on four
distinct measures. Table 1 lists each of the four metrics and provides the empirical findings.
The first measure is the correlation of a provider’s score from one year to the next. The second
measure rates physician cost efficiency according to eight score categories ranked from low to
high cost, with a typical category covering a thirty percentage point range. The stability measure
evaluates the extent to which physician scores vary across these score categories from year to
year. The third measure evaluates the average absolute change in physician scores from year to
year. Finally, the fourth measure assesses the likelihood that a physician classified as a high-cost
provider in one year remains so in subsequent years.
Table 1: Stability Measures for Physician Efficiency Scores (Overall Scores)
Stability Measure Grouper One-year Stability
Correlation of scores ETG 0.53-0.60 MEG 0.46
Persistence of score categorization ETG 40-41% MEG 41-42%
Absolute change in score ETG 0.29 MEG 0.37-0.38
Persistence of high-cost physician status ETG 40-48% MEG 43-45%
The correlation of scores across years appears to be moderately strong. According to
Table 1, the correlation of ETG-based scores between 2003 and 2004 is 0.60 and the correlation
Acumen, LLC Evaluating the Stability of Physician Efficiency Scores | February 2010 iii

between 2004 and 2005 is 0.53. These figures are slightly lower for MEG. The correlation
between 2003 and 2004 as well as between 2004 and 2005 is 0.46.
One also observes low levels of stability due to significant movement across score
categories. As seen in the second row of Table 1, just over 40% of providers remain in the same
score category over a two-year period. About 20% of providers experience a change of two or
more categories in their score; a two-category score change generally implies a 30% to 90%
change in resource utilization for the average physician. The proportion of physicians who
change score categories is nearly identical for scores based on both ETG and MEG-constructed
episodes.
The third measure of stability in Table 1, the average absolute score changes across years,
also demonstrates modest stability in physician scoring patterns over time. The ETG average
score difference over one year is 0.29, which represents a 29% average increase or decrease in
the resource utilization assessed to a provider. Although one-third of providers experience a
score change of less than 0.10 for ETG, about half of providers’ scores change by more than
0.20. For MEG, the distribution of score changes is nearly identical.
Turning to the least efficient subset of physicians, the fourth measure reveals that less
than half of the highest-cost physicians in a given year remain classified as such in subsequent
years. Table 1 shows that it is never the case that a majority of the physicians in the least
efficient five percentiles maintain that status in the subsequent year. The stability of these high-
cost providers is especially relevant because efficiency scoring has the goal of reducing the
resource utilization of the most inefficient providers. To place these numbers into context,
approximately 60% of the most costly providers in 2004 are not high-cost in 2005.
Compared to the modest levels of stability that overall scores exhibit, episode-specific
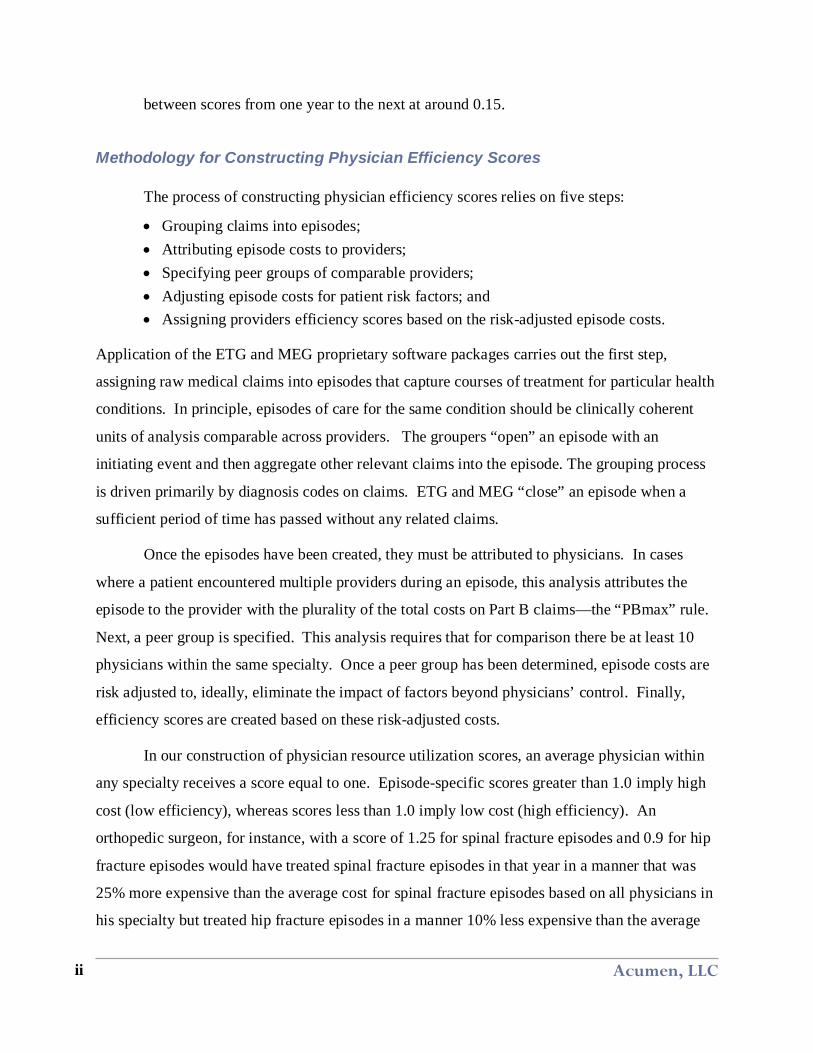
scores can be considered somewhat less stable. Table 2 repeats the measures of stability
depicted in Table 1, but considers physician efficiency scores computed separately for each
episode type rather than for the overall scores discussed above. Whereas the overall scores may
best summarize the general efficiency level of an individual physician, episode-specific scores
highlight where exactly a physician could change his behavior to improve performance. In Table
2, physicians receive scores for episode types only where they are attributed a minimum of 10
episodes of that type per year for the years being compared. The findings in this table reveal
Acumen, LLC iv
somewhat lower levels of stability for the three measures of overall scores summarized
previously. The persistence of high-cost status, however, shows slightly more stability than is
the case for overall scores.
Table 2: Stability Measures for Efficiency Scores (Episode-specific Scores) Minimum of 10 Episodes per Episode Type
Stability Measure Grouper One-year Stability
Correlation of scores ETG 0.41-0.45 MEG 0.41-0.42
Persistence of score categorization ETG 34% MEG 33-34%
Absolute change in score ETG 0.41-0.42 MEG 0.48
Persistence of high-cost physician status ETG 51-53% MEG 48-50%
Without a minimum episode count required to assign physicians episode-specific scores,
the results in Table 2 would reveal sharply less stability. For both ETG and MEG episode
constructions, the correlation drops to below 0.20 and fewer than 25% of physicians who rank in
the highest-cost five percentiles remain in this classification in subsequent years. While
imposing a 10-episode limit to be scored raises stability measures considerably, it also drops
90% of the episode-specific physician scores from the analysis.
Sensitivity Analysis
This report further explores the effects of altering several aspects of the scoring approach
described above on the various measures of stability.
• Treatment of Outlier Episodes. This specification removes the highest (top 1% of the cost distribution) and lowest (bottom 1% of the cost distribution) outlier episodes within each episode type.
• Attribution Rules. Instead of attributing episodes to the physician with the highest proportion of Part B claim costs for each episode, the alternative attribution rule assigns responsibility for an episode to the provider with the highest costs from Evaluation and Management (E&M) claims.
• Episode Minimums for a Given Episode Type. This requirement mandates that physicians have a minimum of 10 episodes of a given type for an episode-specific score to become eligible for the overall score. Whereas this restriction lowers the
Acumen, LLC Evaluating the Stability of Physician Efficiency Scores | February 2010 v
number of episode-specific scores, it has much smaller effect on the stability of overall resource utilization scores.
• Sample of Primary Care Providers. This specification limits the physician population to include only those in the specialties of internal medicine, general practice, and family practice.
These alternate specifications do not materially change either the quantitative or qualitative
conclusions.
Concluding Remarks
Generally, the results presented here reveal a simple tradeoff: higher stability can be
achieved by increasing the number of episodes included in the score, but the resulting
heterogeneity in episodes makes these scores less useful in revealing areas with room for
improvement. An interesting insight highlighted in this analysis concerns the nature of “overall”
or “composite” scores used to evaluate physician efficiency. On one hand, these scores combine
episode-specific measures and, because these overall scores are an average, they inherently
exhibit more stability than their episode-specific counterparts. On the other hand, episode-
specific scores are more useful for identifying areas for physician improvement, even though
these scores are less stable. Another means to increase stability is increasing the minimum
number of episodes in particular a type of care required to receive a score. The downside of this
approach is the correspondingly sharp reduction in the number of providers who can be scored.
This tradeoff is not solely a property of scores based on episodes, but it is likely to apply to any
formulation of physician efficiency scores.
Acumen, LLC vi

TABLE OF CONTENTS
Executive Summary ............................................................................................................................. i1 Introduction ................................................................................................................................. 12 Assigning Episode-Based Physician Efficiency Scores ......................................................... 3
2.1 Building and Assigning Costs to Medicare Episodes of Care ............................................ 32.1.1 Application of Groupers to Medicare Data .................................................................... 42.1.2 Sample of 2003-2005 Complete Episodes for Oregon Medicare Beneficiaries .......... 52.1.3 Assigning Costs to Episodes ........................................................................................... 5
2.2 Attributing Episode Costs to Physicians .............................................................................. 62.3 Specifying Peer Groups of Comparable Physicians ............................................................ 62.4 Assigning Efficiency Scores ................................................................................................. 7
2.4.1 Construction of Episode-Specific Scores ....................................................................... 82.4.2 Construction of Overall Scores ....................................................................................... 9
3 Stability of Physician Efficiency Scores ................................................................................ 103.1 Correlation of Scores across Years ..................................................................................... 103.2 Stability in Score Categorization ........................................................................................ 12
3.2.1 Stability between 2003 and 2004 .................................................................................. 123.2.2 Stability between 2004 and 2005 .................................................................................. 15
3.3 Magnitude of Score Changes between Years ..................................................................... 163.4 Stability of Highest-Cost Physicians .................................................................................. 183.5 Stability of Episode-Specific Scores ................................................................................... 20
3.5.1 Stability with No Minimum Episode Count ................................................................. 203.5.2 Stability with a Minimum Episode Count .................................................................... 21
4 Sensitivity Analysis ................................................................................................................... 244.1 Treatment of Outlier Episodes ............................................................................................ 244.2 Changing the Episode Attribution Rule .............................................................................. 264.3 Raising the Minimum Episode Count per Provider for Each Episode Type ................... 274.4 Narrowing the Selection of Provider Specialties ............................................................... 28
5 Summary of Findings ............................................................................................................... 296 References .................................................................................................................................. 31Appendix A: Supplementary Tables ............................................................................................. 32
Acumen, LLC Evaluating the Stability of Physician Efficiency Scores | February 2010 vii

LIST OF TABLES AND FIGURES Table 3.1: Correlation of Physician Scores (Overall Scores) .......................................................... 12Table 3.2: Cross-Tabulation for ETG 2003-2004 ............................................................................. 14Table 3.3: Cross-Tabulation for MEG 2003-2004 ........................................................................... 14Table 3.4: Cross-Tabulation for ETG 2004-2005 ............................................................................. 15Table 3.5: Cross-Tabulation for MEG 2004-2005 ........................................................................... 16Table 3.6: Mean Absolute Score Changes 2003-2005 ..................................................................... 16Table 3.7: Stability in Classification as a High-Cost Provider (Overall Scores) ............................ 19Table 3.8: Stability Measures for Physician Scores (Episode-Specific Scores) ............................. 21Table 3.9: Stability Measures for Physician Scores (Episode-Specific Scores) ............................. 22Table 4.1: Stability across Specifications for ETG .......................................................................... 25Table 4.2: Stability across Specifications for MEG ......................................................................... 26Table A.1: Cross-Tabulation for ETG 2003-2005 ............................................................................ 32Table A.2: Cross-Tabulation for MEG 2003-2005 .......................................................................... 32Table A.3: Cross-Tabulation for ETG 2003-2004: .......................................................................... 33Table A.4: Cross-Tabulation for MEG 2003-2004: ......................................................................... 33Table A.5: Cross-Tabulation for ETG 2004-2005: .......................................................................... 34Table A.6: Cross-Tabulation for MEG 2004-2005: ......................................................................... 34Table A.7: Cross-Tabulation for ETG 2003-2004: EMmax Attribution ....................................... 35Table A.8: Cross-Tabulation for MEG 2003-2004: EMmax Attribution ....................................... 35Table A.9: Cross-Tabulation for ETG 2004-2005: EMmax Attribution ....................................... 36Table A.10: Cross-Tabulation for MEG 2004-2005: EMmax Attribution ..................................... 36Table A.11: Cross-Tabulation for ETG 2003-2004: 10-10 Cell Size ............................................. 37Table A.12: Cross-Tabulation for MEG 2003-2004: 10-10 Cell Size ............................................ 37Table A.13: Cross-Tabulation for ETG 2004-2005: 10-10 Cell Size ............................................. 38Table A.14: Cross-Tabulation for MEG 2004-2005: 10-10 Cell Size ............................................ 38Table A.15: Cross-Tabulation for ETG 2003-2004: Medical Doctors Only .................................. 39Table A.16: Cross-Tabulation for MEG 2003-2004: Medical Doctors Only ................................. 39Table A.17: Cross-Tabulation for ETG 2004-2005: Medical Doctors Only ................................. 40Table A.18: Cross-Tabulation for MEG 2004-2005: Medical Doctors Only ................................. 40Table A.19: Cross-Tabulation for ETG 2003-2004: Internal Medicine, General & Family
Practice ............................................................................................................................... 41Table A.20: Cross-Tabulation for MEG 2003-2004: Internal Medicine, General & Family
Practice ............................................................................................................................... 41Table A.21: Cross-Tabulation for ETG 2004-2005: Internal Medicine, General & Family
Practice ............................................................................................................................... 42Table A.22: Cross-Tabulation for MEG 2004-2005: Internal Medicine, General & Family
Practice ............................................................................................................................... 42
Acumen, LLC viii

1 INTRODUCTION
Policymakers have proposed instituting value-based purchasing schemes targeted at
improving Medicare’s overall quality and cost-effectiveness. Among the pay-for-performance
structures under consideration are payment models that would reward efficient physicians who
avoid unnecessary costs or penalize the least efficient physicians. A Government Accountability
Office (GAO) report recommends that “CMS develop a system that identifies individual
physicians with inefficient practice patterns and, seeking legislative changes as necessary, uses
the results to improve the efficiency of care financed by Medicare” (GAO, 2007). However, a
critical challenge in building such a pay-for-performance system is determining a reliable
method for measuring physician efficiency.
One potential way of scoring a Medicare physician’s resource use is to assign a single
efficiency score to each physician based on the costs of episodes of care, or courses of treatment
for medical conditions, for which the physician is deemed responsible. Building these episodes
would be the task of grouping software. This technology assigns medical claims to episodes and
ideally yields clinically coherent events reflecting courses of care for specific illnesses or health
conditions (e.g., a hip fracture or pneumonia). Although some private insurance plans have
experimented with using grouper-based measures to evaluate physician performance (Lake et al.,
2007), the validity of using episode costs to evaluate physicians remains in question.
Assuming physicians’ practice patterns vary only marginally across years, then a valid
method of scoring physician efficiency should produce rankings that remain stable from year to
year. Physicians identified as low cost (i.e., high efficiency) in one year should be identified as
low cost in subsequent years if their treatment practices do not change. Similarly, physicians
identified as high cost (i.e., low efficiency) should be identified as high cost in subsequent years.
A pay-for-performance system could scrutinize these inefficient physicians and institute cost-
reduction measures to alter these physicians' behavior.
This report investigates whether annual physician efficiency scores are stable in a
Medicare setting across the years 2003-2005. A physician’s efficiency score is based on the
costs of episodes created by Ingenix’s Symmetry Episode Treatment Groups (ETG) and
Thomson Reuters’ Medstat Medical Episode Grouper (MEG). The analysis calculates a
physician’s score using the costs of the episodes attributed to him, relative to the costs for Acumen, LLC Evaluating the Stability of Physician Efficiency Scores | February 2010 1

physicians in specialty-based peer group(s). To evaluate the stability of these physician scores,
this report explores the properties of four measures. The first calculates the correlation of
physician scores from one year to the next. The second measure examines the annual movement
of physicians across efficiency score categories and the third explores average changes in actual
physician scores across years. Finally, given the importance of isolating the least efficient
physicians, the fourth measure identifies the extent to which physicians initially ranked as high
cost maintain their high-cost status in subsequent years.
The remainder of this report proceeds as follows. Section 2 gives background
information on groupers and explains a five-step methodology for calculating episode-based
physician efficiency scores. Next, Section 3 presents findings on the stability of efficiency
scores over the period 2003-2005, relying on the four measures of stability described above.
Section 4 then describes the results of a sensitivity analysis designed to investigate whether a
variety of methodological changes alters the basic findings. Finally, Section 5 presents
concluding remarks.
Acumen, LLC 2

2 ASSIGNING EPISODE-BASED PHYSICIAN EFFICIENCY SCORES
The physician scoring system developed in MaCurdy et al. (2008b) assigns providers
participating in the Medicare fee-for-service (FFS) system efficiency scores based on their
resource utilization. According to this methodology, constructing a physician’s efficiency score
involves five steps. First, commercial grouping software organizes medical claims into episodes
of treatment for specific categories of illnesses, where an episode of care should capture all
claims related to the treatment of a certain condition. One must then assign claim costs to these
episodes to calculate resource utilization. The second step attributes episodes to physicians.
Thirdly, one must specify relevant peer group(s) of providers against which a physician can be
reasonably compared. The fourth step risk adjusts episode costs to account for patient risk
factors outside of a physician’s control. Finally, each physician receives an efficiency score that
compares the risk-adjusted costs of the episodes he has been attributed to other physicians within
his peer group(s).
The following sections elaborate these steps in more detail. Section 2.1 describes the
Medicare data used in the analysis, along with the assignment of costs to episodes of care.
Section 2.2 defines a rule for attributing each episode of care to a single physician. Section 2.3
outlines a framework for determining meaningful physician peer groups. Finally, Section 2.4
explains how physicians are assigned efficiency scores, including the way in which risk
adjustment is accounted for in the construction of these scores.
2.1 Building and Assigning Costs to Medicare Episodes of Care
In this report, physician efficiency scores rely on episodes of care created by the ETG and
MEG groupers. These two proprietary software packages assign raw medical claims into sets of
clinically coherent episodes that capture courses of treatment for particular health conditions. In
principle, episodes should be units of analysis comparable across providers. Ideally, episodes of
the same type (i.e., episodes reflecting treatment for the same condition) should be constructed
so that after controlling for patient and physician characteristics, they exhibit cost differences
sensitive only to the decisions made by the physician responsible for the care. Section 2.1.1
introduces how the ETG and MEG groupers use Medicare claims data to create episodes of care
while Section 2.1.2 describes the sample of Oregon Medicare episodes upon which this
Acumen, LLC Evaluating the Stability of Physician Efficiency Scores | February 2010 3

evaluation of physician score stability relies. Section 2.1.3 explains our methodology for
assigning costs to episodes.
2.1.1 Application of Groupers to Medicare Data
Groupers use medical claims as the inputs for creating episodes. The grouping process is
driven primarily by the claims’ diagnosis codes, with procedure codes also used in a variety of
circumstances as supplementary information. Ideally, claims in the same course of treatment
would be grouped together. For example, a hospital stay for stroke and stroke-related outpatient
care after discharge should be grouped into the same episode. Groupers “open” episodes with an
initiating event and then assign claims to the appropriate episodes. The software “closes”
episodes if a sufficient period of time passes without any related claims.1 Whereas the ETG
grouper can link an institutional claim to multiple episodes, the MEG grouper assigns each
institutional claim to only one episode. For non-institutional claims, both groupers assign each
line item (which reports diagnosis and procedure codes) to a single episode. The output
produced by groupers depends partially on users’ decisions regarding the claim types included in
the processing and the information on the claims selected for input. MaCurdy et al. (2008)
presents a full description of how the ETG and MEG groupers use specific data items from
different Medicare claims types to construct episodes of care.
For the ETG grouper (version 7.0.1), this analysis considers 679 different episode types.
Each episode type corresponds to a base episode type (condition) and, in cases where ETG
further separates the base type into up to 4 severity levels, a severity level. For example,
Bacterial Lung Infection, SL1 and the more severe Bacterial Lung Infection, SL2, Bacterial Lung
Infection, SL3, and Bacterial Lung Infection, SL4 are four distinct ETG episode types. All
episode types are categorized as being chronic, acute, or preventative.2
The MEG grouper (version 7.1) assigns each episode to one of 560 base MEG disease
classifications. In addition, MEG can allot up to 4 “disease stages” to a base MEG episode, with
stage 1 representing the lowest level of health complication and stage 4 being death. Unlike
Acumen, LLC 4
1 Specific groupers have different rules about what type of claim can open an episode. The length of this ‘clean’ period needed to close an episode depends on the type of episode and specific grouper used. 2 Acute and preventative episodes invariably have clearly defined start and end dates; chronic episodes typically do not because they often reflect health conditions that began before the study period and continued afterwards.

ETG, subdividing base MEGs by their disease stages would create thousands of classifications.
To maintain a like comparison between MEGs and ETGs in terms of the number of episode
types, this analysis only uses base disease classifications as MEG episode types. As with ETGs,
MEGs are classified into one of three classes: acute, chronic, or preventative.
2.1.2 Sample of 2003-2005 Complete Episodes for Oregon Medicare Beneficiaries
This analysis uses complete attributed 2003-2005 episodes built from Oregon Medicare
claims (i.e., episodes ending in 2003, 2004, or 2005). In order to ensure that all eligible claims
are grouped to these episodes, this analysis inputs all Medicare fee-for-service Parts A and B
claims data from 2002-2006 into the ETG and MEG groupers. For inclusion, beneficiaries must
reside in Oregon and be continuously enrolled while alive in fee-for-service Parts A and B. 3
Although episodes must end in 2003, 2004, or 2005, episodes can start at any time during that
year or the preceding year. For example, 2003 episodes can begin at any time in 2002 or 2003.
To verify that the episodes are closed by the groupers, this analysis also employs claims data
from the subsequent year. Using this methodology, ETG is able to group 87% of inputted 2003-
2005 raw claims into episodes, accounting for 96% of the costs associated with these claims.
MEG groups 82% of 2003-2005 raw claims, accounting for 94% of costs.
2.1.3 Assigning Costs to Episodes
After the groupers allocate claims to episodes, one must assign costs to these episodes.
This analysis aggregates the cost of the institutional claims and non-institutional line items
assigned to the episode, with a claim or line item’s expense consisting of its Medicare
payments.4 When the ETG grouper allocates an institutional claim to multiple episodes, this
analysis assigns the entire cost of this claim to that episode allocated the plurality of the claim's
service-level input records.5
3 This sample includes beneficiaries who died before the end of the time period (December 31, 2005), as long as they were continuously enrolled in Medicare Parts A and B while alive throughout the 2002-05 period. To prevent termination of the flow of claims in our evaluation of the functionality of groupers, our previous reports (MaCurdy et al. 2008a and MaCurdy et al. 2008b) excluded beneficiaries who died before the end of the study period from the sample. This exclusion does not have an appreciable effect on any of the analysis done in these earlier reports. 4 For IP claims, this excludes the capital payment portion of payments. 5 In the case of a tie, the parent institutional claim’s cost is distributed equally among episodes tied with the highest assignments. See MaCurdy et al. (2008a) for additional details.
Acumen, LLC Evaluating the Stability of Physician Efficiency Scores | February 2010 5
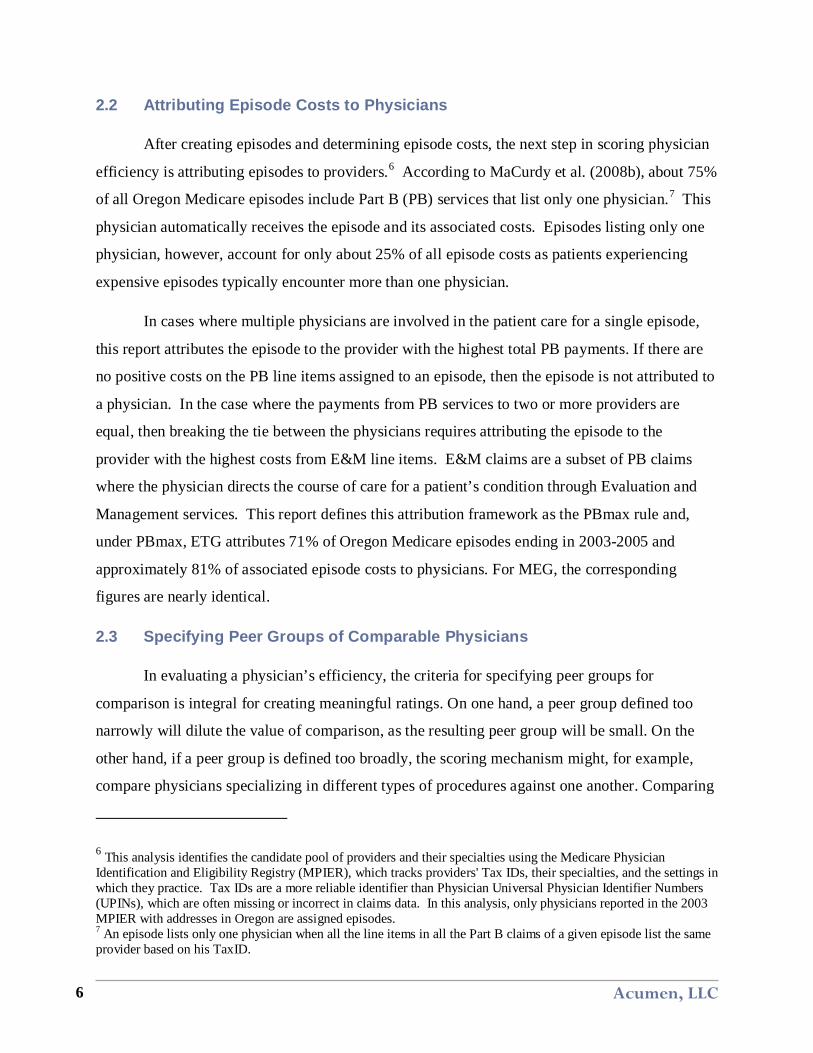
2.2 Attributing Episode Costs to Physicians
After creating episodes and determining episode costs, the next step in scoring physician
efficiency is attributing episodes to providers.6 According to MaCurdy et al. (2008b), about 75%
of all Oregon Medicare episodes include Part B (PB) services that list only one physician.7 This
physician automatically receives the episode and its associated costs. Episodes listing only one
physician, however, account for only about 25% of all episode costs as patients experiencing
expensive episodes typically encounter more than one physician.
In cases where multiple physicians are involved in the patient care for a single episode,
this report attributes the episode to the provider with the highest total PB payments. If there are
no positive costs on the PB line items assigned to an episode, then the episode is not attributed to
a physician. In the case where the payments from PB services to two or more providers are
equal, then breaking the tie between the physicians requires attributing the episode to the
provider with the highest costs from E&M line items. E&M claims are a subset of PB claims
where the physician directs the course of care for a patient’s condition through Evaluation and
Management services. This report defines this attribution framework as the PBmax rule and,
under PBmax, ETG attributes 71% of Oregon Medicare episodes ending in 2003-2005 and
approximately 81% of associated episode costs to physicians. For MEG, the corresponding
figures are nearly identical.
2.3 Specifying Peer Groups of Comparable Physicians
In evaluating a physician’s efficiency, the criteria for specifying peer groups for
comparison is integral for creating meaningful ratings. On one hand, a peer group defined too
narrowly will dilute the value of comparison, as the resulting peer group will be small. On the
other hand, if a peer group is defined too broadly, the scoring mechanism might, for example,
compare physicians specializing in different types of procedures against one another. Comparing
Acumen, LLC 6
6 This analysis identifies the candidate pool of providers and their specialties using the Medicare Physician Identification and Eligibility Registry (MPIER), which tracks providers' Tax IDs, their specialties, and the settings in which they practice. Tax IDs are a more reliable identifier than Physician Universal Physician Identifier Numbers (UPINs), which are often missing or incorrect in claims data. In this analysis, only physicians reported in the 2003 MPIER with addresses in Oregon are assigned episodes. 7 An episode lists only one physician when all the line items in all the Part B claims of a given episode list the same provider based on his TaxID.

one physician to another of a different specialty in many circumstances will provide an unfair
comparison for the physician in the more ‘complex’ specialty. This analysis defines peer groups
of providers as physicians in the same specialty who are attributed the same episode type.
Therefore, a peer group potentially exists for every combination of physician specialty and
episode type.
Some potential peer groups, however, may be too small to warrant scoring. For each peer
group, the minimum size of the group in two dimensions is defined by the “cell size rule.” In
addition to giving the minimum number of providers in a specialty treating an episode type, the
cell size rule also dictates the minimum number of episodes of that type per physician. Peer
groups not meeting the cell size restriction are not scored for that episode type. This report uses
the form ME-MP where:
ME = [minimum number of episodes of same type]; and MP = [minimum number of providers assigned the same episode type].
The majority of the analysis conducted in this report restricts the sample to physicians with at
least 10 peers in the same specialty with at least one episode of the same episode type. The
report refers to this cell size restriction, using the form above, as the 1-10 rule. For example, the
1-10 rule requires there to be at least ten orthopedic surgeons attributed one or more leg fracture
episodes in a given year. If this criterion were not met, orthopedic surgeons would not receive
scores for leg fracture episodes, as too few would be present for comparison. For the sample of
episodes used in this paper, applying the cell size rule reduces the number of episodes by 4% and
the amount of episode costs captured by 14% for both ETG and MEG. The main analysis of this
paper defines the joint specifications of the 1-10 cell size rule and the PBmax attribution rule as
the “baseline specification.” In addition to the cell size rule, a physician must have at least 20
episodes of any kind in both years for the portions of the analysis that compare across years.
2.4 Assigning Efficiency Scores
This report constructs a physician’s overall score by aggregating his episode-specific
physician scores, assessed within the above defined peer groups. MaCurdy et al. (2008b)
introduced this method for scoring. It requires first calculating episode-specific scores showing
relative resource use levels for each of a physician’s attributed episode types. Next, one uses
Acumen, LLC Evaluating the Stability of Physician Efficiency Scores | February 2010 7

these episode-specific scores to construct a cost-weighted overall score for the physician.
Section 2.4.1 describes the construction of episode-specific efficiency scores, and Section 2.4.2
explains the calculation of overall efficiency scores.
2.4.1 Construction of Episode-Specific Scores
For episode-specific scores, each physician receives an annual score based on average
resource use intensity for treating a particular episode type relative to the typical physician in his
specialty for that episode type (i.e., in the physician’s peer group). Prior to the assignment of
scores, episode costs are risk adjusted using the model in MaCurdy et al. (2008b, 2010). This risk
adjustment controls for the influence of patient age/gender, physician specialty, and patient
health conditions for each episode type, with the health conditions measured by the patient’s
CMS HCC risk score used in the calculation of premiums paid in Medicare’s managed care
systems. After risk adjusting episode costs, the next step is to calculate episode-specific
physician scores. Formally, one calculates a physician’s episode-specific efficiency score for
episode type m as follows:
(2.1) 1
1ˆ [ ]
nim
mi im
EpisodeCostEpisodeScoren E EpisodeCost=
= ∑
where n represents the number of episodes of type m attributed to the physician, the quantity
EpisodeCostim represents the risk-adjusted cost of episode i, and is the
expected value of this risk-adjusted cost for providers in the same specialty as physician being
scored. The average in equation (2.1) includes the physician’s episodes of a given type ending
in a particular year.
ˆ [ ]imE EpisodeCost
Episode-specific scores greater than 1.0 imply high cost (low efficiency), whereas scores
less than 1.0 imply low cost (high efficiency). For instance, an orthopedic surgeon with a score
of 1.25 for spinal fracture episodes and 0.9 for hip fracture episodes would have treated spinal
fracture episodes in that year in a manner that was 25% more expensive than the average cost for
spinal fracture episodes based on all physicians in his specialty but treated hip fracture episodes
in a manner 10% less expensive than the average among orthopedic surgeons.
Acumen, LLC 8

2.4.2 Construction of Overall Scores
An overall efficiency score combines the physician’s episode-specific efficiency scores in
a cost-weighted average. Formally, this takes the form:
(2.2)
m mm M
OverallScore W EpisodeScore∈
= ×∑
where M represents the set of episode types for which the provider is scored, and the weight, Wm,
measures the share of type m episodes in the total costs of episodes for which the physician
receives a score.8 Formula (2.2) assigns more weight to episode types that are more costly on
average. In the example of the orthopedic surgeon given above, if spinal fractures cost four
times as much as hip fractures on average, the physician in the example above would have a
2003 overall weighted score of (4/5) *1.25+ (1/5)*0.9=1.18. As described previously, episode-
specific scores are benchmarked against the average cost for an episode within a physician’s
specialty. In contrast, the overall efficiency score is a weighted average of scores each computed
relative to the average for that episode type and the physician’s specialty. In the event that a
physician practices in multiple specialties, he is eligible to receive an overall efficiency score for
each specialty. Therefore, when this report discusses stability in scores, a “physician” refers to
the combination of a Tax ID and physician specialty. The following sections evaluate if
physicians’ overall efficiency scores are stable over time. Of particular interest is whether or not
physicians with high initial scores (indicating low efficiency) are likely to also have high scores
in subsequent years.
8 Formally, Wm = Tm / T where Tm = average total adjusted cost for all episodes of type m per provider in the reference group specialty; and T =∑ Tm. See MaCurdy et al. (2008b) for additional details.
Acumen, LLC Evaluating the Stability of Physician Efficiency Scores | February 2010 9

3 STABILITY OF PHYSICIAN EFFICIENCY SCORES
According to the forthcoming results, episode-based physician efficiency scores are only
moderately stable over time. Assuming physician practice patterns vary minimally, however, a
valid scoring methodology should produce stable scores from year to year. Further, the
physicians identified as the least efficient in one year do not remain so in subsequent years.
These findings may make a pay-for-performance system based on episode groupers difficult to
implement.
The conclusions above are derived from four simple stability metrics. Using four
separate measures presents a complete picture of stability as compared to only one, as each
metric emphasizes different aspects of the movement of physician scores over time. Section 3.1
investigates the correlation of physician scores across years, providing the most general picture.
Section 3.2 looks at the year-to-year overlap of score categorization to provide a more detailed
view of the movements of physician scores. Section 3.3 analyzes the average absolute change in
physician scores. Section 3.4 studies the frequency with which high-cost status physicians
remain ranked as high-cost in subsequent years. Although the first four subsections evaluate
overall physician scores, Section 3.5 examines the stability measures for episode-specific scores.
Both overall physician scores and episode-specific scores display only moderate levels of
stability.
3.1 Correlation of Scores across Years
The correlations of physician scores across years indicate moderate levels of stability.
Table 3.1 displays the correlations calculated using both the single-year spans (2003 to 2004 and
2004 to 2005) and the two-year span (2003 to 2005) for ETG and MEG. As previously stated,
the analysis only considers providers who receive at least 20 attributed episodes of any episode
type in the year.9 The first column of Table 3.1 indicates that the correlation of overall physician
9 For ETG, there are around 3,000 providers who meet this 20 episode minimum in 2003 or 2004. Of these, about 85% of these physicians meet this minimum in both years. Between 2004 and 2005, there are just fewer than 2,900 providers of whom 83% meet the minimum in both years. For MEG, for 2004 and 2005 episodes, there are just over 3,000 providers who meet this 20 episode minimum in 2003 or 2004. Of these, about 84% of these physicians meet this minimum in both years. Between 2004 and 2005, there are just fewer than 2,900 providers of whom 82% meet the minimum in both years. For both groupers, about 73% of physicians scored in 2003, 2004, or 2005 received a score in all three years.
Acumen, LLC 10

scores generated from ETG episodes is between 0.53 and 0.60 for the single-year intervals. The
corresponding figures for MEG are both 0.46.
Compared to correlations based on the level of episode costs, computing correlations
based on a logarithmic measure of episode costs noticeably increases all of the correlation
coefficients. Table 3.1 shows that the correlations increase by at least 0.10 for both groupers
across all three time spans. Using a similar but not identical methodology employing logged
scores, Houchens et al. (2009) observed even higher levels of score stability across years.10 The
stated goal of using logarithms is to reduce the influence of high-cost outliers when calculating
physician scores, as the logarithm transformation reduces the magnitude of such outliers relative
to the overall distribution. Regardless, this rationale for using logarithmic measures does not
solve the problem that a fixed change in scores below and above the average score means
something quite different in real (level) costs than in logged costs.
Because the upper tail of the score distribution has lower levels of stability than the
overall distribution, this report also measures the correlation conditional on a physician having
an overall efficiency score above 1.4 in the initial year. There is no restriction on the range of
scores for the second year. The third column of Table 3.1 presents these results. Scores that are
above 1.4 in the first year generally account for 10% to 15% of all overall scores. Comparing the
first and third columns of Table 3.1, the correlations consistently drop when moving from the
full score range to the upper (high-cost) range. These decreases demonstrate that the scores of
low-efficiency physicians are less stable than scores of the physician population as a whole.
Acumen, LLC Evaluating the Stability of Physician Efficiency Scores | February 2010 11
10 The correlation of the log scores in Table 3.1 corresponds to the correlation of ln(Xt) and ln(Xt+1), where Xt is the physician’s score. Houchens et al. (2009) calculate the correlation of the quantities Σ i,t ln ( Yi,t / E(Yi,t) ), which redefine the score metric. In addition, Houchens et al. (2009) drops the top and bottom 1% costliest episodes of each type. Using this method, they estimate correlations in the range 0.87-0.89. Replicating the method used in Houchens et. al (2009) with the data used in this report, the observed correlations are 0.81 for ETG and 0.83 for MEG.

Table 3.1: Correlation of Physician Scores (Overall Scores)
Grouper Years Correlation of
Scores (Full Score Range)
Correlation of Log Scores
(Full Score Range)
Correlation of Scores (Scores >1.4
in First Year)
ETG 2003/2004 0.60 0.70 0.38 2004/2005 0.53 0.69 0.45 2003/2005 0.48 0.64 0.28
MEG 2003/2004 0.46 0.71 0.28 2004/2005 0.46 0.71 0.35 2003/2005 0.47 0.65 0.31
3.2 Stability in Score Categorization
Although the correlation measure supports moderate stability, evaluating how a
physician’s score category changes over time reveals lower stability levels. The following
analysis of physician movement across categories presents a more detailed, nuanced picture of
stability. Section 3.2.1 describes the structure of the tables and presents the category changes
between 2003 and 2004. Section 3.2.2 presents these tables for 2004 and 2005, which show
similar results.
3.2.1 Stability between 2003 and 2004
This section examines score category differences between 2003 and 2004. A score
greater than one implies that the physician is relatively inefficient, or that he has above-average
costs for the episode types he treats compared to his peers. Table 3.2 shows ETG scores divided
into eight brackets for 2003 and 2004. This cross-tabulation presents each possible score
category combination between the two years and the percentage of providers whose scores
follow each sequence.11 Each dark square on the diagonal is shaded for emphasis to highlight the
score sequences with no year-to-year category changes. The dark square in the lower right hand
corner represents the sum of the diagonal; it is the total percentage of providers with no change
in score category. The higher the percentage in this box, the higher the stability of physician
11 Note that a shift across adjacent score categories can represent anywhere from a negligible change in provider resource utilization—which occurs when a provider is on the border between brackets and merely shifts enough to be classified in the next bracket—to nearly a 60 percentage point change in resource utilization—which occurs when a provider moves from one end of a bracket to the opposite end in the next bracket.
Acumen, LLC 12
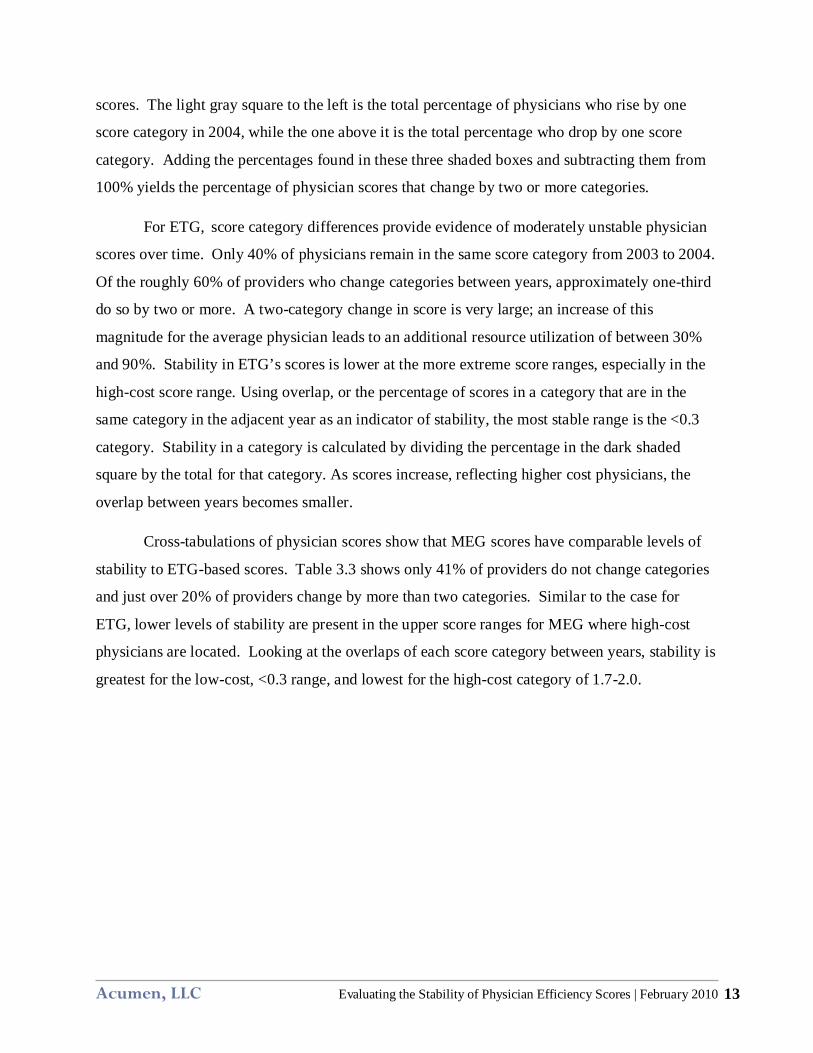
scores. The light gray square to the left is the total percentage of physicians who rise by one
score category in 2004, while the one above it is the total percentage who drop by one score
category. Adding the percentages found in these three shaded boxes and subtracting them from
100% yields the percentage of physician scores that change by two or more categories.
For ETG, score category differences provide evidence of moderately unstable physician
scores over time. Only 40% of physicians remain in the same score category from 2003 to 2004.
Of the roughly 60% of providers who change categories between years, approximately one-third
do so by two or more. A two-category change in score is very large; an increase of this
magnitude for the average physician leads to an additional resource utilization of between 30%
and 90%. Stability in ETG’s scores is lower at the more extreme score ranges, especially in the
high-cost score range. Using overlap, or the percentage of scores in a category that are in the
same category in the adjacent year as an indicator of stability, the most stable range is the <0.3
category. Stability in a category is calculated by dividing the percentage in the dark shaded
square by the total for that category. As scores increase, reflecting higher cost physicians, the
overlap between years becomes smaller.
Cross-tabulations of physician scores show that MEG scores have comparable levels of
stability to ETG-based scores. Table 3.3 shows only 41% of providers do not change categories
and just over 20% of providers change by more than two categories. Similar to the case for
ETG, lower levels of stability are present in the upper score ranges for MEG where high-cost
physicians are located. Looking at the overlaps of each score category between years, stability is
greatest for the low-cost, <0.3 range, and lowest for the high-cost category of 1.7-2.0.
Acumen, LLC Evaluating the Stability of Physician Efficiency Scores | February 2010 13

Table 3.2: Cross-Tabulation for ETG 2003-2004
Range of Scores 2003 Physician Scores Totals
<0.3 0.3 - 0.6
0.6 - 0.9
0.9 - 1.1
1.1 - 1.4
1.4 - 1.7
1.7 - 2.0 >2.0 % # Diag.
2004 Physician
Scores
<0.3 2.5% 1.5% 0.5% 0.1% 0.1% 0.0% 0.0% 0.0% 4.7% 122
0.3 - 0.6 1.3% 8.1% 5.8% 1.5% 0.7% 0.3% 0.0% 0.1% 17.8% 463 0.6 - 0.9 0.2% 6.2% 16.6% 7.0% 2.9% 0.8% 0.3% 0.4% 34.4% 896
0.9 - 1.1 0.0% 1.2% 5.8% 5.7% 3.3% 0.9% 0.3% 0.3% 17.5% 455
1.1 - 1.4 0.2% 0.7% 2.8% 2.7% 4.0% 2.0% 0.5% 0.3% 13.2% 344 1.4 - 1.7 0.0% 0.1% 0.8% 0.8% 1.7% 1.1% 0.5% 0.4% 5.5% 144 1.7 - 2.0 0.0% 0.2% 0.4% 0.3% 0.6% 0.6% 0.4% 0.5% 3.0% 77
>2.0 0.0% 0.2% 0.3% 0.2% 0.4% 0.3% 0.4% 2.0% 3.9% 101
Totals % 4.2% 18.2% 33.0% 18.4% 13.6% 6.0% 2.5% 4.1% 100.0% -- # 109 474 859 478 355 157 64 106 -- 2,602 21%
Diag. 19% 40%
Table 3.3: Cross-Tabulation for MEG 2003-2004
Range of Scores 2003 Physician Scores Totals
<0.3 0.3 - 0.6
0.6 - 0.9
0.9 - 1.1
1.1 - 1.4
1.4 - 1.7
1.7 - 2.0 >2.0 % # Diag.
2004 Physician
Scores
<0.3 2.7% 1.3% 0.4% 0.2% 0.1% 0.0% 0.0% 0.0% 4.8% 125
0.3 - 0.6 1.1% 9.0% 6.2% 1.2% 0.8% 0.2% 0.1% 0.2% 18.9% 488 0.6 - 0.9 0.2% 4.8% 15.2% 5.0% 3.0% 1.1% 0.4% 0.2% 30.0% 775 0.9 - 1.1 0.1% 1.2% 5.3% 4.3% 3.8% 1.1% 0.3% 0.2% 16.3% 422 1.1 - 1.4 0.0% 1.0% 2.8% 2.7% 4.5% 1.9% 0.5% 0.6% 14.2% 366
1.4 - 1.7 0.0% 0.3% 0.8% 1.2% 1.6% 1.2% 0.5% 0.7% 6.2% 161 1.7 - 2.0 0.0% 0.1% 0.2% 0.2% 0.5% 0.5% 0.4% 0.5% 2.4% 63
>2.0 0.0% 0.2% 0.5% 0.6% 0.8% 0.8% 0.9% 3.3% 7.0% 182
Totals % 4.2% 17.9% 31.6% 15.5% 15.1% 6.8% 3.2% 5.8% 100.0% --
# 108 461 815 399 391 176 83 149 -- 2,582 19%
Diag. 17% 41%
Acumen, LLC 14

3.2.2 Stability between 2004 and 2005
The results for 2004-2005 are nearly identical to those for 2003-2004. Table 3.4 shows
score category stability between 2004 and 2005 for ETG. The total percentage of providers who
do not change score category is 41%. Of those who do change, roughly one-third change by two
or more categories. The distribution of scores across categories is approximately the same in
2005 as in 2003 and 2004, as is the stability by category. Scores also remain more stable in the
middle ranges than the higher ranges, which display more movement.
Table 3.5 shows physician scores for MEG from 2004 to 2005. The distribution and
stability of scores in 2004-2005 does not change considerably from the statistics for 2003-2004;
stability remains moderately low. Only 42% of physician scores remained in the same category
across both years. Similar to the results for ETG, stability is highest in the middle ranges for
MEG scores.
Table 3.4: Cross-Tabulation for ETG 2004-2005
Range of Scores 2004 Physician Scores Totals
<0.3 0.3 - 0.6
0.6 - 0.9
0.9 - 1.1
1.1 - 1.4
1.4 - 1.7
1.7 - 2.0 >2.0 % # Diag.
2005 Physician
Scores
<0.3 2.6% 1.7% 0.5% 0.1% 0.0% 0.0% 0.0% 0.0% 5.0% 118 0.3 - 0.6 1.3% 8.3% 7.1% 1.6% 0.6% 0.3% 0.1% 0.1% 19.5% 462 0.6 - 0.9 0.3% 5.9% 16.8% 5.8% 2.4% 0.8% 0.3% 0.3% 32.7% 777 0.9 - 1.1 0.0% 0.8% 5.8% 6.0% 3.3% 1.1% 0.2% 0.2% 17.3% 411 1.1 - 1.4 0.1% 0.5% 2.2% 3.0% 4.5% 1.1% 0.4% 0.4% 12.2% 289 1.4 - 1.7 0.0% 0.3% 1.0% 0.9% 1.5% 1.1% 0.9% 0.4% 5.9% 141 1.7 - 2.0 0.0% 0.1% 0.7% 0.2% 0.3% 0.6% 0.6% 0.5% 3.1% 73
>2.0 0.0% 0.2% 0.4% 0.3% 0.6% 0.7% 0.5% 1.6% 4.3% 102
Totals % 4.4% 17.7% 34.5% 18.0% 13.3% 5.6% 2.9% 3.6% 100.0% -- # 104 420 819 427 316 132 70 85 -- 2,373 20%
Diag.
19% 41%
Acumen, LLC Evaluating the Stability of Physician Efficiency Scores | February 2010 15

Table 3.5: Cross-Tabulation for MEG 2004-2005
Range of Scores 2004 Physician Scores Totals
<0.3 0.3 - 0.6
0.6 - 0.9
0.9 - 1.1
1.1 - 1.4
1.4 - 1.7
1.7 - 2.0 >2.0 % # Diag.
2005 Physician
Scores
<0.3 2.8% 1.5% 0.4% 0.0% 0.1% 0.0% 0.0% 0.0% 4.9% 115 0.3 - 0.6 1.0% 9.7% 6.1% 1.2% 0.6% 0.3% 0.1% 0.2% 19.1% 451 0.6 - 0.9 0.4% 5.5% 15.0% 5.2% 3.3% 0.9% 0.2% 0.4% 30.9% 729 0.9 - 1.1 0.2% 1.0% 4.4% 5.0% 3.1% 1.1% 0.1% 0.4% 15.3% 361 1.1 - 1.4 0.0% 0.7% 2.5% 3.4% 3.9% 1.2% 0.6% 0.5% 12.9% 305 1.4 - 1.7 0.0% 0.3% 1.1% 0.8% 1.5% 1.7% 0.3% 0.6% 6.4% 150 1.7 - 2.0 0.0% 0.2% 0.6% 0.4% 0.6% 0.6% 0.4% 0.9% 3.7% 87
>2.0 0.0% 0.2% 0.8% 0.6% 0.8% 0.7% 0.5% 3.2% 6.9% 162
Totals % 4.5% 19.2% 30.8% 16.6% 13.9% 6.5% 2.3% 6.3% 100.0
% -- # 106 452 726 392 328 153 54 149 -- 2,360 18%
Diag.
17% 42%
3.3 Magnitude of Score Changes between Years
The absolute change in physician efficiency scores between years is another metric that
fails to show high stability levels. Both the mean absolute score change and the distribution of
these differences demonstrate this point. As shown in Table 3.6, the mean change in score is
0.29 for ETG and 0.38 for MEG. For a physician with a score of 1.0 (the average provider), an
increase of 0.29 would indicate a 29% increase in resource utilization. The changes across years
tend to be higher for MEG than for ETG.
Table 3.6: Mean Absolute Score Changes 2003-2005
Grouper Years Mean Absolute Score Change
ETG 2003/2004 0.29 2004/2005 0.29 2003/2005 0.32
MEG 2003/2004 0.38 2004/2005 0.37 2003/2005 0.39
The distribution of absolute score differences illustrates the extent to which scores change
between years. Figure 3.1 displays the full distributions of differences between 2003-2004 and
Acumen, LLC 16
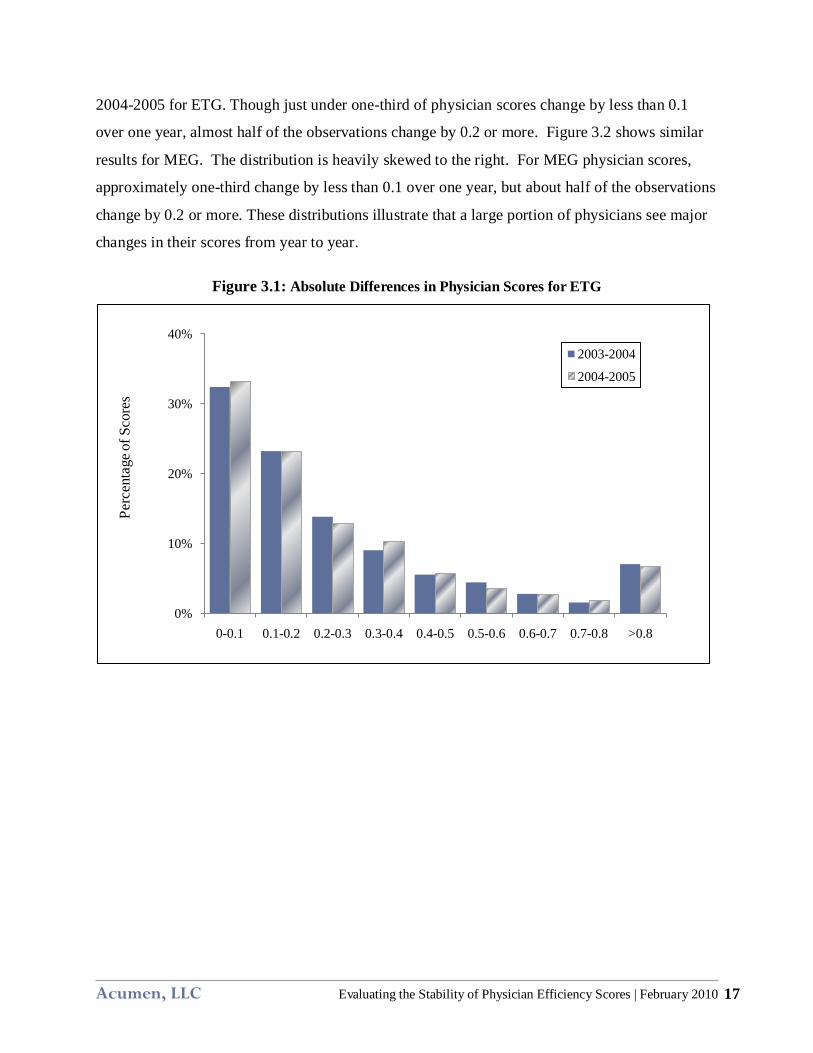
2004-2005 for ETG. Though just under one-third of physician scores change by less than 0.1
over one year, almost half of the observations change by 0.2 or more. Figure 3.2 shows similar
results for MEG. The distribution is heavily skewed to the right. For MEG physician scores,
approximately one-third change by less than 0.1 over one year, but about half of the observations
change by 0.2 or more. These distributions illustrate that a large portion of physicians see major
changes in their scores from year to year.
Figure 3.1: Absolute Differences in Physician Scores for ETG
0%
10%
20%
30%
40%
0-0.1 0.1-0.2 0.2-0.3 0.3-0.4 0.4-0.5 0.5-0.6 0.6-0.7 0.7-0.8 >0.8
2003-2004
2004-2005
Perc
enta
geof
Sco
res
Acumen, LLC Evaluating the Stability of Physician Efficiency Scores | February 2010 17

Figure 3.2: Absolute Differences in Physician Scores for MEG
0%
10%
20%
30%
40%
0-0.1 0.1-0.2 0.2-0.3 0.3-0.4 0.4-0.5 0.5-0.6 0.6-0.7 0.7-0.8 >0.8
2003-2004
2004-2005
Perc
enta
geof
Sco
res
3.4 Stability of Highest-Cost Physicians
This section demonstrates that the scores of the highest cost physicians have similar
levels of stability to the full sample of physicians. To evaluate high-cost physician stability, this
analysis calculates the probability that a physician is considered high cost in one year given that
he is categorized as high cost in the previous year. A high-cost physician is defined as one with
a score in the top five percentiles of the score range.12 The stability of these high-cost physicians
is of particular interest in pay-for-performance due to their disproportionate impact on Medicare
costs. The low overlap in the classification of physicians as high cost between years makes it
difficult to correctly identify providers who disproportionately drive up Medicare costs.
12 The analysis also examines a definition of outlier providers as those in the top 10 percentiles. For, ETG, 50% of individuals ranked in the highest-cost 10 percentiles were ranked as such the subsequent year (i.e., 2003/2004 and 2004/2005). For MEG, this figure was 53%. The probability that a physician ranked in the top 10 percentiles in 2003 was ranked as such in the subsequent two years was 36% for ETG and 38% for MEG. In addition, we conducted an analysis of the top 20% of scores. Under this outlier definition, all one-year overlaps in outlier status for both groupers were 57%, except the ETG 2003-2004 overlap, which was 56%. The probability that a physician ranked in the top 20 percentiles in 2003 was ranked as such in the subsequent two years was 41% for ETG and 43% for MEG.
Acumen, LLC 18

Table 3.7 shows the year-to-year overlap for 2003-2004 and 2004-2005 using the highest
cost five percentiles to define high-cost status. As with previous statistics applying to changes
across years, providers evaluated in this table must have a minimum of 20 episodes overall in
each year. The top panel of the table shows the persistence of classification as outliers for ETG.
The first two rows show the percentage of physicians classified as high cost in the first year that
also have that same categorization in the second year. The third row shows the percentage of
2003 high-cost providers that also fall in that category in both 2004 and 2005. The second panel
follows the same structure for MEG.
For both groupers, the single year overlap in high-cost provider categorization for overall
scores is 40-48%. Looking at outlier providers in 2003 who are also outliers in 2004 and 2005,
stability drops to only 29-30%. Consequently, regardless of the grouper considered, less than
half of high-cost physicians remain classified in this category in subsequent years.
Evaluating the stability of the highest-cost providers using a score threshold rather than a
percentile rank yields similar results. The cross-tabulations in Section 3.2 provide the data for
calculating the percentage of scores above a chosen threshold. Unlike a percentile criterion,
using a threshold evaluates a physician’s relative performance independent of his ranking.
Therefore, if the variance of the distribution increases, the threshold criterion will identify more
outliers than the percentile method. Using an overall score equal to or above 1.4 as the range for
identifying outliers, 12.6% of ETG scores are outliers in 2003. The percentage of these scores
that are also outliers in 2004 is 49%. For MEG scores, 15.8% are above the 1.4 threshold in
2003. Of these, 56% are also above the 1.4 outlier threshold in 2004. These figures are similar
between 2004 and 2005 for both groupers.
Table 3.7: Stability in Classification as a High-Cost Provider (Overall Scores)
Grouper Years Overlap of High-Cost Classification Between Years
ETG 2003/2004 48% (63/131) 2004/2005 40% (47/118)
2003/2004/2005 31% (35/113)
MEG 2003/2004 45% (59/130) 2004/2005 43% (51/118)
2003/2004/2005 29% (33/113)
Acumen, LLC Evaluating the Stability of Physician Efficiency Scores | February 2010 19

3.5 Stability of Episode-Specific Scores
The degree of score stability is measurable on two levels: overall physician scores and
episode-specific physician scores. Although physician overall scores are relevant in a pay-for-
performance system, providers must also know in which episode types they have the most room
for improvement. Further, episode-specific scores give more information about physician
performance from year to year. For instance, a physician in one year might be a high-cost
provider for episode type A and a low-cost provider for episode type B, with an overall score
falling into a moderate range. In the next year, this physician might instead be high-cost for B
and a low-cost for A, with again an overall score in the moderate range. Clearly, the overall
score can obscure significant changes in episode-specific performance.
The following discussion summarizes stability results associated with episode-specific
scores. As seen in formula (2.2), a provider’s composite score is a cost-weighted average of
their episode-specific scores. A physician receives one episode-specific score for each episode
type (e.g., hip fracture, diabetes, lung infection). Otherwise, the methodology for calculating
stability is identical for composite and episode-specific scores. The discussion below describes
stability results associated with two formulations. Section 3.5.1 examines episode-specific
scores assigned without imposing any minimum count for the number of attributed episodes
needed within the episode type to receive a score. Section 3.5.2 requires physicians to have at
least 10 attributed episodes of a given type to be assigned a score for that episode type.
3.5.1 Stability with No Minimum Episode Count
Without an episode minimum to receive a score, Table 3.8 shows little stability in
episode-specific scores across years. Correlations drop dramatically compared to results for the
overall scores. The one-year correlations of episode-specific physician scores are 0.16 or below
for both ETG and MEG. Although not reported in the table, the correlation between 2003 and
2005 is below 0.10 for both groupers. The other three measures also indicate low stability in
episode-specific scores. For both ETG and MEG-based scores, there is less than a one in four
chance that a provider classified as high cost in one year will be identified as such in the
subsequent year.
Acumen, LLC 20

One reason for low levels of stability in episode-specific physician scores is that
providers with only a single episode in a type may receive a score for that type. Such episode-
specific scores tend to be more variable over time because they are based on fewer observations.
Thus, including them increases the variability of physician scores across years. To mitigate the
impact of volatile scores from physicians with few observations each year, the next section
examines episode-specific stability after imposing a minimum episode count requirement for
receiving an episode-specific score.
Table 3.8: Stability Measures for Physician Scores (Episode-Specific Scores)
No Minimum Episode Requirement
Stability Measure Grouper One-year Stability
Correlation of physician scores ETG 0.12-0.13 MEG 0.16
Persistence of score bracket categorization ETG 29-30% MEG 32%
Absolute changes in physician scores13 ETG 0.91-0.92 MEG 0.96-0.97
Persistence of high-cost status ETG 19-20% MEG 21-22%
3.5.2 Stability with a Minimum Episode Count
Requiring physicians to have a minimum of ten episodes of a given type to receive an
episode-specific score increases stability to more moderate levels. The requirement of 10
episodes per type is in addition to the requirement already in place that physicians must have 20
episodes of any type in order to qualify for scoring. The requirement that physicians have a
minimum of 20 episodes is maintained so that no physicians who are counted in the episode-
specific scores are omitted from the overall stability score analysis.
13 These average absolute score changes are skewed by some very large changes in physician scores. However, the median absolute score change is still 0.34 for ETG and 0.32 for MEG. This is an increase compared to the overall median physician score change of 0.17 for ETG and 0.19 for MEG.
Acumen, LLC Evaluating the Stability of Physician Efficiency Scores | February 2010 21

Episode-specific score stability is almost comparable to the stability of overall physician
scores after the 10 episode minimum is imposed. In Table 3.9, one observes that episode-
specific correlations subject to this minimum increase to a level comparable to the correlations
for overall physician scores. Category changes, absolute changes in the physician score, and the
persistence of high-cost status all exhibit higher levels of stability relative to episode-specific
scores without a minimum. Further, the year-to-year overlap of providers categorized as high-
cost is even higher than for overall physician scores. At first glance, imposing a minimum
episode count greatly mitigates stability problems associated with episode-specific scoring.
Table 3.9: Stability Measures for Physician Scores (Episode-Specific Scores) Minimum of 10 Episodes per Episode Type
Stability Measure Grouper One-year Stability
Correlation of physician scores ETG 0.41-0.45 MEG 0.41-0.42
Changes in physician score category ETG 34% MEG 33-34%
Changes in the actual physician score ETG 0.41-0.42 MEG 0.48
Persistence of high-cost status ETG 51-53% MEG 48-50%
Increasing the minimum episode requirement, however, greatly decreases the number of
providers who receive episode-specific scores in both years. Without a minimum episode
requirement, a physician is dropped from the correlation calculation only if he does not have any
episodes of that episode type for one of the years under consideration. For ETG, there is a 50%
attrition rate for episode-specific scores between 2003 and 2004 or 2004 and 2005. In other
words, applying the episode count restriction eliminates half of all potential episode-specific
scores from the correlation calculation. The attrition rate for MEG is about 55%. For ETG, after
the imposition of the 10 episode minimum rule, 93% of episode-specific physician scores are
dropped between 2003 and 2004. Between 2004 and 2005 this figure is 89%. Similarly for
MEG, 89% of episode-specific scores are dropped between 2003 and 2004 as well as 2004 and
2005. Thus, one faces an unenviable choice of low episode-specific score stability without any
minimum episode requirements or—after the imposition of episode minimums—a moderate
Acumen, LLC 22

level of stability with a large percentage of the episode-specific physician scores removed from
the comparison.
Acumen, LLC Evaluating the Stability of Physician Efficiency Scores | February 2010 23

4 SENSITIVITY ANALYSIS
Stability in scores remains moderate even when the analysis applies different rules to the
treatment of outlier episodes, attribution of episodes to providers, and peer group size. This
validates the previous results by showing that they are not unique to the baseline specification.
Each part of this section examines how stability changes when one of four dimensions—
treatment of extreme observations within episode types, attribution rule, cell size rule, and
selection of provider specialty—changes, holding the other dimensions constant. Sections 4.1
through 4.4 demonstrate that altering specifications along each of these four dimensions does not
materially change the finding of relatively unstable physician efficiency scores.
4.1 Treatment of Outlier Episodes
Since outlier episodes with extremely high costs comprise a disproportionate share of
Medicare costs, their treatment in the stability analysis of physician scores is of particular
importance. The nature of extreme observations is that they can exert a strong influence on a
physician’s score. Even one episode that is extremely expensive relative to other episodes of the
same type can cause a middle or low score range physician to become a high score range
provider. The effect of extreme-cost episodes on scores on the aggregate is increased variability,
which may increase the deviation of calculated scores from actual physician efficiency. The
increased variability that these extreme values cause could decrease the stability of scores over
time.
Removing the highest and lowest cost episodes within episode types, however, has only a
very small effect on stability. Table 4.1 depicts stability across a variety of sampling
specifications for ETG scores. The first column shows what percentage of physician scores
remain in the same category whereas the next two columns show the percentage of physician
scores that change by one category or by two or more categories, respectively. The table is also
broken into panels which identify which specification change is being examined. The first panel
represents the specifications used in the analysis in Section 3 and the next four panels show the
specification changes for the treatment of extreme observations, attribution rule, cell size rule,
and physician specialties analyzed, respectively. Table 4.2 follows the same structure but shows
Acumen, LLC 24

results for the MEG grouper. Full versions of the cross-tabulations for each of the specifications
are available in Appendix A.
The second panel of Table 4.1 shows that the effects of removing outlier episodes for
each episode type are minimal for 2003-2004 ETG scores. The episodes that are removed are
the top and bottom 1% of episodes on the cost distribution for a given episode type. For the
sample used in this paper, removing the top and bottom 1% of episodes results in the omission of
19% of episode costs in each year for both groupers. The change has no noticeable effect; the
total overlap in score categories between years still remains at around 40% and the percentage of
scores changing by one and two categories remains approximately the same. Additionally, the
table demonstrates that removing extreme observations also has minimal effects on 2004-2005
scores, which show similar statistics for stability. Table 4.2 shows similar results for MEG.
There is little to no change in the percentages of scores remaining in the same category, changing
by one category, or changing by two or more categories when extreme values are removed. This
is true for both sets of years (2003/2004 and 2004/2005).
The analysis additionally examines an alternative method for dealing with outliers: top-
coding, or Winsorizing, the highest and lowest-cost episodes within each type by setting them
equal to the minimum and maximum threshold values at the 1st and 99th percentiles rather than
excluding them altogether. The tables for this assessment are not included, as the results are
similar to those shown in Tables 4.1 and 4.2.
Table 4.1: Stability across Specifications for ETG
Sensitivity Analysis Change Comparison Years
% Remaining in the Same Category
% Changing +/- 1
Category
% Changing +/- 2 or More
Categories
Baseline 2003 / 2004 40% 40% 20% 2004 / 2005 41% 39% 20%
Treatment of Extreme Observations 2003 / 2004 41% 40% 19% 2004 / 2005 41% 40% 19%
Attribution Rule 2003 / 2004 37% 39% 24% 2004 / 2005 34% 42% 24%
Cell Size Rule 2003 / 2004 43% 41% 16% 2004 / 2005 45% 38% 17%
Internal Medicine, Family Practice, General Practice Only
2003 / 2004 38% 41% 21% 2004 / 2005 39% 40% 21%
Acumen, LLC Evaluating the Stability of Physician Efficiency Scores | February 2010 25
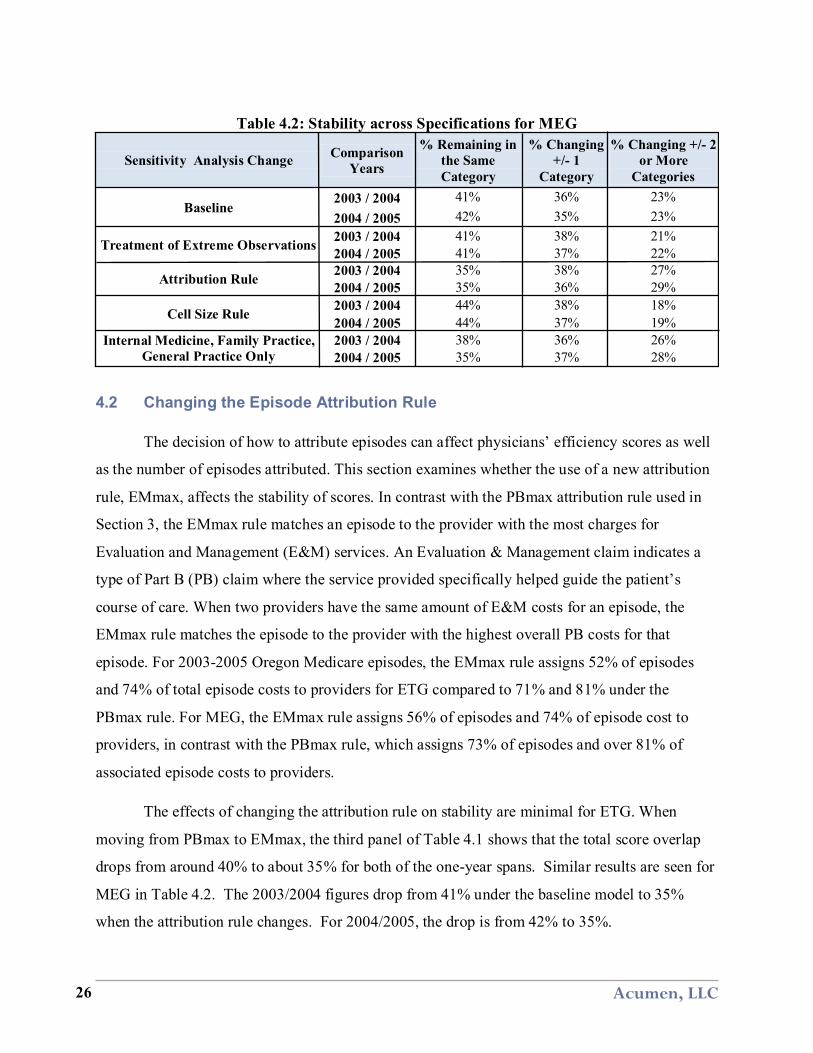
Table 4.2: Stability across Specifications for MEG
Sensitivity Analysis Change Comparison Years
% Remaining in the Same Category
% Changing +/- 1
Category
% Changing +/- 2 or More
Categories
Baseline 2003 / 2004 41% 36% 23% 2004 / 2005 42% 35% 23%
Treatment of Extreme Observations 2003 / 2004 41% 38% 21% 2004 / 2005 41% 37% 22%
Attribution Rule 2003 / 2004 35% 38% 27% 2004 / 2005 35% 36% 29%
Cell Size Rule 2003 / 2004 44% 38% 18% 2004 / 2005 44% 37% 19%
Internal Medicine, Family Practice, General Practice Only
2003 / 2004 38% 36% 26% 2004 / 2005 35% 37% 28%
4.2 Changing the Episode Attribution Rule
The decision of how to attribute episodes can affect physicians’ efficiency scores as well
as the number of episodes attributed. This section examines whether the use of a new attribution
rule, EMmax, affects the stability of scores. In contrast with the PBmax attribution rule used in
Section 3, the EMmax rule matches an episode to the provider with the most charges for
Evaluation and Management (E&M) services. An Evaluation & Management claim indicates a
type of Part B (PB) claim where the service provided specifically helped guide the patient’s
course of care. When two providers have the same amount of E&M costs for an episode, the
EMmax rule matches the episode to the provider with the highest overall PB costs for that
episode. For 2003-2005 Oregon Medicare episodes, the EMmax rule assigns 52% of episodes
and 74% of total episode costs to providers for ETG compared to 71% and 81% under the
PBmax rule. For MEG, the EMmax rule assigns 56% of episodes and 74% of episode cost to
providers, in contrast with the PBmax rule, which assigns 73% of episodes and over 81% of
associated episode costs to providers.
The effects of changing the attribution rule on stability are minimal for ETG. When
moving from PBmax to EMmax, the third panel of Table 4.1 shows that the total score overlap
drops from around 40% to about 35% for both of the one-year spans. Similar results are seen for
MEG in Table 4.2. The 2003/2004 figures drop from 41% under the baseline model to 35%
when the attribution rule changes. For 2004/2005, the drop is from 42% to 35%.
Acumen, LLC 26

The minor changes in stability can partially be explained by the much smaller sample of
attributed episodes and providers obtained using EMmax. MedPAC’s report on MEG-based
physician score stability (Houchens et al., 2009) attributed episodes using a variation on EMmax,
whereby providers had to have at least 35% of E&M claims rather than simply the plurality.
Using this method, MedPAC reported a rate of 72-78% attribution of complete episodes,
representing 76-80% of claims and 66-76% of payments.
4.3 Raising the Minimum Episode Count per Provider for Each Episode Type
When comparing physicians for efficiency, the choice of cell size rule changes the
number of providers eligible to be scored as well as the stability of these scores. While Section 3
uses the 1-10 cell size rule, the fourth panels in Tables 4.1 and 4.2 show the effects on stability
between 2003 and 2004 for ETG and MEG, respectively, of using the stricter 10-10 rule. The 10-
10 rule requires that the 10 providers of the same specialty are attributed a minimum of 10 episodes
of the type under consideration, as opposed to just one. The 10-10 rule restricts the sample by
dropping of 40% of episodes and half of payments for ETG. For MEG, moving to the 10-10 rule
means dropping 27% of episodes and 38% of payments. Even though this rule decreases the
number of providers receiving scores relative to the 1-10 rule, it also likely provides a more
representative profile of each physician’s practice.
The fourth panel of Table 4.1 shows that there is a slight increase in stability for 2003-
2004 ETG scores with the use of the stricter cell size rule. Making the cell size rule more
restrictive, (i.e., imposing a minimum number of episodes of the same type that providers in the
same specialty are required to have), does not eliminate the instability shown in the previous
sections. The overall overlap between score categories is still slightly over 40% for both
groupers. This is also true for the 2004-2005 data. However, the new cell size rule has an effect
on the number of episodes included for comparison, cutting it by almost a half. In contrast to the
10-10 rule, the minimum cell size rule that Houchens et al. (2009) use when evaluating MEG-
based physician efficiency score stability is equivalent to a 1-1 rule with a 20 episode minimum
for each provider. This specification, which only required that providers each have at least 20
episodes of any type, did not specify a minimum number of providers in a specialty. It also did
not specify that providers in a peer group had to be attributed a minimum number of episodes of
the same type to be compared.
Acumen, LLC Evaluating the Stability of Physician Efficiency Scores | February 2010 27

4.4 Narrowing the Selection of Provider Specialties
As certain types of providers account for greater shares of Medicare costs, the selection
of provider specialties warrants consideration. It is important to identify whether or not scores
are noticeably more or less stable for the types of providers most costly to Medicare. For
instance, not all providers are physicians. Including all specialties allows for the inclusion of
providers such as nurses, nutritionists, chiropractors, etc. (although not all these providers use
E&M codes and, therefore, would not be assigned attribution under the EMmax rule). Therefore,
this sensitivity analysis also examines stability statistics for two restricted categories of provider
specialties: (1) medical doctors only,14 and (2) internal medicine, family practice, and general
practice doctors only.
Restricting by provider specialty in both cases actually decreases stability slightly. The
last panels of Tables 4.1 and 4.2 show that score stability using only internal medicine, family
practice, and general practice physicians is almost identical to stability measured using all
provider specialty types. The statistics for the “medical doctors only” category are not included
as the figures for this specification are so similar. The tables show that for the three
aforementioned specialties, the year-to-year overlap in categories slightly drops, decreasing by
anywhere from two to seven percentage points. The cross-tabulations for both “medical doctors
only” and for internal medicine, family practice, and general practice doctors are available in
Appendix A.
Acumen, LLC 28
14 The “medical doctors only” category includes physicians in the following specialties: general practice, general surgery, family practice, gynecology, internal medicine, cardiology, neurosurgery, orthopedic surgery, medical oncology, surgical oncology, and emergency medicine.

5 SUMMARY OF FINDINGS
This report evaluates the extent to which physician efficiency scores based on Medicare
episodes of care remain stable over time. Measuring score stability offers one approach for
validating the feasibility of using episode groupers to identify cost-effective or wasteful
providers in a pay-for-performance system. If physicians’ practice patterns are relatively
stable, then physician efficiency scores should also be stable over time. If, on the other hand,
scores are not stable over time, then the scoring methodology may not be accurately capturing
physicians’ efficiency.
The analysis demonstrates that scores constructed using both Ingenix’s Symmetry
Episode Treatment Groups (ETG) and Thomson Reuters’ Medstat Medical Episode Grouper
(MEG) are only modestly stable from year to year. The report relies on four measures to assess
the stability of physician scores constructed from 2003-2005 Oregon episodes. These include:
year-to-year correlation, year-to-year movements across score categories, average score
difference between years, and overlap in the classification of physicians as high-cost providers.
Specifically, the four measures of stability reveal the following:
• Correlations of scores across years display moderate stability. For ETG, the correlation between adjacent years is 0.60 for 2003 and 2004 and 0.53 for 2004 and 2005. For MEG, the correlation values are slightly lower, at 0.46 for both pairs of adjacent years.
• The year-to-year overlap of physicians’ classifications in score categories suggests a lack of stability. For both ETG and MEG, only about 40% of physicians remain in the same score bracket between one year and the next—each score category generally represents 30 percentage points. Of the physicians who change categories, roughly one-third do so by two or more categories; a two-category change corresponds to between a 30% and a 90% change in physician resource utilization.
• The average absolute changes in physician scores indicate that scores are not very stable. The mean absolute score change across years is 0.27 for ETG scores and 0.33 for MEG. To put this in context, an absolute score change of 0.27 means a 27% increase or decrease in relative utilization.
• High-cost physician identification shows limited stability from year to year. For ETG, the probability a high-cost physician in one year is identified as such in the next year is 40%-48%. For MEG, the corresponding range is 43%-45%. A stability level of 40% implies that 60% of providers classified as being high cost in one year are not classified as such in an adjacent year.
Acumen, LLC Evaluating the Stability of Physician Efficiency Scores | February 2010 29
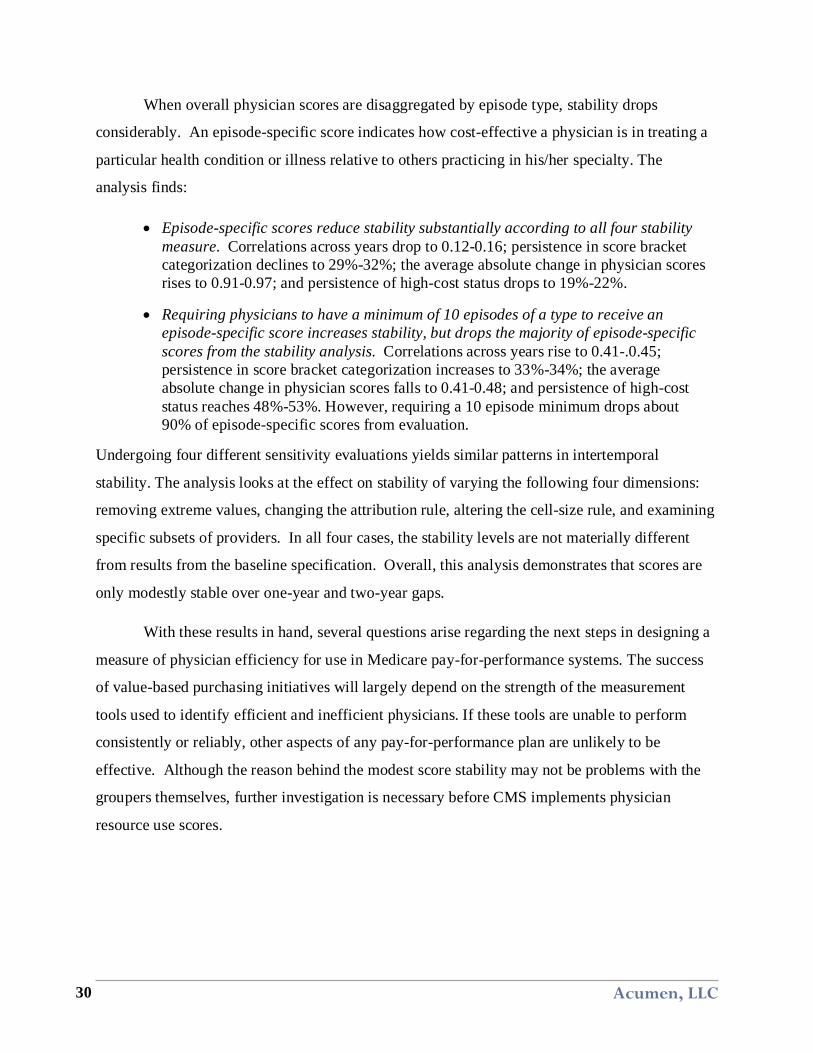
When overall physician scores are disaggregated by episode type, stability drops
considerably. An episode-specific score indicates how cost-effective a physician is in treating a
particular health condition or illness relative to others practicing in his/her specialty. The
analysis finds:
• Episode-specific scores reduce stability substantially according to all four stability measure. Correlations across years drop to 0.12-0.16; persistence in score bracket categorization declines to 29%-32%; the average absolute change in physician scores rises to 0.91-0.97; and persistence of high-cost status drops to 19%-22%.
• Requiring physicians to have a minimum of 10 episodes of a type to receive an episode-specific score increases stability, but drops the majority of episode-specific scores from the stability analysis. Correlations across years rise to 0.41-.0.45; persistence in score bracket categorization increases to 33%-34%; the average absolute change in physician scores falls to 0.41-0.48; and persistence of high-cost status reaches 48%-53%. However, requiring a 10 episode minimum drops about 90% of episode-specific scores from evaluation.
Undergoing four different sensitivity evaluations yields similar patterns in intertemporal
stability. The analysis looks at the effect on stability of varying the following four dimensions:
removing extreme values, changing the attribution rule, altering the cell-size rule, and examining
specific subsets of providers. In all four cases, the stability levels are not materially different
from results from the baseline specification. Overall, this analysis demonstrates that scores are
only modestly stable over one-year and two-year gaps.
With these results in hand, several questions arise regarding the next steps in designing a
measure of physician efficiency for use in Medicare pay-for-performance systems. The success
of value-based purchasing initiatives will largely depend on the strength of the measurement
tools used to identify efficient and inefficient physicians. If these tools are unable to perform
consistently or reliably, other aspects of any pay-for-performance plan are unlikely to be
effective. Although the reason behind the modest score stability may not be problems with the
groupers themselves, further investigation is necessary before CMS implements physician
resource use scores.
Acumen, LLC 30

6 REFERENCES
Government Accountability Office. (April 2007). Medicare: Focus on Physician Practice Patterns Can Lead to Greater Program Efficiency. The United States Government Accountability Office. Internet address: http://www.gao.gov/new.items/d07307.pdf (Accessed 2009.)
Houchens, Robert L., Scott McCracken, William Marder and Robert Kelley. (2009). The Use of an Episode Grouper for Physician Profiling in Medicare: A Preliminary Investigation. Washington, DC: Thomson Healthcare for MedPAC.
Lake, Timothy; Margaret Colby, and Stephanie Peterson. (October 2007). Health Plans' Use of Physician Resource Use and Quality Measures (Submitted to the Medicare Payment Advisory Commission). Mathematica Policy Research, Inc. Internet address: http://www.medpac.gov/documents/6355%20MedPAC%20Final%20Report%20with%20Appendices%201-24-08.pdf (Accessed 2009.)
MaCurdy, Thomas, Elizabeth Hartmann, Maria Ho, Jason Shafrin, Lauren Talbot and Zhihao Zhang. (2010). Challenges in Risk Adjustment of Episode Costs. Burlingame, CA: Acumen, LLC.
MaCurdy, Thomas, Jason Kerwin, Jonathan Gibbs, Eugene Lin, Carolyn Cotterman, Margaret O'Brien-Strain and Nick Theobald. (2008a). Evaluating the Functionality of the Symmetry ETG and Medstat MEG Software in Forming Episodes of Care Using Medicare Data. CMS Report
MaCurdy, Thomas, Nick Theobald, Jason Kerwin, and Ken Ueda. (2008b). Prototype Medicare Resource Utilization Report Based on Episode Groupers. CMS Report
Acumen, LLC Evaluating the Stability of Physician Efficiency Scores | February 2010 31
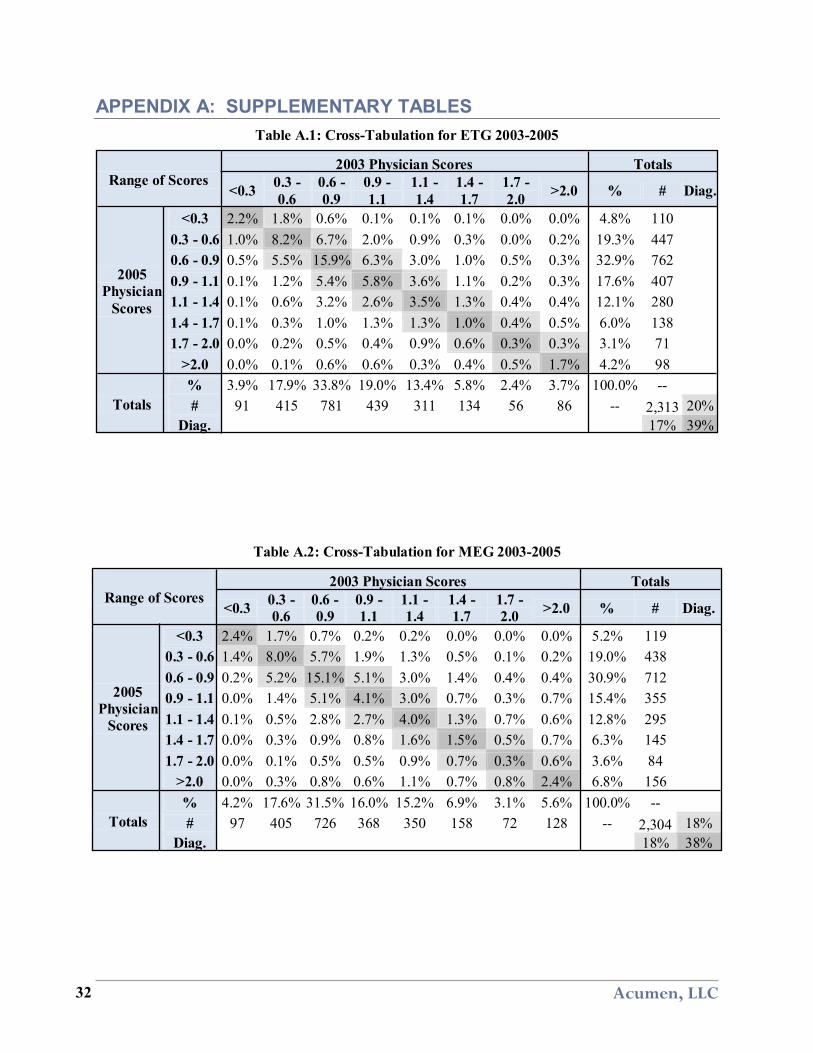
APPENDIX A: SUPPLEMENTARY TABLES Table A.1: Cross-Tabulation for ETG 2003-2005
Range of Scores 2003 Physician Scores Totals
<0.3 0.3 - 0.6
0.6 - 0.9
0.9 - 1.1
1.1 - 1.4
1.4 - 1.7
1.7 - 2.0 >2.0 % # Diag.
2005 Physician
Scores
<0.3 2.2% 1.8% 0.6% 0.1% 0.1% 0.1% 0.0% 0.0% 4.8% 110 0.3 - 0.6 1.0% 8.2% 6.7% 2.0% 0.9% 0.3% 0.0% 0.2% 19.3% 447 0.6 - 0.9 0.5% 5.5% 15.9% 6.3% 3.0% 1.0% 0.5% 0.3% 32.9% 762 0.9 - 1.1 0.1% 1.2% 5.4% 5.8% 3.6% 1.1% 0.2% 0.3% 17.6% 407 1.1 - 1.4 0.1% 0.6% 3.2% 2.6% 3.5% 1.3% 0.4% 0.4% 12.1% 280 1.4 - 1.7 0.1% 0.3% 1.0% 1.3% 1.3% 1.0% 0.4% 0.5% 6.0% 138 1.7 - 2.0 0.0% 0.2% 0.5% 0.4% 0.9% 0.6% 0.3% 0.3% 3.1% 71
>2.0 0.0% 0.1% 0.6% 0.6% 0.3% 0.4% 0.5% 1.7% 4.2% 98
Totals % 3.9% 17.9% 33.8% 19.0% 13.4% 5.8% 2.4% 3.7% 100.0% -- # 91 415 781 439 311 134 56 86 -- 2,313 20%
Diag. 17% 39%
Table A.2: Cross-Tabulation for MEG 2003-2005
Range of Scores 2003 Physician Scores Totals
<0.3 0.3 - 0.6
0.6 - 0.9
0.9 - 1.1
1.1 - 1.4
1.4 - 1.7
1.7 - 2.0 >2.0 % # Diag.
2005 Physician
Scores
<0.3 2.4% 1.7% 0.7% 0.2% 0.2% 0.0% 0.0% 0.0% 5.2% 119 0.3 - 0.6 1.4% 8.0% 5.7% 1.9% 1.3% 0.5% 0.1% 0.2% 19.0% 438 0.6 - 0.9 0.2% 5.2% 15.1% 5.1% 3.0% 1.4% 0.4% 0.4% 30.9% 712 0.9 - 1.1 0.0% 1.4% 5.1% 4.1% 3.0% 0.7% 0.3% 0.7% 15.4% 355 1.1 - 1.4 0.1% 0.5% 2.8% 2.7% 4.0% 1.3% 0.7% 0.6% 12.8% 295 1.4 - 1.7 0.0% 0.3% 0.9% 0.8% 1.6% 1.5% 0.5% 0.7% 6.3% 145 1.7 - 2.0 0.0% 0.1% 0.5% 0.5% 0.9% 0.7% 0.3% 0.6% 3.6% 84
>2.0 0.0% 0.3% 0.8% 0.6% 1.1% 0.7% 0.8% 2.4% 6.8% 156
Totals % 4.2% 17.6% 31.5% 16.0% 15.2% 6.9% 3.1% 5.6% 100.0% -- # 97 405 726 368 350 158 72 128 -- 2,304 18%
Diag. 18% 38%
Acumen, LLC 32
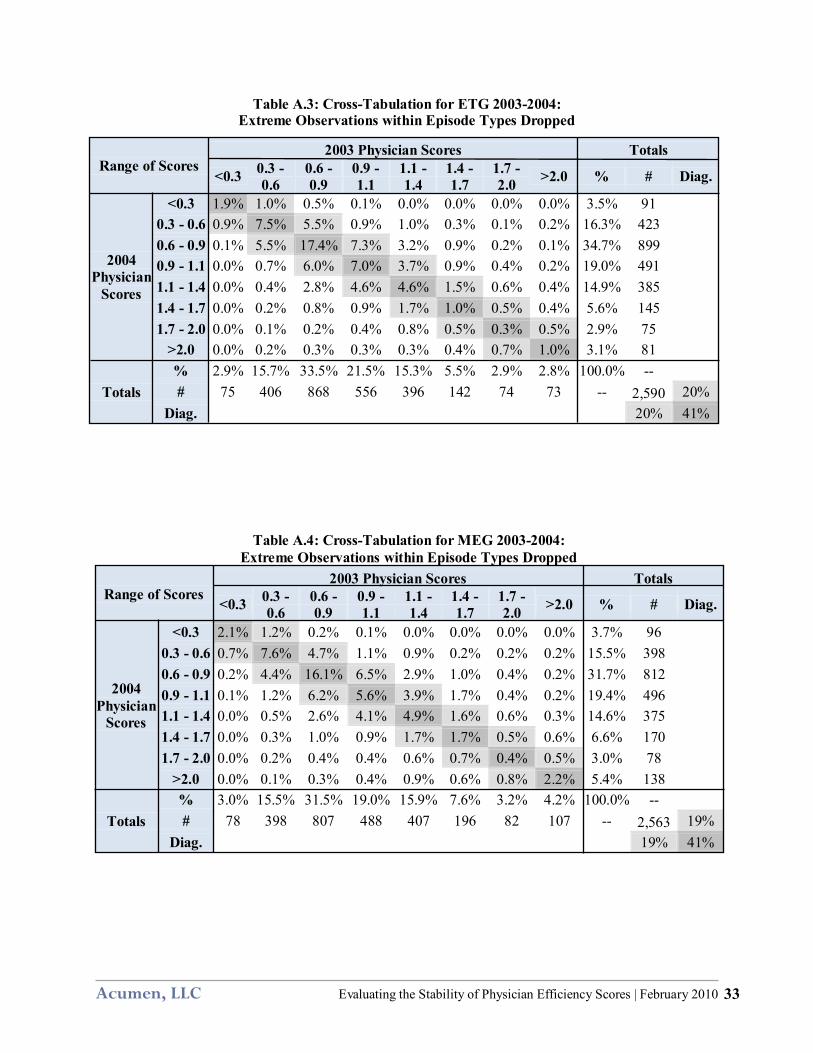
Table A.3: Cross-Tabulation for ETG 2003-2004: Extreme Observations within Episode Types Dropped
Range of Scores 2003 Physician Scores Totals
<0.3 0.3 - 0.6
0.6 - 0.9
0.9 - 1.1
1.1 - 1.4
1.4 - 1.7
1.7 - 2.0 >2.0 % # Diag.
2004 Physician
Scores
<0.3 1.9% 1.0% 0.5% 0.1% 0.0% 0.0% 0.0% 0.0% 3.5% 91 0.3 - 0.6 0.9% 7.5% 5.5% 0.9% 1.0% 0.3% 0.1% 0.2% 16.3% 423 0.6 - 0.9 0.1% 5.5% 17.4% 7.3% 3.2% 0.9% 0.2% 0.1% 34.7% 899 0.9 - 1.1 0.0% 0.7% 6.0% 7.0% 3.7% 0.9% 0.4% 0.2% 19.0% 491 1.1 - 1.4 0.0% 0.4% 2.8% 4.6% 4.6% 1.5% 0.6% 0.4% 14.9% 385 1.4 - 1.7 0.0% 0.2% 0.8% 0.9% 1.7% 1.0% 0.5% 0.4% 5.6% 145 1.7 - 2.0 0.0% 0.1% 0.2% 0.4% 0.8% 0.5% 0.3% 0.5% 2.9% 75
>2.0 0.0% 0.2% 0.3% 0.3% 0.3% 0.4% 0.7% 1.0% 3.1% 81
Totals % 2.9% 15.7% 33.5% 21.5% 15.3% 5.5% 2.9% 2.8% 100.0% -- # 75 406 868 556 396 142 74 73 -- 2,590 20%
Diag. 20% 41%
Table A.4: Cross-Tabulation for MEG 2003-2004:
Extreme Observations within Episode Types Dropped
Range of Scores 2003 Physician Scores Totals
<0.3 0.3 - 0.6
0.6 - 0.9
0.9 - 1.1
1.1 - 1.4
1.4 - 1.7
1.7 - 2.0 >2.0 % # Diag.
2004 Physician
Scores
<0.3 2.1% 1.2% 0.2% 0.1% 0.0% 0.0% 0.0% 0.0% 3.7% 96 0.3 - 0.6 0.7% 7.6% 4.7% 1.1% 0.9% 0.2% 0.2% 0.2% 15.5% 398 0.6 - 0.9 0.2% 4.4% 16.1% 6.5% 2.9% 1.0% 0.4% 0.2% 31.7% 812 0.9 - 1.1 0.1% 1.2% 6.2% 5.6% 3.9% 1.7% 0.4% 0.2% 19.4% 496 1.1 - 1.4 0.0% 0.5% 2.6% 4.1% 4.9% 1.6% 0.6% 0.3% 14.6% 375 1.4 - 1.7 0.0% 0.3% 1.0% 0.9% 1.7% 1.7% 0.5% 0.6% 6.6% 170 1.7 - 2.0 0.0% 0.2% 0.4% 0.4% 0.6% 0.7% 0.4% 0.5% 3.0% 78
>2.0 0.0% 0.1% 0.3% 0.4% 0.9% 0.6% 0.8% 2.2% 5.4% 138
Totals % 3.0% 15.5% 31.5% 19.0% 15.9% 7.6% 3.2% 4.2% 100.0% -- # 78 398 807 488 407 196 82 107 -- 2,563 19%
Diag. 19% 41%
Acumen, LLC Evaluating the Stability of Physician Efficiency Scores | February 2010 33

Table A.5: Cross-Tabulation for ETG 2004-2005: Extreme Observations within Episode Types Dropped
Range of Scores 2004 Physician Scores Totals
<0.3 0.3 - 0.6
0.6 - 0.9
0.9 - 1.1
1.1 - 1.4
1.4 - 1.7
1.7 - 2.0 >2.0 % # Diag.
2005 Physician
Scores
<0.3 1.9% 1.5% 0.4% 0.0% 0.0% 0.0% 0.0% 0.0% 3.8% 90 0.3 - 0.6 0.8% 7.7% 6.1% 1.5% 0.5% 0.1% 0.0% 0.2% 17.0% 401 0.6 - 0.9 0.3% 5.1% 18.2% 6.1% 3.0% 0.7% 0.3% 0.3% 33.8% 800 0.9 - 1.1 0.0% 1.0% 6.6% 6.3% 4.4% 1.1% 0.2% 0.2% 19.7% 466 1.1 - 1.4 0.1% 0.3% 2.7% 3.6% 4.4% 1.6% 0.5% 0.3% 13.4% 318 1.4 - 1.7 0.1% 0.1% 0.9% 1.2% 1.9% 1.1% 0.8% 0.4% 6.5% 154 1.7 - 2.0 0.0% 0.3% 0.3% 0.3% 0.3% 0.5% 0.3% 0.5% 2.5% 58
>2.0 0.0% 0.1% 0.2% 0.2% 0.7% 0.4% 0.5% 1.1% 3.3% 78
Totals % 3.1% 15.9% 35.4% 19.2% 15.3% 5.5% 2.6% 3.0% 100.0% -- # 74 376 838 454 361 130 62 70 -- 2,365 21%
Diag. 19% 41%
Table A.6: Cross-Tabulation for MEG 2004-2005: Extreme Observations within Episode Types Dropped
Range of Scores 2004 Physician Scores Totals
<0.3 0.3 - 0.6
0.6 - 0.9
0.9 - 1.1
1.1 - 1.4
1.4 - 1.7
1.7 - 2.0 >2.0 % # Diag.
2005 Physician
Scores
<0.3 2.0% 1.2% 0.5% 0.0% 0.0% 0.0% 0.0% 0.0% 3.9% 92 0.3 - 0.6 0.9% 7.5% 5.3% 1.4% 0.6% 0.2% 0.1% 0.2% 16.2% 379 0.6 - 0.9 0.4% 4.7% 16.2% 6.1% 3.2% 0.9% 0.3% 0.3% 32.2% 755 0.9 - 1.1 0.2% 0.8% 5.5% 6.4% 3.6% 0.8% 0.3% 0.3% 17.8% 418 1.1 - 1.4 0.0% 0.9% 2.2% 4.0% 4.8% 1.8% 0.6% 0.5% 14.8% 348 1.4 - 1.7 0.0% 0.3% 1.1% 0.8% 1.6% 1.5% 0.5% 0.5% 6.2% 146 1.7 - 2.0 0.0% 0.0% 0.6% 0.4% 0.5% 0.7% 0.5% 0.6% 3.3% 77
>2.0 0.0% 0.2% 0.7% 0.3% 0.8% 0.5% 0.8% 2.2% 5.6% 131
Totals % 3.6% 15.6% 32.1% 19.6% 15.0% 6.4% 3.2% 4.6% 100.0% -- # 85 366 752 459 353 150 74 107 -- 2,346 19%
Diag. 18% 41%
Acumen, LLC 34

Table A.7: Cross-Tabulation for ETG 2003-2004: EMmax Attribution
Range of Scores 2003 Physician Scores Totals
<0.3 0.3 - 0.6
0.6 - 0.9
0.9 - 1.1
1.1 - 1.4
1.4 - 1.7
1.7 - 2.0 >2.0 % # Diag.
2004 Physician
Scores
<0.3 0.9% 1.0% 0.2% 0.1% 0.1% 0.0% 0.1% 0.0% 2.3% 45 0.3 - 0.6 0.9% 6.9% 5.7% 1.9% 1.0% 0.5% 0.1% 0.3% 17.2% 338 0.6 - 0.9 0.3% 5.6% 16.2% 6.5% 2.4% 1.5% 0.6% 0.4% 33.4% 655 0.9 - 1.1 0.1% 1.7% 7.2% 5.7% 3.9% 1.1% 0.4% 0.3% 20.4% 400 1.1 - 1.4 0.1% 0.9% 3.2% 3.5% 4.5% 1.3% 0.7% 0.5% 14.5% 285 1.4 - 1.7 0.0% 0.1% 1.0% 0.8% 1.5% 1.4% 0.3% 0.3% 5.3% 103 1.7 - 2.0 0.0% 0.3% 0.6% 0.3% 0.6% 0.6% 0.5% 0.3% 3.1% 60
>2.0 0.0% 0.3% 0.5% 0.2% 0.7% 0.5% 0.4% 1.3% 3.8% 75
Totals % 2.2% 16.8% 34.5% 19.0% 14.6% 6.8% 2.9% 3.3% 100.0% -- # 43 329 677 372 287 133 56 64 -- 1,961 19%
Diag. 20% 37%
Table A.8: Cross-Tabulation for MEG 2003-2004: EMmax Attribution
Range of Scores 2003 Physician Scores Totals
<0.3 0.3 - 0.6
0.6 - 0.9
0.9 - 1.1
1.1 - 1.4
1.4 - 1.7
1.7 - 2.0 >2.0 % # Diag.
2004 Physician
Scores
<0.3 1.4% 1.1% 0.1% 0.0% 0.2% 0.0% 0.0% 0.1% 2.8% 55 0.3 - 0.6 1.2% 7.8% 5.4% 1.5% 0.9% 0.6% 0.2% 0.3% 17.6% 349 0.6 - 0.9 0.5% 5.5% 13.5% 5.1% 3.2% 1.3% 0.5% 0.5% 30.0% 595 0.9 - 1.1 0.1% 1.7% 6.0% 4.4% 3.2% 1.3% 0.6% 0.4% 17.6% 348 1.1 - 1.4 0.1% 0.9% 3.3% 3.9% 4.1% 2.2% 0.6% 0.6% 15.6% 310 1.4 - 1.7 0.1% 0.4% 0.8% 1.4% 1.9% 1.2% 0.8% 0.4% 6.8% 135 1.7 - 2.0 0.0% 0.4% 0.3% 0.3% 0.5% 0.5% 0.5% 0.6% 3.0% 60
>2.0 0.1% 0.2% 0.7% 0.5% 0.9% 0.9% 0.7% 2.5% 6.5% 129
Totals % 3.2% 17.8% 30.0% 17.1% 14.9% 7.9% 3.8% 5.1% 100.0% -- # 64 353 595 339 296 157 75 102 -- 1,981 18%
Diag. 20% 35%
Acumen, LLC Evaluating the Stability of Physician Efficiency Scores | February 2010 35
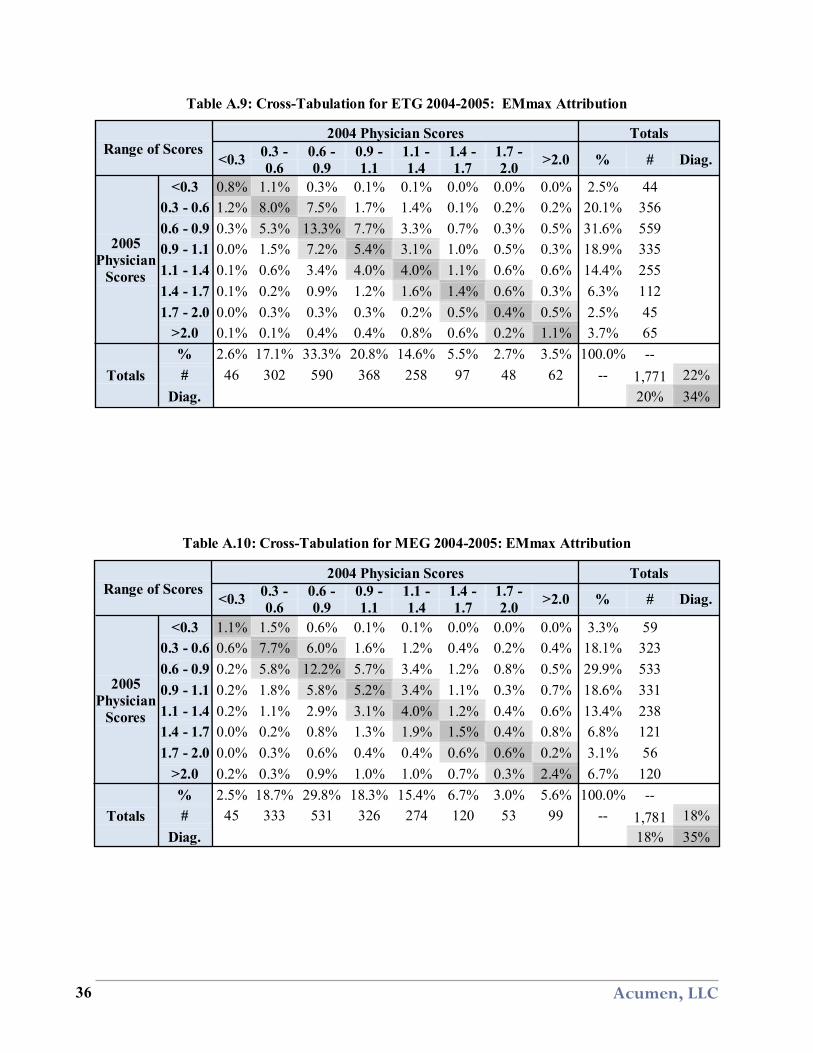
Table A.9: Cross-Tabulation for ETG 2004-2005: EMmax Attribution
Range of Scores 2004 Physician Scores Totals
<0.3 0.3 - 0.6
0.6 - 0.9
0.9 - 1.1
1.1 - 1.4
1.4 - 1.7
1.7 - 2.0 >2.0 % # Diag.
2005 Physician
Scores
<0.3 0.8% 1.1% 0.3% 0.1% 0.1% 0.0% 0.0% 0.0% 2.5% 44 0.3 - 0.6 1.2% 8.0% 7.5% 1.7% 1.4% 0.1% 0.2% 0.2% 20.1% 356 0.6 - 0.9 0.3% 5.3% 13.3% 7.7% 3.3% 0.7% 0.3% 0.5% 31.6% 559 0.9 - 1.1 0.0% 1.5% 7.2% 5.4% 3.1% 1.0% 0.5% 0.3% 18.9% 335 1.1 - 1.4 0.1% 0.6% 3.4% 4.0% 4.0% 1.1% 0.6% 0.6% 14.4% 255 1.4 - 1.7 0.1% 0.2% 0.9% 1.2% 1.6% 1.4% 0.6% 0.3% 6.3% 112 1.7 - 2.0 0.0% 0.3% 0.3% 0.3% 0.2% 0.5% 0.4% 0.5% 2.5% 45
>2.0 0.1% 0.1% 0.4% 0.4% 0.8% 0.6% 0.2% 1.1% 3.7% 65
Totals % 2.6% 17.1% 33.3% 20.8% 14.6% 5.5% 2.7% 3.5% 100.0% -- # 46 302 590 368 258 97 48 62 -- 1,771 22%
Diag. 20% 34%
Table A.10: Cross-Tabulation for MEG 2004-2005: EMmax Attribution
Range of Scores 2004 Physician Scores Totals
<0.3 0.3 - 0.6
0.6 - 0.9
0.9 - 1.1
1.1 - 1.4
1.4 - 1.7
1.7 - 2.0 >2.0 % # Diag.
2005 Physician
Scores
<0.3 1.1% 1.5% 0.6% 0.1% 0.1% 0.0% 0.0% 0.0% 3.3% 59 0.3 - 0.6 0.6% 7.7% 6.0% 1.6% 1.2% 0.4% 0.2% 0.4% 18.1% 323 0.6 - 0.9 0.2% 5.8% 12.2% 5.7% 3.4% 1.2% 0.8% 0.5% 29.9% 533 0.9 - 1.1 0.2% 1.8% 5.8% 5.2% 3.4% 1.1% 0.3% 0.7% 18.6% 331 1.1 - 1.4 0.2% 1.1% 2.9% 3.1% 4.0% 1.2% 0.4% 0.6% 13.4% 238 1.4 - 1.7 0.0% 0.2% 0.8% 1.3% 1.9% 1.5% 0.4% 0.8% 6.8% 121 1.7 - 2.0 0.0% 0.3% 0.6% 0.4% 0.4% 0.6% 0.6% 0.2% 3.1% 56
>2.0 0.2% 0.3% 0.9% 1.0% 1.0% 0.7% 0.3% 2.4% 6.7% 120
Totals % 2.5% 18.7% 29.8% 18.3% 15.4% 6.7% 3.0% 5.6% 100.0% -- # 45 333 531 326 274 120 53 99 -- 1,781 18%
Diag. 18% 35%
Acumen, LLC 36

Table A.11: Cross-Tabulation for ETG 2003-2004: 10-10 Cell Size
Range of Scores 2003 Physician Scores Totals
<0.3 0.3 - 0.6
0.6 - 0.9
0.9 - 1.1
1.1 - 1.4
1.4 - 1.7
1.7 - 2.0 >2.0 % # Diag.
2004 Physician
Scores
<0.3 1.6% 0.7% 0.0% 0.0% 0.1% 0.0% 0.0% 0.0% 2.4% 39 0.3 - 0.6 0.5% 5.2% 5.6% 0.6% 0.2% 0.2% 0.1% 0.3% 12.7% 206 0.6 - 0.9 0.2% 4.1% 19.5% 8.0% 2.5% 0.7% 0.4% 0.1% 35.6% 577 0.9 - 1.1 0.1% 1.0% 7.4% 6.7% 5.4% 1.1% 0.2% 0.0% 21.9% 355 1.1 - 1.4 0.0% 0.2% 2.8% 3.8% 5.4% 1.5% 0.4% 0.4% 14.6% 236 1.4 - 1.7 0.0% 0.1% 0.7% 1.1% 1.8% 1.5% 0.2% 0.4% 5.8% 94 1.7 - 2.0 0.0% 0.0% 0.4% 0.3% 0.5% 0.7% 0.7% 0.4% 2.9% 47
>2.0 0.0% 0.1% 0.5% 0.2% 0.2% 0.5% 0.4% 2.2% 4.1% 66
Totals % 2.3% 11.5% 36.9% 20.7% 16.2% 6.2% 2.5% 3.7% 100.0% -- # 38 186 597 335 263 100 41 60 -- 1,620 22%
Diag. 19% 43%
Table A.12: Cross-Tabulation for MEG 2003-2004: 10-10 Cell Size
Range of Scores 2004 Physician Scores Totals
<0.3 0.3 - 0.6
0.6 - 0.9
0.9 - 1.1
1.1 - 1.4
1.4 - 1.7
1.7 - 2.0 >2.0 % # Diag.
2005 Physician
Scores
<0.3 2.4% 1.0% 0.1% 0.1% 0.1% 0.0% 0.0% 0.0% 3.6% 70 0.3 - 0.6 0.8% 8.3% 5.1% 0.7% 0.7% 0.1% 0.2% 0.2% 16.0% 308 0.6 - 0.9 0.1% 4.6% 17.7% 6.7% 3.0% 0.8% 0.1% 0.4% 33.4% 643 0.9 - 1.1 0.0% 1.5% 6.2% 5.6% 3.4% 0.8% 0.1% 0.2% 17.9% 344 1.1 - 1.4 0.1% 0.4% 3.1% 4.0% 5.0% 1.2% 0.4% 0.5% 14.7% 284 1.4 - 1.7 0.0% 0.2% 1.3% 0.8% 1.6% 1.4% 0.8% 0.5% 6.5% 126 1.7 - 2.0 0.0% 0.2% 0.2% 0.3% 0.5% 0.7% 0.2% 0.4% 2.3% 45
>2.0 0.0% 0.0% 0.5% 0.4% 0.6% 0.4% 0.8% 3.0% 5.6% 107
Totals % 3.3% 16.1% 34.3% 18.6% 14.8% 5.3% 2.4% 5.0% 100.0% -- # 64 310 661 359 286 103 47 97 -- 1,927 19%
Diag. 19% 44%
Acumen, LLC Evaluating the Stability of Physician Efficiency Scores | February 2010 37
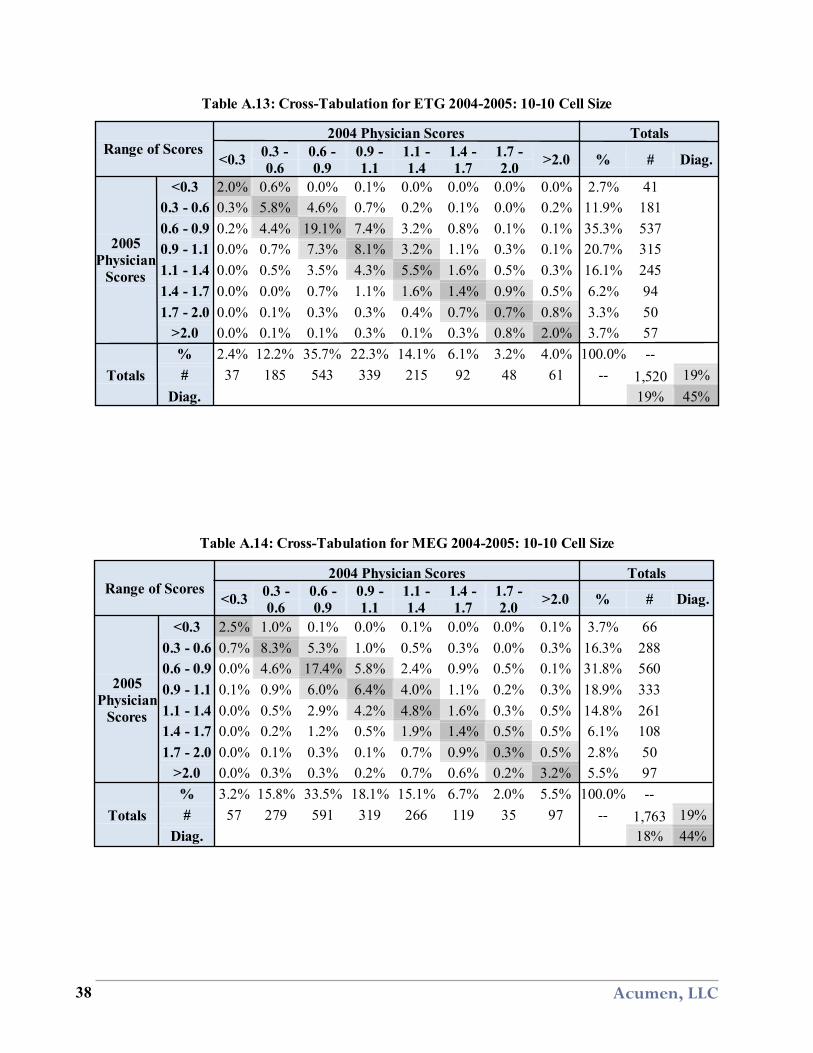
Table A.13: Cross-Tabulation for ETG 2004-2005: 10-10 Cell Size
Range of Scores 2004 Physician Scores Totals
<0.3 0.3 - 0.6
0.6 - 0.9
0.9 - 1.1
1.1 - 1.4
1.4 - 1.7
1.7 - 2.0 >2.0 % # Diag.
2005 Physician
Scores
<0.3 2.0% 0.6% 0.0% 0.1% 0.0% 0.0% 0.0% 0.0% 2.7% 41 0.3 - 0.6 0.3% 5.8% 4.6% 0.7% 0.2% 0.1% 0.0% 0.2% 11.9% 181 0.6 - 0.9 0.2% 4.4% 19.1% 7.4% 3.2% 0.8% 0.1% 0.1% 35.3% 537 0.9 - 1.1 0.0% 0.7% 7.3% 8.1% 3.2% 1.1% 0.3% 0.1% 20.7% 315 1.1 - 1.4 0.0% 0.5% 3.5% 4.3% 5.5% 1.6% 0.5% 0.3% 16.1% 245 1.4 - 1.7 0.0% 0.0% 0.7% 1.1% 1.6% 1.4% 0.9% 0.5% 6.2% 94 1.7 - 2.0 0.0% 0.1% 0.3% 0.3% 0.4% 0.7% 0.7% 0.8% 3.3% 50
>2.0 0.0% 0.1% 0.1% 0.3% 0.1% 0.3% 0.8% 2.0% 3.7% 57
Totals % 2.4% 12.2% 35.7% 22.3% 14.1% 6.1% 3.2% 4.0% 100.0% -- # 37 185 543 339 215 92 48 61 -- 1,520 19%
Diag. 19% 45%
Table A.14: Cross-Tabulation for MEG 2004-2005: 10-10 Cell Size
Range of Scores 2004 Physician Scores Totals
<0.3 0.3 - 0.6
0.6 - 0.9
0.9 - 1.1
1.1 - 1.4
1.4 - 1.7
1.7 - 2.0 >2.0 % # Diag.
2005 Physician
Scores
<0.3 2.5% 1.0% 0.1% 0.0% 0.1% 0.0% 0.0% 0.1% 3.7% 66 0.3 - 0.6 0.7% 8.3% 5.3% 1.0% 0.5% 0.3% 0.0% 0.3% 16.3% 288 0.6 - 0.9 0.0% 4.6% 17.4% 5.8% 2.4% 0.9% 0.5% 0.1% 31.8% 560 0.9 - 1.1 0.1% 0.9% 6.0% 6.4% 4.0% 1.1% 0.2% 0.3% 18.9% 333 1.1 - 1.4 0.0% 0.5% 2.9% 4.2% 4.8% 1.6% 0.3% 0.5% 14.8% 261 1.4 - 1.7 0.0% 0.2% 1.2% 0.5% 1.9% 1.4% 0.5% 0.5% 6.1% 108 1.7 - 2.0 0.0% 0.1% 0.3% 0.1% 0.7% 0.9% 0.3% 0.5% 2.8% 50
>2.0 0.0% 0.3% 0.3% 0.2% 0.7% 0.6% 0.2% 3.2% 5.5% 97
Totals % 3.2% 15.8% 33.5% 18.1% 15.1% 6.7% 2.0% 5.5% 100.0% -- # 57 279 591 319 266 119 35 97 -- 1,763 19%
Diag. 18% 44%
Acumen, LLC 38

Table A.15: Cross-Tabulation for ETG 2003-2004: Medical Doctors Only
Range of Scores 2003 Physician Scores Totals
<0.3 0.3 - 0.6
0.6 - 0.9
0.9 - 1.1
1.1 - 1.4
1.4 - 1.7
1.7 - 2.0 >2.0 % # Diag.
2004 Physician
Scores
<0.3 1.4% 1.4% 0.3% 0.1% 0.0% 0.0% 0.0% 0.0% 3.2% 34 0.3 - 0.6 1.3% 7.4% 5.3% 1.4% 0.7% 0.1% 0.1% 0.1% 16.3% 175 0.6 - 0.9 0.1% 5.9% 17.9% 7.5% 3.0% 0.9% 0.6% 0.3% 36.2% 388 0.9 - 1.1 0.0% 1.3% 5.4% 5.4% 3.7% 1.2% 0.3% 0.5% 17.8% 191 1.1 - 1.4 0.2% 0.3% 3.3% 3.4% 4.9% 2.3% 0.3% 0.2% 14.8% 159 1.4 - 1.7 0.0% 0.2% 0.6% 0.5% 2.1% 0.6% 0.5% 0.2% 4.6% 49 1.7 - 2.0 0.0% 0.1% 0.4% 0.5% 0.7% 0.8% 0.5% 0.3% 3.2% 34
>2.0 0.0% 0.2% 0.4% 0.1% 0.5% 0.4% 0.5% 2.1% 4.0% 43
Totals % 3.0% 16.7% 33.5% 18.8% 15.6% 6.3% 2.6% 3.5% 100.0% -- # 32 179 359 202 167 68 28 38 -- 1,073 21%
Diag. 19% 40%
Table A.16: Cross-Tabulation for MEG 2003-2004: Medical Doctors Only
Range of Scores 2003 Physician Scores Totals
<0.3 0.3 - 0.6
0.6 - 0.9
0.9 - 1.1
1.1 - 1.4
1.4 - 1.7
1.7 - 2.0 >2.0 % # Diag.
2004 Physician
Scores
<0.3 1.8% 1.4% 0.3% 0.0% 0.1% 0.1% 0.0% 0.1% 3.8% 40 0.3 - 0.6 0.8% 7.4% 5.5% 1.5% 0.6% 0.2% 0.1% 0.2% 16.4% 174 0.6 - 0.9 0.2% 4.4% 14.2% 4.7% 3.9% 1.0% 0.5% 0.3% 29.2% 311 0.9 - 1.1 0.2% 1.5% 5.1% 4.5% 3.7% 1.3% 0.5% 0.2% 16.9% 180 1.1 - 1.4 0.0% 0.8% 3.0% 3.1% 5.0% 2.6% 0.7% 0.8% 16.1% 171 1.4 - 1.7 0.0% 0.3% 0.6% 1.5% 2.0% 0.9% 0.7% 0.8% 6.7% 71 1.7 - 2.0 0.0% 0.0% 0.4% 0.3% 0.5% 0.8% 0.3% 0.8% 3.0% 32
>2.0 0.0% 0.1% 0.6% 0.6% 0.8% 0.9% 0.9% 4.1% 8.0% 85
Totals % 3.0% 16.0% 29.6% 16.2% 16.4% 7.9% 3.6% 7.3% 100.0% -- # 32 170 315 172 175 84 38 78 -- 1,064 19%
Diag. 17% 38%
Acumen, LLC Evaluating the Stability of Physician Efficiency Scores | February 2010 39

Table A.17: Cross-Tabulation for ETG 2004-2005: Medical Doctors Only
Range of Scores 2004 Physician Scores Totals
<0.3 0.3 - 0.6
0.6 - 0.9
0.9 - 1.1
1.1 - 1.4
1.4 - 1.7
1.7 - 2.0 >2.0 % # Diag.
2005 Physician
Scores
<0.3 1.3% 2.2% 0.4% 0.1% 0.0% 0.0% 0.0% 0.1% 4.1% 40 0.3 - 0.6 1.2% 6.9% 8.7% 1.9% 0.8% 0.3% 0.0% 0.0% 19.9% 192 0.6 - 0.9 0.3% 6.0% 16.3% 5.7% 2.9% 0.7% 0.1% 0.3% 32.3% 312 0.9 - 1.1 0.1% 1.0% 6.1% 5.4% 3.3% 0.7% 0.1% 0.1% 16.9% 163 1.1 - 1.4 0.1% 0.6% 2.3% 2.8% 4.8% 0.9% 0.6% 0.3% 12.4% 120 1.4 - 1.7 0.0% 0.1% 1.1% 0.8% 1.8% 1.2% 1.2% 0.3% 6.6% 64 1.7 - 2.0 0.0% 0.0% 0.7% 0.3% 0.6% 0.4% 0.7% 0.4% 3.2% 31
>2.0 0.0% 0.2% 0.5% 0.6% 0.6% 0.3% 0.4% 1.8% 4.5% 43
Totals % 3.1% 17.1% 36.2% 17.6% 14.8% 4.7% 3.2% 3.3% 100.0% -- # 30 165 349 170 143 45 31 32 -- 965 22%
Diag. 19% 38%
Table A.18: Cross-Tabulation for MEG 2004-2005: Medical Doctors Only
Range of Scores 2004 Physician Scores Totals
<0.3 0.3 - 0.6
0.6 - 0.9
0.9 - 1.1
1.1 - 1.4
1.4 - 1.7
1.7 - 2.0 >2.0 % # Diag.
2005 Physician
Scores
<0.3 2.0% 1.0% 0.4% 0.0% 0.2% 0.0% 0.1% 0.0% 3.8% 36 0.3 - 0.6 0.7% 8.9% 6.5% 1.5% 0.7% 0.3% 0.1% 0.1% 18.8% 180 0.6 - 0.9 0.6% 4.7% 12.3% 6.0% 3.8% 0.9% 0.0% 0.2% 28.5% 274 0.9 - 1.1 0.2% 1.0% 4.3% 3.9% 3.3% 1.0% 0.1% 0.3% 14.2% 136 1.1 - 1.4 0.0% 0.6% 3.2% 3.6% 4.2% 1.5% 0.6% 0.4% 14.2% 136 1.4 - 1.7 0.0% 0.1% 1.6% 0.9% 1.8% 1.6% 0.3% 0.7% 7.0% 67 1.7 - 2.0 0.1% 0.3% 0.6% 0.2% 0.8% 0.7% 0.7% 1.0% 4.6% 44
>2.0 0.1% 0.3% 0.9% 0.8% 1.3% 0.7% 0.6% 4.3% 9.1% 87
Totals % 3.8% 17.0% 29.8% 17.0% 16.0% 6.8% 2.6% 7.1% 100.0% -- # 36 163 286 163 154 65 25 68 -- 960 20%
Diag. 16% 38%
Acumen, LLC 40
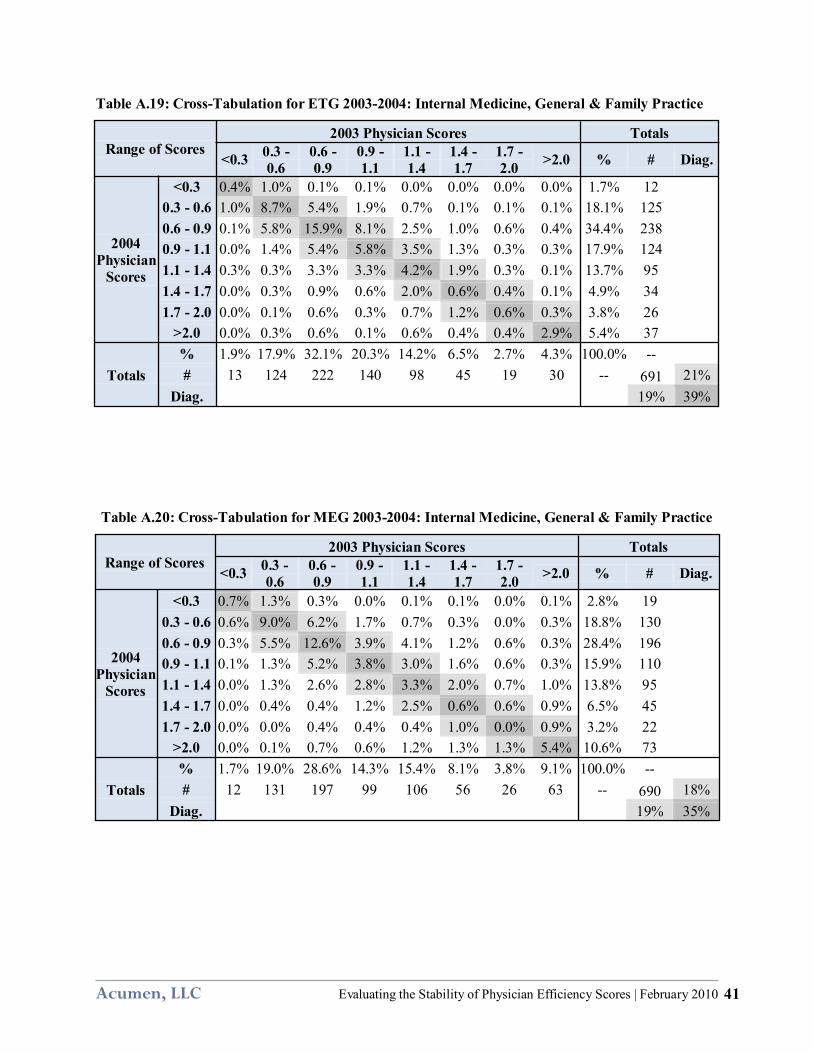
Table A.19: Cross-Tabulation for ETG 2003-2004: Internal Medicine, General & Family Practice
Range of Scores 2003 Physician Scores Totals
<0.3 0.3 - 0.6
0.6 - 0.9
0.9 - 1.1
1.1 - 1.4
1.4 - 1.7
1.7 - 2.0 >2.0 % # Diag.
2004 Physician
Scores
<0.3 0.4% 1.0% 0.1% 0.1% 0.0% 0.0% 0.0% 0.0% 1.7% 12 0.3 - 0.6 1.0% 8.7% 5.4% 1.9% 0.7% 0.1% 0.1% 0.1% 18.1% 125 0.6 - 0.9 0.1% 5.8% 15.9% 8.1% 2.5% 1.0% 0.6% 0.4% 34.4% 238 0.9 - 1.1 0.0% 1.4% 5.4% 5.8% 3.5% 1.3% 0.3% 0.3% 17.9% 124 1.1 - 1.4 0.3% 0.3% 3.3% 3.3% 4.2% 1.9% 0.3% 0.1% 13.7% 95 1.4 - 1.7 0.0% 0.3% 0.9% 0.6% 2.0% 0.6% 0.4% 0.1% 4.9% 34 1.7 - 2.0 0.0% 0.1% 0.6% 0.3% 0.7% 1.2% 0.6% 0.3% 3.8% 26
>2.0 0.0% 0.3% 0.6% 0.1% 0.6% 0.4% 0.4% 2.9% 5.4% 37
Totals % 1.9% 17.9% 32.1% 20.3% 14.2% 6.5% 2.7% 4.3% 100.0% -- # 13 124 222 140 98 45 19 30 -- 691 21%
Diag. 19% 39%
Table A.20: Cross-Tabulation for MEG 2003-2004: Internal Medicine, General & Family Practice
Range of Scores 2003 Physician Scores Totals
<0.3 0.3 - 0.6
0.6 - 0.9
0.9 - 1.1
1.1 - 1.4
1.4 - 1.7
1.7 - 2.0 >2.0 % # Diag.
2004 Physician
Scores
<0.3 0.7% 1.3% 0.3% 0.0% 0.1% 0.1% 0.0% 0.1% 2.8% 19 0.3 - 0.6 0.6% 9.0% 6.2% 1.7% 0.7% 0.3% 0.0% 0.3% 18.8% 130 0.6 - 0.9 0.3% 5.5% 12.6% 3.9% 4.1% 1.2% 0.6% 0.3% 28.4% 196 0.9 - 1.1 0.1% 1.3% 5.2% 3.8% 3.0% 1.6% 0.6% 0.3% 15.9% 110 1.1 - 1.4 0.0% 1.3% 2.6% 2.8% 3.3% 2.0% 0.7% 1.0% 13.8% 95 1.4 - 1.7 0.0% 0.4% 0.4% 1.2% 2.5% 0.6% 0.6% 0.9% 6.5% 45 1.7 - 2.0 0.0% 0.0% 0.4% 0.4% 0.4% 1.0% 0.0% 0.9% 3.2% 22
>2.0 0.0% 0.1% 0.7% 0.6% 1.2% 1.3% 1.3% 5.4% 10.6% 73
Totals % 1.7% 19.0% 28.6% 14.3% 15.4% 8.1% 3.8% 9.1% 100.0% -- # 12 131 197 99 106 56 26 63 -- 690 18%
Diag. 19% 35%
Acumen, LLC Evaluating the Stability of Physician Efficiency Scores | February 2010 41
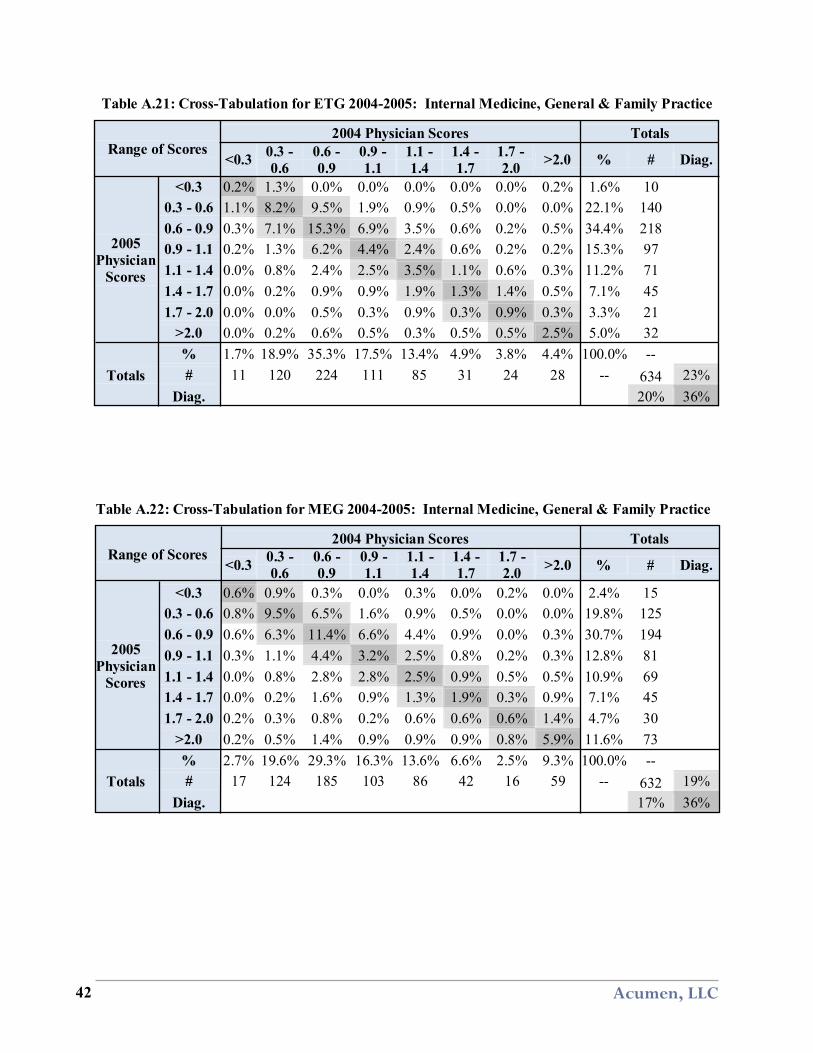
Table A.21: Cross-Tabulation for ETG 2004-2005: Internal Medicine, General & Family Practice
Range of Scores 2004 Physician Scores Totals
<0.3 0.3 - 0.6
0.6 - 0.9
0.9 - 1.1
1.1 - 1.4
1.4 - 1.7
1.7 - 2.0 >2.0 % # Diag.
2005 Physician
Scores
<0.3 0.2% 1.3% 0.0% 0.0% 0.0% 0.0% 0.0% 0.2% 1.6% 10 0.3 - 0.6 1.1% 8.2% 9.5% 1.9% 0.9% 0.5% 0.0% 0.0% 22.1% 140 0.6 - 0.9 0.3% 7.1% 15.3% 6.9% 3.5% 0.6% 0.2% 0.5% 34.4% 218 0.9 - 1.1 0.2% 1.3% 6.2% 4.4% 2.4% 0.6% 0.2% 0.2% 15.3% 97 1.1 - 1.4 0.0% 0.8% 2.4% 2.5% 3.5% 1.1% 0.6% 0.3% 11.2% 71 1.4 - 1.7 0.0% 0.2% 0.9% 0.9% 1.9% 1.3% 1.4% 0.5% 7.1% 45 1.7 - 2.0 0.0% 0.0% 0.5% 0.3% 0.9% 0.3% 0.9% 0.3% 3.3% 21
>2.0 0.0% 0.2% 0.6% 0.5% 0.3% 0.5% 0.5% 2.5% 5.0% 32
Totals % 1.7% 18.9% 35.3% 17.5% 13.4% 4.9% 3.8% 4.4% 100.0% -- # 11 120 224 111 85 31 24 28 -- 634 23%
Diag. 20% 36%
Table A.22: Cross-Tabulation for MEG 2004-2005: Internal Medicine, General & Family Practice
Range of Scores 2004 Physician Scores Totals
<0.3 0.3 - 0.6
0.6 - 0.9
0.9 - 1.1
1.1 - 1.4
1.4 - 1.7
1.7 - 2.0 >2.0 % # Diag.
2005 Physician
Scores
<0.3 0.6% 0.9% 0.3% 0.0% 0.3% 0.0% 0.2% 0.0% 2.4% 15 0.3 - 0.6 0.8% 9.5% 6.5% 1.6% 0.9% 0.5% 0.0% 0.0% 19.8% 125 0.6 - 0.9 0.6% 6.3% 11.4% 6.6% 4.4% 0.9% 0.0% 0.3% 30.7% 194 0.9 - 1.1 0.3% 1.1% 4.4% 3.2% 2.5% 0.8% 0.2% 0.3% 12.8% 81 1.1 - 1.4 0.0% 0.8% 2.8% 2.8% 2.5% 0.9% 0.5% 0.5% 10.9% 69 1.4 - 1.7 0.0% 0.2% 1.6% 0.9% 1.3% 1.9% 0.3% 0.9% 7.1% 45 1.7 - 2.0 0.2% 0.3% 0.8% 0.2% 0.6% 0.6% 0.6% 1.4% 4.7% 30
>2.0 0.2% 0.5% 1.4% 0.9% 0.9% 0.9% 0.8% 5.9% 11.6% 73
Totals % 2.7% 19.6% 29.3% 16.3% 13.6% 6.6% 2.5% 9.3% 100.0% -- # 17 124 185 103 86 42 16 59 -- 632 19%
Diag. 17% 36%
Acumen, LLC 42