Embed Size (px)
Citation preview

A Handbook for Practitioners
EVALUATING THE IMPACT OF
NATURE-BASEDSOLUTIONS
Climate resilienceParticipatory planning and governance
Health and well-being
Water management
Social justice and social cohesion
New economic opportunities and
green jobs
Natural and climate hazards
Air quality
Green space management
Place regeneration
Biodiversity enhancement
Knowledge building for sustainable urban
transformation
Research and Innovation
Independent Expert Report

Evaluating the Impact of Nature-based Solutions: A Handbook for Practitioners
European CommissionDirectorate-General for Research and InnovationDirectorate C — Healthy PlanetUnit C3 — Climate and Planetary Boundaries
Contact [email protected] [email protected] [email protected]
European CommissionB-1049 Brussels
Manuscript completed in March 2021. First edition.
This document has been prepared for the European Commission, however it reflects the views only of the authors, and the European Commission is not liable for any consequence stemming from the reuse of this publication.
More information on the European Union is available on the internet (http://europa.eu).
Print ISBN 978-92-76-22961-2 doi:10.2777/2498 KI-04-20-586-EN-C
PDF ISBN 978-92-76-22821-9 doi:10.2777/244577 KI-04-20-586-EN-N
Luxembourg: Publications Office of the European Union, 2021
© European Union, 2021
The reuse policy of European Commission documents is implemented based on Commission Decision 2011/833/EU of 12 December 2011 on the reuse of Commission documents (OJ L 330, 14.12.2011, p. 39). Except otherwise noted, the reuse of this document is authorised under a Creative Commons Attribution 4.0 International (CC-BY 4.0) licence (https://creativecommons.org/licenses/by/4.0/). This means that reuse is allowed provided appropriate credit is given and any changes are indicated. For any use or reproduction of elements that are not owned by the European Union, permission may need to be sought directly from the respective rightholders.
Image credits:cover: © MicroOne # 305386384, 2019. Source: stock.adobe.com

EUROPEAN COMMISSION
Directorate-General for Research and InnovationHealthy Planet - Climate and Planetary Boundaries2021
A Handbook for Practitioners
Adina Dumitru and Laura Wendling, Eds.
EVALUATING THE IMPACT OF
NATURE-BASEDSOLUTIONS

2
Table of Contents FOREWORD .................................................................................................. 6
LIST OF ABBREVIATIONS .......................................................................... 10
1. INTRODUCTION ..................................................................................... 16
1.1 What are Nature-based Solutions? ......................................................... 17 1.2 NBS in European and International policy frameworks .............................. 20
1.2.1 NBS in the European policy context ................................................. 20 1.2.2 NBS in an International policy context .............................................. 23
1.3 Purpose of the NBS Impact Evaluation Handbook ..................................... 25 1.3.1 Handbook aim ............................................................................... 25 1.3.2 Intended audience of this handbook ................................................. 26 1.3.3 How this handbook was developed................................................... 27
1.4 Content of this handbook ...................................................................... 34 1.5 Conclusions ......................................................................................... 37 1.6 References .......................................................................................... 38
PROFILE: NATURE4CITIES ............................................................................. 40
PROFILE: NATURVATION ............................................................................... 42
PROFILE:THINK NATURE ................................................................................ 44
2. PRINCIPLES GUIDING NBS PERFORMANCE AND IMPACT EVALUATION . 46
2.1 Introduction and definitions ................................................................... 47 2.1.1 The concept of effectiveness ........................................................... 51
2.2 Decision-making context and impact evaluations: from needs to indicators . 53 2.3 Principles for the development of impact monitoring and evaluation plans ... 57
2.3.1 Steps ........................................................................................... 57 2.3.2 Principles ...................................................................................... 58
2.4 Capitalising on existing experiences and remaining critical concerns ........... 64 2.4.1 Challenges and gaps in current monitoring and evaluation efforts ........ 64 2.4.2 Key messages from existing projects ............................................... 67
2.5 References .......................................................................................... 68
PROFILE: CONNECTING NATURE .................................................................... 70
PROFILE: GROW GREEN ................................................................................ 72
PROFILE: UNALAB ......................................................................................... 74
PROFILE: URBAN GREENUP ............................................................................ 76
3. APPROACHES TO MONITORING AND EVALUATION STRATEGY DEVELOPMENT ........................................................................................... 78
3.1 Introduction: developing robust impact assessment plans ......................... 79

3
3.2 A step by step approach to developing robust monitoring and evaluation plans for NBS .................................................................................................... 80 3.3 Robust assessment and co-production: a necessary relationship ................ 90 3.4 Innovative tools for monitoring and evaluation of nature-based solutions .... 96
3.4.1 Reflexive monitoring – Connecting Nature project .............................. 96 3.4.2 iAPT (Impact Assessment Planning Tool) – Connecting Nature project .. 99 3.4.3 Urban GreenUP Tool – Urban GreenUP project .................................. 100
3.5 Conclusions ........................................................................................ 102 3.6 References ......................................................................................... 103
PROFILE: CLEVER CITIES ............................................................................. 106
PROFILE: PROGIREG .................................................................................... 108
PROFILE: EDICITNET.................................................................................... 110
PROFILE: URBINAT ...................................................................................... 112
4. INDICATORS OF NBS PERFORMANCE AND IMPACT .............................. 114
4.1 Societal challenge areas addressed by NBS ............................................ 116 4.2 Recommended and Additional indicators for NBS impact assessment ......... 120
4.2.1 Climate Resilience ........................................................................ 124 4.2.2 Water Management ...................................................................... 128 4.2.3 Natural and Climate Hazards .......................................................... 132 4.2.4 Green Space Management ............................................................. 137 4.2.5 Biodiversity Enhancement .............................................................. 142 4.2.6 Air Quality ................................................................................... 145 4.2.7 Place Regeneration ....................................................................... 148 4.2.8 Knowledge and Social Capacity Building for Sustainable Urban Transformation ..................................................................................... 151 4.2.9 Participatory Planning and Governance ............................................ 153 4.2.10 Social Justice and Social Cohesion ................................................ 156 4.2.11 Health and Wellbeing .................................................................. 158 4.2.12 New Economic Opportunities and Green Jobs ................................. 163
4.3 Conclusions ........................................................................................ 168 4.3.1 Summary of the indicator framework presented ............................... 168 4.3.2 Emerging concerns and further development needs .......................... 168
4.4 References ......................................................................................... 169
PROFILE: CLEARING HOUSE .......................................................................... 173
PROFILE: REGREEN ...................................................................................... 175
5. APPLICATION OF THE NBS IMPACT EVALUATION FRAMEWORK: NBS PERFORMANCE AND IMPACT EVALUATION CASE STUDIES ...................... 177
5.1 Introduction to holistic NBS impact assessment using the framework of recommended indicators ........................................................................... 179
5.1.1 Recommended indicators case study from Tampere, Finland .............. 181

4
5.1.2 Recommended indicators case study from Valladolid, Spain ............... 183 5.1.3 Recommended indicators case study from Guildford, UK .................... 186 5.1.4 Recommended indicators case study from Genk, Belgium .................. 189
5.2 Case studies illustrating the ‘story of an indicator’ for some of the additional indicators ................................................................................................ 196
5.2.1 Climate Resilience – Urban heat Island incidence .............................. 196 5.2.2 Natural and climate hazards – Flood risk ......................................... 199 5.2.3 Green space management – Walkability .......................................... 203 5.2.4 Green space management – Annual trend in vegetation cover ............ 205 5.2.5 Green space management – ESTIMAP nature-based recreation .......... 211 5.2.6 Green space management – Land composition ................................. 215 5.2.7 Biodiversity Enhancement – Number of conservation priority species .. 219 5.2.8 Air Quality – Trends in NOx and SOx emissions ................................ 221 5.2.9 Knowledge and Social Capacity Building for Sustainable Urban Transformation – Connectedness to nature .............................................. 223 5.2.10 Social Justice and Social Cohesion – Perceived social support ........... 224 5.2.11 Health and Wellbeing – Prevalence, incidence, and morbidity of chronic stress .................................................................................................. 226 5.2.12 Health and Wellbeing – Perceived chronic loneliness ........................ 229
5.3 Conclusions ........................................................................................ 232
PROFILE: NAIAD .......................................................................................... 233
PROFILE: OPERANDUM ................................................................................. 235
PROFILE: PHUSICOS .................................................................................... 237
PROFILE: RECONECT .................................................................................... 239
6. NBS FOR DISASTER RISK REDUCTION ................................................. 241
6.1 NBS and Disaster Risk Reduction .......................................................... 242 6.2 Basics of risk analysis, risk reduction measures, resilience and effectiveness .............................................................................................................. 243 6.3 Indicators and methodologies for measuring NBS effectiveness indicators in DRR context ............................................................................................ 248 6.4 Case study #1 – from indicators assessment to integration and decision-aiding for flood risk management ......................................................................... 254
6.4.1 Context and global framework for assessment of NBS effectiveness .... 254 6.4.2 Indicators for assessment of technical, physical and economic efficacy of flood mitigation strategies including NBS ................................................. 255
6.5 Case study #2 – a green barrier to reduce the risk of floods due to snowmelt and extreme rainfall ................................................................................. 258
6.5.1 General background and hazard type .............................................. 258 6.5.2 Co-benefits of the proposed NBS .................................................... 259 6.5.3 Indicators for the NBS performance assessment ............................... 260
6.6 Case study #3 – landslides and debris flows ........................................... 264 6.7 Case study #4 – floods in dense urban environments .............................. 268
5
6.8 Concluding remarks ............................................................................ 270 6.9 References ......................................................................................... 270
PROFILE: MAES ........................................................................................... 273
PROFILE: ENROUTE ..................................................................................... 275
7. DATA REQUIREMENTS .......................................................................... 277
7.1 Data terminology, definitions and key concepts ...................................... 279 7.1.1 Spatial versus non-spatial data ...................................................... 279 7.1.2 Baseline data ............................................................................... 280 7.1.3 Control data ................................................................................. 280 7.1.4 Acquisition regime ........................................................................ 281 7.1.5 Spatial scale of analysis................................................................. 282 7.1.6 Processing level ............................................................................ 283 7.1.7 Data generation and collection methods .......................................... 284
7.2 Environmental data of relevance for NBS monitoring and assessment ........ 287 7.2.1 Remote sensing (RS) and Earth Observation (EO) ............................ 288 7.2.2 In-situ observations and ground measurements ............................... 296 7.2.3 Surveys ....................................................................................... 300
7.3 Socio-economic, demographic and behavioural datasets for NBS monitoring and assessment: Methods and sources .............................................................. 301
7.3.1 Quantitative, qualitative and map-based surveys .............................. 303 7.3.2 Population observations................................................................. 306
7.4 Data sources for the assessment of changes to health and wellbeing ......... 307 7.5 Predicting the present and future impacts of NBS with modelling techniques .............................................................................................................. 311 7.6 Mimicking the impacts of NBS: how laboratory data can help ................... 326 7.7 Engaging the community in the data collection process: citizen science and its role in NBS monitoring .............................................................................. 326 7.8 Data integration ................................................................................. 329 7.9 Baseline assessment ........................................................................... 339 7.10 Data adequacy and related aspects ..................................................... 344
7.10.1 Data gaps and irregularities ......................................................... 348 7.10.2 Data granularity and resolution .................................................... 349 7.10.3 Data accuracy ............................................................................ 351 7.10.4 Biases, main error sources, and data reliability ............................... 353 7.10.5 Data accessibility ........................................................................ 353 7.10.6 Metadata and data standardization ............................................... 355
7.11 Conclusion ........................................................................................... 357 7.12 References .......................................................................................... 361

115
4 INDICATORS OF NBS PERFORMANCE AND IMPACT Coordinating Lead authors Wendling, L., Dumitru, A.
Lead authors Arnbjerg-Nielsen, K., Baldacchini, C., Connop, S., Dubovik, M., Fermoso, J., Hölscher, K., Nadim, F., Pilla, F., Renaud, F., Rhodes, M. L., San José, E., Sánchez, R., Skodra, J., Tacnet, J.-M., Zulian, G.
Contributing authors Allaert, K., Almassy, D., Ascenso, A., Babí Almenar, J., Basco, L., Beaujouan, V., Benoit, G., Bockarjova, M., Bode, N., Bonelli, S., Bouzouidja, R., Butlin, T., Calatrava, J., Calfapietra, C., Cannavo, P., Capobianco, V., Caroppi, G., Ceccherini, G., Chancibault, K., Cioffi, M., Coelho, S., Dadvand, P., de Bellis, Y., de Keijzer, C., de la Hera, A., De Vreese, R., Decker, S., Djordjevic, S., Dowling, C., Dushkova, D., Eiter, S., Faneca, M., Fatima, Z., Ferracini, C., Fjellstad, W., Fleury, G., Freyer, B., García, I., García-Alcaraz, M., Gerundo, C., Gil-Roldán, E., Giordano, R., Giugni, M., Goličnik Marušić, B., Gómez, S., González, M., Gonzalez-Ollauri, A., Guidolotti, G., Haase, D., Heredida, J., Hermawan, T., Herranz-Pascual, K., Jermakka, J., Jones, L., Kiss, M., Kraus, F., Körmöndi, B., Laikari, A., Laille, P., Lemée, C., Llorente, M., Lodder, M., Macsinga, I., Maes, J., Maia, S., Manderscheid, M., Manzano, M., Martelli, F., Martins, R., Mayor, B., McKnight, U., Mendizabal, M., Mendonça, R., Mickovski, S.B., Miranda, A.I., Moniz, G.C., Munro, K., Nash, C., Nolan, P., Oen, A., Olsson, P., Olver, C., Ozturk, E.D., Paradiso, F., Petucco, C., Pisani, N., Piton, G., Pugliese, F., Rasmussen, M., Ravknikar, Ž, Reich, E., Reichborn-Kjennerud, K., Rinta-Hiiro, V., Robles, V., Rodriguez, F., Roebeling, P., Ruangpan, L., Rugani, B., Rödl, A., Sánchez, I., Sánchez Torres, A., Sanesi, G., Sanz, J.M., Scharf, B., Silvestri, F., Spano, G., Stanganelli, M., Szkordilisz, F., Tomé-Lourido, D., Vay, L., Vela, S., Vercelli, M., Villazán, A., Vojinovic, Z., Werner, A., Wheeler, B., Young, C., Zorita, S., Zandersen, M., zu-Castell Rüdenhausen, M.

116
Summary
What is this chapter about?
This chapter introduces 12 categories of societal challenges that NBS can address (Section 4.1). These are conceptually mapped against the UN Sustainable Development Goals. For each of the 12 societal challenge areas, Section 4.2 outlines and lists indicators to evaluate the performance and impact of NBS. It reviews the different types of NBS, gives examples of each NBS type, and lists the indicators related to the particular societal challenge in a series of tables. Associated methodologies are compiled in the related Appendix of Methods. To help navigate, the indicators are classified as structural, process-based or outcome-oriented. Structural indicators are particularly useful during the NBS planning process and can help identify where resources may be lacking or highlight policy and/or procedural gaps that require attention. Process-based indicators can provide information about the value or impacts of the collaborative processes that underpin NBS (co-creation, co-implementation and co-management). The outcome-oriented indicators are useful to understand NBS performance by establishing an understanding of baseline (pre-NBS) conditions and following changes to these conditions after NBS implementation. We distinguish between recommended and additional indicators. Recommended indicators are considered the most important ones to monitor NBS impact. Additional indicators can provide highly valuable information, depending on local context and particular data needs. The chapter concludes with a reflection on the importance of critical thinking to select the right indicators for a holistic assessment of NBS and the development of emerging indicators (Section 4.3).
How can I use this chapter in my work with NBS?
This chapter helps to select the most appropriate indicators to assess the performance and impact of a given NBS. As resources are limited and it is simply not possible to monitor every single indicator, this buffet-style approach enables tailoring of a monitoring programme to address a specific context, both with respect to the challenges addressed and the NBS implemented in response.
When should I use this knowledge in my work with NBS?
Selection of indicators can occur at any time during the cycle of adaptive management of NBS. The initial monitoring and assessment plan identifies “must-have” outcomes that can be linked to specific indicators. For example, if the primary objective of a given NBS is to attenuate flooding then indicators related to the impacts of floods (extent of flooded land, duration of flooding, number of buildings and/or persons affected, etc.) are critical to evaluate NBS impact. During the NBS co-creation process, review of planned NBS impact indicators can help to identify potential additional benefits and inform NBS design. Indicators can be added or replaced at any time in response to observed changes or new challenges (adaptive monitoring).

117
How does this chapter link with the other parts of the handbook?
The previous chapters have detailed the concept of NBS and briefly described how NBS can support relevant public policies, why it is important to monitor NBS performance and evaluate their impacts, and how to develop a monitoring and evaluation strategy. This chapter focuses on which indicators to use in different local contexts in order to understand NBS performance and impacts. Chapter 4 should be read in conjunction with the Appendix of Methods, where the specific details of each indicator are further clarified, along with a brief methodology. The following Chapters 5 and 6 expand upon the list of indicators presented here by illustrating the application of selected indicators to NBS in different contexts, including NBS specifically designed for disaster risk reduction (DRR). Chapter 7 describes the different types of NBS monitoring data and provides detailed information about how to acquire and evaluate the quality these data.
4.1 Societal challenge areas addressed by NBS
The 2017 EKLIPSE Expert Working Group impact evaluation framework report (Raymond et al., 2017) identified ten challenge areas related to climate resilience in urban areas. The present report expands these original ten challenge areas to 12 separate societal challenge areas that can potentially be addressed by NBS (Figure 4-1). In addition to presenting a suite of indicators applicable to each challenge area, methods of indicator determination are presented in the separate report Evaluating the Impact of Nature-based Solutions: Appendix of Methods to support the application of impact indicators. The overarching objective of this Handbook and the accompanying Appendix of Methods is to provide standardized guidance and methods of indicator determination to support establishment of a robust European evidence base on NBS performance and impact. In order to compare different types of NBS, implemented in different environments and at varying scale we need to measure the same variables, using the same methods and report these outcomes using the same units of measure.
The 12 challenge areas elaborated herein are:
1. Climate Resilience 2. Water Management 3. Natural and Climate Hazards 4. Green Space Management 5. Biodiversity Enhancement 6. Air Quality 7. Place Regeneration 8. Knowledge and Social Capacity Building for Sustainable Urban Transformation 9. Participatory Planning and Governance 10. Social Justice and Social Cohesion 11. Health and Wellbeing 12. New Economic Opportunities and Green Jobs

118
Figure 4-1. Conceptual mapping of societal challenge areas that can be addressed by NBS onto the triad of People, Planet, Prosperity pillars of sustainable development
Climate Resilience: Nature-based solutions are capable of providing resilience to the impacts of climate change through the provision of ecosystem services, and by enhancing social awareness and actions to combat climate change. The co-benefits delivered by NBS support climate change mitigation and adaptation efforts, particularly in urban areas, contributing to the liveability of cities.
Water Management: Nature-based solutions provide an excellent opportunity to address a diversity of issues associated with anthropogenic impacts on the water cycle. These include poor water quality, water availability for extraction, groundwater and surface water levels, recharging of aquifers, stormwater management, water treatment, wetland habitat management, soil water management, and ecological quality.
Natural and Climate Hazards: Risk is a combination of hazard and (negative) consequences. Nature-based solutions employed for disaster risk reduction are expected to reduce risk level (i.e., influence risk components corresponding to hazard or vulnerability). At the same time, NBS deliver further social, human, and environmental co-benefits. This challenge category was expanded based upon the further development of the “Coastal Resilience” challenge area described in the EKLIPSE Expert Working Group impact evaluation framework (Raymond et al., 2017) to include a wider array of climate-related and natural hazards.

119
Green Space Management: Green space management refers to the planning, establishment and maintenance of green and blue infrastructure in urban areas. Green and blue infrastructure (abbreviated as urban green infrastructure, UGI) are a type of NBS that refers specifically to the strategically managed network of natural and semi-natural ecosystems within urban boundaries. UGI provides a range of ecological and socio-economic benefits (Raymond et al., 2017) and, if correctly managed, contributes to solutions for numerous challenges such as air and noise pollution, heat waves, flooding and concerns regarding public well-being (Maes et al., 2019). NBS support the wider deployment of green and blue infrastructure (EC, 2019a; EC, 2019b), thus supporting the EU Green Infrastructure Strategy (EC, 2013) and the EU Biodiversity Strategy for 2030 (EC, 2020).
Biodiversity Enhancement: Biodiversity loss and ecosystem collapse are among the greatest threats society faces in the near term. There are five primary direct drivers of biodiversity loss: changes in land and sea use, overexploitation, climate change, pollution, and invasive alien species. The link between climate change and biodiversity loss involves a feedback loop whereby climate change accelerates loss of natural capital, which is in turn a key driver of climate change. NBS support the EU Biodiversity Strategy for 2030 (EC, 2020) through the purposeful establishment of protected areas and restoration of degraded ecosystems. The enhancement and/or conservation of biodiversity was considered as part of the Green Space Management challenge in the EKLIPSE Expert Working Group impact evaluation framework (Raymond et al., 2017). Here, we consider Biodiversity Enhancement as a separate challenge area.
Air Quality: NBS based on the creation, enhancement, or restoration of ecosystems in human-dominated environments play a relevant role in removing air pollutants and carbon dioxide, reducing the air temperature (which slows down the creation of secondary pollutants) and increasing oxygen concentration, contributing to a beneficial atmospheric composition for human life.
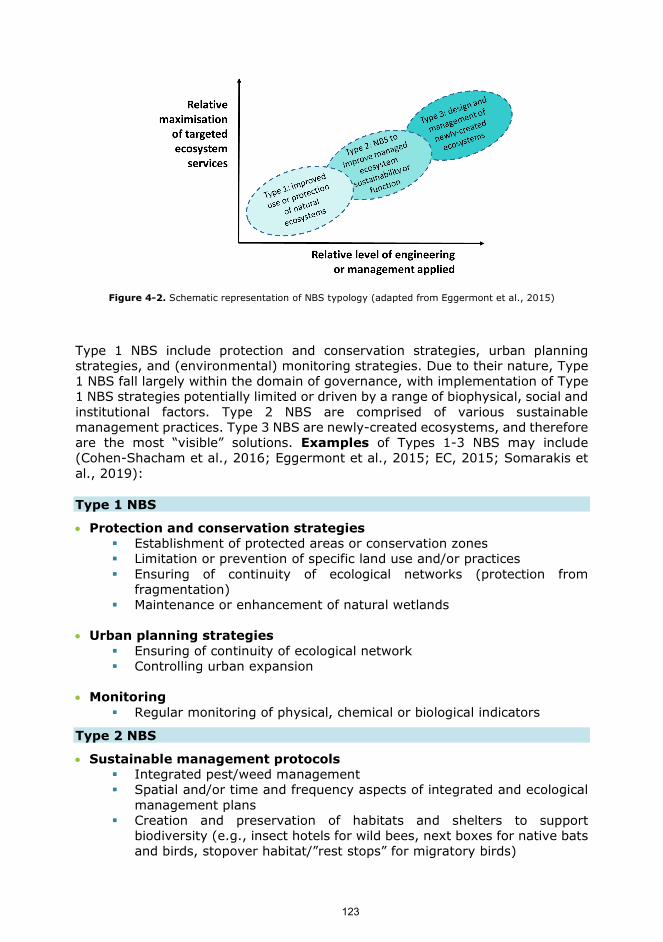
Place Regeneration: Urbanisation has a lasting impact on the natural environment of towns and cities, not only visible through dereliction, but also through increasing environmental footprint fuelled by economic growth and unsustainable patterns of consumption. Nature-based solutions hold the potential to contribute to the aim of ensuring successful achievement of sustainable place regeneration by way of enhancing the green space and people-nature connection, as well as using fewer environmental resources, enhancing place resilience to natural disasters, fostering collective participation and social cohesion, and improving individual wellbeing (Korkmaz and Balaban, 2020; Roberts and Sykes, 2000; Xiang et al., 2017).
Knowledge and Social Capacity Building for Sustainable Urban Transformation: Sustainable urban transformation delineates sustainable urban structures and environments, as well as radical social, economic, cultural, organizational, governmental, and physical change processes (Ernst et al., 2016; McCormick et al., 2013). Knowledge and social capacity building through educational initiatives can contribute to the complex enterprise of amassing resources for sustainable urban places. This challenge area is a new addition to

120
the original ten challenges described in the EKLIPSE Expert Working Group impact evaluation framework (Raymond et al., 2017).
Participatory Planning and Governance: Nature-based solutions demand approaches to planning and governance frameworks that support accessibility to green spaces, while maintaining their quality for ecosystem services provision. Urban environmental transformation is a highly complex undertaking that requires open collaborative governance and robust capacities for participatory planning. Nature-based solutions already implemented and functional across Europe have contributed a wealth of knowledge in the area of participatory planning and governance, indicating, for instance, that successful outcomes call for openness to learning and experimenting along other urban actors so as to co-create and co-maintain nature-based solutions while shaping institutional spaces in cities that allow for this co-creation, social innovation and collaboration to continue (Frantzeskaki, 2019). Significantly, open collaborative governance and participatory planning invested in nature-based solution strategies bring forward opportunities for social transformation and increased social inclusiveness in cities (Wendling et al., 2018).
Social Justice and Social Cohesion: Nature-based solutions have been linked to the notion of environmental justice across studies that explore the role of supporting urban processes involving equal access to neighbourhood green space in fostering social cohesion (e.g., bridging and bonding social capital) towards the cultural integration of typically-excluded social groups, like elderly, immigrants, persons with disabilities, etc. (i.e., recognition-based justice) (Ibes, 2015; Kweon et al., 1998; Raymond et al., 2017; Raymond et al., 2016; van Den Berg et al., 2017). Recently, Gentin et al. (2019) analysed the premises for a nature-based integration of immigrants in Europe and urged on researchers to set aside descriptions and analyses of immigrants’ perceptions or use of nature, and turn their focus towards exploring and developing nature-based solutions for the purposes of social integration.
Health and Wellbeing: Critical social and environmental determinants of health, including clean air, safe drinking water, sufficient food and secure shelter, are impacted by climate change44. More than half of the world’s population lives in urban areas (towns and cities), and this number is projected to increase to two in three people by 205045. Climate change and other environmental issues affect all categories of population, however it is most threatening in urban areas where the majority of the population live. This means that the consequences of climate change, poor air quality and other current concerns are often very obvious and disruptive to urban living, and can affect services such as sanitation leading to public health issues.
New Economic Opportunities and Green Jobs: Key criteria of NBS are their cost-effectiveness, and their capacity to simultaneously provide environmental, social and economic benefits in support of resilience building. The adoption and implementation of NBS has the potential to create new economic opportunities
44 https://www.who.int/news-room/fact-sheets/detail/climate-change-and-health 45 http://www.un.org/en/development/desa/news/population/world-urbanization-prospects-2014.html

121
and jobs in the green sector by enabling low-carbon, resource-efficient and socially inclusive economic growth. Within this paradigm, economic growth is driven by public and private investment in activities, infrastructure and assets that support reduced emissions of carbon and pollutants, and increased energy and resource efficiency whilst enhancing biodiversity and the provision of ecosystem services.
4.2 Recommended and Additional indicators for NBS impact assessment
The NBS impact evaluation relies strongly on the adoption of quantitative and qualitative impact markers – the performance and impact indicators. These serve as means for assessing the progress of an adopted pathway targeted at achieving specific objectives, including those of various temporal and spatial scales. The Recommended indicators for each of the twelve societal challenge areas presented herein serve as a ‘starting point’ for evaluating the NBS impact, and they are considered as the primary indicators to be addressed when creating NBS monitoring and evaluation schemes. The Recommended indicators listed herein represent a foundation of performance and impact indicators to be considered for all NBS projects and that they should also provide sufficient flexibility to be applicable to all NBS scenarios.
The list of Additional indicators comprise the remaining NBS performance and impact indicators adopted by the H2020 NBS project teams involved in the production of this Handbook (see Chapter 1), and can be used to complement the list of Recommended indicators for a more holistic assessment. The selection of Additional indicators aligns with specific NBS project objectives. Some examples of Additional indicator selection are presented in the following chapter (Chapter 5).
A suite of Recommended and Additional indicators for each of the twelve identified societal challenge areas are outlined in the following sub-sections. Indicators of NBS impact have been classified as structural, process or outcome based (Donabedian, 1966) to support the selection of a suite of indicators that holistically address the process of NBS co-creation, co-implementation and co-management.
• Structural indicators (S) – refer to supporting infrastructure and resources in place to achieve the desired goals (people, material, policies and procedures)
• Process indicators (P) – refer to the efficiency, quality, or consistency of specific procedures employed to achieve the desired goals
• Outcome indicators (O) – refer to accomplishments or impacts
Whilst this classification does not explicitly refer to the timing of indicator use, it follows that the structural indicators may be most useful during the planning of NBS, i.e., to determine what resources or supporting policies may be needed to ensure the success of the proposed NBS action. The process indicators are useful

122
to evaluate the methods used to co-create, co-implement and co-manage NBS, and so can be applied throughout the adaptive management cycle but are most relevant during periods of intense activity. A large proportion of the NBS impact indicators listed herein are primarily focused on the impact or end result of NBS actions.
Note that nearly all of the indicators listed here can be used prior to NBS implementation to establish an understanding of pre-NBS, or ‘baseline’, conditions as well as during and following NBS actions. Comparison of pre-NBS measures with additional measurements during or following NBS implementation will show how conditions change with time. Measurements collected over time can be used to illustrate the longer-term impacts of NBS and how different outcomes are realised with time. It is important to be careful interpreting data, as not all observed changes can necessarily be directly attributed to NBS actions. In some cases the impacts of NBS may be more clear when comparing measurements taken at the same time at two different sites, i.e., the NBS site and an analogous location without NBS (a ‘control site’). This is particularly important when there are multiple changes to an area or there are external influences on the system, such as significant changes to hydrologic regime from the original ‘baseline’ condition.
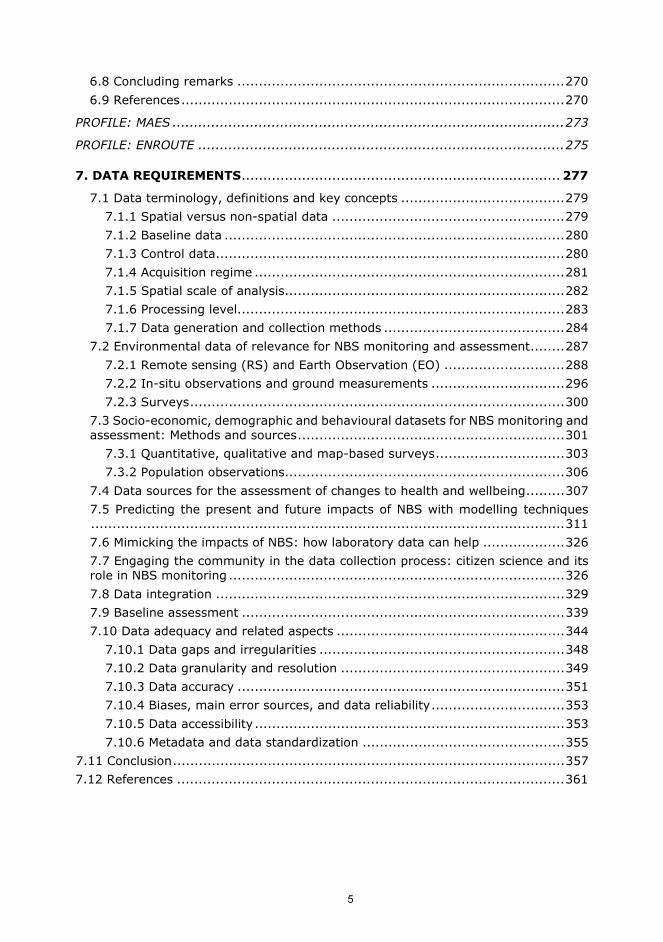
The following tables also show the applicability of each indicator to different types of NBS. Nature-based solutions can be broadly grouped based upon their primary objective or function and by the level of ecosystem intervention. The following NBS typology proposed by Eggermont et al. (2015) has been widely adopted (Figure 4-2):
• Type 1 NBS – minimal or no intervention in ecosystems, with objectives related to maintaining or improving delivery of ecosystem services within and beyond the protected ecosystems
• Type 2 NBS – extensive or intensive management approaches seeking to develop sustainable, multifunctional ecosystems and landscapes in order to improve delivery of ecosystem services relative to conventional interventions
• Type 3 NBS – characterised by highly intensive ecosystem management or creation of new ecosystems
123
Figure 4-2. Schematic representation of NBS typology (adapted from Eggermont et al., 2015)
Type 1 NBS include protection and conservation strategies, urban planning strategies, and (environmental) monitoring strategies. Due to their nature, Type 1 NBS fall largely within the domain of governance, with implementation of Type 1 NBS strategies potentially limited or driven by a range of biophysical, social and institutional factors. Type 2 NBS are comprised of various sustainable management practices. Type 3 NBS are newly-created ecosystems, and therefore are the most “visible” solutions. Examples of Types 1-3 NBS may include (Cohen-Shacham et al., 2016; Eggermont et al., 2015; EC, 2015; Somarakis et al., 2019):
Type 1 NBS
• Protection and conservation strategies � Establishment of protected areas or conservation zones � Limitation or prevention of specific land use and/or practices � Ensuring of continuity of ecological networks (protection from
fragmentation) � Maintenance or enhancement of natural wetlands
• Urban planning strategies
� Ensuring of continuity of ecological network � Controlling urban expansion
• Monitoring
� Regular monitoring of physical, chemical or biological indicators
Type 2 NBS
• Sustainable management protocols � Integrated pest/weed management � Spatial and/or time and frequency aspects of integrated and ecological
management plans � Creation and preservation of habitats and shelters to support
biodiversity (e.g., insect hotels for wild bees, next boxes for native bats and birds, stopover habitat/”rest stops” for migratory birds)

124
� Installation of apiaries � Sustainable fertiliser use � Control of erosion through management of grazing animal stocking
density and exclusion of grazing animals from riparian areas � Composting of organic wastes and reuse of composted material � Integrated water resource management � Protection of plant resources from pest and disease � Aquifer protection from pollution and sustainable management of
withdrawals
Type 3 NBS
• Green space - multifunctional open space characterised by natural vegetation and permeable surfaces
� Urban parks and gardens of all sizes � Heritage park � Botanical garden � Community garden � Cemetery � Schoolyards and sports fields � Meadow � Green strips � Green transport track � “Multifunctional” dry detention pond or vegetated drainage basin
• Trees and shrubs
� Forests (including afforestation) � Orchards � Vineyards � Hedges/shrubs/green fences � Street trees
• Soil conservation and quality management
� Slope revegetation � Cover crops � Windbreaks � Conservation tillage practices � Permaculture � Deep-rooted perennials � Organic matter enrichment (manure, biosolids, green manure, compost,
etc.) � Inorganic soil conditioners and amendments (biochar, vermiculite, etc.)
• Blue-green space establishment or restoration
� Riparian buffer zones � Mangroves � Saltmarsh/seagrass � Intertidal habitats � Dune structures
• Green built environment
� Green roof

125
� Green-blue roof � Green wall/façade � Green alley � Infiltration planters and tree boxes � Temporary and/or small-scale interventions including green furniture,
green living rooms, etc.
• Natural or semi-natural water storage and transport structures � Surface wetland � Floodplains, floodplain reconnection with rivers � Restoration of degraded waterbodies � Restoration of degraded waterways, including re-meandering of
streams and river daylighting � Retention pond/wet detention pond
• Infiltration, filtration, and biofiltration structures
� Infiltration basin � Vegetated filter strip � Rain garden � Wet/dry vegetated swale, with or without check dams � Subsurface wetland or filtration system � Bioretention basin/bioretention cell
The preceding list of NBS is non-exhaustive and is intended only to provide examples of different types of NBS per the Type 1-3 classification system. The tables in this chapter indicate in general whether a particular indicator is applicable to Type 1, 2 or 3 NBS; however, the wide variety of NBS actions make consideration of all possible combinations of NBS and indicator application quite challenging. The NBS type 1-3 indicator applicability shown in the following tables should be considered a guide.
4.2.1 Climate Resilience
Indicators in the Climate Resilience challenge area primarily address:
• Direct impacts of NBS on greenhouse gas emissions via carbon storage and sequestration in vegetation and soil;
• Indirect impacts of NBS on avoided greenhouse gas emissions from various activities, through the provision of passive cooling, insulating and/or water treatment; and,
• Impacts of NBS on temperature and human comfort
Primary among the Recommended indicators for the Climate Resilience challenge area is carbon sequestration. Accounting for C stored in soil and vegetation, particularly in an urban area, can provide a tangible evaluation of local climate change mitigation and

126
the impacts of local land use, planning and decision-making. This is reflected by the total quantity of carbon removed or stored in soil and vegetation (indicator 1.1) as it provides a measure for direct carbon sequestration by NBS. In contrast, the quantity of avoided greenhouse gas emissions due to reduced building consumption (indicator 1.2) reflects the cooling and/or insulating capacity of NBS, resulting in lesser energy use for building cooling or heating.
Nature-based solutions can be an effective means to combat urban heat islands. Although NBS cannot alter the weather, the presence of (large-scale) NBS may provide sufficient cooling to locally mitigate high temperatures during heat wave events. NBS can support reduced energy use and improved thermal comfort by moderating the urban microclimate (Demuzere et al., 2014), which is reflected by monthly mean daily maximum (TXx, indicator 1.3) and minimum (TNn, indicator 1.4) temperature, which provide a measure of the local cooling or warming effect of NBS. These indicators are related both to building energy use as well as human comfort. Indicator 1.5, heatwave incidence, reflects prolonged periods of abnormally high temperatures, and can be used to measure the local impact of NBS on ambient temperatures during these periods,
Additional indicators are listed that can be employed to quantify specific parameters generally related to NBS-provided ecosystem services in support of climate resilience. They can further be utilised to complement the assessment of the Recommended indicators for generating a more holistic picture of the local NBS performance.
Table 4-1. Indicators related to Climate Resilience classified as structural (S), process focused (P) or outcome-based (O) indicators and their general applicability to different types of NBS
No. Indicator Units Class Applicability to NBS†
Type 1 Type 2 Type 3
RECOMMENDED
1.1
Total carbon removed or stored in vegetation and soil per unit area per unit time
kg/ha/y O ● ● ●
1.2
Avoided greenhouse gas emissions from reduced building energy consumption
t CO2e/y O ● ●
1.3 Monthly mean value of daily maximum temperature (TXx)
°C O ● ●
1.4 Monthly mean value of daily minimum temperature (TNn)
°C O ● ●

127
1.5
Heatwave incidence: Days with temperature >90th percentile, TX90p
No./y O ● ●
ADDITIONAL
2.1.1 2.1.2
Total carbon stored in vegetation kg/ha/y O ● ● ●
2.1.3 Total leaf area m2 O ● ● ●
2.1.4 Carbon storage score kg/day O ● ● ●
2.1.5 2.1.6 Soil carbon content ton/ha O ● ● ●
2.1.7 Rate of soil carbon decomposition % p.a. O ● ● ●
2.2 Energy use savings due to NBS implementation
kWh/y O ● ●
2.3 Carbon emissions due to building cooling
t CO2e/y O ●
2.4
Carbon emissions due to treatment of runoff water (combined sewers)
t CO2e/y O ● ● ●
2.5 Soil temperature °C O ● ● ●
2.6 Total surface area of wetlands ha O ● ● ●
2.7 Surface area of restored and/or created wetlands
ha O ● ● ●
2.8 Aboveground tree biomass t/ha O ● ● ●
2.9.1 Human comfort: Universal Thermal Climate Index
°C O ● ●
2.9.2 Thermal Comfort Score unitless O ● ●
2.9.3
Human comfort: Physiological Equivalent Temperature
°C O ● ●

128
†Type 1 NBS – minimal or no intervention in ecosystems, with objectives related to maintaining or improving delivery of ecosystem services within and beyond the protected ecosystems Type 2 NBS – extensive or intensive management approaches seeking to develop sustainable, multifunctional ecosystems and landscapes in order to improve delivery of ecosystem services relative to conventional interventions Type 3 NBS – characterised by highly intensive ecosystem management or creation of new ecosystems
2.9.4
Mean or peak daytime temperature – Predicted Mean Vote-Predicted Percentage Dissatisfied
unitless O ● ●
2.10.1 Urban Heat Island (incidence) °C O ● ●
2.10.2 Number of combined tropical nights and hot days
No. O ● ●
2.10.3 Thermal Storage Score J O ● ●
2.10.4 Thermal Load Score °C O ● ●
2.11 Peak summer temperature (GI-Val)
°C O ● ●
2.12 Maximum surface cooling °C O ● ●
2.13.1 2.13.2
Mean local daytime temperature °C O ● ●
2.13.1 2.13.2
Peak local daytime temperature °C O ● ●
2.14 Daily temperature range °C O ● ●
2.15 2.15.1 2.15.2
Air cooling °C O ● ●
2.16 Tree shade for local heat reduction m2 O ● ● ●
2.17 Rate of evapotranspiration mm/day O ● ● ●
2.18 Land surface temperature °C O ● ● ●
2.19 Surface reflectance - albedo unitless O ● ●
2.20 Carbon emissions from vehicle traffic t C/y O ● ●

129
4.2.2 Water Management
The diversity of potential benefits, co-benefits, and trade-offs related to NBS use for water management is reflected in the comprehensive list of Recommended indicators presented. These Recommended indicators were selected by members of a range of EU H2020 NBS projects working across urban, peri-urban, and rural areas. The Recommended list is representative of this diversity of approaches.
From the comprehensive list of Water Management indicators proposed by the H2020 NBS project teams, the list of Recommended Indicators was selected based on those that were considered to be the key drivers of nature-based solution implementation, and thus those that were relevant to the highest proportion of nature-based solution initiatives. The indicators selected as Recommended address the potential benefits, co-benefits, and trade-offs associated with changes to surface water runoff volume (3.1) and to water quality (3.2-3.6).
The Additional indicators address a wide range of applicable metrics for the assessment of NBS impact from a broad perspective, further exploring potential impacts on soil-water interactions, additional aspects of stormwater and excess runoff management, and actions pertinent to the implementation of the Water Framework Directive46, including quantitative, hydromorphological, ecological and physico-chemical status of surface and groundwaters.
Table 4-2. Indicators related to Water Management classified as structural (S), process focused (P) or outcome-based (O) indicators and their general applicability to different types of NBS
46 Directive 2000/60/EC, OJ L 327, 22.12.2000
No. Indicator Units Class Applicability to NBS†
Type 1 Type 2 Type 3
RECOMMENDED
3.1 Surface runoff in relation to precipitation quantity
mm/% O ● ● ●
3.2 Water quality: general urban various O ● ● ●
3.3 Water quality: TSS content mg/L O ● ● ●
3.4 Nitrogen and phosphorus concentration or load
% O ● ● ●

130
3.5 Metal concentration or load % O ● ● ●
3.6
Water quality: total faecal coliform bacteria content of NBS effluents
No. O ● ● ●
ADDITIONAL
4.1 4.2 Infiltration rate % or
mm/h O ● ● ●
4.1 4.2 Infiltration capacity mm/d O ● ● ●
4.3 Rate of evapotranspiration
mm/m2 day O ● ● ●
4.4 Peak flow variation % O ● ● ●
4.5 Flood peak reduction % O ● ● ●
4.5 Flood peak delay h O ● ● ●
4.6 Height of flood peak m3/s O ● ● ●
4.6 Time to flood peak h O ● ● ●
4.7 Flood Excess Volume m3 O ● ● ●
4.8 Rainfall interception of NBS mm/h O ● ● ●
4.9 Runoff rate for different rainfall events
m3/s O ● ● ●
4.10 Run-Off Score (ROS) unitless O ● ● ●
4.11 Rainfall storage capacity of NBS mm/% O ● ● ●
4.12 Quantitative status of groundwater
Good or Poor O ● ● ●
4.13 Depth to groundwater m O ● ● ●
4.14 Chemical status of groundwater
Good or Poor O ● ● ●

131
4.15 Trend in piezometric levels m3/y O ● ● ●
4.16 Groundwater Exploitation Index % O ● ● ●
4.17 Aquifer surface ratio with excessive nitrate % O ● ● ●
4.18 Aquifer surface ratio with excessive arsenic
% O ● ● ●
4.19 Rainwater or greywater use for irrigation purposes
m3/y O ● ● ●
4.20 Water Exploitation Index % O ● ● ●
4.21 Water dependency for food production m3 O ● ● ●
4.22 Calculated drinking water provision m3/ha/y O ● ● ●
4.23 Net surface water availability m3/y O ● ● ●
4.24
Volume of water removed from wastewater treatment system
m3/y O ● ● ●
4.25
Volume of water slowed down entering sewer system
m3/s O ● ● ●
4.26 Total surface area of wetlands ha O ● ● ●
4.27 Surface area of restored and/or created wetlands
ha O ● ●
4.28 Soil water saturation % O ● ● ●
4.29 Soil water retention capacity m3/m3 O ● ● ●
4.30 Stemflow rate mm/h O ● ● ●
4.31 Percolation rate under different rainfall events
mm/d O ● ● ●

132
4.32 Dissolved oxygen content of NBS effluents
mg/L O ● ● ●
4.33 Eutrophication unitless O ● ● ●
4.34 pH of NBS effluents unitless O ● ● ●
4.35 Electrical conductivity of NBS effluents
µS/cm O ● ● ●
4.36 Physico-chemical quality of surface waters
High, Good,
Moderate, Poor, Bad
O ● ● ●
4.37 Total pollutant discharge to local waterbodies
unitless O ● ● ●
4.38 Water quality: basic physical parameters various O ● ● ●
4.39 Total PAH content of NBS effluents ng/L O ● ● ●
4.40 Total organic carbon content of NBS effluents
mg/L C O ● ● ●
4.41 General ecological status of surface waters
High, Good,
Moderate, Poor, Bad
O ● ● ●
4.42
Ecological potential for heavily modified or artificial water bodies
Maximum, Good,
Moderate, Poor, Bad
O ● ● ●
4.43 Biological quality of surface waters
High, Good,
Moderate, Poor, Bad
O ● ● ●
4.44
Extended Biotic Index: total number and species richness of aquatic macroinvertebrates
unitless O ● ● ●
4.45 Morphological Quality Index unitless O ● ● ●
4.46 Hydromorphological quality of surface waters
High, Good,
Moderate, Poor, Bad
O ● ● ●

133
†Type 1 NBS – minimal or no intervention in ecosystems, with objectives related to maintaining or improving delivery of ecosystem services within and beyond the protected ecosystems Type 2 NBS – extensive or intensive management approaches seeking to develop sustainable, multifunctional ecosystems and landscapes in order to improve delivery of ecosystem services relative to conventional interventions Type 3 NBS – characterised by highly intensive ecosystem management or creation of new ecosystems
4.2.3 Natural and Climate Hazards
Indicators of NBS impact with respect to natural and climate hazards provided in this list are expected to be useful to measure the effectiveness of NBS. Application of these indicators will enable measurement of the effects of NBS on risk due to natural and climatic hazards (reduction of risk, effect on one risk component). Recommended indicators relate to three main categories and correspond to several levels of integration ranging from global policy objectives to hazard specific indicators.
Recommended indicators are more integrated and can be used to assess NBS effectiveness:
• Global policy (5.1, 5.2): These integrated indicators correspond to the way risk perception/culture is affected by the measure. Indicator 5.1 is itself the result of a lengthy assessment process and aggregation of several criteria.
• Vulnerability (5.3, 5.4, 5.5)
• Hazard and threat (5.6)
Additional indicators are mainly basic, unitary indicators primarily related to hazard intensity. They are broadly listed by types of hazard (e.g., floods, coastal erosion, landslides, water availability, and heat waves). It should be noted that this list is non-exhaustive; however, the indicators provided herein can provide the basis for a comprehensive NBS performance and impact monitoring scheme focused on evaluating NBS with respect to disaster risk.
4.47 Fluvial Functionality Index unitless O ● ● ●

134
Table 4-3. Indicators related to Natural and Climate Hazards classified as structural (S), process focused (P) or outcome-based (O) indicators and their general applicability to different types of NBS
No. Indicator Units Class Applicability to NBS†
Type 1 Type 2 Type 3
RECOMMENDED
5.1 Disaster Resilience unitless S ● ● ●
5.2 Disaster-risk informed development
unitless S ●
5.3
Mean annual direct and indirect losses due to natural and climate hazards
€ O ● ● ●
5.4 Risk to critical urban infrastructure % O ● ● ●
5.5
Number of people adversely affected by natural disasters each year
unitless O ● ● ●
5.6 Multi-hazard early warning unitless S ●
ADDITIONAL
6.1.1 Urban/residential areas exposed to risks
ha O ● ● ●
6.1.2 Productive areas exposed to risks ha O ● ● ●
6.2
Natural Areas, Site of Community Importance (SCI), Special Protection Areas (SPA) exposed to risks
ha O ●
6.3.1 Inhabitants exposed to risks No./ha O ● ● ●
6.3.2 Area exposed to flood risk ha O ● ● ●
6.3.2 Local population exposed to flood risk
No./ha O ● ● ●

135
6.3.3
Other people (workers, tourists, homes) exposed to risk
No./ha O ● ● ●
6.3.4 Elderly, children, disabled exposed to risk
No./ha O ● ● ●
6.4 6.4.1
Population vulnerable to risks No./ha O ● ● ●
6.5.1 Housing potentially exposed to risks No. O ● ● ●
6.5.2
Agricultural and industrial buildings potentially exposed to risks
No. O ● ● ●
6.5.3 Strategic buildings exposed to risk No. O ● ● ●
6.6.1 Roads exposed to risk m/km2 O ● ● ●
6.6.2 Railways exposed to risk m/km2 O ● ● ●
6.6.3 Lifelines exposed to risk m/km2 O ● ● ●
6.7.1 Buildings vulnerable to risks No./km2 O ● ● ●
6.7.2
Transportation infrastructure and lifelines vulnerable to risks
m/km2 O ● ● ●
6.8 Insurance against catastrophic events % P ●
6.9 Flood hazard unitless O ● ● ●
6.10 Flooded area ha O ● ● ●
6.11 Height of flood peak m3/s O ● ● ●
6.11 Time to flood peak h O ● ● ●
6.12 Peak flow rate m3/s O ● ● ●
6.13 Peak flood volume m3 O ● ● ●

136
6.14 Flood Excess Volume m3 O ● ● ●
6.15 Moisture Index unitless O ● ● ●
6.16 Flammability Index unitless O ● ● ●
6.17 Soil type unitless, qualitative S ●
6.18 Soil shear strength kPa S ●
6.18 Soil cohesion kPa S ●
6.19 Soil temperature °C O ● ● ●
6.20 Level of groundwater table
m below ground surface
O ● ● ●
6.21 Slope stability factor of safety unitless O ● ● ●
6.22 Landslide safety factor unitless O ● ● ●
6.23 Landslide risk – history of instability on site
unitless; binominal (yes/no)
S ●
6.24 Occurred landslide area % S ●
6.25 Landslide risk % O ● ● ●
6.26 Soil mass movement kg/ha O ● ● ●
6.27 Velocity of occurred landslide m/s O ●
6.28 Erosion risk m3/year O ● ● ●
6.29 Total predicted soil loss t/ha/y O ● ● ●
6.30 Days with temperature >90th percentile, TX90p
% O ● ● ●
6.31 Warm Spell Duration Index unitless O ● ● ●

137
†Type 1 NBS – minimal or no intervention in ecosystems, with objectives related to maintaining or improving delivery of ecosystem services within and beyond the protected ecosystems Type 2 NBS – extensive or intensive management approaches seeking to develop sustainable, multifunctional ecosystems and landscapes in order to improve delivery of ecosystem services relative to conventional interventions Type 3 NBS – characterised by highly intensive ecosystem management or creation of new ecosystems
6.32 Heatwave incidence No./y O ● ● ●
6.33 Human comfort: Universal Thermal Climate Index
°C O ● ● ●
6.34
Human comfort: Physiological Equivalent Temperature
°C O ● ● ●
6.35
Mean or peak daytime temperature – Predicted Mean Vote-Predicted Percentage Dissatisfied
unitless O ● ● ●
6.36 Urban Heat Island (incidence) °C O ● ● ●
6.37 Effective Drought Index unitless O ● ● ●
6.38 Standardised Precipitation Index unitless S ●
6.39 Quantitative status of groundwater Good or Poor O ● ● ●
6.40 Trend in piezometric levels m3/y O ● ● ●
6.41 Groundwater exploitation index % O ● ● ●
6.42 Calculated drinking water provision m3/ha/y O ● ● ●
6.43 Water Exploitation Index % O ● ● ●
6.44 Net surface water availability m3/y O ● ● ●
6.45 Rainwater or greywater use for irrigation purposes
m3/y O ● ● ●
6.46 Avalanche risk: Snow cover map unitless S ●

138
4.2.4 Green Space Management
The management of UGI interventions has impact at a range of scales, from building and street level to district, urban, regional, national and transnational level. Green spaces, or UGI, are a key component of many urban planning and climate change adaptation and mitigation strategies. Related actions are included in several transnational initiatives including, for example, the EU Strategy on Green Infrastructure and the EU Biodiversity strategy (EC, 2013; EC, 2019b; EC, 2020). Section 2.2.8. Greening urban and peri-urban areas of the EU Biodiversity Strategy to 2030 makes explicit reference to UGI, stating: ’... This strategy aims to ... stop the loss of green urban ecosystems. The promotion of healthy ecosystems, green infrastructure and nature-based solutions should be systematically integrated into urban planning, including in public spaces, infrastructure, and the design of buildings and their surroundings’ (EC, 2020, p. 13).
Urban green spaces provide a broad range of benefits through the maintenance of ecological function and by contributing to the enhancement of biodiversity (Benedict et al., 2006; Maes et al., 2020). Strategically deployed and managed UGI can be multi-functional, providing a wide range of regulating and provisioning ecosystem services alongside a range of cultural and social values. Some of the ecosystem services provided by green space that are particularly relevant in urban areas include air quality and microclimate regulation, protection against flooding, pollination, recreation and other cultural services (Haase et al., 2014).
The quantity, quality and distribution of green-blue areas is particularly important for urban ecosystems, human well-being and social cohesion (Raymond et al., 2017; Sinnet, 2017; Tzoulas et al., 2017). The benefits provided by UGI are strongly related to other challenge areas. The objective of the Green Space Management indicators identified herein is to provide a means to assess the quantity, quality and distribution of green space within cities and their availability for citizens. Quantity and distribution of UGI are measured considering different typologies of urban green areas and using as a reference value the total surface of the city or the total population. The quality of UGI is reported using indicators related to soil, vegetation, water condition, capacity to provide local food.
The availability of UGI for citizens is measured in terms of accessibility and can be combined with other indicators to understand users’ preferences and behaviours, and the availability of facilities that support nature-based activities. Numerous methods are available to evaluate green space accessibility (Handy and Niemeier, 1997; Páez et al., 2012). Herein, we propose two approaches:
• A relatively simple method that can be easily applied at district and municipal level and implements parameters recommended by the World Health Organisation (WHO, 2016; WHO, 2017); and,
• A more complex potential accessibility measure which considers the cumulative opportunities for nature based recreation and the probability to reach them according to a function of the distance (Páez et al., 2012).
Other important indicators of Green Space Management, shown herein under Additional indicators, provide an overview of urban land use intensity considering,

139
for example, land use types and changes, surface sealing (Maes et al., 2019) and local networks of pedestrian and bicycle paths.
Table 4-4. Indicators related to Green Space Management classified as structural (S), process focused (P) or outcome-based (O) indicators and their general applicability to different types of NBS
No. Indicator Units Class Applicability to NBS†
Type 1 Type 2 Type 3
RECOMMENDED
7.1 Green space accessibility % O ● ●
7.2 Share of green urban areas Number (0-1) O ● ●
7.3 Soil organic matter content % O ● ● ●
7.3.1 Soil organic matter index Number (0-1) O ● ● ●
ADDITIONAL
8.1 Ecosystem services provision N/A; descriptive O ● ● ●
8.2
Annual trend in vegetation cover in urban green infrastructure
% O ●
8.3 Edge density m/ha O ● ●
8.4 Public green space distribution ha per capita O ● ●
8.5 Distribution of blue space % O ● ●
8.6
Effective green infrastructure at the urban-rural interface
% S ●
8.7 Hot spot in peri-urban green infrastructure
% S ● ●

140
8.8 Biotope Area Factor % O ● ● ●
8.9 Total vegetation cover % O ● ● ●
8.9.1 Woody vegetation cover % O ● ● ●
8.9.2 Non-woody vegetation cover % O ● ● ●
8.9.3 Total leaf area m2 O ● ● ●
8.10 Diversity of green space unitless O ● ● ●
8.11
Stages of forest stand development -Number of class diameter
No. of individuals O ● ● ●
8.12 Tree regeneration number O ● ● ●
8.13 Canopy gaps dychotomic (Yes/No) O ● ● ●
8.14 Tree biomass stock change t/ha/y O ● ● ●
8.15.1 Measured soil carbon content t/ha/y O ● ● ●
8.15.2 Modelled carbon content t/ha O ● ● ●
8.15.3 Soil carbon to nitrogen ratio unitless O ● ● ●
8.15.4 Soil carbon decomposition rate % O ● ● ●
8.16 Soil matric potential kPa O ● ● ●
8.17 Soil temperature °C O ● ● ●
8.18 Soil water holding capacity mm/cm depth O ● ● ●
8.19.1 Plant-available water mm/cm depth O ● ● ●

141
8.19.2 Soil Available Water (SAW) for plant uptake
mm/cm depth O ● ● ●
8.20 Vegetation wilting point % O ●
8.21 Degree of soil saturation % O ● ● ●
8.22 Stemflow funnelling ratio unitless O ● ● ●
8.23 Soil erodibility mm3/ha O ● ● ●
8.24 Total predicted soil loss t/ha/y O ● ● ●
8.25 Soil ecotoxicological factor
Number (0-1) O ● ● ●
8.26 Soil structure unitless S ●
8.27 Soil chemical fertility/ cation exchange capacity
meq/100 g O ●
8.28 Flammability Index unitless O ●
8.29 Community garden area m2 per capita O ● ●
8.30 Food production in urban allotments and NBS
t/ha/y O ● ●
8.31
Recreational opportunities provided by green infrastructure
Interactions/week O ● ● ●
8.31.1 ESTIMAP nature-based recreation % O ● ● ●
8.31.2 8.31.3
Number of visitors to recreational areas
No. O ● ● ●
8.31.3 Purpose of visits to recreational areas unitless O ● ● ●
8.31.4 Frequency of use of green and blue spaces
h/week O ● ● ●

142
†Type 1 NBS – minimal or no intervention in ecosystems, with objectives related to maintaining or improving delivery of ecosystem services within and beyond the protected ecosystems Type 2 NBS – extensive or intensive management approaches seeking to develop sustainable, multifunctional ecosystems and landscapes in order to improve delivery of ecosystem services relative to conventional interventions Type 3 NBS – characterised by highly intensive ecosystem management or creation of new ecosystems
8.31.5 Activities allowed in recreational areas
No. S ●
8.32 Visual access to green space Number (0-4) O ● ●
8.32 Time spent viewing green space from residence each day
Number (0-3) O ● ●
8.32.1 Viewshed km2 O ● ●
8.32 Satisfaction with green and blue spaces
Number (1-5) O ● ● ●
8.34 Betweenness centrality unitless O ● ●
8.35
Proportion of road network dedicated to pedestrians and/or bicyclists
% S ●
8.35.1 New pedestrian, cycling and horse paths
km O ● ●
8.35.2 Sustainable transportation modes allowed
Number S ●
8.36 Links between urban centres and NBS
Number S ●
8.37 Walkability Number O ● ● ●
8.38 Land composition % use class A, N, D, M O ● ●
8.39 Land use change and green space configuration
various O ● ●
8.40 Soil sealing % O ● ●
8.41 Ambient pollen concentration Number O ● ● ●

143
4.2.5 Biodiversity Enhancement
The fragmentation of green space is a significant impact of urbanisation and can reduce intra- and inter-species connectivity, leading to a loss of biodiversity. Thus, the structural and functional connectivity of natural areas (green and blue spaces) are key among Recommended indicators of biodiversity (indicators 9.1.1 and 9.1.2). Several indicators are recommended related to the presence of native non-native or alien invasive species (e.g., 9.2, 9.3 and 9.3.1). These indicators strongly support biodiversity initiatives focused on the re-introduction or maintenance of local fauna and flora.
Both the Shannon Diversity Index (9.4) and Shannon Evenness Index (9.5) are recommended indicators of biodiversity. The Shannon Diversity Index is commonly used to evaluate species diversity within a defined area. Whilst the Shannon Diversity Index does not qualify whether the species present are native, non-native or alien invasive, it accounts for the number of different species observed within a given space and their relative abundances. The Shannon Evenness Index provides information about the relative number of individuals of each species in a given area.
Numerous additional indicators of biodiversity can support evaluation of the complexity and multidimensionality of local ecosystems in order to underpin spatial planning, prioritise sites for interventions and assess the impacts of NBS initiatives on existing green networks.
Table 4-5. Indicators related to Biodiversity Enhancement classified as structural (S), process focused (P) or outcome-based (O) indicators and their general applicability to different types of NBS
No. Indicator Units Class Applicability to NBS†
Type 1 Type 2 Type 3
RECOMMENDED
9.1 9.1.1
Structural connectivity of urban green and blue spaces
various O ● ●
9.1 9.1.2
Functional connectivity of urban green and blue spaces
various O ● ● ●
9.2 Number of native species Number O ● ● ●
9.3 Number of non-native species introduced
Number O ● ● ●
9.3.1 Number of invasive alien species Number O ● ● ●

144
9.4 Species diversity within a defined area
Number O ● ● ●
9.5 Number of species within a defined area
Number O ● ● ●
ADDITIONAL
10.1 Proportion of natural areas within a defined urban zone
% O ● ●
10.2 Area of habitats restored ha O ● ● ●
10.3 Shannon Diversity Index of habitats
Number (unitless) O ● ● ●
10.3.1 Abundance of ecotones/ Shannon diversity
unitless O ● ● ●
10.4 Length of ecotones km O ● ● ●
10.5 Publicly accessible green space connectivity
% O ● ● ●
10.6 Ecological integrity % O ● ● ●
10.7 Proportion of protected areas % O ●
10.7.1
Sites of community importance and special protection areas
ha O ●
10.7.2 Article 17 habitat richness No./grid O ● ● ●
10.8 Number of veteran trees per unit area No./ha O ● ● ●
10.9 Quantity of dead wood per unit area m3/ha O ● ● ●
10.10
Forest habitat fragmentation – effective mesh density
1/ha O ● ● ●
10.11 Extent of habitat for native pollinator species
ha O ● ● ●

145
†Type 1 NBS – minimal or no intervention in ecosystems, with objectives related to maintaining or improving delivery of ecosystem services within and beyond the protected ecosystems Type 2 NBS – extensive or intensive management approaches seeking to develop sustainable, multifunctional ecosystems and landscapes in order to improve delivery of ecosystem services relative to conventional interventions Type 3 NBS – characterised by highly intensive ecosystem management or creation of new ecosystems
10.12 Polluted soils ha O ● ●
10.13 Food web stability unitless O ● ● ●
10.14 Carbon and nitrogen cycling in soil t/ha/y O ● ● ●
10.15 Equivalent used soil m3 O ●
10.16 Number of conservation priority species
No. O ● ● ●
10.17 Article 17 species richness No./grid O ● ● ●
10.18 Number of native bird species within a defined urban area
No./ha O ● ● ●
10.19 Species diversity - general No. O ● ● ●
10.19.1 City Biodiversity Index % O ● ● ●
10.20 Bird species richness No./grid O ● ● ●
10.21 Animal species potentially at risk No./ha O ● ● ●
10.22 Typical vegetation species cover % O ● ● ●
10.23 Pollinator species presence
No./ha or % O ● ● ●
10.24 Biodiversity conservation various O ● ● ●
10.25 Metagenomic mapping unitless O ● ● ●
10.25.1 Abundance of functional groups
Number (unitless) O ● ● ●
10.25.2 10.25.3
Diversity of functional groups
Number (unitless) O ● ● ●

146
4.2.6 Air Quality
A number of factors threaten the quality of life in European cities and in most of the world. The drivers include increasing pollution levels, urban heat islands, flooding and extreme events related to climate change, as well as decreased biodiversity (Grimm et al., 2008). These can have detrimental effects for human health and well-being.
Air quality is a major concern worldwide, particularly in urban areas, due to its direct consequences on human health, plants, animals, infrastructure and historical buildings (among others). In the political agenda, air quality issues can be coupled with climate change mitigation policies, since many actions aimed at air quality improvement involve a concurrent reduction of greenhouse gas (GHG) emissions. This is the case, for example, of reductions of fossil fuel combustion since its derived emissions contain CO2 and other GHGs and pollutants directly affecting human health. Nevertheless, measures to improve urban air quality and mitigate climate change tend to be considered separately even though many pollutants affect both environmental impacts.
The emission of the traditional air quality pollutants (AQPs) either direct or indirectly as a result of atmospheric chemistry, affect the concentrations of several climate pollutants. At the same time, the increase of air temperature due to global warming affects the concentrations of the AQPs. Some AQPs, such as ozone (O3), are also GHGs. These interactions between them are complex and can both enhance and mitigate global warming. Accordingly, a large number of abatement measures are beneficial for mitigating both impacts; however, there are some measures that may be beneficial for mitigating climate change but increase emissions of the key urban air pollutants, or vice versa.
Policies to reduce climate change and improve urban air quality have generally been considered in isolation, with more importance being paid to the mitigation of climate change than to urban air quality over recent years. In the long term, large reductions in both AQPs and GHGs are necessary to mitigate climate change and improve public health. Therefore, priority should be given to measures where there are clear co-benefits such as energy conservation measures. However, large emissions reductions from this type of measures can be difficult to achieve and there will continue to be a need to use legislation to force the adoption of low AQP emitting technologies despite some CO2 penalties.
Fuel switching to renewable fuels offers a huge potential for co-benefits, with only biomass and biofuels being problematic in terms of indirect GHG emissions from land use changes and higher emissions of particulate matter (PM) from solid biomass and gaseous pollutants from some liquid biofuel blends (Querol et al., 2016).
Air pollution is a local, pan-European and hemispheric issue. Air pollutants released in one country may be transported in the atmosphere, contributing to or resulting in poor air quality elsewhere.
Particulate matter, nitrogen dioxide and ground-level ozone, are now generally recognised as the three pollutants that most significantly affect human

147
health. Long-term and peak exposures to these pollutants range in severity of impact, from impairing the respiratory system to premature death. Around 90% of city dwellers in Europe are exposed to pollutants at higher concentrations than the air quality levels deemed harmful to health. For example, fine particulate matter (PM2.5) in air has been estimated to reduce life expectancy in the EU by more than eight months. European Union legislation sets both short-term (hourly/daily) and long-term (annual) air quality standards47 (Directive 2008/50/EU). This is reflected in and addressed by the Recommended indicators (11.1–11.3).
Air pollution also damages our environment. Problems such as acidification was substantially reduced between 1990 and 2010 in Europe's sensitive ecosystem areas that were subjected to acid deposition of excess sulphur and nitrogen compounds. Less progress was made in environmental problematics such as eutrophication, which is caused by the input of excessive nutrients into ecosystems. The area of sensitive ecosystems affected by excessive atmospheric nitrogen diminished only slightly between 1990 and 2010. High ozone concentrations also cause crop damage is caused. Most agricultural crops are exposed to ozone levels that exceed the EU long-term objective intended to protect vegetation. This notably includes a significant proportion of agricultural areas, particularly in southern, central and eastern Europe.
The Additional indicators of Air Quality focus more specifically on ambient air pollutant concentration, and the related aspects, such as pollutant removal by vegetation and associated health aspects.
Table 4-6. Indicators related to Air Quality classified as structural (S), process focused (P) or outcome-based (O) indicators and their general applicability to different types of NBS
47 http://ec.europa.eu/environment/air/quality/standards.htm; http://ec.europa.eu/environment/basics/health-wellbeing/noise/index_en.htm
No. Indicator Units Class Applicability to NBS†
Type 1 Type 2 Type 3
RECOMMENDED
11.1
Number of days during which ambient air pollution concentrations in the proximity of the NBS (PM2.5, PM10, O3, NO2, SO2, CO and/or PAHs expressed as concentration of benzo[a]pyrene) exceeded threshold
No. of days O ● ● ●

148
values during the preceding 12 months
11.2
Proportion of population exposed to ambient air pollution (PM2.5, PM10, O3, NO2, SO2, CO and/or PAHs expressed as concentration of benzo[a]pyrene) in excess of threshold values during the preceding 12 months
% O ● ● ●
11.3 European Air Quality Index
Good, Fair,
Moderate, Poor, Very
Poor, Extremely
Poor
O ● ● ●
ADDITIONAL
12.1
Removal of atmospheric pollutants by vegetation (leaves, stems and roots)
kg/ha/y O ● ● ●
12.2 Total particulate matter removed by NBS vegetation
kg/ha/y O ● ● ●
12.3
Modelled O3, SO2, NO2 and CO capture/ removal by vegetation
kg/ha/y O ● ● ●
12.3.1 Total leaf area m2 O ● ● ●
12.4 NOx and PM in gaseous releases
PM- µg/m3 NOx - ppb O ●
12.5 Ambient pollen concentration Number O ● ● ●
12.6 Trends in emissions of NOx and SOx µg/m3 O ● ● ●
12.7
Concentration of particulate matter (PM10 and PM2.5), NO2, and O3 in ambient air
µg/m3 O ● ● ●
149
†Type 1 NBS – minimal or no intervention in ecosystems, with objectives related to maintaining or improving delivery of ecosystem services within and beyond the protected ecosystems Type 2 NBS – extensive or intensive management approaches seeking to develop sustainable, multifunctional ecosystems and landscapes in order to improve delivery of ecosystem services relative to conventional interventions Type 3 NBS – characterised by highly intensive ecosystem management or creation of new ecosystems
4.2.7 Place Regeneration
Urban expansion and growth bring countless opportunities and challenges for cities, rendering place regeneration a significant priority while bringing the notions of environmental quality and sustainable development to the forefront. Urban regeneration is seen as a response to the forces pressuring cities to adapt by addressing decline and increasing the resources for sustainable growth. Urban regeneration reflects a comprehensive and integrated vision and action which leads to the resolution of urban problems and which seeks to bring about a lasting improvement in the economic, physical, social and environmental condition of an area that has been subject to change (Roberts and Sykes, 2000).
In line with the state-of-the-art in the field of sustainable place regeneration, all indicators listed here – both recommended and Additional - should be analysed and applied with consideration for the specific context that defines regeneration actions at city level, at any given time, the history of a city or area, previous nature-based initiatives and their impact, as well as other particular issues and opportunities presented by a town or city.
12.8
Concentration of particulate matter (PM2.5 and PM10) at respiration height along roadways and streets
µg/m3 O ● ● ●
12.9 Mean level of exposure to ambient air pollution
µg/m3 O ● ● ●
12.10 Morbidity due to poor air quality No./y O ● ● ●
12.10 Mortality due to poor air quality No./y O ● ● ●
12.10 Years of Life Lost due to poor air quality
y O ● ● ●
12.11 Avoided costs for air pollution control measures
€ O ● ● ●

150
Table 4-7. Indicators related to Place Regeneration classified as structural (S), process focused (P) or outcome-based (O) indicators and their general applicability to different types of NBS
No. Indicator Units Class Applicability to NBS†
Type 1 Type 2 Type 3
RECOMMENDED
13.1 Derelict land reclaimed for NBS ha O ●
13.2 Quantity of blue-green space (as a ratio to built form)
Number (0-1) O ● ●
13.3
Perceived quality of urban blue-green spaces (accessibility, amenities, natural features, incivilities and recreational facilities)
various O ● ●
13.4 Place attachment: Place identity or “sense of place”
O ● ● ●
13.5 Recreational value of public green space
various O ● ● ●
13.6
NBS incorporated in building design / incorporation of environmental design in buildings
Number (0-5) P ●
13.7 Cultural heritage protection Number (0-5) P ●
ADDITIONAL
14.1 Share of green urban areas % O ● ●
14.2 Land composition % use class A, N, D, M O ● ● ●
14.3 Land take index % O ●
14.4 Area devoted to roads Number (0-1) O ● ●

151
14.5 Traditional knowledge and uses reclamation
Yes/No O ● ● ●
14.6 Traditional events organised in NBS areas
No. O ● ●
14.7 Social active associations No. S ● ● ●
14.8
Direct economic activity: Retail and commercial activity in proximity to green space
% O ● ●
14.9
Direct economic activity: Number of new businesses created and gross value added to local economy
No. of businesses
and € O ● ●
14.10 Social return on investment €/€ O ●
14.11 Population mobility % O ● ● ●
14.12 Population growth % O ● ● ●
14.13 Proportion of elderly residents % O ● ● ●
14.14 Areal sprawl m2/m2 O ●
14.15 Access to public amenities various O ● ●
14.16
Average distance of natural resources from urban centres/ train station/ public transport
km O ● ●
14.17 Natural and cultural site availability km2 O ● ●
14.18 Historical and cultural meaning unitless O ● ● ●
14.19 Cultural value of blue-green spaces various O ● ●
14.20 Opportunities for tourism No./year O ● ●

152
†Type 1 NBS – minimal or no intervention in ecosystems, with objectives related to maintaining or improving delivery of ecosystem services within and beyond the protected ecosystems Type 2 NBS – extensive or intensive management approaches seeking to develop sustainable, multifunctional ecosystems and landscapes in order to improve delivery of ecosystem services relative to conventional interventions Type 3 NBS – characterised by highly intensive ecosystem management or creation of new ecosystems
4.2.8 Knowledge and Social Capacity Building for Sustainable Urban Transformation
Environmental education opportunities are envisioned as a significant indicator of urban resources for associational involvement in nature-based solutions, and of communal contexts for building trust. Although not all environmental education programs have the potential to generate social capital among participants (e.g., classroom instruction), there are forms that can foster social connectivity, trust, and associational and volunteer involvement. Examples of such programs include those that incorporate collective opportunities for volunteer and associational involvement around stewardship, like community gardening and tree planting, or those that incorporate opportunities for intergenerational learning and collective decision-making, like place-based learning, school-community partnership for sustainability, environmental action, action competence, community-based natural resource management, social-ecological systems resilience) (Krasny et al., 2015).
The Recommended indicators listed here have been extensively researched as significant dimensions playing a role in green and pro-environmental behaviour, NBS impact, and foreseeable sustainability (Derr, 2017; Hedefalk et al., 2015; Kudryavtsev et al., 2012; Varela-Candamio et al., 2018). The Additional indicators provide further the means and methods to explore various dimensions of sustainable urban societal transformation.
14.21 Building structure – Urban form
Dimensionless (0-140) P ●
14.22 Material used coherence Yes/No P ●
14.23 Techniques used coherence Yes/No P ●
14.24 Design for sense of place Number (0-5) P ● ●
14.25 Viewshed km2 O ● ●
14.26 Scenic routes and landmarks created No. O ● ●
14.27 Scenic paths created km O ● ●

153
Table 4-8. Indicators related to Knowledge and Social Capacity Building for Sustainable Urban Transformation classified as structural (S), process focused (P) or outcome-based (O) indicators and their
general applicability to different types of NBS
No. Indicator Units Class Applicability to NBS†
Type 1 Type 2 Type 3
RECOMMENDED
15.1 Citizen involvement in environmental education activities
No. of people O ● ● ●
15.2
Social learning regarding ecosystems and their functions
Qualitative data
(dimensionless) O ● ● ●
15.3 Pro-environmental identity O ● ● ●
15.4 Pro-environmental behaviour
Number (0-168) O ● ● ●
ADDITIONAL
16.1 Children involved in educational activities
No./y O ● ● ●
16.2 Engagement with NBS sites and projects
Qualitative data
(dimensionless) P ● ● ●
16.3 Mindfulness Number (0-3) O ● ● ●
16.4
Proportion of schoolchildren involved in gardening
% O ●
16.5
Citizens’ awareness regarding urban nature and ecosystem services
Number (0-5) O ● ● ●
16.6 Green intelligence awareness
No. activities; No. attendees;
No. publications
O ● ● ●
16.7 Positive environmental S, O ● ● ●

154
†Type 1 NBS – minimal or no intervention in ecosystems, with objectives related to maintaining or improving delivery of ecosystem services within and beyond the protected ecosystems Type 2 NBS – extensive or intensive management approaches seeking to develop sustainable, multifunctional ecosystems and landscapes in order to improve delivery of ecosystem services relative to conventional interventions Type 3 NBS – characterised by highly intensive ecosystem management or creation of new ecosystems
4.2.9 Participatory Planning and Governance
The implementation and scaling of nature-based solutions requires new forms of planning and governance approaches. In particular, nature-based solutions’ planning and governance need to embrace experimental approaches for innovation and continuous learning, institutional space for cross-sectoral dialogue and collaboration and citizen participation (Davies and Lafortezza, 2019; Frantzeskaki et al., 2019; Kabisch et al., 2017). Citizen participation in environmental decision-making is extremely valuable, underscoring the importance of careful consideration of dynamic participation processes through all the stages of an urban greening project in order to harness the individual and collective empowering potential of participatory practices (Feldman and Westphal, 2000). Participatory planning and governance are advocated to enhance social, political and financial support of the nature-based solution (EC, 2016; Frantzeskaki and Kabisch, 2016; Pauleit et al., 2017).
The recommended indicators capture these cardinal dimensions and processes, paving the way for a dynamic assessment framework that accounts for processual variables (e.g., empowerment, trust in decision-making) as well as changes in existing planning and governance approaches (e.g., new partnerships and policy learning) (see also Calliari et al., 2019). The additional indicators further explore relevant participatory processes by examining citizen/stakeholder participation in NBS planning and implementation, additionally considering the involvement of under-represented groups. Further dimensions of innovative governance and financing actions can be explored alongside the adoption of the climate resilience strategies that highlight the importance of integrated approaches and stakeholder involvement.
attitudes motivated by contact with NBS
16.8
Urban farming educational and/or participatory activities
Qualitative data
(dimensionless) O ● ●

155
Table 4-9. Indicators related to Participatory Planning and Governance classified as structural (S), process focused (P) or outcome-based (O) indicators and their general applicability to different types of NBS
No. Indicator Units Class Applicability to NBS†
Type 1 Type 2 Type 3
RECOMMENDED
17.1 Openness of participatory processes
Number (1-5) P ● ● ●
17.1.1
Proportion of citizens involved in participatory processes
% P ● ● ●
17.2
Sense of empowerment: perceived control and influence over decision-making
O ● ● ●
17.3
Adoption of new forms of participatory governance: PPPs activated
No. O ● ● ●
17.4
Policy learning for mainstreaming NBS: Number of new policies instituted
No. S ● ● ●
17.5 Trust in decision-making procedure and decision-makers
Number (1-5) O ● ● ●
ADDITIONAL
18.1 Community involvement in planning
Number (0-5) P ● ● ●
18.1.1 Citizen involvement in co-creation/ co-design of NBS
No. P ●
18.1.2
Stakeholder involvement in co-creation/ co-design of NBS
No. P ●
18.2 Community involvement in implementation
Number (0-5) P ● ●

156
18.3
Involvement of citizens from traditionally under-represented groups
Number (0-5) P ● ● ●
18.4 Active engagement of citizens in decision-making
% P ● ● ●
18.5 Consciousness of citizenship
Number (0-5) O ● ● ●
18.6 Number of governance innovations adopted
Number (0-5) S ● ● ●
18.7 Adoption of new forms of NBS (co-)financing
Number (0-5) O ● ● ●
18.8 Development of a climate resilience strategy (extent)
Number (0-7) O ● ● ●
18.9
Alignment of climate resilience strategy with UNISDR-defined elements
Number (0-5) across 117
categories
O ● ● ●
18.10
Adaptation of local plans and regulations to include NBS
Number (0-5) O ● ● ●
18.11 Perceived ease of governance of NBS
Number (0-5) O ● ● ●
18.12 Diversity of stakeholders involved
% P ● ● ●
18.13 Transparency of co-production
Number (1-5) P ● ● ●
18.14 Activation of public-private collaboration No. O ● ● ●
18.15 Reflexivity: identified learning outcomes
No. P ● ● ●
18.16 Facilitation skills for co-production
Number (1-5) P ● ● ●
18.17 Procedural fairness Number (1-5) P ● ● ●
18.18 Strategic alignment Number (1-5) P ● ● ●

157
†Type 1 NBS – minimal or no intervention in ecosystems, with objectives related to maintaining or improving delivery of ecosystem services within and beyond the protected ecosystems Type 2 NBS – extensive or intensive management approaches seeking to develop sustainable, multifunctional ecosystems and landscapes in order to improve delivery of ecosystem services relative to conventional interventions Type 3 NBS – characterised by highly intensive ecosystem management or creation of new ecosystems
4.2.10 Social Justice and Social Cohesion
Social cohesion has been long proved to represent an important resource for long-term environmental sustainability in that socially cohesive communities tend to be more supportive of environmentally sustainable attitudes and behaviours compared with those communities where social cohesiveness is weaker (Uzzell et al., 2002). Bridging social capital’s (indicator 19.1.1) impact on collective initiatives like nature-based solutions can be far-reaching, as it allows different groups to share and exchange information, ideas and innovation and builds consensus among the groups representing otherwise diverse interests. Conversely, bonding social capital (indicator 19.1.2) fulfils an important social function by providing the norms and trust that facilitate the kind of collaborative action required by initiatives like NBS.
Trust, solidarity, tolerance, and respect are generally understood as manifestations of a cohesive society, one that works towards the well-being of all the members, that is, towards the common good. While the benefits of communitarian social capital depend upon basic structural factors (of which inequality, level of education of the population and its ethnic-racial composition are considered most important), trust, solidarity, tolerance, and respect (indicators 19.3-19.5) are cardinal dimensions of the process of creating or building social capital which enables people to expect good from others (reciprocity) and to act on behalf of others in order to create a better future for all (Cloete, 2014).
Moreover, whilst good governance has a significant impact on social cohesion by increasing trust, tolerance, and acceptance of diversity, creating trust and guaranteeing reciprocity through concurrent values and abiding to norms that guide the process of participation in networks are, in fact, acts that fall into the realm of individual responsibility. It seems that people with values like honesty, trustworthiness, integrity, who care for their fellow humans, are likely to create social capital that could lead to the formation of public good (Cloete, 2014). Therefore, trust, solidarity, tolerance, and respect are considered fundamental resources in the inception, implementation, and potential success of any collective initiatives like nature-based solutions.
All things considered, the Recommended indicators included here address the main dimensions pertinent to state-of-the-art research of nature-based solution and their role in creating social capital and fostering global priorities oriented
18.19 Reflexivity: time for reflection No. P ● ● ●

158
towards social cohesion and social justice. The Additional indicators focus on the supplementary details, including perceived social interactions, safety and inclusion, and crime.
Table 4-10. Indicators related to Social Justice and Social Cohesion classified as structural (S), process focused (P) or outcome-based (O) indicators and their general applicability to different types of NBS
No. Indicator Units Class Applicability to NBS†
Type 1 Type 2 Type 3
RECOMMENDED
19.1.1
Bridging– quality of interactions within and between social groups
O ● ● ●
19.1.2
Bonding – quality of interactions within and between social groups
O ● ● ●
19.2 Inclusion of different social groups in NBS co-co-co processes
Number (0-5) P ● ● ●
19.3 Trust within the community O ● ● ●
19.4 Solidarity among neighbours O ● ● ●
19.5 Tolerance and respect O ● ● ●
19.6 Availability and equitable distribution of blue-green space
map O ● ● ●
ADDITIONAL
20.1 Linking social capital O ● ● ●
20.2 Perceived social interaction
Number (0-5)
across 4 categories
O ● ● ●
20.3 Quantity and quality of social interaction Frequency O ● ● ●
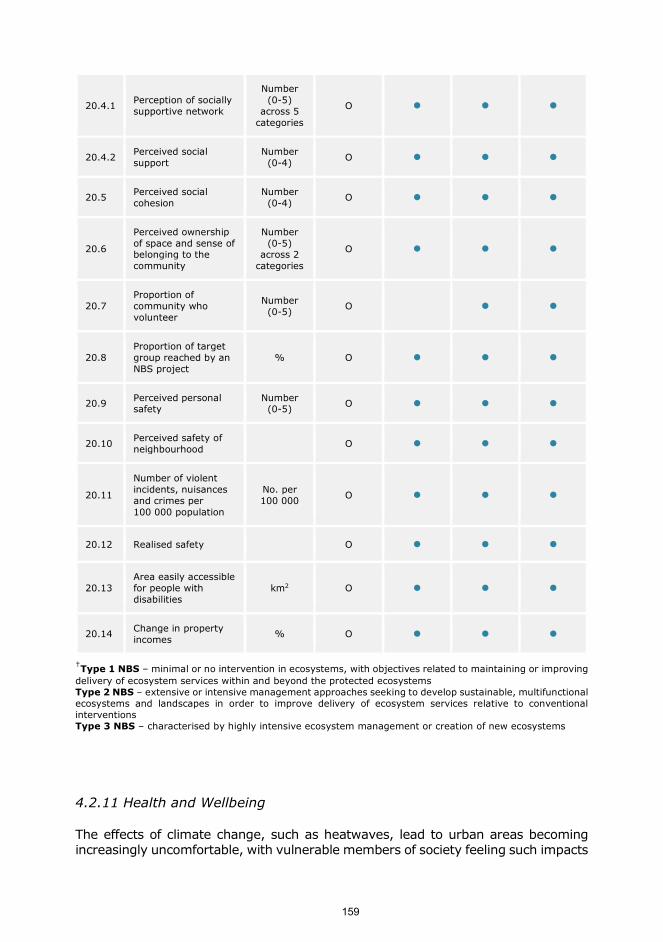
159
†Type 1 NBS – minimal or no intervention in ecosystems, with objectives related to maintaining or improving delivery of ecosystem services within and beyond the protected ecosystems Type 2 NBS – extensive or intensive management approaches seeking to develop sustainable, multifunctional ecosystems and landscapes in order to improve delivery of ecosystem services relative to conventional interventions Type 3 NBS – characterised by highly intensive ecosystem management or creation of new ecosystems
4.2.11 Health and Wellbeing
The effects of climate change, such as heatwaves, lead to urban areas becoming increasingly uncomfortable, with vulnerable members of society feeling such impacts
20.4.1 Perception of socially supportive network
Number (0-5)
across 5 categories
O ● ● ●
20.4.2 Perceived social support
Number (0-4) O ● ● ●
20.5 Perceived social cohesion
Number (0-4) O ● ● ●
20.6
Perceived ownership of space and sense of belonging to the community
Number (0-5)
across 2 categories
O ● ● ●
20.7 Proportion of community who volunteer
Number (0-5) O ● ●
20.8 Proportion of target group reached by an NBS project
% O ● ● ●
20.9 Perceived personal safety
Number (0-5) O ● ● ●
20.10 Perceived safety of neighbourhood O ● ● ●
20.11
Number of violent incidents, nuisances and crimes per 100 000 population
No. per 100 000 O ● ● ●
20.12 Realised safety O ● ● ●
20.13 Area easily accessible for people with disabilities
km2 O ● ● ●
20.14 Change in property incomes % O ● ● ●

160
the most48. In the heat wave of summer 2003 in Europe for example, more than 70 000 excess deaths were recorded (Robine et al., 2008).
High temperatures also raise the levels of ozone and other pollutants in the air that exacerbate cardiovascular and respiratory disease49. Air quality (see section 4.2.6) is also a major concern worldwide, particularly in urban areas, due to its direct consequences on human health, plants, animals, infrastructure and historical buildings (among others). Increasing evidence supports the idea that ecological features such as the diurnal cycles of light and day, sunlight exposure, seasons, and geographic characteristics of the natural environment such as altitude, latitude, and green spaces are important determinants of cardiovascular health and cardiovascular disease (CVD) risk (Bhatnagar, 2017). Some of the beneficial cardiovascular effects of greenery might relate to a decrease in the levels of local air pollution, increased proximity to walking spaces, or lower levels of mental stress (Bhatnagar, 2017). With an abundance of convenient, palatable, energy dense foods and increasingly fewer demands for physical activity in usual lifestyles, the contemporary environment enables the energy balance to be tipped in favour of weight gain (obesogenic environment) (Bhrem and D'Alessio, 2014). In adults, obesity is associated with increasing risk of cardiovascular disease, type 2 diabetes, and all-cause mortality. Most of the associated mortality and morbidity is mediated through major chronic diseases related to obesity, such as cardiovascular disease, diabetes, and cancer (Bhrem and D'Alessio, 2014). Overweight children face a greater risk of a host of problems, including type 2 diabetes, high blood pressure, high blood lipids, asthma, sleep apnoea, chronic hypoxemia (too little oxygen in the blood), early maturation, and orthopaedic problems (Samuels, 2004). They also suffer psychosocial problems, including low self-esteem, poor body image, and symptoms of depression (Samuels, 2004). This is highlighted by Recommended indicators (21.1, 21.5, 21.6).
Climate change means that floods are also increasing in frequency and intensity, and the frequency and intensity of extreme precipitation is expected to continue to increase throughout the current century (IPCC, 2014). A decrease in experienced nature is one aspect of urbanisation that has drawn researchers’ attention with the purpose of developing methodologies to explore the affective and cognitive benefits of nature experience, and demonstrate the psychological benefits of our exposure to/engagement with nature (Bratman et al., 2015). The mental health benefits of urban green space have been highlighted by a growing body of knowledge and empirical evidence attesting to the complex interplay among stress responses, neighbourhood conditions, and health outcomes (Beyer et al., 2014; Frumkin et al., 2017; Hartig et al., 2014). More greenery in the neighbourhood was linked to lower levels of depression, anxiety, and stress (Beyer et al., 2014; Pope et al., 2015). Moreover, mental restoration and relaxation from leisure activities (e.g., walks in parks vs. walks in urban settings, gardening) pursued in the nature and green space have been studied as strong evidence of mental health benefits consequent to nature experience (Aspinall et al., 2013; Bratman et al., 2015; Braubach et al., 2017;, Hartig et al., 2014; van der Berg and Custers, 2011). These aspects are addressed in Recommended indicators 21.2–21.4, and 21.6.
48 Climate change, justice and vulnerability. http://bit.ly/16STKgy 49 http://www.who.int/news-room/fact-sheets/detail/climate-change-and-health

161
Numerous authors emphasize that modern urban wellbeing challenged by chronic stress (indicator 21.2) and insufficient physical activity can be healthily nurtured by natural environment exposure, which promotes mental and physical health and reduces morbidity and mortality in urban residents by providing psychological relaxation (indicators 21.3, 21.4) and stress alleviation, enhancing immune function, stimulating social cohesion, supporting physical activity (indicator 21.1), and reducing exposure to air pollutants, noise and excessive heat (Braubach et al., 2017; Hartig et al., 2014).
These health and wellbeing benefits are important not just at the individual level, but if implemented widely they could save expenditure on health care. Increasing the extent and improving the quality of green spaces in areas of cities where health outcomes are poor could also play an important role in addressing multiple deprivations.
Research on complex/multi-dimensional relationship between nature connectedness/nature affiliation (i.e., affective, cognitive and experiential factors related to our belonging to the natural world) and wellbeing indicate that exposure to elements of the natural world affects our well-being by boosting our positive affect, by eliciting feelings of ecstasy, respect, and wonder, by fostering feelings of comfort and friendliness, by heightening our intrinsic aspirations and generosity, and by increasing our vitality (Capaldi et al., 2014; Howell and Passmore, 2013), highlighted in Recommended indicators 21.3 and 21.4, and Additional indicators 22.11, 22.13, and 22.15.
The Additional indicators of NBS impacts on Health and Wellbeing focus on evaluating health and wellbeing aspects in relation to noise, heat and air pollution, and exploring psychological and chronic stress changes, including anxiety, in greater depth.
Table 4-11. Indicators related to Health and Wellbeing classified as structural (S), process focused (P) or outcome-based (O) indicators and their general applicability to different types of NBS
No. Indicator Units Class Applicability to NBS†
Type 1 Type 2 Type 3
RECOMMENDED
21.1 Level of outdoor physical activity O ● ●
21.2 Level of chronic stress (perceived stress)
Number (0-4) O ● ● ●
21.3 General wellbeing and happiness
Number (0-7) O ● ● ●

162
21.4 Self-reported mental health and wellbeing
Number (1-6) O ● ● ●
21.5 Prevalence of cardiovascular disease
% O ● ●
21.5 Incidence of cardiovascular disease
% per year O ● ●
21.6 Quality of life Number (1-5) O ● ● ●
ADDITIONAL
22.1 Self-reported physical activity
Minutes per week O ● ●
22.2 Observed physical activity within NBS
% over three
levels of physical activity
(sedentary, walking, or vigorous)
O ● ●
22.3 Encouraging a healthy lifestyle
Number (1-5) O ● ●
21.5 Morbidity due to cardiovascular disease
No./y O ● ●
21.5 Mortality due to cardiovascular disease
No./y O ● ●
22.4 Incidence of obesity % per year O ● ●
22.5
Heat-related discomfort: Universal Thermal Climate Index (UTCI)
°C O ● ●
22.6
Hospital admissions due to high temperature during extreme heat events
No. per 100 000 O ● ●
22.7 Heat-related mortality
No. per 1 000 000 per year
O ● ●
22.8 Exposure to noise pollution % O ● ●

163
22.9 Perceived chronic loneliness
Number (1-3)
across 3 categories
O ● ● ●
22.10 Somatisation
Low, Moderately high, Very
high
O ● ● ●
22.11 Mindfulness
Number (0-4)
across 12 categories
O ● ● ●
22.12 Visual access to green space
Number (0-4) O ● ●
22.12 Time spent viewing green space from residence each day
Number (0-3) O ● ●
22.13
Perceived restorativeness of public green space/ NBS
Number (0-10)
across 4 categories
O ● ● ●
22.14 Perceived social support
Number (0-4) O ● ● ●
22.15 Connectedness to nature
Number (1-5)
across 14 categories
O ● ● ●
22.16
Prevalence of attention deficit hyperactivity disorder (ADHD)
% O ● ●
22.17 Exploratory behaviour in children
O ● ●
22.18 Self-reported anxiety
Mild, Moderate,
Severe O ● ● ●
22.19 Prevalence of respiratory diseases % O ● ● ●
22.19 Incidence of respiratory diseases % per year O ● ● ●
22.19 Morbidity of respiratory diseases No./y O ● ● ●
22.19 Mortality of respiratory diseases No./y O ● ● ●

164
†Type 1 NBS – minimal or no intervention in ecosystems, with objectives related to maintaining or improving delivery of ecosystem services within and beyond the protected ecosystems Type 2 NBS – extensive or intensive management approaches seeking to develop sustainable, multifunctional ecosystems and landscapes in order to improve delivery of ecosystem services relative to conventional interventions Type 3 NBS – characterised by highly intensive ecosystem management or creation of new ecosystems
4.2.12 New Economic Opportunities and Green Jobs
The economic opportunities that are created by the adoption and implementation of NBS as a consequence of their social attractiveness and restorative value can be evaluated using the Recommended indicators 23.2, 23.4–23.6. Indicator 23.2 and related sub-indicators 23.2.1-23.2.3 provide several different metrics to evaluate changes in mean land or property value attributable to the implementation of local NBS. Indicator 23.4 specifically evaluates the use of ground floor building space for retail, commercial or public purposes in the proximity of NBS, whilst indicator 23.5 examines the gross value added (GVA) to the local economy each year in the area near implemented NBS. The value of recreational activities occurring in NBS is addressed by indicator 23.6.
Indicators of new economic opportunities are supported by assessment of the value of new jobs created per annum (23.3) as a result of new business opportunities and new jobs in the green sector. Green jobs are those that contribute environmental benefit. The International Labour Organization (ILO) defines green jobs within three categories: primary green activities (i.e., organic agriculture, sustainable forestry), secondary activities (i.e., renewable energy, clean industry, sustainable
22.20 Morbidity due to poor air quality No./y O ● ● ●
22.20 Mortality due to poor air quality No./y O ● ● ●
22.20 Years of life lost (YoLL) due to poor air quality
No. of years O ● ● ●
22.21 Prevalence of autoimmune diseases
% O ● ● ●
22.21 Incidence of autoimmune diseases
% per year O ● ● ●
22.22 Prevalence of chronic stress % O ● ● ●
22.22 Incidence of chronic stress % per year O ● ● ●
22.22 Morbidity due to chronic stress No./y O ● ● ●

165
construction) and tertiary activities (i.e., recycling, sustainable tourism, and sustainable transport).
There has been a great deal of research on the valuation of the benefits provided by the natural environment using a wide range of techniques. Indicators supporting the valuation of urban nature (23.1.1 and 23.1.2) and its ecosystem services enable quantification of NBS benefits translated into monetary terms. Economic valuation of NBS benefits provides a much-needed means to inform decision-making.
Additional indicators within the New Economic Opportunities and Green Jobs challenge area examine indirect economic activity in the area surrounding NBS, elements of NBS cost-benefit analysis (including the value of hydro-meteorological risk reduction), social return on investment, the value of NBS-based tourism, and the impact of local innovation, among others. The indicators identified for the New Economic Opportunities and Green Jobs challenge area address a relatively broad range of actions and potential or realised economic consequences.
Table 4-12. Indicators related to New Economic Opportunities and Green Jobs classified as structural (S), process focused (P) or outcome-based (O) indicators and their general applicability to different types of NBS
No. Indicator Units Class Applicability to NBS†
Type 1 Type 2 Type 3
RECOMMENDED
23.1.1
Valuation of NBS: Value of NBS calculated using GI-Val
€ O ● ● ●
23.1.2 Economic value of urban nature € O ● ● ●
23.2
Mean land and/ or property value in proximity to green space
€ O ● ●
23.2.1 Change in mean house prices/ rental markets
€ O ● ●
23.2.2 Average land productivity and profitability
€/ha O ● ● ●
23.2.3
Property betterment and visual amenity enhancement
€/m2 O ● ●

166
23.3 Direct economic activity: Number of new jobs created
€/year O ● ● ●
23.4
Direct economic activity: Retail and commercial activity in proximity to green space
% O ● ●
23.5
Direct economic activity: Gross value added to local economy from new business creation
%/year O ● ● ●
23.6 Recreational monetary value €/year O ● ●
23.7 Overall economic, social and health well-being
Human Development
Index O ● ● ●
ADDITIONAL
24.1
Indirect economic activity: number of new businesses established in proximity to NBS
No./year O ● ●
24.2
Indirect economic activity: Value of rates paid by businesses in proximity to NBS
€/year O ● ●
24.3
Indirect economic activity: New customers to businesses in proximity to NBS
Mean No./day per
quarter O ● ●
24.4
Indirect economic activity: local economy GDP in proximity to NBS
€/year O ● ●
24.5 NBS cost/benefit analysis: Initial costs € O ● ● ●
24.6 NBS cost/benefit analysis: Maintenance costs
€/year O ● ● ●
24.7 NBS cost/benefit analysis: Replacement costs
€ O ● ● ●

167
24.8 NBS cost/benefit analysis: Avoided costs
€ O ● ● ●
24.9 NBS cost/benefit analysis: Payback period
year O ● ● ●
24.10
Reduced/ avoided damage costs from hydro meteorological risk reduction
€/year O ● ● ●
24.11 Social return on investment (SROI) €/€ O ● ● ●
24.12
Income generated via application of green administrative policies within Living Lab district
€/year O ● ● ●
24.13 Subsidies applied for private NBS measures
€/year O ● ● ●
24.14
Private finance attracted to the NBS site/ private investment in the bioeconomy
€/year O ● ● ●
24.15 Increase in tourism Mean no.
visitors/day per year
O ● ●
24.16 New activities in the tourism sector
Number (1-5) O ● ●
24.17 Gross profit from nature-based tourism
€/year per km2 O ● ●
24.18 Number of new jobs in green sector % O ● ● ●
24.19
Number of new jobs related to NBS construction and maintenance
Number (1-5) O ● ● ●
24.20 New employment in the tourism sector
Number (1-5) O ● ●
24.21 Turnover in the green sector % O ● ● ●
24.22 Employment in agriculture No./ha O ● ● ●

168
†Type 1 NBS – minimal or no intervention in ecosystems, with objectives related to maintaining or improving delivery of ecosystem services within and beyond the protected ecosystems Type 2 NBS – extensive or intensive management approaches seeking to develop sustainable, multifunctional ecosystems and landscapes in order to improve delivery of ecosystem services relative to conventional interventions Type 3 NBS – characterised by highly intensive ecosystem management or creation of new ecosystems
24.23 Rural Productivity Index €/ha O ● ● ●
24.24
Economic value of the productive activities vulnerable to risks
€/km2 O ● ● ●
24.25 Innovation impact No. innovations O ● ● ●
24.26 Income per capita €/year per person O ● ● ●
24.26 24.26.1
Disposable income per capita
€/year per person O ● ● ●
24.27 Upskilling and related earnings increase
Increase in employment earnings per person per
year
O ● ● ●
24.28 Population mobility % in 1 y % in 2 y % in 5 y
O ● ●
24.29 Avoided cost of run-off treatment €/y O ● ● ●
24.30 Correction cost of groundwater quality €/m3 O ● ● ●
24.31 Dissuasive cost of water abstraction €/m3 O ● ● ●
24.32 Average water productivity €/m3 O ● ● ●
24.33
New areas made available for traditional productive uses
km2 O ● ● ●
24.34 Value of food produced in NBS €/y O ● ●
24.35 Renewable energy produced in NBS kWh/y O ●

169
4.3 Conclusions
4.3.1 Summary of the indicator framework presented
The Recommended indicators, taken together, are designed to provide a holistic assessment of the multiple potential co-benefits of NBS. Practitioners are encouraged to adopt as many of these Recommended indicators as practicable. Depending upon the specific context, some Recommended indicators may not be entirely applicable or may require adaptation to the local conditions or to overcome resource (personnel, equipment, finance) limitations. In such cases, the Additional indicators presented herein may serve as support, providing opportunity for monitoring and evaluation framework adaptation and tailoring to local conditions as necessary.
Critical thinking is required to select the indicators that suit the purpose and the scope of the NBS assessment strategy. Detailed information regarding the applicability and requirements for each indicator analysis are presented in the Appendix.
4.3.2 Emerging concerns and further development needs
There were a number of indicators initially discussed by the members of the H2020 NBS projects involved in producing this handbook that were ultimately not included herein due to a lack of consensus regarding assessment methodology. In many cases, further work is required to validate evaluation methods for a variety of the NBS forms and functions in order to establish a standardised procedure for assessment of NBS impact. Outcomes of on-going and future NBS projects are expected to deliver novel indicators of NBS impact across all societal challenge areas identified here.
Greater confidence in techniques for evaluation are needed, particularly for carbon flux measurements from natural ecosystems and heterogeneous urban areas. Reduction in price of monitoring equipment with technological advances should make monitoring more accessible and applicable.
Concerning the water management challenge, one of the main concerns is the identification and development of synergic strategies to safeguard and properly support ecosystem services. The effective detection of spatial and temporal scales allows assessing and fostering the ecosystem resilience and sustainability. Attention should be paid to investigating alternations to flow regime to account for the uncertainty and non-stationarity of the hydrologic methodologies. Technological advancement will make monitoring more accessible and applicable, particularly in relation to automated sampling and analysis, and in-pipe measurements of low flowrates. Advances in the accessibility of high-resolution imagery will yield more monitoring options.
For biodiversity assessment, greater standardisation of approaches is needed, this may come through increased requirement for reporting through legislative
170
and planning processes. There is also a need for indicators that capture the complexity and diversity of biodiversity evaluation beyond the usual suspects.
Additionally, a wide variety of indicators and methodologies are presented in this manual, not all of which have been validated to assess large-scale NBS interventions. In this sense, the results obtained in the current H2020 projects will serve to guide future projects and implementations in the selection of the most appropriate in each case. Likewise, it is necessary to consider the impacts of the COVID-19 pandemic on some of the assessment methodologies presented in this handbook and Appendix of Methods as some KPIs may require modifications to the way they are evaluated (e.g., changes to how use of green spaces is assessed due to local restrictions on movement). In some cases, the units of the KPIs may be modified to better apply to a specific case study or to improve the understanding of results.
4.4 References
Aspinall, P., Mavros, P., Coyne, R., and Roe, J., ‘The urban brain: Analyzing outdoor physical activity with mobile EEG’, British Journal of Sports Medicine, Vol. 49, No 4, 2013, pp. 272-276.
Benedict, M.A. and McMahon, E.T., ‘Green infrastructure’, Island, Washington, D.C., 2006.
Beyer, K.M., Kaltenbach, A., Szabo, A., Bogar, S., Nieto, F.J., and Malecki, K.M., ‘Exposure to neighborhood green space and mental health: Evidence from the Survey of the Health of Wisconsin’, International Journal of Environmental Research and Public Health, Vol. 11, No 3, 2014, pp. 3453-3472.
Bhatnagar A., ‘Environmental Determinants of Cardiovascular Disease’, Circulation Research, Vol. 121, No 2, 2017, pp. 162–180.
Brehm, B.J. and D’Alessio, D.A., ‘Environmental factors influencing obesity’, Endotext, MDText.com, Inc., South Dartmouth, 2014, pp. 2000. Retrieved from https://www.ncbi.nlm.nih.gov/books/NBK278977/
Bratman, G.N., Hamilton, J.P., Hahn, K.S., Daily, G.C., and Gross, J.J., ‘Nature experience reduces rumination and subgenual prefrontal cortex activation’, Proceedings of the National Academy of Sciences of the United States of America, Vol. 112, No 28, 2015, pp. 8567–8572.
Braubach, M., Egorov, A., Mudu, P., Wolf, T., Ward Thompson, C., and Martuzzi, M., ‘Effects of Urban Green Space on Environmental Health, Equity and Resilience’, Nature-Based Solutions to Climate Change Adaptation in Urban Areas: Linkages between Science, Policy and Practice, SpringerOpen, Cham, 2017, pp. 187-205.
Calliari, E., Staccione, A., and Mysiak, J., ‘An assessment framework for climate-proof nature-based solutions’, Science of the Total Environment, Vol. 656, 2019, pp. 691-700.
Capaldi, C.A., Dopko, R.L., and Zelenski, J.M., ‘The relationship between nature connectedness and happiness: a meta-analysis’, Frontiers in Psychology, Vol. 5, 2014, pp. 976.
Cloete, A., ‘Social cohesion and social capital: Possible implications for the common good’, Verbum et Ecclesia, Vol. 35, No 3, 2014, Art. no 1331, 6 pp.
Cohen-Shacham, E., Walters, G., Janzen, C., and Maginnis, S. (Eds.), Nature-based Solutions to address global societal challenges, International Union for the Conservation of Nature, Gland, Switzerland, 2016.
Davies, C. and Lafortezza, R., ‘Transitional path to the adoption of nature-based solutions’, Land Use Policy, Vol. 80, 2019, pp. 406–409.
Demuzere, M., Orru, K., Heidrich, O., Olazabal, E., Geneletti, D., Orru, H., and Faehnle, M., ‘Mitigating and adapting to climate change: Multi-functional and multi-scale assessment of green urban infrastructure’, Journal of Environmental Management, Vol. 146, 2014, pp. 107-115.
Derr, V., ‘Urban green spaces as participatory learning laboratories’, Proceedings of the Institution of Civil Engineers-Urban Design and Planning, Vol. 171, No 1, 2017, pp. 25-33.

171
Donabedian, A., ‘Evaluating the quality of medical care’, The Millbank Memorial Fund Quarterly, Vol. 44, 1966, pp. 166-203.
Eggermont, H., Balian, E., Azevedo, J.M.N., Beumer, V., Brodin, T., Claudet, J., Fady, B., Grube, M., Keune, H., Lamarque, P., Reuter, K., Smith, M., van Ham, C., Weisser, W.W., and Le Roux, X., ‘Nature-based solutions: New influence for environmental management and research in Europe’, GAIA, Vol. 24, No 4, 2015, pp. 243-248.
Ernst, L., de Graaf-Van Dinther, R.E., Peek, G.J., and Loorbach, D.A., ‘Sustainable urban transformation and sustainability transitions; conceptual framework and case study’, Journal of Cleaner Production, Vol. 112, 2016, pp. 2988-2999.
European Commission, Green Infrastructure (GI) — Enhancing Europe’s Natural Capital, COM(2013) 249 final, 2013.
European Commission, Towards an EU Research and Innovation policy agenda for Nature-Based Solutions & Re-Naturing Cities. Final Report of the Horizon 2020 Expert Group on 'Nature-Based Solutions and Re-Naturing Cities', Publications Office of the European Union, Luxembourg, 2015.
European Commission, Commission Staff Working Document: Guidance on a strategic framework for further supporting the deployment of EU-level green and blue infrastructure, SWD(2019) 193 final, 2019a.
European Commission, Report from the Commission to the European Parliament, the Council, the European Economic and Social Committee and the Committee of the Regions: Review of progress on implementation of the EU green infrastructure strategy, COM(2019) 236 final, 2019b.
European Commission, EU Biodiversity Strategy for 2030: Bringing Nature Back into Our Lives, COM(2020) 380 Final, 2020.
Feldman, R.M. and Westphal, L.M., ‘An agenda for community design and planning: Participation and empowerment practice’, Sustaining human settlement: a challenge for the new millennium, Urban International Press, North Shields, Great Britain, 1999, pp. 105-139.
Frantzeskaki, N., ‘Seven lessons for planning nature-based solutions in cities’, Environmental Science and Policy, Vol. 93, 2019, pp. 101-111.
Frantzeskaki, N. and Kabisch, N., ‘Designing a knowledge co-production operating space for urban environmental governance—Lessons from Rotterdam, Netherlands and Berlin, Germany’, Environmental Science and Policy, Vol. 62, 2016, pp. 90-98.
Frumkin, H., Bratman, G.N., Breslow, S.J., Cochran, B., Kahn, P.H., Jr., Lawler, J.J., Levin, P.S., Tandon, P.S., Varanasi, U., Wolf, K.L., and Wood, S.A., ‘Nature Contact and Human Health: A Research Agenda’, Environmental Health Perspectives, Vol. 125, No 7, 2017, pp. 075001.
Gentin, S., Pitkänen, K., Chondromatidou, A.M., Præstholm, S., Dolling, A., and Palsdottir, A.M., ‘Nature-based integration of immigrants in Europe: A review’, Urban Forestry and Urban Greening, Vol. 43, 2019, pp. 1-8.
Grimm, N.B., Faeth, S.H., Golubiewski, E.N., Redman, C.L., Wu, J., Bai, X., and Briggs, J.M., ‘Global change and the ecology of cities’, Science, Vol. 319, 2008, pp. 756–760.
Haase, D., Larondelle, N., Andersson, E., Artmann, M., Borgström, S., Breuste, J., Gomez-Baggethun, E., Gren, Å., Hamstead, Z., Hanson, R., Kabisch, N., Kremer, P., Langemeyer, J., Lorance Rall, E., McPhearson, T., Pauleit, S., Qureshi, S., Schwartz, N., Voigt, A., Wurster, S., and Elmqvist, T., ‘A Quantitative Review of Urban Ecosystem Service Assessments: Concepts, Models, and Implementation’, AMBIO, Vol. 43, No 4, 2014, pp. 413–433.
Handy, S.L. and Niemeier, D.A., ‘Measuring accessibility: an exploration of issues and alternatives’, Environment and Planning A, Vol. 29, No 7, 1997, pp. 1175-1194.
Hartig, T., Mitchell, R., de Vries, S., and Frumkin, H., ‘Nature and Health’, Annual Review of Public Health, Vol. 35, 2014, pp. 207-228.
Hedefalk, M., Almqvist, J., and Östman, L., ‘Education for sustainable development in early childhood education: a review of the research literature’, Environmental Education Research, Vol. 21, No 7, 2015, pp. 975-990.
Howell, A.J. and Passmore, H.-A., ‘The nature of happiness: Nature affiliation and mental well-being’, Mental well-being: International contributions to the study of positive mental health, Springer, New York, 2013, pp. 231–257.
Ibes, D.C., ‘A multi-dimensional classification and equity analysis of an urban park system: A novel methodology and case study application’, Landscape and Urban Planning, Vol 137, 2015, pp. 122–137.

172
IPCC, ‘Summary for Policymakers’, Climate Change 2014: Mitigation of CC. Contribution of Working Group III to the 5th Assessment Report of the IPCC, New York, Cambridge University Press, 2014.
Jahn, T., Bergmann, M., and Keil, F., ‘Transdisciplinarity: Between mainstreaming and marginalization’, Ecological Economics, Vol. 79, 2012, pp.1-10.
Kabisch, N., Korn, H., Stadler, J., and Bonn, A. (Eds.), ‘Nature-Based Solutions to Climate Change Adaptation in Urban Areas’, Theory and Practice of Urban Sustainability Transitions, Springer, Cham, 2017.
Korkmaz, C. and Balaban, O., ‘Sustainability of urban regeneration in Turkey: Assessing the performance of the North Ankara Urban Regeneration Project’, Habitat International, Vol. 95, 2020, pp. 1-14.
Kudryavtsev, A., Krasny, M.E., and Stedman, R.C., ‘The impact of environmental education on sense of place among urban youth’, Ecosphere, Vol. 3, No 4, 2012, pp. 1-15.
Kweon, B.S., Sullivan, W.C., and Wiley, A.R., ‘Green common spaces and the social integration of inner-city older adults’, Environment and Behavior, Vol. 30, No 6, 1998, pp. 832-858.
Maes, J., Zulian, G., Günther, S., Thijssen, M., and Raynal, J., Enhancing Resilience of Urban Ecosystems through Green Infrastructure. Final Report, EUR 29630 EN, Luxembourg, Publications Office of the European Union, 2019.
Maes, J., Zulian, G., Thijssen, M., Castell, C., Baró, F., Ferreira, A.M., Melo, J., Garrett, C.P., David, N., Alzetta, C., Geneletti, D., Cortinovis, C., Zwierzchowska, I., Louro Alves, F., Souto Cruz, C., Blasi, C., Alós Ortí, M.M., Attorre, F., Azzella, M.M., Capotorti, G., Copiz, R., Fusaro, L., Manes, F., Marando, F., Marchetti, M., Mollo, B., Salvatori, E., Zavattero, L., Zingari, P.C., Giarratano, M.C., Bianchi, E., Duprè, E., Barton, D., Stange, E., Perez-Sob, M., van Eupen, M., Verweij, P., de Vries, A., Kruse, H., Polce, C., Cugny-Seguin, M., Erhard, M., Nicolau, R., Fonseca, A., Fritz, M., and Teller, A., Mapping and Assessment of Ecosystems and their Services, Urban Ecosystems, Publications Office of the European Union, Luxembourg, 2016.
Maes, J., Teller, A., Erhard, M., Conde, S., Vallecillo Rodriguez, S., Barredo Cano, J.I., Paracchini, M., Abdul Malak, D., Trombetti, M., Vigiak, O., Zulian, G., Addamo, A., Grizzetti, B., Somma, F., Hagyo, A., Vogt, P., Polce, C., Jones, A., Marin, A., Ivits, E., Mauri, A., Rega, C., Czucz, B., Ceccherini, G., Pisoni, E., Ceglar, A., De Palma, P., Cerrani, I., Meroni, M., Caudullo, G., Lugato, E., Vogt, J., Spinoni, J., Cammalleri, C., Bastrup-Birk, A., San-Miguel-Ayanz, J., San Román, S., Kristensen, P., Christiansen, T., Zal, N., De Roo, A., De Jesus Cardoso, A., Pistocchi, A., Del Barrio Alvarellos, I., Tsiamis, K., Gervasini, E., Deriu, I., La Notte, A., Abad Viñas, R., Vizzarri, M., Camia, A., Robert, N., Kakoulaki, G., Garcia Bendito, E., Panagos, P., Ballabio, C., Scarpa, S., Montanarella, L., Orgiazzi, A., Fernandez Ugalde, O., and Santos-Martín, F., Mapping and Assessment of Ecosystems and their Services: An EU ecosystem assessment, EUR 30161 EN, Publications Office of the European Union, Luxembourg, 2020.
McCormick, K., Anderberg, S., Coenen, L., and Neij, L., ‘Advancing sustainable urban transformation’, Journal of Cleaner Production, Vol. 50, 2013, pp. 1-11.
Páez, A., Scott, D.M., and Morency, C., ‘Measuring accessibility: positive and normative implementations of various accessibility indicators’, Journal of Transport Geography, Vol. 25, 2012, pp. 141–153.
Pauleit, S., Zölch, T., Hansen, R., Randrup, T.B., and van den Bosch, C.K., ‘Nature-based solutions and climate change–four shades of green’, Nature-Based Solutions to Climate Change Adaptation in Urban Areas, Springer, Cham, 2017, pp. 29-49.
Pope, D., Tisdall, R., Middleton, J., Verma, A., Van Ameijden, E., Birt, C., and Bruce, N.G., ‘Quality of and access to green space in relation to psychological distress: results from a population-based cross-sectional study as part of the EURO-URHIS 2 project’, European Journal of Public Health, Vol. 28, No 1, 2015, pp. 35-38.
Querol, X., Karanasiou, A., Amato, F., Vasconcelos, C., Alastuey, A., Viana, M., Moreno, T., Plana, F., Perez, N., Cabañas, M., Bartoli, R., Martinez, S., Sosa, M., Montfort, E., Celades, I., Escrig. A., Sanfelix, V., Gomar, S., Harrison, R., Holman, C., Beddows, D., Harding, M., Eleftheriadis, K., Diapouli, L., Vratoulis, S., Gini, M., Bairaktari, E., Dalaina, S., Galifianakis, V., Lucarelli, F., Nava, S., Calzolai, G., Udisti, R., Becagli, S., Traversi, R., Severi, M., Borselli, S., Giannoni, M., Alves, C., Pio, C., Nunes, T., Tarelho, L., Duarte, M., Cerqueira, M., Vicente, E., Custódio, D., Pinto, H., Gianelle, V.L., and Colombi, C., ‘Air Quality and Climate Change Abatement: Synergies and Conflicts, Report 23, 12/2016’, LIFE AIRUSE (LIFE11 ENV/ES/584), 2016.
Raymond, C.M., Frantzeskaki, N., Kabisch, N., Berry, P., Breil, M., Nita, M.R., Geneletti, D., and Calfapietra, C., ‘A framework for assessing and implementing the co-benefits of nature-based solutions in urban areas’, Environmental Science and Policy, Vol. 77, 2017, pp. 15-24.
Raymond, C.M., Gottwald, S., Kuoppa, J., and Kyttä, M., ‘Integrating multiple elements of environmental justice into urban blue space planning using public participation geographic information systems’, Landscape and Urban Planning, Vol. 153, 2016, pp. 198-208.

173
Roberts, P. and Sykes, H. (Eds.), Urban regeneration: a handbook, London, SAGE Publications Ltd, 2000.
Robine, J.-M., Cheung, S.L.K., Le Roy, S., Van Oyen, H., Griffiths, C., Michel, J.-P., and Herrmann, F.R., ‘Death toll exceeded 70,000 in Europe during the summer of 2003 / Plus de 70 000 décès en Europe au cours de l’été 2003’, Comptes Rendes Biologies, Vol. 331, No 2, 2008, pp. 171-178.
Samuels, S.E., Environmental strategies for preventing childhood obesity, Acceleration Meeting Memo, January 8 and 9, 2004, Berkeley Media Studies Group, Berkeley, 2004.
Shanahan, D.F., Fuller, R.A., Bush, R., Lin, B.B., and Gaston, K.J., ‘The Health Benefits of Urban Nature: How Much Do We Need?’, BioScience, Vol. 65, 2015, pp. 476-485.
Shanahan, D.F., Bush, R., Gaston, K.J., Lin, B.B., Dean, J., Barber, E., Fuller, R.A., ‘Health Benefits from Nature Experiences Depend on Dose’, Scientific Reports, Vol. 6, Art. no 28551, 2016.
Sinnett, D., Smith, N., and Burgess, S. (Eds.), Handbook on Green Infrastructure: Planning, design and implementation, Edward Elgar Publishing Ltd, Cheltenham, 2015.
Somarakis, G., Stavros, S., Chrysoulakis, N. (Eds.), ThinkNature Nature-Based Solutions Handbook, ThinkNature project funded by the EU Horizon 2020 research and innovation programme under grant agreement No 730338, 2019, doi:10.26225/ jerv-w202.
Tzoulas, K., Korppela, K., Venn, S., Yli-Pelkonen, V., Kaźmierczak, A., Niemela, J., and James, P., ’Promoting ecosystem and human health in urban areas using Green Infrastructure: A literature review’, Landscape and urban planning, Vol. 81, No 3, 2007, pp. 167-178.
Uzzell, D., Pol, E., and Badenas, D., ‘Place identification, social cohesion, and environmental sustainability’, Environment and Behavior, Vol. 34, No 1, 2002, pp. 26-53.
van den Berg, M.M., van Poppel, M., van Kamp, I., Ruijsbroek, A., Triguero-Mas, M., Gidlow, C., Nieuwenhuijsen, M.J., Gražulevičiene, R., van Mechelen, W., Kruize, H., and Maas, J., ‘Do physical activity, social cohesion, and loneliness mediate the association between time spent visiting green space and mental health?’, Environment and Behavior, Vol. 51, No 2, 2017, pp. 144-166.
Van Den Berg, A.E. and Custers, M.H.G., ‘Gardening Promotes Neuroendocrine and Affective Restoration from Stress’, Journal of Health Psychology, Vol. 16, No 1, 2011, pp. 3–11.
Varela-Candamio, L., Novo-Corti, I., and García-Álvarez, M.T., ‘The importance of environmental education in the determinants of green behavior: A meta-analysis approach’, Journal of Cleaner Production, Vol. 170, 2018, pp. 1565-1578.
Vujcic, M., Tomicevic-Dubljevic, J., Grbic, M., Lecic-Tosevski, D., Vukovic, O., and Toskovic, O., ‘Nature-based solution for improving mental health and well-being in urban areas’, Environmental Research, Vol. 158, 2017, pp. 385-392.
Wendling, L.A., Huovila, A., zu Castell-Rüdenhausen, M., Hukkalainen, and M., Airaksinen, M., ‘Benchmarking nature-based solution and Smart City assessment schemes against the Sustainable Development Goal indicator framework’, Frontiers in Environmental Science, Vol. 6, Art. no 69, 2018, 18 pp.
World Health Organisation, Urban green spaces and health, WHO Regional Office for Europe, Copenhagen, 2016.
World Health Organisation, Urban Green Space Interventions and Health: A review of impacts and effectiveness, WHO Regional Office for Europe, Copenhagen, 2017.
Xiang, P., Wang, Y., and Deng, Q., ‘Inclusive nature-based solutions for urban regeneration in a natural disaster vulnerability context: A case study of Chongqing, China’, Sustainability, Vol. 9, No 7, 2017, pp. 1-13.

174

Drawing on knowlegde from projects funded by the European Union
Image: Tongzhou urban forest - Photo © Beijing Forestry Bureau
CLEARING HOUSE
Barcelona (ES) Beijing (CN)
Hangzhou (CN) Hong Kong - Guangzhou - Shenzhen (CN)
Brussels (BE) Krakow (PL) Leipzig (DE)
Gelsenkirchen (DE)
Huaibei (CN) Xiamen (CN)
CLEARING HOUSE addresses a global challenge that unites European and Chinese cities in their quest to develop more resilient cities and liveable societies. Our main focus is on tree-based green infrastructure which is the basis for “urban forests as nature-based solutions”. Urban Forests as nature-based solutions (UF-NBS) are nature-based solutions that build on tree-based urban ecosystems to address societal challenges, simultaneously providing ecosystem services for hu-man ell-bein and biodiversit benefits - incl de eri- rban and rban orests orested parks, small woods in urban areas, and trees in public and private spaces. CLEARING HOUSE will analyse and develop the potential of UF-NBS– across China and Europe – in order to enhance the resilience of cities facing major ecological, socio-economic, and human wellbeing challenges.
Collaborative LEArning in Research, Information-sharing and Governance on How Urban forests as nature-based solutions support Sino-European futures

Trees are the solution - Implementing and managing tree-based ecosystems as nature-based solutions for sustainable urbanization
Learn more www.clearinghouseproject.eu
The CLEARING HOUSE project has received funding from the European Union‘s Horizon 2020 research and innovation programme under grant agreement No 821242.
The tools that CLEARING HOUSE is developing are ai-med towards citizens, local and regional authorities, landscape architects, environmental planners, urban planners, architects, decision-makers, politicians and natural resource managers. But also experts from pu-blic health and social work will be able to use our tools, to support UF-NBS as a tool to combat social injustice and health inequality. Citizens and citizen groups will be able to use the citizen science tool, by mapping existing resources and having their impacts asses-sed by the tool. The scenario evaluator and bench-marking tools are more focused towards experts, decision-makers, and planners: planners and experts can design solutions and create diverging scenarios; decision-makers can make informed decisions based on the assessment of the diverging scenarios by the scenario evaluator and the benchmarking tool.
CLEARING HOUSE is focusing on the impact created by tree-based ecosystems in an urban and peri-ur-ban context. CLEARING HOUSE is using innovative approaches and innovative tools to assess the im-pact of trees, woods and forests to the urban en-vironment, based on a holistic and interdisciplinary analytical framework. CLEARING HOUSE is develo-ping a citizen science UF-NBS monitoring tool, that citizens can use to map, asses and monitor UF-NBS and their socio-ecological impacts. A benchmar-king tool will allow to compare UF-NBS in different settings, and will be used as a quick scan to asses UF-NBS designs. The scenario evaluator will allow to optimize UF-NBS planning, design and manage-ment at the local and regional level.
We have learned that people and trees have an intense relationship. his is helpful to find sup-port and funding for designing, planting and ma-naging trees, woods and forests in and around towns and cities. The COVID-19 pandemic – and its resulting restrictions – have showed that ur-ban green spaces are very important to the pu-blic, and that they offer space for finding peace and to recover, places for recreation and physical activity, but also to meet other people in a soci-ally distant way.
owever, tree-based impacts are difficult to as-sess completely, as they provide a range of be-nefits but also disbenefits. isbenefits tend to be overlooked, which in the end can lead to ten-sions related to trees in the urban area.
NGOs
Landscape businesses
Schools and kindergartens
politicians
Natural resource managers
Municipal Administrations
Scientists / Academia
Planning experts
Citizen
SCOPE
Approach to Impact Assessment
Involved Stakeholders and roles
Lessons learned
Main Challenges addressed
5. Biodiversity
9. Participatory Planning and Governance
3. Natural and Climate Hazards
7. Place Regeneration
11. Health and Wellbeing
2. Water Management
1. Climate Resilience
6. Air Quality
10. Social Justice and Social Cohesion
4. Green Space Management
8. Knowledge and Social Capacity Building
12. New Economic Opportunities & Green Jobs

Drawing on knowlegde from projects funded by the European Union
Image: Urban Afforestation in Aarhus ULL - Photo © Aarhus Municipality
REGREEN
Aarhus (DK) Velika Gorica (HR)
Beijing (CN)
Paris Region (FR)
Ningbo (CN) Shanghai (CN)
REGREEN aims to substantially advance evidence and tools by systematically modelling ecosystem services and biodiversity, and examining synergies and trade-offs between them. This forms the basis for guiding city authorities in effective planning and imple-mentation of urban NBS in Europe and China. This includes policy experimental learning, strate ies or de avement ed cation and citi en science in sc ools val ation o benefits and costs and the development of business models for realising spatially relevant NBS that provide multiple ecosystem services and wellbeing.
Fostering nature-based solutions for equitable, green and healthy urban transitions in Europe and China

lti le e amined at fine resol tion and assessed at cit scale
earn more re reen- ro ect e
The REGREEN project has received funding from the European Union‘s Horizon 2020 research and innovation programme under grant agreement No 821016
In REGREEN, Urban Living Labs (ULLs) are formed by municipal administrations, a regional develop-ment agency and network of local and regional go-vernments in Europe and China together with local universities and SMEs. Together, they work on unco-vering, mapping and engaging a whole ecosystem of local stakeholders in order to advance the agenda of regreening cities. For instance, ULL transition work-shops in Europe and China will enable sharing of ex-perience between ULLs and with local stakeholders; experimental policy learning in the ULLs among the public, stakeholders and city authorities aims to nur-ture innovative and novel governance approaches to NBS; and co-creation with children, schoolteachers, park managers and landscape architect students will enhance children’s play and learning activities.
By creating new ecosystem service models which take into account local situations, the project will produce new tools and guidance which can be used in the planning stage of NBS design. A strength of the tools is to help city authorities find the optimum location for any intervention, which can satisfy mul-tiple outcomes. The potential impact of new NBS can be assessed through scenarios, using the models to evaluate before and after situations at the planning stage. The metrics produced by the models allow as-sessment against physical metrics (amount of noise mitigated, pollution removed, biodiversity enhanced) and societal, health and economic metrics where ap-propriate (such as number of people experiencing reduced heat-stress, economic value of carbon se-questered). Metrics of success in the project include the number of new NBS projects where scientific out-comes from REGREEN have helped inform the design or location at the planning stage.
Although still at an early stage in the project, there is genuine interest from city authorities in how REGREEN can help design and optimize lo-cations for new planned NBS initiatives. To this end, REGREEN co-creates with city authorities comprehensive scenarios of NBS interventions that form the basis for assessing the multiple im-pacts of NBS in ecosystem models. Impacts co-ver air pollution, urban heat islands, noise, ood- ing, water quality and biodiversity. Valuation of benefits to society and costs of implementation and maintenance will further help city authorities prioritise and plan NBS interventions.
s
reen b sinesses
c ools and inder artens
nici al dministrations
cientists cademia
lannin e erts
Citizen
SCOPE
roac to m act ssessment
nvolved ta e olders and roles
essons learned
ain allen es addressed
iodiversit
artici ator lannin and overnance
at ral and limate a ards
lace e eneration
ealt and ellbein
ater ana ement
limate esilience
ir alit
ocial stice and ocial o esion
reen ace ana ement
no led e and ocial a acit ildin
e Economic ort nities reen obs

EVALUATING THE IMPACT OF
NATURE-BASED
The Handbook aims to provide decision-makers with a comprehensive NBS impact assessment framework, and a robust set of indicators and methodologies to assess impacts of nature-based solutions across 12 societal challenge areas: Climate Resilience; Water Management; Natural and Climate Hazards; Green Space Management; Biodiversity; Air Quality; Place Regeneration; Knowledge and Social Capacity Building for Sustainable Urban Transformation; Participatory Planning and Governance; Social Justice and Social Cohesion; Health and Well-being; New Economic Opportunities and Green Jobs.
Indicators have been developed collaboratively by representatives of 17 individual EU-funded NBS projects and collaborating institutions such as the EEA and JRC, as part of the European Taskforce for NBS Impact Assessment, with the four-fold objective of: serving as a reference for relevant EU policies and activities; orient urban practitioners in developing robust impact evaluation frameworks for nature-based solutions at different scales; expand upon the pioneering work of the EKLIPSE framework by providing a comprehensive set of indicators and methodologies; and build the European evidence base regarding NBS impacts. They reflect the state of the art in current scientific research on impacts of nature-based solutions and valid and standardized methods of assessment, as well as the state of play in urban implementation of evaluation frameworks.
Studies and reports