Embed Size (px)
Citation preview
UNIVERSITY OF OSLODepartment of Informatics
Evaluating theHuman Factorin InformationSecurity
Master thesis
TheodorosNikolakopoulos
Network and SystemAdministration
Oslo University College
Spring 2009


iii
Evaluating the Human Factorin Information Security
Theodoros Nikolakopoulos
Network and System AdministrationOslo University College
Spring 2009
Abstract
Despite the vast research in Information Security, the human factor has beenfound to lack interest from the research community, with most security re-search giving focus on the technological component of an Information Tech-nology system. Regardless of any introduced technological solutions, the hu-man factor is still subject to attacks and thus, in need of auditing and address-ing any existing vulnerabilities. This research evaluates the human factor bythe creation of a survey which examines five distinct user properties. Each ofthese properties comprise a series of questions, which with their turn assist onconfirmation or refutation of five hypotheses. The survey was conducted ontwo higher academic institutions and distributed to all members of staff whohave access on electronic information. Results have shown that the humanfactor has a significant role in Information Security; it is confirmed that users’behaviour is linked to technology interaction, data importance perception andsecurity oriented education. Furthermore, there is evidence that users who arenon vulnerable to various types of attacks, are not necessarily invulnerable tosocial engineering attacks.

vi

Acknowledgements
I would like to express my sincere appreciation to the following individualsfor the support they offered me during the research process. My project su-pervisor, Siri Fagernes, for her valuable advice and editing; Alva Couch, forsharing with me his research experience by giving strategic advice and editing;Mark Burgess, for his inspirational discussions and guidance; Asulv Frøysnes,Ole Lycke and Konstantinos Katsifis, for the distribution of the derived surveyto Oslo University College and Domi Educational Group respectively; DagLangmyhr, for his precious help with the survey translation; my colleague,Martin Oppegaard for his assistance with the survey translation and editing;and lastly Maja Oppegaard for verifying the survey translation.
Theodoros Nikolakopoulos
vii

Table of Contents
1 Introduction 11.1 Human Error . . . . . . . . . . . . . . . . . . . . . . . . . . . . . 11.2 Human Error and System Intrusion . . . . . . . . . . . . . . . . . 1
1.2.1 Characteristics of a System Intrusion . . . . . . . . . . . . 11.2.2 Targeted System Components . . . . . . . . . . . . . . . . 21.2.3 Insecure by Default . . . . . . . . . . . . . . . . . . . . . . 3
1.3 Towards Creating a Secure System . . . . . . . . . . . . . . . . . 31.3.1 System Security Threats . . . . . . . . . . . . . . . . . . . 31.3.2 System Security Goals . . . . . . . . . . . . . . . . . . . . 4
1.4 Security Implementation . . . . . . . . . . . . . . . . . . . . . . . 41.4.1 Linking the Human Factor . . . . . . . . . . . . . . . . . 51.4.2 Problem Statement . . . . . . . . . . . . . . . . . . . . . . 51.4.3 Targeted Installations . . . . . . . . . . . . . . . . . . . . 6
2 Literature Review 7
3 Model and Methodology 133.1 Research Method Types . . . . . . . . . . . . . . . . . . . . . . . 13
3.1.1 Quantitative . . . . . . . . . . . . . . . . . . . . . . . . . . 133.1.2 Qualitative . . . . . . . . . . . . . . . . . . . . . . . . . . . 133.1.3 Summary . . . . . . . . . . . . . . . . . . . . . . . . . . . 14
3.2 The Research Process . . . . . . . . . . . . . . . . . . . . . . . . . 143.2.1 Principles . . . . . . . . . . . . . . . . . . . . . . . . . . . 143.2.2 User Properties . . . . . . . . . . . . . . . . . . . . . . . . 163.2.3 Formulating the Hypotheses . . . . . . . . . . . . . . . . 173.2.4 Data Collection . . . . . . . . . . . . . . . . . . . . . . . . 193.2.5 Data Analysis . . . . . . . . . . . . . . . . . . . . . . . . . 22
3.3 Human Factors Security Survey . . . . . . . . . . . . . . . . . . . 233.3.1 Questions . . . . . . . . . . . . . . . . . . . . . . . . . . . 23
4 Results Evaluation 434.1 Data Coding . . . . . . . . . . . . . . . . . . . . . . . . . . . . . . 43
4.1.1 Password Scoring System . . . . . . . . . . . . . . . . . . 444.1.2 Uncertainty Answers . . . . . . . . . . . . . . . . . . . . . 44
4.2 Data Interpretation . . . . . . . . . . . . . . . . . . . . . . . . . . 444.3 General Observations . . . . . . . . . . . . . . . . . . . . . . . . . 464.4 First Hypothesis . . . . . . . . . . . . . . . . . . . . . . . . . . . . 48
viii
4.5 Second Hypothesis . . . . . . . . . . . . . . . . . . . . . . . . . . 504.6 Third Hypothesis . . . . . . . . . . . . . . . . . . . . . . . . . . . 524.7 Fourth Hypothesis . . . . . . . . . . . . . . . . . . . . . . . . . . 544.8 Fifth Hypothesis . . . . . . . . . . . . . . . . . . . . . . . . . . . . 56
5 Future Suggestions 59
6 Conclusion 61
Appendices 63
G Informed Consent 65
H R code for General Observations 67
I R code for Hypotheses Evaluation 69
Bibliography 75
ix
List of Figures
1.1 The Targeted System Components . . . . . . . . . . . . . . . . . 21.2 Linking the Human Factor . . . . . . . . . . . . . . . . . . . . . . 5
3.1 The Research Process Flow Diagram . . . . . . . . . . . . . . . . 15
4.1 First Hypothesis Results Representation . . . . . . . . . . . . . . 484.2 First Hypothesis x axis Histogram . . . . . . . . . . . . . . . . . 494.3 First Hypothesis y axis Histogram . . . . . . . . . . . . . . . . . 494.4 Second Hypothesis Results Representation . . . . . . . . . . . . 504.5 Second Hypothesis x axis Histogram . . . . . . . . . . . . . . . . 514.6 Second Hypothesis y axis Histogram . . . . . . . . . . . . . . . . 514.7 Third Hypothesis Results Representation . . . . . . . . . . . . . 524.8 Third Hypothesis x axis Histogram . . . . . . . . . . . . . . . . . 534.9 Third Hypothesis y axis Histogram . . . . . . . . . . . . . . . . . 534.10 Fourth Hypothesis Results Representation . . . . . . . . . . . . . 544.11 Fourth Hypothesis x axis Histogram . . . . . . . . . . . . . . . . 554.12 Fourth Hypothesis y axis Histogram . . . . . . . . . . . . . . . . 554.13 Fifth Hypothesis Results Representation . . . . . . . . . . . . . . 564.14 Fifth Hypothesis x axis Histogram . . . . . . . . . . . . . . . . . 574.15 Fifth Hypothesis y axis Histogram . . . . . . . . . . . . . . . . . 57
x

List of Tables
3.1 The User Properties and Contributing Questions Matrix . . . . . 183.2 The Hypotheses and Contributing Questions Matrix . . . . . . . 20
4.1 Functions for the Hypotheses Evaluation . . . . . . . . . . . . . 454.2 General Observations . . . . . . . . . . . . . . . . . . . . . . . . . 474.3 Median Values for the axes of First Hypothesis . . . . . . . . . . 484.4 Median Values for the axes of Second Hypothesis . . . . . . . . 504.5 Median Values for the axes of Third Hypothesis . . . . . . . . . 524.6 Median Values for the axes of Fourth Hypothesis . . . . . . . . . 544.7 Median Values for the axes of Fifth Hypothesis . . . . . . . . . . 56
xi

xii

Chapter 1
Introduction
1.1 Human Error
A system is a collaboration among different entities towards achieving a com-mon goal. An Information Technology system is a system where people andtechnology, having their own components and related activities, interact forthe same purpose. It often occurs that systems fail to function as expected,and likewise for Information Technology systems. It is not only the machinepart of the system that must function properly but also the user; when a userfails, human error appears. Human error is actually one of the primary reasonsfor system failure. This is a result of trying to reduce the human nature into asimplified model. The process of simplifying a model to make it easier to useinvolves removing elements, which initially might not seem of importance;but the lack of them could have catastrophic results. Such is also the case withInformation Technology; systems which are human made, are reduced mod-els of a reality that we want to represent and follow the erroneous patterns oftheir creators, us. Our analog nature is constrained in a digital world of bi-nary digits which obeys the very same commands that we dictate. Therefore,an error is something that we can expect because there are almost unlimitedpossibilities for something unexpected to occur.
1.2 Human Error and System Intrusion
1.2.1 Characteristics of a System Intrusion
System vulnerability is a system state that could allow an intrusion. An intru-sion is a successful attempt to penetrate a system through exploiting an exist-ing vulnerability. It is not necessary that a vulnerable component will lead toan intrusion; however, a responsible system management should keep vulner-abilities from being exploited. An attacker first tries to identify the weakestpoint of a system; although solid looking defences might also be exploitable,the weakest point of a system offers a higher attack success rate and thereforeit is on average the first to be targeted.[1]
1
1.2.2 Targeted System Components
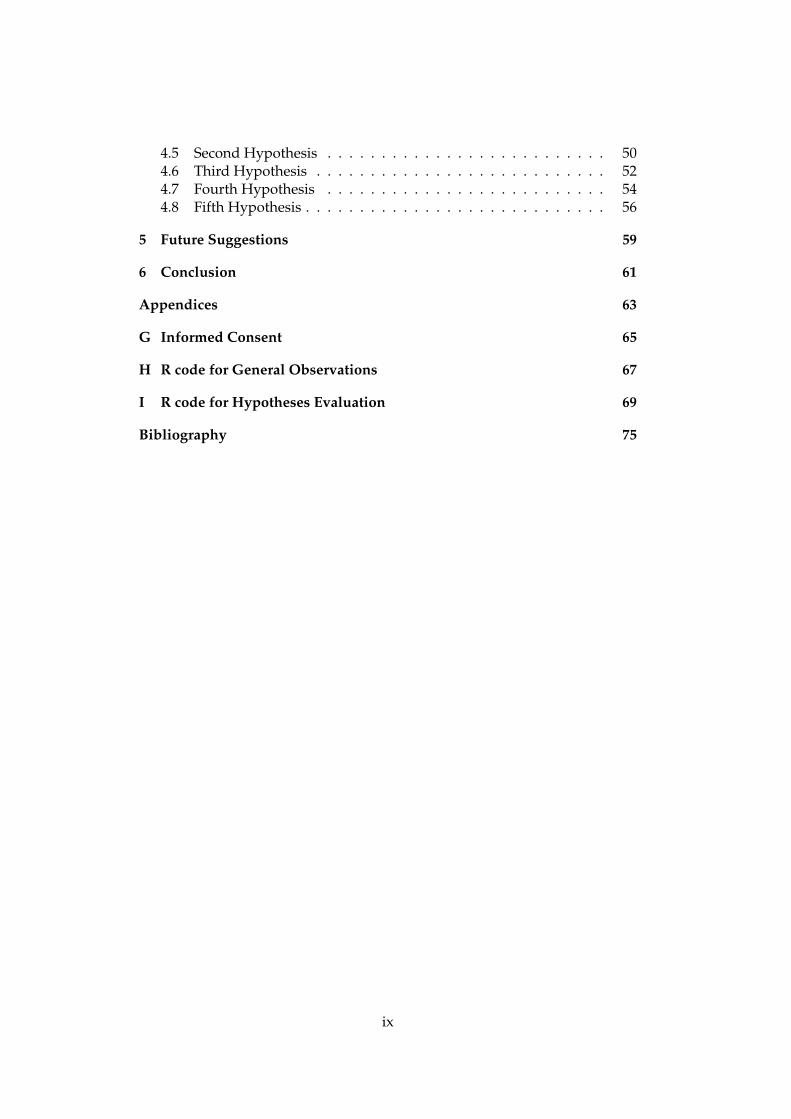
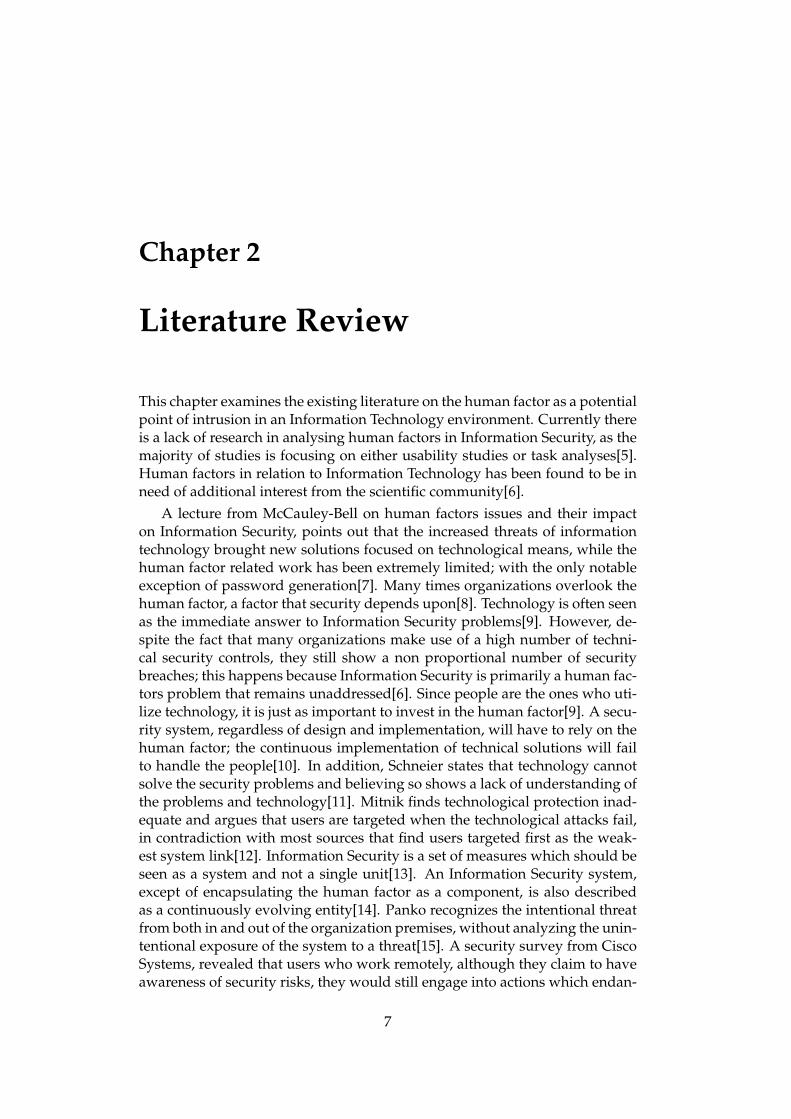
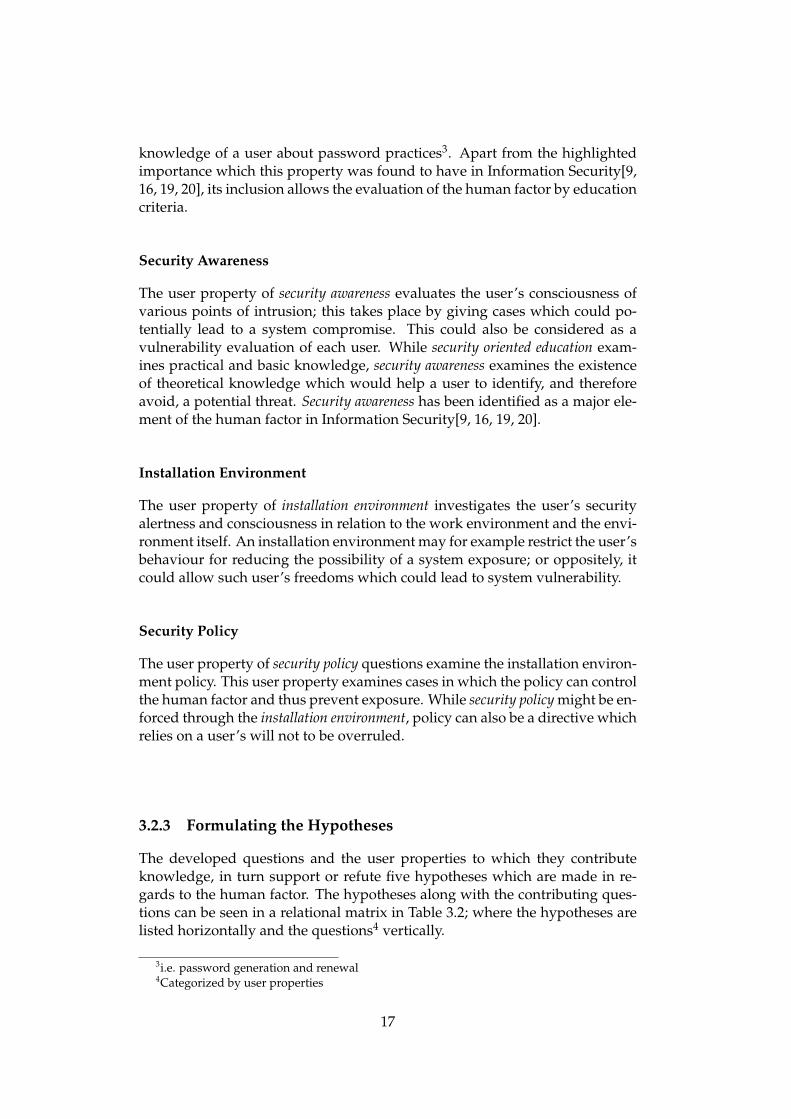
The technological part of an Information Technology system consists of hard-ware, software and data. These components may be targeted directly or not;when attacked directly then the human part of the system is not exploited,when these components are attacked indirectly it implies that the human partof the system is exploited as well. Figure 1.1 shows component interactions.
HARDWARE SOFTWARE DATA
Figure 1.1: The Targeted System Components
Hardware
Hardware is the physical part of a computer system. It is the lowest level of anInformation Technology system and it hosts both the software and data com-ponents. Some hardware components are the hard disk, the memory modulesand keyboard. Attacks which target the hardware are usually the hardest todefend against as most security measures aim the software and data protec-tion. An example of an indirect hardware-based attack would be a hardwarekeyboard listener, installed to deceive the legitimate system user.
Software
Software is the part of the computer system which enables all functions byharmoniously managing all hardware resources. Software includes the Op-erating System, any installed applications and hardware firmware as well; itlies between the user and the hardware and enables the latter to effectivelyuse the former. Most security solutions are software-based, as it is the mosttargeted system component; an example of an indirect software based attackwould be the execution of malicious code on the system through a persuadingemail attachment. This would allow the attacker to gain system access whenthe targeted user allows code execution by opening the attachment.
Data
Data is all the system output which is generated by the process of softwareexecution. Data are not directly executed from the hardware but are used inthe software layer. As data we could describe a database configuration, thedatabase contents or output of a database query. An indirect attack on datawould be to deceive a system user by phone by using a false authenticationand request details for a database record. It is worth noticing that unlike therest of the system components, data cannot be exploited directly but only if
2

another system component is compromised already. In the given example thehuman factor exposes the data after his successful exploitation.
1.2.3 Insecure by Default
Even if one has a perfectly designed system technologically, user is still analways possible system point of failure. One could tell that any system rely-ing on human interaction could be insecure by default; considering that allInformation Technology systems have the very same intrusion point, humaninteraction. Furthermore, as the assumption is an idealised reality, the truth isfar more insecure than it seems.
1.3 Towards Creating a Secure System
1.3.1 System Security Threats
The first step of creating a secure system in a general context, is to identifythe potential threats. The threats of a system could be categorized as intercep-tion, interruption, modification and fabrication. These four classes compriseall kinds of threats that a system could encounter.[1]
Interception
The term interception means that information has become available to an ex-ternal source without appropriate authority. An external source can be a per-son, a program or a system, and it could be detected or not.[1] Good examplesof traced and non traced interceptions could be wiretapping which is not suc-cessful and successful respectively.
Interruption
Interruption is when a system component becomes lost, unavailable or unusable[1].An example would be when the cables connecting a critical system are inten-tionally destroyed; then system connectivity is interrupted and the resourceswithin automatically become unavailable.
Modification
Unlike interception, modification not only involves an unauthorized party ac-cessing a system component, but also modifying it. Modifications can be de-tected or not; depending on the technical visibility of changes.[1] An exampleof detectable modification would be a computer virus which alters the key-board output; in that way the user will instantly become aware of a systemalteration. In the other hand, if the same system is infected by a rootkit in-stead, although there are changes on the system kernel; the user might notdetect any difference in system output or overall experience.
3

Fabrication
By fabrication we mean the injection of counterfeit objects from an unautho-rized party[1]. As these are additional objects it might be easier to detect but itdepends on the attackers’ proficiency. For example a malicious user could in-sert a module at a bank database server which would deposit to his account foreach transaction a certain very small, and supposedly undetectable, amount.
1.3.2 System Security Goals
Information Security aims to ensure data confidentiality, integrity and availability[1,2]; three properties which can guarantee data security.
Confidentiality
Confidentiality is present when every system component is accessed by onlyauthorized parties. The term access includes knowing the very existence of thesystem component, viewing or printing.[1]
Integrity
Integrity ensures that the system components can be modified by only autho-rized parties or manner. Modification includes writing, changing, changingstatus, deleting and creating.[1]
Availability
Availability means that system components are accessible to authorized par-ties at defined times. An antonym of availability would be the denial of service,where the access to a particular set of objects is denied at a given time.[1]
1.4 Security Implementation
With all threats mapped, reaching the goal of a secure system would normallybe only a matter of cost. However, security is a frequently underrated aspectof technology. Although a responsible process for building an InformationTechnology system incorporates security, one needs to be aware of commonsecurity practices and that the human factor is often the first point of failure.The existence of the security mechanisms does not itself guarantee an a priorisecure system, just as proper security oriented configuration does not guaran-tee data protection. For a solid security implementation, human factors shouldbe evaluated, and addressed when necessary.
4
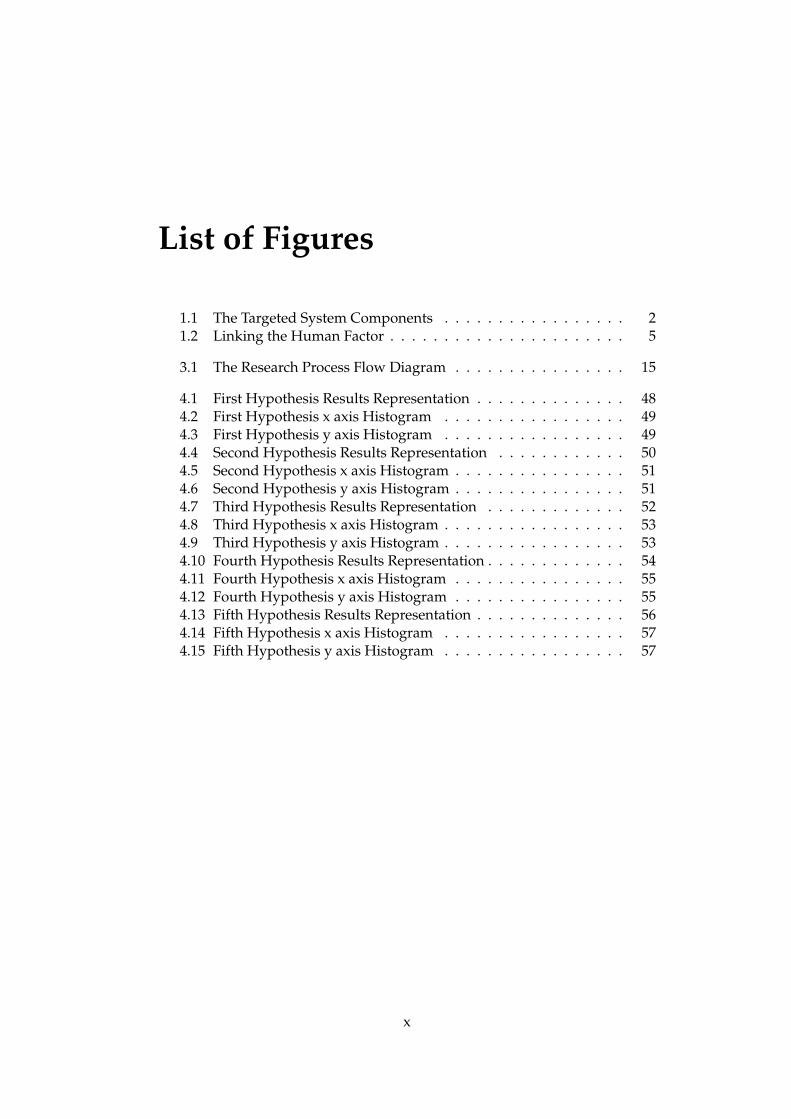
1.4.1 Linking the Human Factor
Regardless of which technological component1 gets compromised, a compro-mise leads to failure of one or more of the security goals. Therefore, the focusof the investigation will be on the potential point of intrusion, which in oursubject is the human factor. The attacks will be examined according to humanoriented criteria and not technological ones. Figure 1.2 indicates the topologyof all the basic components on an Information Technology system under attackand where the human factor is placed within it.
ATTACKER
HARDWARE
SOFTWARE
DATAUSER
SYSTEM ACCESS
TECHNOLOGY
INFORMATION TECHNOLOGY SYSTEM
ATTACK
Figure 1.2: Linking the Human Factor
1.4.2 Problem Statement
It is a false assumption that people follow by default secure behavioural pat-terns and therefore system security expectations should be satisfied. One morefalse claim is that security is something that can simply be purchased; the hu-man factor can prove the most confident expectations false. The human factoris without doubt a critical point in Information Security. People might takeinexperienced decisions which would allow an attacker to take advantage of,or might even intentionally attack their premises; as examining the intentionalattack of one on his own premises would involve also topics of wider purportsuch as psychology, these will not be presently investigated.
The current work will examine the accidental potential points of intrusionfrom a human factors perspective. There will be an evaluation of the overallexisting human factors status. The human factor vulnerability will be tested bydeveloping a survey, which will be distributed to users who interact with thetargeted installations. The survey will examine the following user properties:
• Population
• Security Oriented Education
1i.e. hardware, software, data
5

• Security Awareness
• Installation Environment
• Security Policy
These properties will be defined in detail later in the Model and Methodologychapter. The initial suggestion is that people who interact with the examinedinstallations are capable of allowing a system intrusion.
1.4.3 Targeted Installations
The installation environments which will participate on the survey study aretwo higher academic institutions. The Domi Educational Group from Hellasand Oslo University College from Norway. Both schools have a large num-ber of students; Domi Educational Group has about four thousand studentsand Oslo University College more than eleven thousand. The number of to-tal employees for each school is also high; the estimated personnel which hasaccess on data is one hundred and fifty for Domi Educational Group and fivehundred for Oslo University College. As both clients are academic institutionstheir assets are joined. Both installation environments are interested into asolid reputation and elimination of any direct or indirect financial losses that asuccessful attack could involve.
Academic Institutions as Prime Targets
Academic institutions are often targeted as they offer increased anonymity foran attacker. With student accounts being created every semester the popula-tion is not static; therefore they accommodate a much easier way for having avery clear idea of the system’s internal workings and remaining anonymousat the same time[1]. It has been reported in the past that attackers who are tar-geting major traffic websites, first practice on university computers[3]. Suchinstitutions are generators of curiosity and scientific challenges which oftenresults in students experimenting upon its own infrastructure[1]. It would beexpected therefore, to receive attacks from the inside even without having amalicious intention but just for the sake of proof. An institution is expected tobe less secure than a corporate environment and there is usually a less strictmaintenance of the system[4]. In addition, an educational institution environ-ment might be less secure for enhancing the student experience with a higherease of use, something that is also taken advantage of. For all the above rea-sons, the suitability of an educational institution for examining the human fac-tor vulnerability is excellent.
6
Chapter 2
Literature Review
This chapter examines the existing literature on the human factor as a potentialpoint of intrusion in an Information Technology environment. Currently thereis a lack of research in analysing human factors in Information Security, as themajority of studies is focusing on either usability studies or task analyses[5].Human factors in relation to Information Technology has been found to be inneed of additional interest from the scientific community[6].
A lecture from McCauley-Bell on human factors issues and their impacton Information Security, points out that the increased threats of informationtechnology brought new solutions focused on technological means, while thehuman factor related work has been extremely limited; with the only notableexception of password generation[7]. Many times organizations overlook thehuman factor, a factor that security depends upon[8]. Technology is often seenas the immediate answer to Information Security problems[9]. However, de-spite the fact that many organizations make use of a high number of techni-cal security controls, they still show a non proportional number of securitybreaches; this happens because Information Security is primarily a human fac-tors problem that remains unaddressed[6]. Since people are the ones who uti-lize technology, it is just as important to invest in the human factor[9]. A secu-rity system, regardless of design and implementation, will have to rely on thehuman factor; the continuous implementation of technical solutions will failto handle the people[10]. In addition, Schneier states that technology cannotsolve the security problems and believing so shows a lack of understanding ofthe problems and technology[11]. Mitnik finds technological protection inad-equate and argues that users are targeted when the technological attacks fail,in contradiction with most sources that find users targeted first as the weak-est system link[12]. Information Security is a set of measures which should beseen as a system and not a single unit[13]. An Information Security system,except of encapsulating the human factor as a component, is also describedas a continuously evolving entity[14]. Panko recognizes the intentional threatfrom both in and out of the organization premises, without analyzing the unin-tentional exposure of the system to a threat[15]. A security survey from CiscoSystems, revealed that users who work remotely, although they claim to haveawareness of security risks, they would still engage into actions which endan-
7

ger the system security[16].The unauthorized use of computer systems is made by either accidental or
deliberate causes[5]. Accidental causes are any unexpected natural disastersand the human factor1; for example, power surges or misconfiguration[5]. Thedeliberate causes are actions made by conscious choice2; for example, using aprogram flaw to gain access on a computer system[5]. An evaluation of factorswhich produce security breaches, has shown that sixty five percent of the eco-nomic loss in Information Security breaches is due to human error, and onlythree percent from malicious outsiders[7]. Considering the fact that the effortsto evaluate the human factor in Information Security are basically nonexistent,it is questionable why there has been so much focus on technological means[7].
People as part of the system interact by developing, implementing andusing both software and hardware; when a user has poor training, an idealand flawless software or hardware solution will still not be of any use[13].Therefore, people will always be a weak system component[13]. Users oftenperceive their computer systems as a black box, without understanding or thefunctionality or will to know it[13, 16]. A good example is that users wantto operate their computers in the same way as any other household electricappliance[13]. Many users are found to treat confidential information in anirresponsible manner, by having empty passwords or using their name as one;in contradiction to the fact that the same users would never intentionally leavetheir keys in the outside lock[13]. Regardless of the partial automation that isintroduced, people are without doubt involved in technology[6]. Therefore,there is a probability for human error which may result in system exposure[6].
As employees have by de facto access and knowledge about the system,they are themselves a potential point of intrusion; therefore, the security ofan Information Technology system is greatly affected[17]. Security issues maycome into surface when the skills of the employees are higher[17]. This couldoccur if users would need to use additional software or by considering thatthey have the knowledge for exploiting any existing system vulnerabilities;additional software could increase the attack surface and an employee with ex-ploitation knowledge could willingly attack the organization from inside[17].However, it could occur that users with higher technological skills usually re-quire software that they already have the necessary administrative and secu-rity configuration skills for. Therefore, this would be something that might notbe necessarily true and requires further investigation from the research com-munity.
Security breaches are often caused by careless and unaware users[14]. Themajority of people want to get their jobs done more than they are interested inprotecting themselves; a behavioural tendency that gives surface for attacks[11].In addition, most people do not understand subtle threats and they engageinto actions which might expose the system[11]. One more view that was notmentioned by any of the related sources is the exception handling, or differ-ently how people might react when something unexpected occurs; many times
1The accidental human derived causes can be also called human error2i.e. attacks
8

attackers rely on the alternative actions that people might take when they en-counter something for the first time[11].
Another human factors vulnerability is social engineering; it often happensthat attackers directly exploit the user by persuading them to do what theywant[11]. Social engineering is a highly effective attack which bypasses everytechnological protection[11]. Attackers usually are taking advantage of a userstrust; building this relation before the attack if necessary[12]. Additionally,quite frequently social engineering attacks rely on the lack of authenticatingsomeone, especially when the correspondence happens through a telephonecall; then the attacker might for example pretend to be a person with authorityor a fellow employee in need of help[12]. Schultz highlights the unsolved userawareness problem which is confirmed from a mentioned survey, showingthat twenty percent of users would not avoid opening email attachments[6].
End users are usually less trained, experienced and security-aware thanthe Information Technology staff; that makes them the most subject to attackpersonel in an organization. On top of this, the security vulnerabilities forworkstation computer systems are found to be much more than for the serverones; increasing dramatically the possibility of being targeted and the impor-tance of security at workstations. With the workstation accepted as the weak-est link of an Information Technology system, an organization can succeed se-curity wise only if it incorporates workstations and their users into the defencefrontline.[18]
Security is outlined as a continuous process which require a stopless in-vestment in both technology and users’ education; technology, as only a partof it, cannot be the only component for having a secure infrastructure[14].Users should get educated about risks and responsibilities; education andawareness[1] are identified as key factors in addressing the human elementof security[16]. Except giving users an understanding of threats existence, it isalso proposed to convince users of the need for security; people would thenfollow the security requirements in a given situation[1, 16].
A Masters thesis which evaluates Information Technology security per-formance, also conducts a human factors evaluation according to awareness,training and education[8]; however, the evaluation is made from an organi-zational perspective and not user-wise, so the results do not come from theusers.
A booklet published by a technical group with the topic of system security,is found to be oriented on asset threats and not security threats on assets, so itcould be described as a more general reference. The target group of this publi-cation is system administrators and it is written as a sum of good practices andnot a scientific publication. The human factor intrusion probability is only cat-egorised under the intentional human threats, while there is a clear possibilityof a security incident due to lack of knowledge of the human factor. Althoughit is noted that the security issue is mainly a problem born from people; thesuggested addressing is mostly software based, attempting to solve a humanoriented issue by altering the technological component of the system. The au-thors suggested user-centric solution by enhancing education, is made onlyin regards to social engineering.[19] Finally, there is an insufficient identifica-
9
tion of the human factor as an unintentional threat and a narrow suggestion ofusing user education for preventing attacks on the system.
A publication of a similarly general perspective which aims to cover secu-rity in an enterprise environment, was also found to lack in consideration ofthe human factor role in security[20]. Although the fact that the threat sourcesare identified to originate from both inside and outside the premises, in thegiven defence examples, the threats are perceived to be out of premises, al-ways with the intention and attacking through technical means. Therefore,similarly as the previously reviewed source, the majority of the defence mech-anisms are either software or hardware oriented. A very brief reference onsocial engineering is again made with suggestions for reducing such occur-rences. The likehood of an accidental exposure of the system through a useris not evaluated; however, in the appendices the section of the Enterprise Sys-tems Security Review does include a human factors checklist which mentionseducation and awareness, as two attributes which should be examined.
Panko suggests that for designing or auditing security operations, the prin-ciple of having clear roles should be implemented[15]. The roles define whodoes what and determine procedures[15]. Another interesting contributionis the suggestion to do user training[15]; compiled by three parts, securityawareness, accountability and self-defence[15]. The security awareness train-ing would aim to help users understand the existence of threats by utilizingattack patterns and case studies[15]. Accountability training would help usersbe familiar with actions that they should either avoid or not, according to spe-cific rules and the understanding beneath them[15]. By the term or self-defencetraining, it is meant to prepare a user for taking an appropriate action duringan attack; in addition, part of the self-defence training should be using theusers on detecting problems or reporting improper user behaviour[15]. An al-ternative solution of Mitnik is having basic training for everyone and furthertraining according to the users’ specific position[12]; a solution which takesinto consideration the role principle that Panko gives.
Hinson recognizes awareness as the most cost-effective security controland makes a suggestion on how to optimise control investment; however,without giving a solution[9]. In regards to proactive risk management, it isfound that many organizations evaluate new products and do periodic testingon the technological part of their systems, but very few make a serious attemptto identify risks in relation with the system users[9]. Improvements in securityrequire improved understanding of feedback[10]; since the feedback from thetechnological component can be automated3, a remaining uncovered topic isthe one of human factors.
While Kraemer creates a human factors evaluation method for computerand Information Security, it does have certain constraints. The derived vul-nerability evaluation follows a technical vulnerability audit and it takes placeon top of vulnerabilities with the human factor components[5]; this limits thepossibility of having a human factors vulnerability evaluation without inspect-ing the technological component. In addition, the vulnerability evaluation is
3i.e. software/hardware monitoring
10

made only according to the earlier found technical vulnerabilities[5] and there-fore there is a large part of the human factor, the non technical unintentionalvulnerabilities, which remain unaddressed. The feedback comes through qual-itative interviews with the involved network administrators and not the endusers[5]; while by doing the opposite the obtained information would be moreprosperous and realistic. Furthermore, the evaluation is qualitative and basedon results which come from a qualitative analysis software package[5]; whichraises a risk of inconsistency as the results may vary if an improper categoriza-tion is made.
The previously investigated sources constitute the scientific basis for theexploration of human factors as a potential point of intrusion. The humanfactor is without doubt a critical part of Information Security[6, 7, 8, 9, 10, 11,13, 14, 16, 17, 19]. This occurs as users expect technology to be there and workfor them[13, 16] or simply because they overtake any security mechanism forgetting their jobs done[11]. With users being the most targeted and vulnerablelink of an Information Technology system, their defence should be of a higherpriority[18]. The primary focus of an investigation should be on the educationand security awareness of the user[9, 16, 19, 20], two attributes which maydefine exploitability as well. For addressing the human factor vulnerability,education is recognized as a key factor[1, 9, 11, 12, 14, 15, 16].
11

12

Chapter 3
Model and Methodology
This chapter goes through the approach used in the current study for evaluat-ing the human factor in the context of Information Security. The potential ofan unintentional security exposure of the system is examined. This approachcontributed to exploring the human factor in relation to attributes which affectbehaviour. The entire work is kept as general as possible1 in order to enable alater use in future research.
3.1 Research Method Types
There are two main research methods, quantitative and qualitative. The dis-tinction between quantitative and qualitative methods is made in accordanceto the question which is asked, the method behind the answer, and the preci-sion that one requires[21].
3.1.1 Quantitative
Quantitative research applies mathematical modelling and connects the prod-uct of research with it. In a quantitative method, the outcome will be measuredin relation to a quantity. This method is used in research where measurablescan be enumerated and mathematical relationships are known. A weakness ofquantitative research is when it comes in need to investigate many, different re-alities in various depths[22]. The greatest advantage is a more concrete frame-work and that the data are in an easier to analyse form[22]. During the earlysteps of evaluating research methodologies, quantitative research looked likethe most favoured choice. However, as the subject of study is anthropocentricand quantitative research makes it more difficult to receive a broader spectrumof answers, there was an evaluation of the qualitative research as well.
3.1.2 Qualitative
Qualitative research involves measuring data which is usually related to hu-man actions and the grounds behind them. Qualitative research is mostly used
1i.e. not constrained to examine academic institutions only
13

in behavioural sciences[21]. Qualitative data cannot be always quantified andmeasured in relation to a quantity; thus, qualitative research is inefficient whenit comes to identifying, measuring or quantifying a single statistic[22]. How-ever, an advantage of this research method is the ability to examine given phe-nomena with respect to multiple human perspectives. The free nature of re-search allows a more rich input that might contribute to a more specific learn-ing outcome[22]. Qualitative research is more appropriate for human orientedstudy research. Lack of numeric scoring allows freedom of choice on bothquestions and answers, and can offer a great input of knowledge to the study.A great disadvantage in comparison with quantitative research however, isthat the data cannot always be quantified.
3.1.3 Summary
Quantitative methods, although lacking the flexibility of examining multipleperspectives, makes it possible to examine most areas of interest through care-fully predefined questions. The capability to analyse the data without en-gaging into a process of quantification makes the entire process faster; whichwould result on the ability of having a larger target group as well. While qual-itative methods offer significant freedom of input, it also limits the numberof people who can participate in the evaluation; interviewing several peopleand analysing the results can be very time consuming. In addition, it can bedifficult, if not impossible, to conduct a remote interview at the participatinginstitute in Hellas; an email interview correspondence could be a lengthy pro-cess, in which not many people will be willing to engage. As the human factorevaluation outcome may vary from user to user, having a smaller data poolcould result in a less pragmatic result; for this and the rest of above statedreasons, the desired outcome is best addressed by following a quantitative re-search method.
3.2 The Research Process
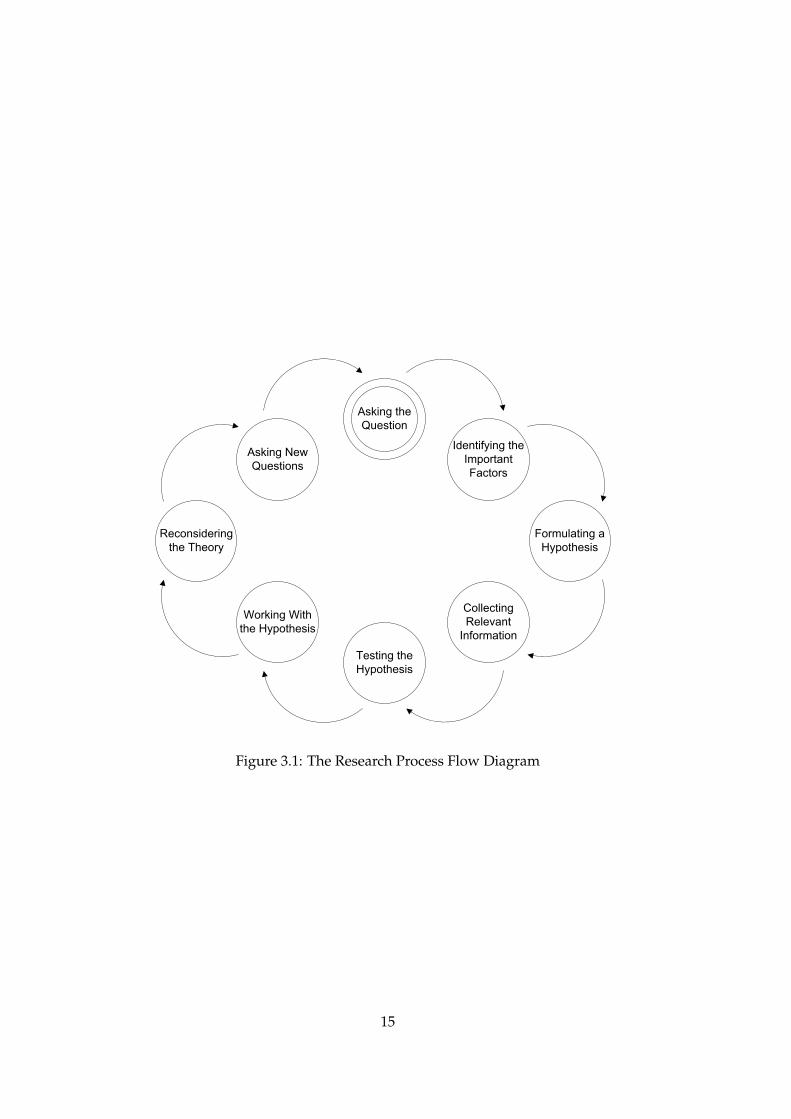
For the examination of the human factor, there were defined user properties,highlighted by the reviewed literature or considered to affect the human be-haviour in an Information Technology environment. These user properties areinvestigated via corresponding questions. Many of these questions contributeto defining several user properties. The next step was to create hypotheses tobe tested for various user properties. At the final stage, the data collection andanalysis takes place. The followed research process flow is visualised in Figure3.1.
3.2.1 Principles
The validity of this research depends upon the presence of prerequisite estab-lished and consistent knowledge. The first used scientific principle states that
14
Identifying the
Important
Factors
Formulating a
Hypothesis
Collecting
Relevant
Information
Testing the
Hypothesis
Working With
the Hypothesis
Reconsidering
the Theory
Asking New
Questions
Asking the
Question
Figure 3.1: The Research Process Flow Diagram
15
“Security mechanisms do not result on an a priori secure system”; it has beenshown that regardless of the introduced security mechanisms on a system,they would still be insufficient to ensure security. The second used scientificprinciple states that “Man as part of the system can be a point of intrusion”;it is proved that man can have a significant role on the system security, as afactor that interacts with the system it can always be a point of intrusion. Ifthese two principles would not be considered as established, the current workwould not apply in the given circumstances.
3.2.2 User Properties
The primary aim of defining properties for the human factor was to cover dif-ferent perspectives. In the course of reviewing the existing work on identifyingand addressing the human element of security, education and awareness werefound to be repeatedly mentioned among the sources as key factors[9, 16, 19,20]. However, there are more elements which would need to be examined formore extensive coverage; in addition to security oriented education and securityawareness the user properties which were added were the population, the in-stallation environment and the security policy. All the defined user propertiesmay affect the behaviour of a user in the context of an Information Technologyinstallation.
For investigating user properties, several questions were made in relationto each; many of these questions contribute knowledge on more than one userproperty, they were categorized on the one to which they contribute the mostand also linked to related ones. Not all derived questions give value to a hy-pothesis, but all give value to at least one user property.
Two additional user properties of responsibility and compliance were foundto arise from a users behaviour but not to define it. For this reason they wereincluded and linked to the questions which would contribute knowledge, butno questions were categorized as specifically measuring them, nor they wereused for the evaluation of any of the hypotheses. The user properties alongwith the contributing questions can be seen as a relational matrix in Table 3.1;where the user properties are listed horizontally and the questions2 vertically.
Population
The user property of population examines individual user characteristics. Thequestions under this category give an insight on the users experience and in-teractivity with technology, data protection responsibility and security inci-dent record. The addition of this user property assists in examining the resultsper certain population criteria.
Security Oriented Education
The user property of security oriented education helps to evaluate the knowledgelevel of a user. This investigates if previous security training exists and the
2Categorized by user properties
16
knowledge of a user about password practices3. Apart from the highlightedimportance which this property was found to have in Information Security[9,16, 19, 20], its inclusion allows the evaluation of the human factor by educationcriteria.
Security Awareness
The user property of security awareness evaluates the user’s consciousness ofvarious points of intrusion; this takes place by giving cases which could po-tentially lead to a system compromise. This could also be considered as avulnerability evaluation of each user. While security oriented education exam-ines practical and basic knowledge, security awareness examines the existenceof theoretical knowledge which would help a user to identify, and thereforeavoid, a potential threat. Security awareness has been identified as a major ele-ment of the human factor in Information Security[9, 16, 19, 20].
Installation Environment
The user property of installation environment investigates the user’s securityalertness and consciousness in relation to the work environment and the envi-ronment itself. An installation environment may for example restrict the user’sbehaviour for reducing the possibility of a system exposure; or oppositely, itcould allow such user’s freedoms which could lead to system vulnerability.
Security Policy
The user property of security policy questions examine the installation environ-ment policy. This user property examines cases in which the policy can controlthe human factor and thus prevent exposure. While security policy might be en-forced through the installation environment, policy can also be a directive whichrelies on a user’s will not to be overruled.
3.2.3 Formulating the Hypotheses
The developed questions and the user properties to which they contributeknowledge, in turn support or refute five hypotheses which are made in re-gards to the human factor. The hypotheses along with the contributing ques-tions can be seen in a relational matrix in Table 3.2; where the hypotheses arelisted horizontally and the questions4 vertically.
3i.e. password generation and renewal4Categorized by user properties
17

PopulationSecurity
Oriented
EducationSecurity
Aw
arenessInstallation
Environment
SecurityPolicy
Responsibility
Com
pliance
User
Properties
Population
q1X
q2X
q3X
q4X
q5X
q6X
q7X
XX
q8X
XX
q9X
Xq10
XX
SecurityO
rientedEducation
q11X
q12X
Xq13
XX
q14X
X
SecurityA
wareness
q15X
Xq16
XX
q17X
Xq18
XX
Xq19
XX
Xq20
XX
Xq21
XX
Xq22
XX
q23X
Xq24
XX
q25X
Xq26
XX
q27X
Xq28
XX
q29X
X
InstallationEnvironm
ent
q30X
XX
Xq31
XX
XX
q32X
q33X
q34X
XX
Xq35
XX
XX
q36X
q37X
XX
q38X
X
SecurityPolicy
q39X
q40X
Xq41
X
Table3.1:The
User
Propertiesand
Contributing
Questions
Matrix
18
First Hypothesis
The first hypothesis is that “Security awareness increases for the populationwith higher interaction with technology”. The dimensions which are evalu-ated are security awareness against interaction with technology. This hypoth-esis is based on the assumption that people who interact more with technologyhave the potential to be more security-aware.
Second Hypothesis
The second hypothesis is that “Population who perceives personal and workdata as more important to protect would be more invulnerable to attacks”.The dimensions which are evaluated are data importance perception againstinvulnerability. This hypothesis is based on the assumption that people whoperceive their data less important to protect are more likely to engage intoactions which could expose the system to a threat.
Third Hypothesis
The third hypothesis is that “The population with a higher security educationwill be less vulnerable”. The dimensions which are evaluated are security ed-ucation against vulnerability. This hypothesis is based on the common-senseobservation that people with higher security education have the potential tobe less subject to attacks.
Fourth Hypothesis
The fourth hypothesis is that “The population who experienced a security in-cident is more security-aware”. The dimensions which are evaluated are se-curity incident status against security awareness. This hypothesis is based onthe common-sense notion that people who had a security incident in the pasthave the potential to be more security-aware.
Fifth Hypothesis
The fifth hypothesis is that “Invulnerability to social engineering does not cor-relate with other invulnerabilities”. The dimensions which are evaluated aresocial engineering invulnerability against other invulnerabilities. This hypoth-esis is based on the assumption that social engineering invulnerability doesnot correlate with other invulnerabilities due to the difficult to detect nature ofsocial engineering attacks.
3.2.4 Data Collection
The data collection took place in the form of a survey. The derived surveywas distributed by email through the Information Technology department of
19

H1x,y H2x,y H3x,y H4x,y H5x,y
User Properties
Population
q1q2q3 Yq4 Yq5 Yq6 Yq7 Xq8 Xq9 X
q10 X
Security Oriented Education
q11 Xq12 Xq13 Xq14 X
Security Awareness
q15 X Y Y Y Yq16 X Y Y Y Yq17 X Y Y Y Yq18 X Y Y Y Yq19 X Y Y Y Yq20 X Y Y Y Xq21 X Y Y Y Xq22 X Y Y Y Xq23 X Y Y Y Xq24 X Y Y Y Xq25 X Y Y Y Yq26 X Y Y Y Yq27 X Y Y Y Xq28 X Y Y Y Xq29 X Y Y Y X
Installation Environment
q30 X Y Y Y Yq31 X Y Y Y Yq32q33 Yq34 X Y Y Y Xq35 X Y Y Y Xq36q37 X Yq38 X Y Y
Security Policyq39q40 X Y Yq41
Table 3.2: The Hypotheses and Contributing Questions Matrix
20

each participating institution at the users’ work email addresses. The usersmust visit a link, complete the survey and submit electronically their answers.As various data fields are essential for the overall evaluation of a user, allquestions were made compulsory. Allowing incomplete entries could resultin more results to analyse, but it would add significant complexity to dataanalysis.
The survey was submitted to all members of staff who have access to queryor edit electronic information. Any other member of staff would be consid-ered irrelevant as the survey is focused upon people who have access on anInformation Technology system. The authorization for conducting the surveywas granted by the Information Technology department of the participatinginstitutions. The survey was distributed to all the target population and toincrease potential participation from the educational institution in Norway, itwas translated to Norwegian language prior to distribution.
As the component under investigation is the user, the results might be af-fected by a various environmental factors such as cultural or social. The in-stitutions where the experimentation will take place are heterogeneous envi-ronments, with people of various technical expertises, who interact with anInformation Technology installation. The participating institutions are knownto differ in the number of employees, number of enrolled students, and ge-ographical location. Another factor that might give erroneous results, is thatpeople could reply differently than they would act; for example users could re-ply that they would not enter their credentials on a website which starts with“http://”, but in real life they would not check if this is the default for theirweb based email service.
Software Tools
The software tool which was used for creating the survey and collecting thedata was Google Docs5. Google Docs is a web based application that allowsthe creation of various document types. Among the documents that can becreated, there are forms which function as an interface for inserting data to aspreadsheet. This represented great time savings over the option to distributethe survey in a printed form, and thus it was the preferred method for datacollection. A disadvantage of Google Docs is that it is not possible to preventpeople from submitting multiple replies; something which could result in du-plicate entries.
Ethical Considerations
For informing the survey participant of the followed ethical practices, a pageof informed consent was added on the very beginning of the survey. This pageincluded:
• The purpose of the research
5https://docs.google.com/
21

• The name and contact details of the conductor
• The identification of the authorization contact at the given institution
• An assurance of non-coercion
• An assurance of confidentiality
• An assurance of privacy
• An assurance of protecting from harm and offer to withdraw from com-pleting the survey if this would be considered harmful
Conforming to the basic principles of ethical research, the only collecteddata is the participants’ answers and the timestamp of submission. The times-tamp value was only used to remove accidentally submitted duplicate records.The survey took place for the duration of a week for each institution, afterwhich it was not available anymore online. The full text of the informed con-sent page can be found in the Appendices.
3.2.5 Data Analysis
The data analysis evaluated whether the hypotheses are verified or not, anddrew general conclusions in regard to the users’ answers. The fact that usersfrom two different institutions participate, can enhance the results validity bycomparing them to each other. Therefore, other than analysing the results in-dividually, a comparison was done as well. Furthermore, there are severalquestions which contribute to user properties and hypotheses; this enhancesthe factor analysis which will be used, by having many questions contributingto a factor score[21, 23]. The aim of using factor analysis in results interpreta-tion, is to have one factor for each measurable dimension per hypothesis.
An important point which could influence the results is that of relating thequestions with a hypothesis dimension and the lack of using weighting factors.If the questions which are linked to a factor will not contribute significantly orare wrongly assigned to this factor, then the results will be less accurate or eveninvalid. One more issue is that several of the examined attack cases, are lesslikely to occur; for example, an email with a malicious attachment is a morefrequently occurring attack than someone visiting a user’s office and installinga keyboard capture device. During question creation, the weighting factors ofeach question were not taken into consideration as this would be a lengthyprocess, requiring a comprehensive analysis of the importance of each.
Software Tools
The data analysis was performed by using the R6 software for statistical com-putation. As Google Docs exported the data in a spreadsheet format, the con-version to a readable by R format was made by Microsoft Office Excel7. Before
62.9.0 release72007 SP2 release
22
exporting the data, to reduce sampling error, all duplicate records with times-tamp less than a minute were removed. The developed R script which wasutilized for analyzing the results can be found in the Appendices.
3.3 Human Factors Security Survey
3.3.1 Questions
This section presents the derived questions for measuring each chosen prop-erty. All questions are designed to have predefined answers, for which thesurvey participant has to choose one or more options8. For each question thereare listed:
• The question measurable
• The actual question9
• The predefined answer options10
• The user properties and the hypotheses11 that the question might aid intesting
• The expected information that the question may supply
Population
The population property examines personal characteristics of each individualthat completes the survey. Such are the experience and interactivity with tech-nology, the data protection responsibility and the security incident record. Byincluding this user property later there can be an evaluation of the results percertain population criteria.
First Question The first question requires from the user to state his level ofexperience on using a computer system. The question is:
What is the level of your computer skills?
The user has to choose one of the following options:
• Beginner (e.g. word processing, Internet browsing)
• Intermediate (e.g. installing programs, installing devices)
• Advanced (e.g. troubleshooting and administrative tasks)
• Professional (e.g. administering systems for other users)
This question contributes to the user property of population. It is not used inthe evaluation of any hypothesis but it adds important knowledge regardingthe population.
8The twelfth question is the only exception9With the relevant help text when existed
10With the relevant help text when existed11If any
23

Second Question The second question requires from the user to choose thenumber of years that he is using a computer system. The question is:
How many years of experience in working with a computer system do youhave?
The user has to choose one of the following options:
• Less than a year
• 1-5 years
• More than 5 years
This question contributes to the user property of population. It is not used inthe evaluation of any hypothesis but it adds important knowledge regardingthe population.
Third Question This question measures the user interactivity of the userwith technology, by measuring the Internet usage in hours per day. The ques-tion is:
On average, how many hours per day do you use the Internet?
The user has to choose one of the following options:
• Less than 3 hours
• 3-8 hours
• More than 8 hours
This question contributes to the user property of population. It is used at thefirst hypothesis as it directly gives an insight into user interactivity with tech-nology. It may be assumed that a user who browses the Internet more hoursper day, has already adopted technology to a greater extent than one who doesnot.
Fourth Question This question measures the user interactivity of the userwith technology, by measuring the frequency with which a user checks hisemail. The question is:
On average, how often do you check your email?
The user has to choose one of the following options:
• At least once per hour
• At least once per day
• At least once per week
• Less than once per week
This question contributes to the user property of population. It is used at thefirst hypothesis for measuring the user interactivity with technology. A userwho checks email more often, is considered to have a more frequent contactwith technology than one who does not.
24

Fifth Question This question evaluates if the targeted population uses in-stant messaging applications. The question is:
Do you use any instant messaging applications?
(e.g. Google Talk, Skype, Windows Live Messenger)
The user has to choose one of the following options:
• Yes
• No
This question contributes to the user property of population. It is used in study-ing the first hypothesis as it gives a view of the users’ interactivity with tech-nology. Population which uses instant messaging applications has one moreway of interacting with technology, in contradiction with population who doesnot.
Sixth Question This question evaluates if the targeted population is a mem-ber of a social networking platform. The question is:
Do you have a profile on any social networking web site?
(e.g. Facebook, MySpace, Windows Live Spaces)
The user has to choose one of the following options:
• Yes
• No
This question contributes to the user property of population. It is used in study-ing the first hypothesis as it gives an insight of the user’s exposure to technol-ogy. A user who is member of a social networking platform, could have ahigher interaction with technology than someone who is not.
Seventh Question This question evaluates the population feeling of respon-sibility when it comes to personal data protection. The question is:
How important is it to protect your personal data?
The user has to choose an option from the following range:
• 1. Extremely important
• 2.
• 3.
• 4.
• 5. Not important at all
This question contributes to the user properties of population, responsibility andcompliance. It is used at the second hypothesis as it shows the population re-sponsibility at personal data protection.
25

Eighth Question This question evaluates the population feeling of responsi-bility when it comes to work data protection. The question is:
How important is it to protect your work data?
The user has to choose an option from the following range:
• 1. Extremely important
• 2.
• 3.
• 4.
• 5. Not important at all
This question contributes to the user properties of population, responsibility andcompliance. It is used to study the second hypothesis as it shows the populationresponsibility at work data. In combination with the previous question it canalso add an insight on the different importance level that people might havebetween home and work data protection.
Ninth Question This question queries the online fraud incident history ofthe population. The question is:
Have you ever been victim of online fraud?
(e.g. identity theft, phishing)
The user has to choose one of the following options:
• Yes
• No
• I don’t know
This question contributes to the user properties of population and responsibil-ity. It is used at the fourth hypothesis as it reveals whether a certain type ofsecurity incident did exist.
Tenth Question This question queries the population security history whenit comes to malicious software. The question is:
Has your work or home computer ever been infected by malicious software?
(e.g. keylogger, rootkit, spyware, virus)
The user has to choose one of the following options:
• Yes
26

• No
• I don’t know
This question contributes to the user properties of population and responsibil-ity. It is used at the fourth hypothesis as it reveals whether a certain type ofsecurity incident did exist.
Security Oriented Education
The user property of security oriented education investigates if previous secu-rity training exists and the knowledge of a user about password selection. Thissector contributes significantly to study of the third hypothesis where popula-tion with a higher security education is evaluated.
Eleventh Question This question queries whether the user has ever receivedcomputer security training. The question is:
Have you ever received computer security training?
(e.g. lecture, presentation, seminar)
The user has to choose one of the following options:
• Yes
• No
This question contributes to the user property of security oriented education. Itis used at the third hypothesis as it is expected to give a view of the populationwho has security training.
Twelfth Question This question tests which sources are used from the pop-ulation for creating a password. The question is:
Which of the following do you use for generating your passwords?
Check all boxes that apply
The user has to choose one or more from the following options:
• Personal Information (e.g. date of birth, place of birth, address, name)
• Dictionary words (e.g. apple, backyard, cloud, door)
• Phrases (e.g. It is not in the stars to hold our destiny but in ourselves)
• Numbers (e.g. 0, 1, 2, 3)
• Symbols (e.g. !, #, %, &)
• Lowercase letters (e.g. w, x, y, z)
27

• Uppercase letters (e.g. A, B, C, D)
This question contributes to the user properties of security oriented educationand responsibility. It is used to study the third hypothesis because it shows theknowledge of users about creating strong passwords. A good password on ahealthy system prevents unauthorized access to external sources.
Thirteenth Question This question tests the users preference on passwordlength. The question is:
On average, how long in characters are your generated passwords?
The user has to choose one of the following options:
• Up to 7 characters
• 8 or more characters
• As short as the system accepts
This question contributes to the user properties of security oriented educationand responsibility. It is used to study the third hypothesis as the knowledgeof password length is part of the knowledge for a strong password. It is notonly enough to have a well generated password; the longer a password is, theharder it would be for a malicious user to recover it.
Fourteenth Question This question measures the frequency with which auser changes his email password. The question is:
On average, how often do you change your personal email password?
The user has to choose one of the following options:
• At least once per 3 months
• At least once per 6 months
• At least once per 12 months
• Only when required by the system
• Never
This question contributes to the user properties of security oriented educationand responsibility. It is used at the third hypothesis as it shows a users knowl-edge on a secure password policy. A frequently changed password is harderto be recovered than a less frequent of the same strength. The change of auser’s personal email password is not enforced by any policy other but him-self; therefore, it shows one’s responsibility when it comes to personal datasecurity.
28
Security Awareness
The user property of security awareness evaluates the user’s personal secu-rity alertness for various points of intrusion. It is the only property which isused in the study of all five hypotheses. The social engineering questions areincluded in this property because, although such attacks might take place atwork environment, their success relies on users’ lack of awareness.
Fifteenth Question This question checks if the user has the same passwordfor many different accounts. The question is:
Do you reuse the same password for several user accounts?
(e.g. personal email account, work email account)
The user has to choose one of the following options:
• Yes
• No
This question contributes to the user properties of security awareness and re-sponsibility. If someone uses the same password for more than one account,then in case that an attacker gains access to one of them, the security of allmight be at risk[24]. It is also often that people might have one strong pass-word which they use for several user accounts; thus making them all vulnera-ble upon one’s compromise, regardless of the password strength.
Sixteenth Question This question checks if the user would write down acomplicated password. The question is:
If you were not able to change a password that is difficult to remember,would you write it down?
The user has to choose one of the following options:
• Yes
• No
• Maybe
This question contributes to the user properties of security awareness and re-sponsibility. By writing down a password which is difficult to remember thenit is much easier for an attacker to get access. One common example of suchbad practice is when users are writing their passwords and attach them on ei-ther their computer system or desk; then once an attacker can be where thecomputer system is, the very purpose of having a password at all becomesobsolete.
29

Seventeenth Question This question checks if the user is visually securinghis credentials entry. The question is:
Do you prevent others from watching you type when you enter yourusername and password?
The user has to choose one of the following options:
• Yes
• No
This question contributes to the user properties of security awareness and re-sponsibility. The lowest technologically form of eavesdropping is when some-one captures a password by simply watching a user entering it[24]. When auser enters his username and password, it should be of his responsibility to notallow anyone to look at his typing. Even a partial recognition of the passwordmight significantly accelerate the ability of an attacker to recover the whole.
Eightteenth Question This question checks if the user needs a password tologin to his home computer. The question is:
Do you use a password to login to your home computer?
The user has to choose one of the following options:
• Yes
• No
This question contributes to the user properties of security awareness, responsi-bility and compliance. When a user has a password enabled account at his homecomputer he prevents a wide spectrum of attacks. A password enabled homecomputer, could furthermore show the responsibility that one has towards asimple security practice, over the convenience of not using a password to lo-gin.
Nineteenth Question This question checks if the user has installed antivirussoftware on his home computer. The question is:
Do you have antivirus software installed on your home computer?
The user has to choose one of the following options:
• Yes
• No
• I don’t know
30
This question contributes to the user properties of security awareness, responsi-bility and compliance. The antivirus software is an essential part of a systemsecurity that prevents the execution of malicious code. A responsible usershould make sure that antivirus software is installed on his home computer.Although the user’s home computer might be of such an architecture or hav-ing installed such an operating system that is perceived more secure, thereare several threats in the wild for all architectures and operating systems andin general principle although there is still a significantly lower possibility ofhaving certain systems infected, the possibility still exists[25, 26, 27, 28, 29, 30].
Twentieth Question This question evaluates if the user would allow some-one to use his home computer under his supervision. The question is:
Would you allow someone to use your home computer with yoursupervision?
The user has to choose one of the following options:
• Yes
• No
This question contributes to the user properties of security awareness, responsi-bility and compliance. The physical access on a computer system usually tearsdown most of the defensive mechanisms against malicious users. Further-more, an attacker might execute tasks in such a way, which would not besuspicious at all in the eyes of the supervisor. However, a supervisor withprofessional computer knowledge could efficiently monitor every activity thatone engages when using his computer system.
Twenty-first Question This question evaluates if the user would allow some-one unsupervised to use his home computer. The question is:
Would you allow someone to use your home computer without yoursupervision?
The user has to choose one of the following options:
• Yes
• No
This question contributes to the user properties of security awareness, respon-sibility and compliance. Although the physical access might lead to a securitycompromise, when the actions of an attacker are supervised, there is a limita-tion and absolute dependency on the supervisor skills to recognise any mali-cious actions. If there is a total lack of supervision, the attacker is free to actand this would almost guarantee a system compromise.
31

Twenty-second Question This question evaluates if the user would open anemail link or attachment from a familiar email address. The question is:
Would you open an email link or attachment from an email address yourecognize?
The user has to choose one of the following options:
• Yes
• No
This question contributes to the user properties of security awareness and re-sponsibility. Specially crafted email links or attachments, might deceive theuser to enter his credentials or allow code execution that would compromisethe system security. An email address which seems familiar would be lesssuspicious for the receiving end. In addition, not all users have the technicalexpertise to recognise spoofed email headers and from the ones who can, thereis few who validate in depth the origin of an email.
Twenty-third Question This question evaluates if the user would open anemail link or attachment from an unfamiliar email address. The question is:
Would you open an email link or attachment from an email address you donot recognize?
The user has to choose one of the following options:
• Yes
• No
This question contributes to the user properties of security awareness and re-sponsibility. Despite the fact that a user might not recognise the email addressthat send him an email, it might be of such a content that might temp himto open an email link or attachment; an action which could trigger a systemintrusion.
Twenty-fourth Question This question evaluates if a user would share hisaccount credentials with someone else. The question is:
Would you share your username and password with someone else?
(e.g. friend, colleague, assistant, teammate)
The user has to choose one of the following options:
• Yes
• No
32

This question contributes to the user properties of security awareness and re-sponsibility. One of the less expecting but yet often occurring ways of gettingaccess to a system is to ask someone for his username and password. Manypeople would even offer their account credentials by themselves in order toget help or, for the sake of offering comfort, to a usually familiar person[24].The security risk of such an action is very high as there is not only the potentialmisuse of the credentials to be considered, but also the overall system securityresponsibility and risk, which expand to one more person.
Twenty-fifth Question This question checks if the user would enter his ac-count credentials on a website which uses the insecure Http protocol. Thequestion is:
Would you enter your username and password on a web site whose addressstarts with “http://”?
(e.g. http://www.example.com/ )
The user has to choose one of the following options:
• Yes
• No
This question contributes to the user properties of security oriented educationand security awareness. The Http protocol transfers the data in a plain textformat, which allows an attacker to potentially capture the transmitted traffic.A user with security awareness and knowledge of the Https protocol whichincorporates data encryption, would prefer it for transmitting his credentials.
Twenty-sixth Question This question checks if the user would enter his creditcard information on a website which uses the insecure Http protocol. Thequestion is:
Would you enter your credit card information on a web site whose addressstarts with “http://”?
(e.g. http://www.example.com/ )
The user has to choose one of the following options:
• Yes
• No
This question contributes to the user properties of security oriented educationand security awareness. A part of the population perceives only their creditcard information as something with monetary value and not their password;this question is expected to assist in the examination of what people mightperceive as critical information.
33

Twenty-seventh Question This question evaluates the user vulnerability bygiving a real life example of a social engineering attack. The question is:
You receive by postal mail at your work address a program which is labeledas “critical security updates” and installation instructions. Would you install
it?
The user has to choose one of the following options:
• Yes
• No
This question contributes to the user properties of security awareness and re-sponsibility. At the given example an attacker attempts to take advantage ofthe user’s sense of responsibility towards the system security. A user who re-ceives a program which by first look is identified as something critical to thesystem security, might install it without considering the origin of it. The suc-cess rate of such an attack might be even higher if the package looks genuineand when labelled as it was send by the Information Technology departmentof the targeted institution.
Twenty-eighth Question This question evaluates the user vulnerability bygiving a real life example of a social engineering attack. The question is:
Your work computer fails to connect to the Internet; you receive a call fromsomeone who identifies himself as a network technician and requires your
username and password in order to repair your connection. Would you giveyour username and password over the phone?
The user has to choose one of the following options:
• Yes
• No
This question contributes to the user properties of security awareness and re-sponsibility. At the given example an attacker attempts to take advantage ofa user’s need which arises. The attacker contacts by phone the user who hasa problem and asks for his credentials in order to give a solution. The usermight give away his username and password, driven by the need to solve hisproblem and from the fact that the attacker called him knowing already thatthe problem exists. Users are usually not aware of the fact that attackers mightfabricate problems in order to proceed in such kind of attacks[12]. The suc-cess rate of such an attack would be higher if the attacker would make useof a proper terminology or falsely identifies himself by the name of someonewho indeed works at the targeted institution[31]. It is worthy noticing that ifthe attacker will indeed solve the users problem, then there will be possibly atrust relationship and familiarity between the user and the attacker; where thelatter could unauthorized keep asking for favours[12].
34
Twenty-ninth Question This question evaluates the user vulnerability bygiving a real life example of a social engineering attack. The question is:
You have placed some time ago an Internet based order; you receive a callfrom someone who identifies as salesman from that store and asks you for
your credit card information in order to dispatch your purchase. Would yougive your credit card information over the phone?
The user has to choose one of the following options:
• Yes
• No
This question contributes to the user properties of security awareness and re-sponsibility. The given example is similar to the one of the previous question,with the exception that the problem is fabricated. The attacker gained knowl-edge of the user’s order placement and attacks his need of having the orderdispatched. The false authentication of the attacker and the fact that he knowsdetails that no one else would normally do, along with the need of the user forhaving his order completed, might lead to a successful retrieval of the creditcard information. The users might respond differently in accordance to theirmonetary value perception, similarly to the twenty-sixth question.
Installation Environment
The user property of installation environment investigates primarily the users’security alertness in relation to the work environment and secondarily the en-vironment itself.
Thirtieth Question This question checks if the user has the same usernamefor several accounts. The question is:
Do you use a common username for many kinds of accounts?
(e.g. personal account, work account)
The user has to choose one of the following options:
• Yes
• No
This question contributes to the user properties of security awareness, installa-tion environment, responsibility and compliance. It is used in the evaluation ofall hypotheses as it indicates the security awareness of the user. A commonusername enhances the ability of an attacker to relate a compromised accountwith any account linked to the same person. Although this itself cannot beperceived as a security breach, the linking of accounts when one of them iscompromised, might make the intrusion to the rest an easier task. Further-more, the linking of several accounts combined with the usage of a common
35

password, which is examined on the fifteenth question, is a critical securityrisk. A recent study had shown that forty percent of online banking usershad the same username for other accounts[32]; which makes this bad securitypractice, a quite frequent one.
Thirty-first Question This question checks if the user needs a password tologin to his work computer. The question is:
Do you use a password to login to your work computer?
The user has to choose one of the following options:
• Yes
• No
This question contributes to the user properties of security awareness, installa-tion environment, responsibility and compliance. It is used in the evaluation ofall hypotheses as it indicates the security awareness of the user. A computersystem where it is required to enter a password to login, is considered moresecure than one where a password is not required.
Thirty-second Question This question examines if the user has knowledgeof the policy on password change frequency. The question is:
How often does your work require you to change your password?
The user has to choose one of the following options:
• At least once per 3 months
• At least once per 6 months
• At least once per 12 months
• Never
• I don’t know
This question contributes to the user property of installation environment. It isnot used in the evaluation of any hypothesis but it adds important knowledgeregarding the security policy. A password which changes frequently is lesslikely to be easily recovered.
Thirty-third Question This question checks if the user’s workplace com-puter is inaccessible by anyone else. The question is:
Is the computer you use at work located in a physically secure location?
(i.e. not accessible by anyone else)
The user has to choose one of the following options:
36

• Yes
• No
This question contributes to the user properties of security awareness and instal-lation environment. It is used in the evaluation of the fifth hypothesis as it givesan indication of an attacker’s ability to have physical access to the targetedcomputer system. Once a system’s physical security is compromised, there isnot any mean for protecting the data; even in the case of implemented encryp-tion, a maliciously12 installed keylogger or rootkit could capture the user’spassphrase.
Thirty-fourth Question This question evaluates if the user would allow some-one to use his work computer under his supervision. The question is:
Would you allow someone to use your work computer with yoursupervision?
The user has to choose one of the following options:
• Yes
• No
This question contributes to the user properties of security awareness, installa-tion environment, responsibility and compliance. It is used in the evaluation ofall hypotheses as it indicates the security awareness of the user. This questionexamines the same attributes like the twentieth question but focusing on thework environment.
Thirty-fifth Question This question evaluates if the user would allow some-one unsupervised to use his work computer. The question is:
Would you allow someone to use your work computer without yoursupervision?
The user has to choose one of the following options:
• Yes
• No
This question contributes to the user properties of security awareness, installa-tion environment, responsibility and compliance. It is used in the evaluation ofall hypotheses as it indicates the security awareness of the user. This questionexamines the same attributes like the twenty-first question but focusing on thework environment.
12Sometimes it also occurs that the employer has intentionally installed such software formonitoring the users’ actions
37

Thirty-sixth Question This question examines if the user works remotelyand whether he is aware of any prerequisite security requirements. The ques-tion is:
If you do work from home, does your work require use of specifictechnologies for secure remote access?
(e.g. Virtual Private Network, antivirus software)
The user has to choose one of the following options:
• Yes
• No
• I don’t know
• I do not work from home
This question contributes to the user property of installation environment. It isnot used in the evaluation of any hypothesis but it adds important knowledgeregarding the security policy. An installation environment which demandsspecific security criteria for remote access, is more secure than an environmentwhich offers access without any security mechanisms. It has been found thatusers who work remotely often engage in behaviour which might expose thesystem to a threat[16, 33].
Thirty-seventh Question This question checks if the user transfers data be-tween work and home through the usage of removable media. The questionis:
Do you use removable media for transferring data between work and home?
(e.g. USB flash drive, optical disc, floppy disk)
The user has to choose one of the following options:
• Yes
• No
This question contributes to the user properties of security awareness, installa-tion environment and responsibility. It is used in the evaluation of the first andfourth hypotheses as it gives a view of security awareness. The usage of re-movable media between work and home, regardless if the contained data arepersonal or work related, might introduce security risks on either computersystems. This way of infecting is one of the oldest, since the usage of Internetwas not as common as it is nowadays, but yet removable media are still sourceof many security issues. However, a frequently updated antivirus software, anaccount without administrative rights and a user who has separate removablemedia for his work and home, should be an efficient protection for this threat.
38

Another risk which rises from the usage of removable media, especially whenthose contain work oriented data, is the one of physical loss. The size andportability of such media introduces less control over the factor of physicalownership. In this case, implementing encryption on the data and keeping aseparate backup copy, would be enough to both make the data useless uponloss and still have the original data available.
Thirty-eighth Question This question checks if the user is aware whetherhis work computer has installed antivirus software. The question is:
Do you have antivirus software installed on your work computer?
The user has to choose one of the following options:
• Yes
• No
• I don’t know
This question contributes to the user properties of security awareness and in-stallation environment. It is used in the evaluation of the first, fourth and fifthhypotheses as it gives a view of security awareness and vulnerability of instal-lation environment. The antivirus software is one of the most basic securitysoftware that prevents a system infection from malware. It is suggested thata system configured for a basic security protection, should incorporate an in-stalled antivirus[34].
Security Policy
The user property of security policy examines the policy of the installationenvironment. This could be a part of the installation environment propertybut it encapsulates environmental attributes which are, or can be, controlledby the policy. In the case of the thirty-third question, policy cannot controlthe enviroment if for example a laptop computer is operated; therefore, thisquestion is located at the user property of installation environment.
Thirty-ninth Question This question examines the current policy on antivirussoftware and whether the user is aware of it. The question is:
Are you required to have antivirus software installed on your workcomputer?
The user has to choose one of the following options:
• Yes
• No
• I don’t know
39

This question contributes to the user property of security policy. It is not used inthe evaluation of any hypothesis but it adds important knowledge regardingthe security policy. Antivirus software is one of the core defences against mal-ware; a policy with basic security on mind would require the use of antivirussoftware on the work computer systems.
Fortieth Question This question queries if the user is permitted to install hisown software or hardware in his work environment. The question is:
Are you allowed to install your own software or hardware in your workenvironment?
(e.g. mobile phones connected via bluetooth on your work computer, instantmessaging applications, any software that was not pre-installed at your work
environment)
The user has to choose one of the following options:
• Yes
• No
• I don’t know
This question contributes to the user properties of security awareness and secu-rity policy. It is used in the evaluation of the first, fourth and fifth hypotheses asit gives an insight of the users security awareness and vulnerability surface. Byallowing the usage of customised software or hardware at the work environ-ment we allow code execution that is unrestricted and security settings whichare set by users. An improperly configured bluetooth device could allow anattacker within the bluetooth signal range to get access; similarly, an instantmessaging or music playing software which is not updated, or even maliciousfrom source software13[35], would be a definite point of intrusion. A securityoriented policy would have to disable by default the ability for installation ofany external software or hardware, and allow the opposite only in case that itis absolutely required.
Forty-first Question This question checks if the user is required to install hisown software of hardware in his work environment. The question is:
Are you required to install your own software or hardware in your workenvironment?
(e.g. email client software, web browser, web browser extensions)
The user has to choose one of the following options:
• Yes13e.g. illegally distributed software or pirate software
40

• No
• I don’t know
This question contributes to the user property of security policy. It is not used inthe evaluation of any hypothesis but it adds important knowledge regardingthe security policy. If a user is required to install software or hardware inhis work environment, then the policy should take the appropriate measuresfor ensuring the system security. Not all users can be responsible for such aprocess, but the ones who have the technical and appropriate security orientedknowledge.
41

42

Chapter 4
Results Evaluation
This chapter consists of the data coding, interpretation and evaluation. Theparticipants’ answers were encoded from the original form into an analyzableformat. The interpreted data were later used for creating general observationsfrom the results and evaluating the hypotheses. The hypotheses evaluationwill generate new knowledge by either confirmation or refutation of each hy-pothesis.
The participation from Oslo University College and Domi Educational Groupwas 59%1 and 27%2 respectively. The high difference of participation mightbe caused from the fact that the survey was distributed to Domi EducationalGroup in English, while Oslo University College had a Norwegian translationof it.
4.1 Data Coding
Data coding is the process where the questions input is converted to a formatwhich allows data analysis. For the process of data coding the R software wasused; every question was interpreted in a way that assigns value when cer-tain criteria are satisfied. As most of the questions were only receiving Yesand No answers, the interpretation was usually a boolean function of the form(d$q1 ==′ Y es′); where d is the data, q1 is the question and ′Y es′ is the criteriaupon which the boolean function is checked. Once a boolean function wouldbe true, it would increase the score on the perspective axis of the analyzedhypothesis. The questions which had a range of values to choose from, werecoded by using the sum of multiple boolean functions, with each answer get-ting a score in relation to the other options; the higher importance an answerwould have, the larger the contribution would be on the score of the perspec-tive axis. The categorization of other cases3 in which the data coding wasdifferent, is examined later. The general observations were created by usingthe sum() command on certain boolean functions and the histograms derivedby using the hist() command on each hypothesis axes. The functions which
1Oslo University College participation was 294 from a target group of 5002Domi Educational Group participation was 40 from a target group of 1503i.e. password scoring system, uncertainty answers
43

were used for the evaluation of the hypotheses can be found in Table 4.1.
4.1.1 Password Scoring System
The twelfth and thirteenth question examine the user’s knowledge on gener-ating a strong password; the categorization of the user’s answers was madethrough creating a password scoring system. Each password characteristicwould either add no score, or add a given score when the user’s choices satisfycertain criteria. The password characteristics were separated into very good,good and bad. Using phrases for a password generation was chosen as verygood password characteristic which when encountered, the user’s passwordscore would increase by two. As good password characteristics were chosenthe following:
• Not using dictionary words
• Not using personal information
• Combining lowercase and uppercase letters
• Using symbols
• Using numbers
• Be at least 8 or more characters long
When each of the above good characteristics would be encountered theuser’s password score would increase by one. Any other choice would resulton a poor password generation and therefore it would be given no score.
4.1.2 Uncertainty Answers
The reason for adding answer options4 which include uncertainty, was be-cause people could be unaware or not sure about something. However, uncer-tainty in Information Security can be seen as possibility of a system exposure[5].As near misses are like accidents which are waiting to happen, any answerwhich incorporated uncertainty had the score of the most related answer withcertainty. For example, any answer of a user on sixteenth question except thenegative one would mean that there is a possibility of writing down a pass-word that is difficult to remember.
4.2 Data Interpretation
During the process of data interpretation the quantified data are used for thehypotheses evaluation. The first and second dimension of each hypothesis
4i.e. I don’t know, maybe
44

q1 N/Aq2 N/Aq3 (d$q3==’Less than 3 hours’) + (d$q3==’3-8 hours’)*2 + (d$q3==’More than 8
hours’)*3q4 (d$q4==’Less than once per week’) + (d$q4==’At least once per week’)*2 +
(d$q4==’At least once per day’)*3 + (d$q4==’At least once per hour’)*4q5 (d$q5==’Yes’)q6 (d$q6==’Yes’)q7 (d$q7==’5’) + (d$q7==’4’)*2 + (d$q7==’3’)*3 + (d$q7==’2’)*4 + (d$q7==’1’)*5q8 (d$q8==’5’) + (d$q8==’4’)*2 + (d$q8==’3’)*3 + (d$q8==’2’)*4 + (d$q8==’1’)*5q9 (d$q9==’Yes’)
q10 (d$q10==’Yes’)q11 (d$q11==’Yes’)q12 (grepl(’Phrases’,d$q12))*2 + (!(grepl(’Dictionary words’,d$q12))) +
(!(grepl(’Personal Information’,d$q12))) + ((grepl(’Lowercase letters’,d$q12))&& (grepl(’Uppercase letters’,d$q12))) + (grepl(’Symbols’,d$q12)) +(grepl(’Numbers’,d$q12))
q13 (d$q13==’8 or more characters’)q14 (d$q14==’Never’) + (d$q14==’Only when required by the system’)*2 +
(d$q14==’At least once per 12 months’)*3 + (d$q14==’At least once per 6months’)*4 + (d$q14==’At least once per 3 months’)*5
q15 (d$q15==’No’)q16 (d$q16==’No’)q17 (d$q17==’No’)q18 (d$q18==’Yes’)q19 (d$q19==’Yes’)q20 (d$q20==’No’)q21 (d$q21==’No’)q22 (d$q22==’No’)q23 (d$q23==’No’)q24 (d$q24==’No’)q25 (d$q25==’No’)q26 (d$q26==’No’)q27 (d$q27==’No’)q28 (d$q28==’No’)q29 (d$q29==’No’)q30 (d$q30==’No’)q31 (d$q31==’Yes’)q32 N/Aq33 (d$q33==’Yes’)q34 (d$q34==’No’)q35 (d$q35==’No’)q36 N/Aq37 (d$q37==’No’)q38 (d$q38==’Yes’)q39 N/Aq40 (d$q40==’No’)q41 N/A
Table 4.1: Functions for the Hypotheses Evaluation
45

would serve as independent and dependent variables respectively; both vari-ables would receive score from the particular to them questions5. The vari-ables are plotted in a two-dimensional diagram which visualise the score dis-tribution. In the plots, each point represents a user’s score; the more scores apoint would sum, the larger it would appear. For enhancing the data inter-pretation, the axes histograms are plotted as well. The purpose of plotting isto find trends on data distribution which would be useful on the hypothesesevaluation. In addition, the median score was used for measuring the centraltendency of the axes; which was found particularly useful in comparing theresponses from the two participating institutions.
4.3 General Observations
Apart from the hypotheses evaluation, the survey can offer a highly informa-tive input when the questions are seen either individually or in relation toeach other. As a comprehensive evaluation of all possible questions associa-tions would be a highly time consuming process, the purpose of this section isto view a noteworthy part of these results. The developed R code which wasused for this section can be found in the Appendices. Table 4.2 lists verticallythe cases and horizontally the results; percentages were calculated in relationto the total participation and results got rounded to the nearest integer.
5See Figure 3.2
46

Osl
oU
nive
rsit
yC
olle
geD
omiE
duca
tion
alG
roup
Num
ber
ofA
nsw
ers
Perc
enta
geN
umbe
rof
Ans
wer
sPe
rcen
tage
Use
rsw
hoha
dne
ver
rece
ived
secu
rity
trai
ning
216
73%
2358
%U
sers
who
gene
rate
onav
erag
epa
ssw
ords
whi
char
ele
ssth
anei
ghtc
hara
cter
s13
546
%16
40%
Use
rsw
hous
ea
com
mon
user
nam
ean
dpa
ssw
ord
fors
ev-
eral
acco
unts
125
43%
2563
%
Use
rsw
how
ould
wri
tedo
wn
aco
mpl
icat
edpa
ssw
ord
261
89%
2870
%U
sers
who
wou
ldop
enan
emai
llin
kor
atta
chm
ent
from
anad
dres
sth
eyre
cogn
ize
267
91%
3793
%
Use
rsw
how
ould
open
anem
aill
ink
orat
tach
men
tfr
oman
addr
ess
they
dono
trec
ogni
ze38
13%
718
%
Use
rsw
how
ould
shar
eth
eir
cred
enti
als
wit
hso
meo
neel
se19
6%13
33%
Use
rsw
how
ould
ente
rth
eir
cred
enti
als
orcr
edit
card
in-
form
atio
non
anin
secu
rew
ebsi
te80
27%
2255
%
Use
rsw
how
ould
ente
rth
eir
cred
enti
als
and
cred
itca
rdin
form
atio
non
anin
secu
rew
ebsi
te17
6%8
20%
Use
rsw
how
ould
allo
wso
meo
neto
use
thei
rw
ork
com
-pu
ter
wit
hth
eir
supe
rvis
ion
269
91%
3075
%
Use
rsw
how
ould
allo
wso
meo
neto
use
thei
rw
ork
com
-pu
ter
wit
hout
thei
rsu
perv
isio
n12
141
%12
30%
Use
rsw
how
ould
allo
wso
meo
neto
use
thei
rw
ork
com
-pu
ter
wit
hth
eir
supe
rvis
ion,
butn
otth
eir
hom
eco
mpu
ter
124%
25%
Use
rsw
how
ould
allo
wso
meo
neto
use
thei
rw
ork
com
-pu
ter
wit
hout
thei
rsu
perv
isio
n,bu
tno
tth
eir
hom
eco
m-
pute
r
217%
13%
Use
rsw
hotr
ansf
erda
tabe
twee
nw
ork
and
hom
e,an
ddo
noth
ave
anan
tivi
rus
inst
alle
don
thei
rho
me
com
pute
r11
4%3
8%
Use
rsw
hoar
ere
quir
edto
inst
all
soft
war
eor
hard
war
e,an
ddo
noth
ave
prof
essi
onal
skill
s24
8%12
30%
Use
rsw
hoar
eal
low
edto
inst
all
thei
row
nso
ftw
are
orha
rdw
are
atw
ork
7726
%14
35%
Tabl
e4.
2:G
ener
alO
bser
vati
ons
47
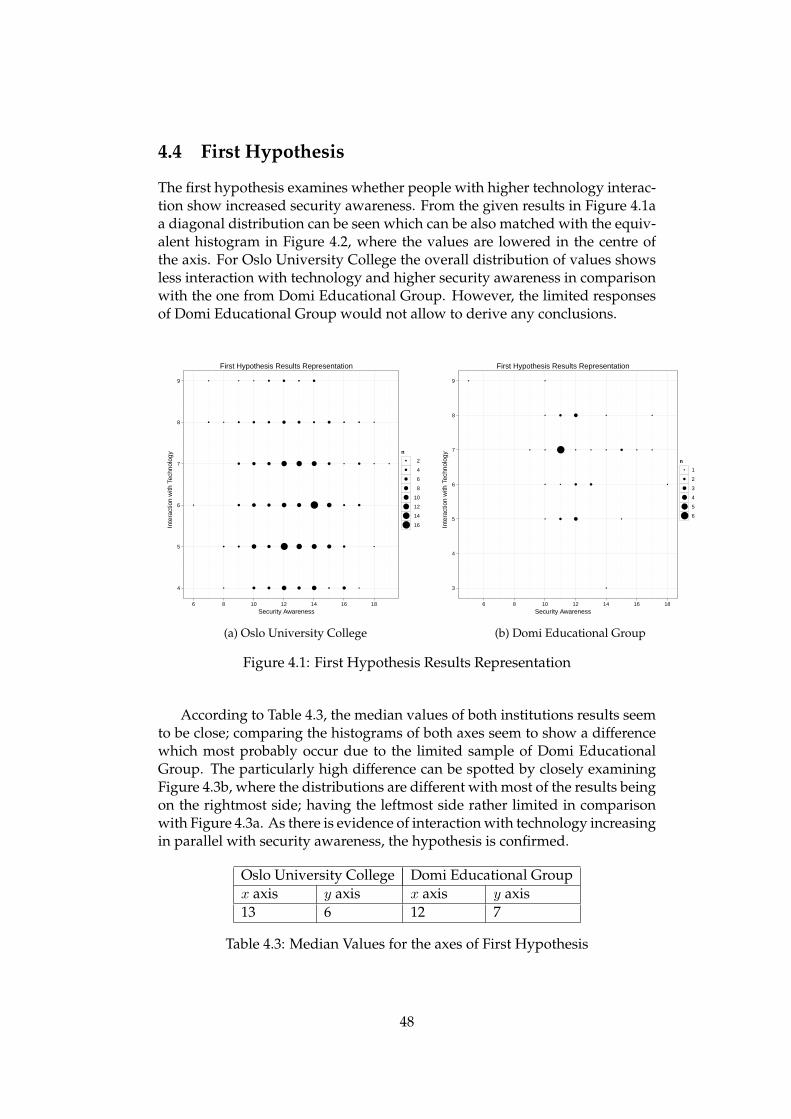
4.4 First Hypothesis
The first hypothesis examines whether people with higher technology interac-tion show increased security awareness. From the given results in Figure 4.1aa diagonal distribution can be seen which can be also matched with the equiv-alent histogram in Figure 4.2, where the values are lowered in the centre ofthe axis. For Oslo University College the overall distribution of values showsless interaction with technology and higher security awareness in comparisonwith the one from Domi Educational Group. However, the limited responsesof Domi Educational Group would not allow to derive any conclusions.
First Hypothesis Results Representation
Security Awareness
Inte
ract
ion
with
Tec
hnol
ogy
4
5
6
7
8
9
●
●
●
●
●
●
●
●
●
●
●
●
●
●
●
●
●
●
●
●
●
●
●
●
●
●
●
●
●
●
●
●
●
●
●
●
●
●
●
●
●
●
●
●
●
●
●
●
●
●
●
●
●
●
●
●
●
●
●
6 8 10 12 14 16 18
n● 2
● 4
● 6
● 8
● 10
● 12
● 14
● 16
(a) Oslo University College
First Hypothesis Results Representation
Security Awareness
Inte
ract
ion
with
Tec
hnol
ogy
3
4
5
6
7
8
9 ●
●
●
●
●
●
●
●
●
●
●
●
●
●
●
●
●
●
●
●
●
● ● ●
●
●
6 8 10 12 14 16 18
n● 1
● 2
● 3
● 4
● 5
● 6
(b) Domi Educational Group
Figure 4.1: First Hypothesis Results Representation
According to Table 4.3, the median values of both institutions results seemto be close; comparing the histograms of both axes seem to show a differencewhich most probably occur due to the limited sample of Domi EducationalGroup. The particularly high difference can be spotted by closely examiningFigure 4.3b, where the distributions are different with most of the results beingon the rightmost side; having the leftmost side rather limited in comparisonwith Figure 4.3a. As there is evidence of interaction with technology increasingin parallel with security awareness, the hypothesis is confirmed.
Oslo University College Domi Educational Groupx axis y axis x axis y axis13 6 12 7
Table 4.3: Median Values for the axes of First Hypothesis
48
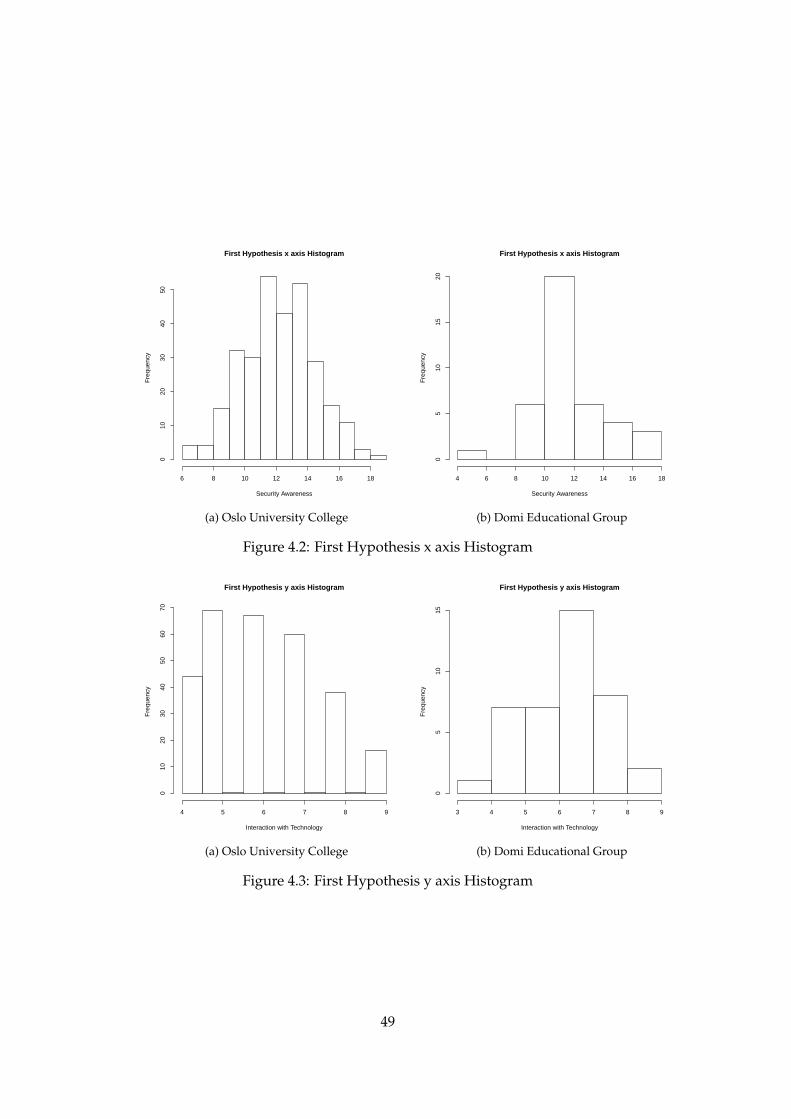
First Hypothesis x axis Histogram
Security Awareness
Fre
quen
cy
6 8 10 12 14 16 18
010
2030
4050
(a) Oslo University College
First Hypothesis x axis Histogram
Security Awareness
Fre
quen
cy
4 6 8 10 12 14 16 18
05
1015
20
(b) Domi Educational Group
Figure 4.2: First Hypothesis x axis Histogram
First Hypothesis y axis Histogram
Interaction with Technology
Fre
quen
cy
4 5 6 7 8 9
010
2030
4050
6070
(a) Oslo University College
First Hypothesis y axis Histogram
Interaction with Technology
Fre
quen
cy
3 4 5 6 7 8 9
05
1015
(b) Domi Educational Group
Figure 4.3: First Hypothesis y axis Histogram
49

4.5 Second Hypothesis
The second hypothesis evaluates if the population who perceives personal andwork data as more important to protect, is less vulnerable to attacks. The de-rived results in Figure 4.4a show that the rightmost part with value 10, whichis the part where people consider both work and home data as extremely im-portant, is on average less vulnerable than the rest of the answers; somethingwhich does not appear to exist at the results from Domi Educational Group asseen in Figure 4.4b.
Second Hypothesis Results Representation
Data Importance Perception
Exp
loita
tion
Invu
lner
abili
ty
6
8
10
12
14
16
●
●
●
●
●
●
●
●
●
●
●
●
●
●
●
●
●
●
●
●
●
●
●
●
●
●
●
●
●
●
●
●
●
●
●
●
●
●
●
●
●
●
●
●
●
●
●
●
●
●
●
●
●
●
●
●
●
●
●
●
●
●
●
2 4 6 8 10
n
● 5
● 10
● 15
(a) Oslo University College
Second Hypothesis Results Representation
Data Importance Perception
Exp
loita
tion
Invu
lner
abili
ty
4
6
8
10
12
14
16
●
●
●
●
●
●
●
●
●
●
●
●
●
●
●
●
●
●
●
●
●
●
●
●
●
●
2 4 6 8 10
n● 1.0
● 1.5
● 2.0
● 2.5
● 3.0
● 3.5
● 4.0
(b) Domi Educational Group
Figure 4.4: Second Hypothesis Results Representation
The data from Domi Educational Group show some irregularities whencompared to the ones from Oslo University College. Although the axes me-dian values do not significantly differ as the Table 4.4 indicates, accordingto Figures 4.5 and 4.6 the distribution of scores is quite irregular in compar-ison with Oslo University College. A possible reason for this might be thesmaller participation from Domi Educational Group. As the results in Figure4.4a show, the hypothesis is confirmed because people with higher perceptionof data importance show a higher invulnerability level than all the rest.
Oslo University College Domi Educational Groupx axis y axis x axis y axis8 11 9 10
Table 4.4: Median Values for the axes of Second Hypothesis
50

Second Hypothesis x axis Histogram
Data Importance Perception
Fre
quen
cy
2 4 6 8 10
020
4060
80
(a) Oslo University College
Second Hypothesis x axis Histogram
Data Importance Perception
Fre
quen
cy
2 4 6 8 10
05
1015
(b) Domi Educational Group
Figure 4.5: Second Hypothesis x axis Histogram
Second Hypothesis y axis Histogram
Exploitation Invulnerability
Fre
quen
cy
6 8 10 12 14 16
010
2030
4050
60
(a) Oslo University College
Second Hypothesis y axis Histogram
Exploitation Invulnerability
Fre
quen
cy
4 6 8 10 12 14 16
05
1015
(b) Domi Educational Group
Figure 4.6: Second Hypothesis y axis Histogram
51

4.6 Third Hypothesis
The third hypothesis examines if population with a higher security educationwould be less vulnerable to attacks. By having a look at Figure 4.7a one cansee that the results appear to be spread diagonally. Both institutions appear tohave a similar result distribution but the limited resolution of the results fromDomi Educational Group would again prevent deriving any conclusions.
Third Hypothesis Results Representation
Security Education
Exp
loita
tion
Invu
lner
abili
ty
6
8
10
12
14
16
●
●
●
●
●
●
●
●
●
●
●
●
●
●
●
●
●
●
●
●
●
●
●
●
●
●
●
●
●
●
●
●
●
●
●
●
●
●
●
●
●
●
●
●
●
●
●
●
●
●
●
●
●
●
●
●
●
●
●
●
●
●
●
●
●
●
●
●
●
●
●
●
●
●
●
●
4 6 8 10 12
n
● 5
● 10
● 15
(a) Oslo University College
Third Hypothesis Results Representation
Security Education
Exp
loita
tion
Invu
lner
abili
ty
4
6
8
10
12
14
16
●
●
●
●
●
●
●
●
●
●
●
●
●
●
●
●
●
●
●
●
●
●
●
●
●
●
●
●
● ●
●
4 6 8 10 12
n● 1.0
● 1.5
● 2.0
● 2.5
● 3.0
(b) Domi Educational Group
Figure 4.7: Third Hypothesis Results Representation
Both institutions median values are very close as seen from Table 4.5. Bycomparing the histograms in Figure 4.8 one can see that they have an almostidentical pattern which differs only at the resolution. The noticeable differencebetween the two institutions results surfaces when comparing the histogramfound in Figure 4.9; while Figure 4.9a shows an approximately normal curvedistribution, Figure 4.9b seems to have less results on the left part of the his-togram; something which also excuses the smaller median value for the y axisof Domi Educational Group found at Table 4.5. As the Figure 4.7a shows a di-agonal spread of the results, it is confirmed that to some extent, higher securityeducation correlates with higher exploitation invulnerability.
Oslo University College Domi Educational Groupx axis y axis x axis y axis7 11 7 10
Table 4.5: Median Values for the axes of Third Hypothesis
52

Third Hypothesis x axis Histogram
Security Education
Fre
quen
cy
4 6 8 10 12
010
2030
4050
60
(a) Oslo University College
Third Hypothesis x axis Histogram
Security Education
Fre
quen
cy
2 4 6 8 10 12 14
02
46
810
1214
(b) Domi Educational Group
Figure 4.8: Third Hypothesis x axis Histogram
Third Hypothesis y axis Histogram
Exploitation Invulnerability
Fre
quen
cy
6 8 10 12 14 16
010
2030
4050
60
(a) Oslo University College
Third Hypothesis y axis Histogram
Exploitation Invulnerability
Fre
quen
cy
4 6 8 10 12 14 16
05
1015
(b) Domi Educational Group
Figure 4.9: Third Hypothesis y axis Histogram
53

4.7 Fourth Hypothesis
The fourth hypothesis examines whether people who experienced a securityincident in the past are more security-aware. Figure 4.10a demonstrates theopposite result than the original assumption; people who had no prior secu-rity incidents seem to be on average more security-aware than people whohad one or both types of the examined security incidents. A similar trend isdemonstrated from the results of Domi Educational Group in Figure 4.10b,although with a reduced resolution due to limited responses.
Fourth Hypothesis Results Representation
Past Exploitation Record
Sec
urity
Aw
aren
ess
6
8
10
12
14
16
18
●
●
●
●
●
●
●
●
●
●
●
●
●
●
●
●
●
●
●
●
●
●
●
●
●
●
●
●
●
●
0.0 0.5 1.0 1.5 2.0
n● 5
● 10
● 15
● 20
● 25
(a) Oslo University College
Fourth Hypothesis Results Representation
Past Exploitation Record
Sec
urity
Aw
aren
ess
6
8
10
12
14
16
18
●
●
●
●
●
●
●
●
●
●
●
●
●
●
●
●
●
●
0.0 0.5 1.0 1.5 2.0
n● 1
● 2
● 3
● 4
● 5
● 6
● 7
(b) Domi Educational Group
Figure 4.10: Fourth Hypothesis Results Representation
Although the median values of both institutions, as seen in Table 4.6, donot appear to have a large difference, the distribution of both axes values dif-fer significantly. By comparing the Figures 4.11a and 4.11b one can see thatthe results of the latter for value 0 are rather limited proportionally to the first;something which also gets visually confirmed by Figure 4.10b. The histogramsin Figure 4.12 could have a similar distribution, but due to the limited resolu-tion of Figure 4.12b it is not possible to derive any conclusion. As the resultsof Oslo University College in Figure 4.10a show lower security awareness forpeople with prior security incidents, the hypothesis is not supported.
Oslo University College Domi Educational Groupx axis y axis x axis y axis0 13 1 12
Table 4.6: Median Values for the axes of Fourth Hypothesis
54
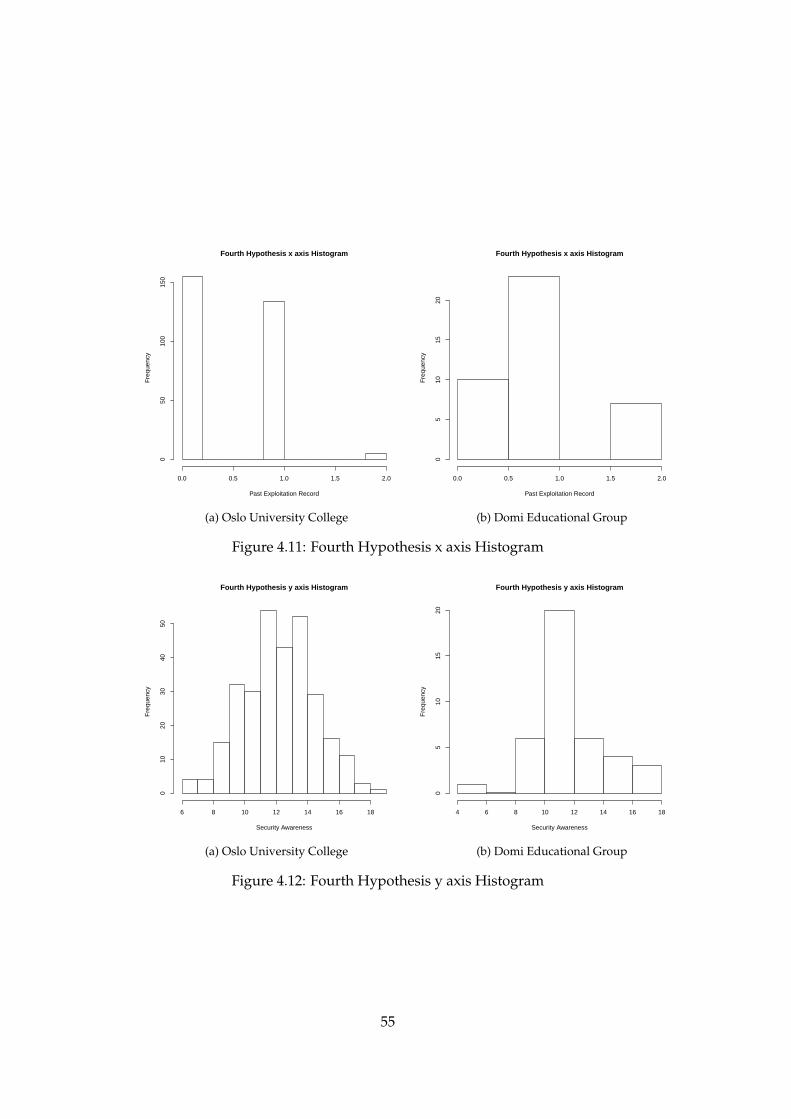
Fourth Hypothesis x axis Histogram
Past Exploitation Record
Fre
quen
cy
0.0 0.5 1.0 1.5 2.0
050
100
150
(a) Oslo University College
Fourth Hypothesis x axis Histogram
Past Exploitation Record
Fre
quen
cy
0.0 0.5 1.0 1.5 2.0
05
1015
20
(b) Domi Educational Group
Figure 4.11: Fourth Hypothesis x axis Histogram
Fourth Hypothesis y axis Histogram
Security Awareness
Fre
quen
cy
6 8 10 12 14 16 18
010
2030
4050
(a) Oslo University College
Fourth Hypothesis y axis Histogram
Security Awareness
Fre
quen
cy
4 6 8 10 12 14 16 18
05
1015
20
(b) Domi Educational Group
Figure 4.12: Fourth Hypothesis y axis Histogram
55
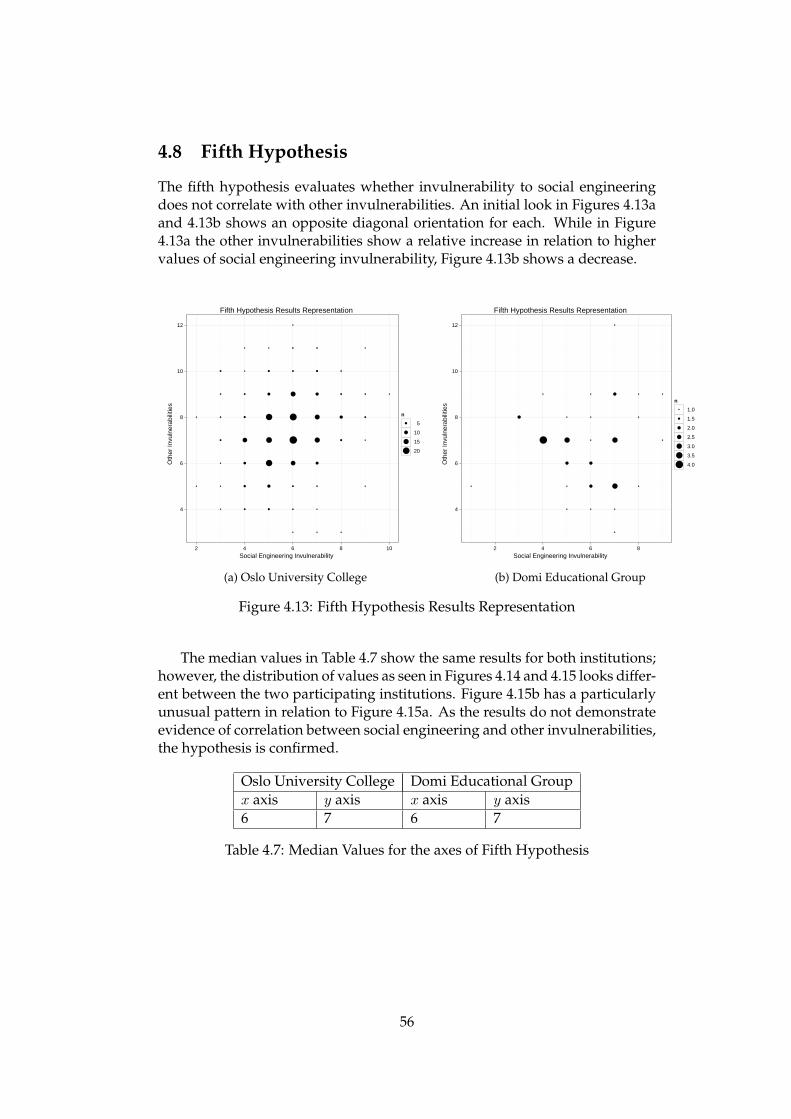
4.8 Fifth Hypothesis
The fifth hypothesis evaluates whether invulnerability to social engineeringdoes not correlate with other invulnerabilities. An initial look in Figures 4.13aand 4.13b shows an opposite diagonal orientation for each. While in Figure4.13a the other invulnerabilities show a relative increase in relation to highervalues of social engineering invulnerability, Figure 4.13b shows a decrease.
Fifth Hypothesis Results Representation
Social Engineering Invulnerability
Oth
er In
vuln
erab
ilitie
s
4
6
8
10
12
●
●
●
●
●
●
●
●
●
●
●
●
●
●
●
●
●
●
●
●
●
●
●
●
●
●
●
●
●
●
●
●
●
●
●
●
●
●
●
●
●
●
●
●
●
●
●
●
●
●
●
●
●
●
●
2 4 6 8 10
n
● 5
● 10
● 15
● 20
(a) Oslo University College
Fifth Hypothesis Results Representation
Social Engineering Invulnerability
Oth
er In
vuln
erab
ilitie
s
4
6
8
10
12
●
●
●
●
●
●
●
●
●
●
●
●
●
●
●
●
●
●
●
●
●
●
●
●
●
●
2 4 6 8
n● 1.0
● 1.5
● 2.0
● 2.5
● 3.0
● 3.5
● 4.0
(b) Domi Educational Group
Figure 4.13: Fifth Hypothesis Results Representation
The median values in Table 4.7 show the same results for both institutions;however, the distribution of values as seen in Figures 4.14 and 4.15 looks differ-ent between the two participating institutions. Figure 4.15b has a particularlyunusual pattern in relation to Figure 4.15a. As the results do not demonstrateevidence of correlation between social engineering and other invulnerabilities,the hypothesis is confirmed.
Oslo University College Domi Educational Groupx axis y axis x axis y axis6 7 6 7
Table 4.7: Median Values for the axes of Fifth Hypothesis
56

Fifth Hypothesis x axis Histogram
Social Engineering Invulnerability
Fre
quen
cy
2 4 6 8 10
020
4060
80
(a) Oslo University College
Fifth Hypothesis x axis Histogram
Social Engineering Invulnerability
Fre
quen
cy
2 4 6 8
02
46
810
(b) Domi Educational Group
Figure 4.14: Fifth Hypothesis x axis Histogram
Fifth Hypothesis y axis Histogram
Other Invulnerabilities
Fre
quen
cy
4 6 8 10 12
020
4060
(a) Oslo University College
Fifth Hypothesis y axis Histogram
Other Invulnerabilities
Fre
quen
cy
4 6 8 10 12
02
46
810
12
(b) Domi Educational Group
Figure 4.15: Fifth Hypothesis y axis Histogram
57

58
Chapter 5
Future Suggestions
This research answer a question which could attract further study or conductan evaluation from other perspectives; the offered knowledge can be the basisfor further investigation of the human factor in another setting. A noteworthyenhancement on the current study would be the addition of weighting fac-tors to each question; a possibility which was not implemented due to timeconstraints, but would result on a more concrete output. As not all questionshave the same importance or possibility to occur, it would be more consistentto evaluate them in regards to each other as well, and not only to add theirscore in a co-variable. Additionally, it would be of a high interest, but ethi-cally questionable, to investigate the human factor vulnerability by an on-siteexploitation in a controlled environment1; this method would significantly re-duce the error probability and would give a better insight of the human factorstatus. Finally, an alternative approach by applying a qualitative or mixed re-search method, could give surface to the reasons behind peoples’ actions.
Some future considerations which adjust the followed topic, would be toadditionally discuss the intentional attack of one on his own premises; a studywhich would result to an overall evaluation of the human factor, regardlessof the attack source and nature. The human factor in Information Securitycould be also examined in relation to the dimensions of productivity, cost andusability; dimensions particularly interesting for a corporate environment.
1Always with the granted permission of the respective administration
59

60
Chapter 6
Conclusion
Amateurs hack systems, professionals hack people.Bruce Schneier
Human factors can have a high impact in Information Security; the currentstudy investigated the influence of human factors in regards to accidental ex-posure. In confirmation of past research, findings prove that a high numberof users would engage into actions which could make the system subject to anattack. Users’ behaviour have been shown to be related to technology inter-action, data importance perception and security oriented education; while thepresence of a previous security incident, does not indicate that people wouldbe more aware of security threats in the future. Furthermore, there is evidencethat users who are invulnerable to various types of attacks, are not necessarilyalso invulnerable to social engineering attacks; something initially expected asthe latter are harder to detect and respond.
The answer on the human factor security issues can be supplied by ed-ucation. Security oriented education can address the human factor problemby increasing the users’ practical1 and theoretical2 knowledge. Similarly, thedata importance perception could be used in addressing the human factor byincreasing the users’ feeling of responsibility; users would then understandwhy security is necessary in the given circumstances. Additionally, attentionshould be given on addressing the social engineering vulnerabilities; such at-tacks exploit directly the human factor with a high effectiveness. Users wouldhave to receive a series of social engineering case studies as examples, andtraining on how to authenticate people.
As long as Information Technology systems have the human as a prereq-uisite component, a responsible security evaluation process should withoutdoubt include users. With both technology and people evolving by time, secu-rity should parallely adopt and progress according to the new advances. Evenunder the ideal thought of a faultless system, people would still be subject toan error and therefore, a potential point of intrusion.
1e.g. password generation2e.g. recognizing attacks
61


Appendices
63

Appendix G
Informed Consent
This is a survey which evaluates the human factors in information security; itis part of a research study made by Theodoros Nikolakopoulos, master stu-dent at Oslo University College and University of Oslo. It has been approvedby 1. The distribution of the survey at the institution staff has been made bythe IT Department.The Terms and Conditions of the survey are the following:
1. Non-coercionBy completing the following questionnaire and pressing the “Send” buttonyou confirm that you willingly participate in the research study.
2. ConfidentialityThe gathered data will be kept strictly confidential and the only one who willhave access will be the one who conducts the research study. The participantsand the institution may have access only on the publicly available researchstudy results upon request, and not on the individual data.
3. Maintenance of PrivacyThe participation in this survey remain by all means anonymous. By the sub-mitted answers it will not be possible to identify any individual.
4. Protection From HarmThe current research study will not have any physical harm on the partici-pants. If you do believe that you might suffer a psychological harm from thecompletion of this survey, please avoid from doing so and feel free to submityour feedback by using one of the below mentioned emails.
For any related questions please contact the research study conductor at:
[email protected]@ifi.uio.no
1Konstantinos Katsifis, for Domi Educational Group; Asulv Frøysnes and Ole Lycke, forOslo University College
65

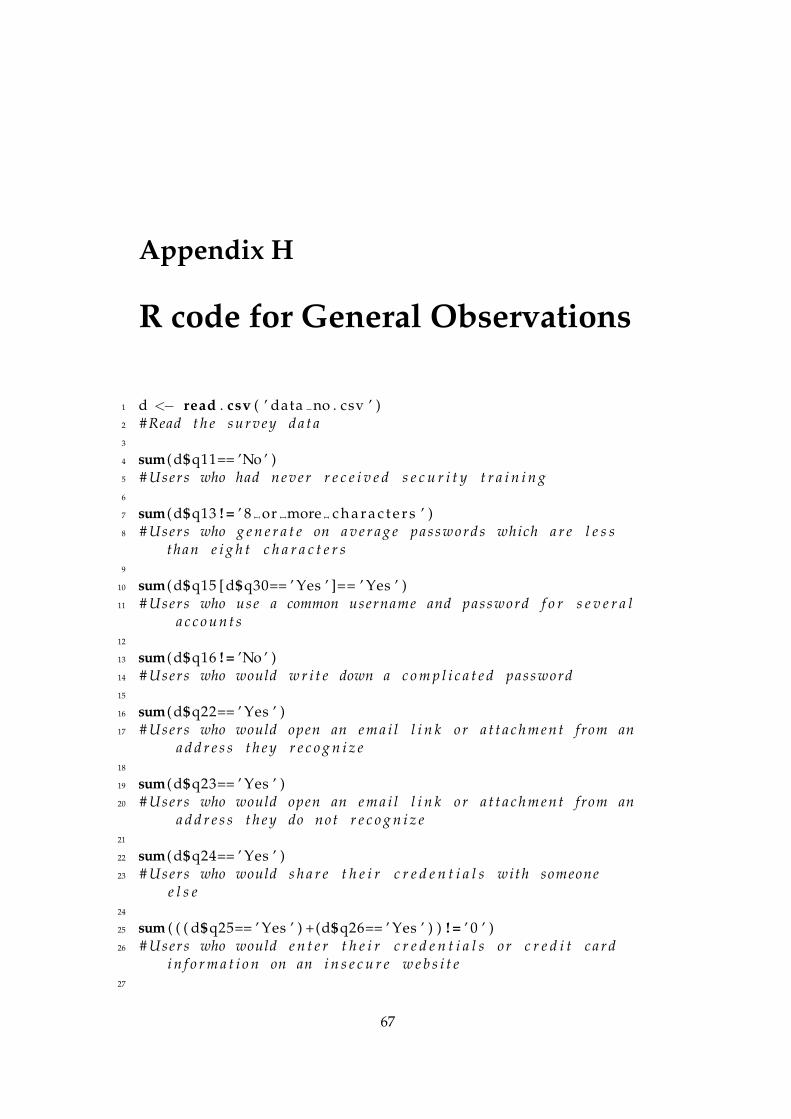
Appendix H
R code for General Observations
1 d <− read . csv ( ’ data no . csv ’ )2 # Read t h e s urv ey d a t a3
4 sum( d$q11== ’No ’ )5 # Users who had n e v e r r e c e i v e d s e c u r i t y t r a i n i n g6
7 sum( d$q13 ! = ’ 8 or more c h a r a c t e r s ’ )8 # Users who g e n e r a t e on a v e r a g e pas swords which a r e l e s s
than e i g h t c h a r a c t e r s9
10 sum( d$q15 [ d$q30== ’ Yes ’ ]== ’ Yes ’ )11 # Users who use a common username and password f o r s e v e r a l
a c c o u n t s12
13 sum( d$q16 ! = ’No ’ )14 # Users who would w r i t e down a c o m p l i c a t e d password15
16 sum( d$q22== ’ Yes ’ )17 # Users who would open an e m a i l l i n k or a t t a c h m e n t from an
a d d r e s s t h e y r e c o g n i z e18
19 sum( d$q23== ’ Yes ’ )20 # Users who would open an e m a i l l i n k or a t t a c h m e n t from an
a d d r e s s t h e y do not r e c o g n i z e21
22 sum( d$q24== ’ Yes ’ )23 # Users who would s h a r e t h e i r c r e d e n t i a l s wi th someone
e l s e24
25 sum ( ( ( d$q25== ’ Yes ’ ) +(d$q26== ’ Yes ’ ) ) ! = ’ 0 ’ )26 # Users who would e n t e r t h e i r c r e d e n t i a l s o r c r e d i t c a r d
i n f o r m a t i o n on an i n s e c u r e w e b s i t e27
67

28 sum ( ( ( d$q25== ’ Yes ’ ) +(d$q26== ’ Yes ’ ) ) == ’ 2 ’ )29 # Users who would e n t e r t h e i r c r e d e n t i a l s and c r e d i t c a r d
i n f o r m a t i o n on an i n s e c u r e w e b s i t e30
31 sum( d$q34== ’ Yes ’ )32 # Users who would a l l o w someone t o use t h e i r work computer
wi th t h e i r s u p e r v i s i o n33
34 sum( d$q35== ’ Yes ’ )35 # Users who would a l l o w someone t o use t h e i r work computer
w i t h o u t t h e i r s u p e r v i s i o n36
37 sum( d$q34 [ d$q20== ’No ’ ]== ’ Yes ’ )38 # Users who would a l l o w someone t o use t h e i r work computer
wi th t h e i r s u p e r v i s i o n , but not t h e i r home computer39
40 sum( d$q35 [ d$q21== ’No ’ ]== ’ Yes ’ )41 # Users who would a l l o w someone t o use t h e i r work computer
w i t h o u t t h e i r s u p e r v i s i o n , but not t h e i r homecomputer
42
43 sum( d$q37 [ d$q19 ! = ’ Yes ’ ]== ’ Yes ’ )44 # Users who t r a n s f e r d a t a be tween work and home , and do
not have an a n t i v i r u s i n s t a l l e d on t h e i r home computer45
46 sum( d$q41 [ d$q1 ! = ’ P r o f e s s i o n a l ( e . g . adminis ter ing systemsf o r other users ) ’ ]== ’ Yes ’ )
47 # Users who a r e r e q u i r e d t o i n s t a l l s o f t w a r e or hardware ,and do not have p r o f e s s i o n a l s k i l l s
48
49 sum( d$q40== ’ Yes ’ )50 # Users who a r e a l l o w e d t o i n s t a l l t h e i r own s o f t w a r e or
hardware a t work

Appendix I
R code for HypothesesEvaluation
1 l i b r a r y ( ggplot2 )2 # Load t h e g g p l o t 2 l i b r a r y3
4 theme s e t ( theme bw( ) )5 # S e t t h e theme t o B l a c k / White f o r g g p l o t 26
7 d <− read . csv ( ’ data no . csv ’ )8 # Read t h e s urv ey d a t a9
10 hyp1x no <− ( d$q15== ’No ’ ) + ( d$q16== ’No ’ ) + ( d$q17== ’No ’ )+ ( d$q18== ’ Yes ’ ) + ( d$q19== ’ Yes ’ ) + ( d$q20== ’No ’ ) + (
d$q21== ’No ’ ) + ( d$q22== ’No ’ ) + ( d$q23== ’No ’ ) + ( d$q24== ’No ’ ) + ( d$q25== ’No ’ ) + ( d$q26== ’No ’ ) + ( d$q27== ’No ’) + ( d$q28== ’No ’ ) + ( d$q29== ’No ’ ) + ( d$q30== ’No ’ ) + ( d$q31== ’ Yes ’ ) + ( d$q34== ’No ’ ) + ( d$q35== ’No ’ ) + ( d$q37== ’No ’ ) + ( d$q38== ’ Yes ’ ) + ( d$q40== ’No ’ )
11 # C a l c u l a t e x f o r t h e f i r s t h y p o t h e s i s12
13 hyp1y no <− ( d$q3== ’ Less than 3 hours ’ ) + ( d$q3== ’3−8hours ’ ) * 2 + ( d$q3== ’More than 8 hours ’ ) * 3 + ( d$q4== ’Less than once per week ’ ) + ( d$q4== ’ At l e a s t once perweek ’ ) * 2 + ( d$q4== ’ At l e a s t once per day ’ ) * 3 + ( d$q4==’ At l e a s t once per hour ’ ) * 4 + ( d$q5== ’ Yes ’ ) + ( d$q6== ’Yes ’ )
14 # C a l c u l a t e y f o r t h e f i r s t h y p o t h e s i s15
16 hyp2x no <− ( d$q7== ’ 5 ’ ) + ( d$q7== ’ 4 ’ ) * 2 + ( d$q7== ’ 3 ’ ) * 3 +( d$q7== ’ 2 ’ ) * 4 + ( d$q7== ’ 1 ’ ) * 5 + ( d$q8== ’ 5 ’ ) + ( d$q8==
’ 4 ’ ) * 2 + ( d$q8== ’ 3 ’ ) * 3 + ( d$q8== ’ 2 ’ ) * 4 + ( d$q8== ’ 1 ’ ) * 517 # C a l c u l a t e x f o r t h e s e c o n d h y p o t h e s i s18
69

19 hyp2y no <− ( d$q15== ’No ’ ) + ( d$q16== ’No ’ ) + ( d$q17== ’No ’ )+ ( d$q18== ’ Yes ’ ) + ( d$q19== ’ Yes ’ ) + ( d$q20== ’No ’ ) + (
d$q21== ’No ’ ) + ( d$q22== ’No ’ ) + ( d$q23== ’No ’ ) + ( d$q24== ’No ’ ) + ( d$q25== ’No ’ ) + ( d$q26== ’No ’ ) + ( d$q27== ’No ’) + ( d$q28== ’No ’ ) + ( d$q29== ’No ’ ) + ( d$q30== ’No ’ ) + ( d$q31== ’ Yes ’ ) + ( d$q34== ’No ’ ) + ( d$q35== ’No ’ )
20 # C a l c u l a t e y f o r t h e s e c o n d h y p o t h e s i s21
22 hyp3x no <− ( d$q11== ’ Yes ’ ) + ( grepl ( ’ Phrases ’ ,d$q12 ) ) * 2 +( ! ( grepl ( ’ Dic t ionary words ’ ,d$q12 ) ) ) + ( ! ( grepl ( ’
Personal Information ’ ,d$q12 ) ) ) + ( ( grepl ( ’ Lowercasel e t t e r s ’ ,d$q12 ) ) && ( grepl ( ’ Uppercase l e t t e r s ’ ,d$q12 ) )) + ( grepl ( ’ Symbols ’ ,d$q12 ) ) + ( grepl ( ’Numbers ’ ,d$q12 )) + ( d$q13== ’ 8 or more c h a r a c t e r s ’ ) + ( d$q14== ’ Never ’ )+ ( d$q14== ’ Only when required by the system ’ ) * 2 + ( d$
q14== ’ At l e a s t once per 12 months ’ ) * 3 + ( d$q14== ’ Atl e a s t once per 6 months ’ ) * 4 + ( d$q14== ’ At l e a s t onceper 3 months ’ ) * 5
23 # C a l c u l a t e x f o r t h e t h i r d h y p o t h e s i s24
25 hyp3y no <− ( d$q15== ’No ’ ) + ( d$q16== ’No ’ ) + ( d$q17== ’No ’ )+ ( d$q18== ’ Yes ’ ) + ( d$q19== ’ Yes ’ ) + ( d$q20== ’No ’ ) + (
d$q21== ’No ’ ) + ( d$q22== ’No ’ ) + ( d$q23== ’No ’ ) + ( d$q24== ’No ’ ) + ( d$q25== ’No ’ ) + ( d$q26== ’No ’ ) + ( d$q27== ’No ’) + ( d$q28== ’No ’ ) + ( d$q29== ’No ’ ) + ( d$q30== ’No ’ ) + ( d$q31== ’ Yes ’ ) + ( d$q34== ’No ’ ) + ( d$q35== ’No ’ )
26 # C a l c u l a t e y f o r t h e t h i r d h y p o t h e s i s27
28 hyp4x no <− ( d$q9== ’ Yes ’ ) + ( d$q10== ’ Yes ’ )29 # C a l c u l a t e x f o r t h e f o u r t h h y p o t h e s i s30
31 hyp4y no <− ( d$q15== ’No ’ ) + ( d$q16== ’No ’ ) + ( d$q17== ’No ’ )+ ( d$q18== ’ Yes ’ ) + ( d$q19== ’ Yes ’ ) + ( d$q20== ’No ’ ) + (
d$q21== ’No ’ ) + ( d$q22== ’No ’ ) + ( d$q23== ’No ’ ) + ( d$q24== ’No ’ ) + ( d$q25== ’No ’ ) + ( d$q26== ’No ’ ) + ( d$q27== ’No ’) + ( d$q28== ’No ’ ) + ( d$q29== ’No ’ ) + ( d$q30== ’No ’ ) + ( d$q31== ’ Yes ’ ) + ( d$q34== ’No ’ ) + ( d$q35== ’No ’ ) + ( d$q37== ’No ’ ) + ( d$q38== ’ Yes ’ ) + ( d$q40== ’No ’ )
32 # C a l c u l a t e y f o r t h e f o u r t h h y p o t h e s i s33
34 hyp5x no <− ( d$q20== ’No ’ ) + ( d$q21== ’No ’ ) + ( d$q22== ’No ’ )+ ( d$q23== ’No ’ ) + ( d$q24== ’No ’ ) + ( d$q27== ’No ’ ) + ( d$
q28== ’No ’ ) + ( d$q29== ’No ’ ) + ( d$q34== ’No ’ ) + ( d$q35== ’No ’ )
35 # C a l c u l a t e x f o r t h e f i f t h h y p o t h e s i s36
37 hyp5y no <− ( d$q15== ’No ’ ) + ( d$q16== ’No ’ ) + ( d$q17== ’No ’ )

+ ( d$q18== ’ Yes ’ ) + ( d$q19== ’ Yes ’ ) + ( d$q25== ’No ’ ) + (d$q26== ’No ’ ) + ( d$q30== ’No ’ ) + ( d$q31== ’ Yes ’ ) + ( d$q33== ’ Yes ’ ) + ( d$q38== ’ Yes ’ ) + ( d$q40== ’No ’ )
38 # C a l c u l a t e y f o r t h e f i f t h h y p o t h e s i s39
40 ggplot ( data . frame ( x=hyp1x no , y=hyp1y no ) , aes ( x = x , y =y ) ) + s t a t sum( aes ( s i z e = . . n . . ) ) + opts ( t i t l e = ’ F i r s tHypothesis Resu l t s Representat ion ’ ) + xlab ( ’ S e c u r i t y
Awareness ’ ) + ylab ( ’ I n t e r a c t i o n with Technology ’ )41 ggsave ( f i lename= ’ hyp1 no . pdf ’ , dpi =600)42 # Output t o p d f t h e f i r s t h y p o t h e s i s r e s u l t s43
44 ggplot ( data . frame ( x=hyp2x no , y=hyp2y no ) , aes ( x = x , y =y ) ) + s t a t sum( aes ( s i z e = . . n . . ) ) + opts ( t i t l e = ’
Second Hypothesis Resu l t s Representat ion ’ ) + xlab ( ’Data Importance Percept ion ’ ) + ylab ( ’ E x p l o i t a t i o nI n v u l n e r a b i l i t y ’ )
45 ggsave ( f i lename= ’ hyp2 no . pdf ’ , dpi =600)46 # Output t o p d f t h e s e c o n d h y p o t h e s i s r e s u l t s47
48 ggplot ( data . frame ( x=hyp3x no , y=hyp3y no ) , aes ( x = x , y =y ) ) + s t a t sum( aes ( s i z e = . . n . . ) ) + opts ( t i t l e = ’ ThirdHypothesis Resu l t s Representat ion ’ ) + xlab ( ’ S e c u r i t y
Education ’ ) + ylab ( ’ E x p l o i t a t i o n I n v u l n e r a b i l i t y ’ )49 ggsave ( f i lename= ’ hyp3 no . pdf ’ , dpi =600)50 # Output t o p d f t h e t h i r d h y p o t h e s i s r e s u l t s51
52 ggplot ( data . frame ( x=hyp4x no , y=hyp4y no ) , aes ( x = x , y =y ) ) + s t a t sum( aes ( s i z e = . . n . . ) ) + opts ( t i t l e = ’
Fourth Hypothesis Resu l t s Representat ion ’ ) + xlab ( ’Past E x p l o i t a t i o n Record ’ ) + ylab ( ’ S e c u r i t y Awareness ’)
53 ggsave ( f i lename= ’ hyp4 no . pdf ’ , dpi =600)54 # Output t o p d f t h e f o u r t h h y p o t h e s i s r e s u l t s55
56 ggplot ( data . frame ( x=hyp5x no , y=hyp5y no ) , aes ( x = x , y =y ) ) + s t a t sum( aes ( s i z e = . . n . . ) ) + opts ( t i t l e = ’ F i f t hHypothesis Resu l t s Representat ion ’ ) + xlab ( ’ S o c i a l
Engineering I n v u l n e r a b i l i t y ’ ) + ylab ( ’ OtherI n v u l n e r a b i l i t i e s ’ )
57 ggsave ( f i lename= ’ hyp5 no . pdf ’ , dpi =600)58 # Output t o p d f t h e f i f t h h y p o t h e s i s r e s u l t s59
60 pdf ( f i l e = ’ hyp1x no . pdf ’ )61 h i s t ( hyp1x no , main= ’ F i r s t Hypothesis x a x i s Histogram ’ ,
xlab= ’ S e c u r i t y Awareness ’ )62 dev . off ( )

63 # Output t o p d f t h e f i r s t h y p o t h e s i s x a x i s h i s t o g r a m64
65 pdf ( f i l e = ’ hyp1y no . pdf ’ )66 h i s t ( hyp1y no , main= ’ F i r s t Hypothesis y a x i s Histogram ’ ,
xlab= ’ I n t e r a c t i o n with Technology ’ )67 dev . off ( )68 # Output t o p d f t h e f i r s t h y p o t h e s i s y a x i s h i s t o g r a m69
70 pdf ( f i l e = ’ hyp2x no . pdf ’ )71 h i s t ( hyp2x no , main= ’ Second Hypothesis x a x i s Histogram ’ ,
xlab= ’ Data Importance Percept ion ’ )72 dev . off ( )73 # Output t o p d f t h e s e c o n d h y p o t h e s i s x a x i s h i s t o g r a m74
75 pdf ( f i l e = ’ hyp2y no . pdf ’ )76 h i s t ( hyp2y no , main= ’ Second Hypothesis y a x i s Histogram ’ ,
xlab= ’ E x p l o i t a t i o n I n v u l n e r a b i l i t y ’ )77 dev . off ( )78 # Output t o p d f t h e s e c o n d h y p o t h e s i s y a x i s h i s t o g r a m79
80 pdf ( f i l e = ’ hyp3x no . pdf ’ )81 h i s t ( hyp3x no , main= ’ Third Hypothesis x a x i s Histogram ’ ,
xlab= ’ S e c u r i t y Education ’ )82 dev . off ( )83 # Output t o p d f t h e t h i r d h y p o t h e s i s x a x i s h i s t o g r a m84
85 pdf ( f i l e = ’ hyp3y no . pdf ’ )86 h i s t ( hyp3y no , main= ’ Third Hypothesis y a x i s Histogram ’ ,
xlab= ’ E x p l o i t a t i o n I n v u l n e r a b i l i t y ’ )87 dev . off ( )88 # Output t o p d f t h e t h i r d h y p o t h e s i s y a x i s h i s t o g r a m89
90 pdf ( f i l e = ’ hyp4x no . pdf ’ )91 h i s t ( hyp4x no , main= ’ Fourth Hypothesis x a x i s Histogram ’ ,
xlab= ’ Past E x p l o i t a t i o n Record ’ )92 dev . off ( )93 # Output t o p d f t h e f o u r t h h y p o t h e s i s x a x i s h i s t o g r a m94
95 pdf ( f i l e = ’ hyp4y no . pdf ’ )96 h i s t ( hyp4y no , main= ’ Fourth Hypothesis y a x i s Histogram ’ ,
xlab= ’ S e c u r i t y Awareness ’ )97 dev . off ( )98 # Output t o p d f t h e f o u r t h h y p o t h e s i s y a x i s h i s t o g r a m99
100 pdf ( f i l e = ’ hyp5x no . pdf ’ )101 h i s t ( hyp5x no , main= ’ F i f t h Hypothesis x a x i s Histogram ’ ,
xlab= ’ S o c i a l Engineering I n v u l n e r a b i l i t y ’ )

102 dev . off ( )103 # Output t o p d f t h e f i f t h h y p o t h e s i s x a x i s h i s t o g r a m104
105 pdf ( f i l e = ’ hyp5y no . pdf ’ )106 h i s t ( hyp5y no , main= ’ F i f t h Hypothesis y a x i s Histogram ’ ,
xlab= ’ Other I n v u l n e r a b i l i t i e s ’ )107 dev . off ( )108 # Output t o p d f t h e f i f t h h y p o t h e s i s y a x i s h i s t o g r a m


Bibliography
[1] Shari Lawrence Pfleeger Charles P. Pfleeger. Security in Computing. Pear-son Education, Inc., third edition, 2003.
[2] Matt Bishop. Computer Security: Art and Science. Pearson Education, Inc.,2003.
[3] D. Ian Hopper. Hackers target university databases, June 2001.
[4] Andrew Brandt Kim Zetter. How hackers hack, April 2001.
[5] Pascale Carayon Sara Kraemer. A human factors vulnerability evaluationmethod for computer and information security.
[6] Eugene Schultz. The human factor in security. Computers & Security,24:425–426, 2005.
[7] Lesia L. Crumpton Pamela R. McCauley-Bell. The human factors issuesin information security: What are they and do they matter? In Proceedingsof the Human Factors and Ergonomics Society, pages 439–443, 1998.
[8] Erkan Kahraman. Evaluating it security performance with quantifiablemetrics. Master’s thesis, DSV SU/KTH, 2005.
[9] Gary Hinson. Human factors in information security.
[10] Agata Sawicka Jose J. Gonzalez. A framework for human factors in infor-mation security.
[11] Bruce Schneier. Secrets and Lies. Robert Ipsen, 2000.
[12] William L. Simon Kevin D. Mitnik. The Art of Deception. Wiley Publishing,Inc., 2002.
[13] Konstantin Sapronov. The human factor and information security, De-cember 2005.
[14] Dancho Danchev. Reducing ”human factor” mistakes, March 2006.
[15] Raymond R. Panko. Corporate Computer and Network Security. PearsonEducation, Inc., 2004.
[16] Terry Timm Moos. Cisco-sponsored security survey of remote workersreveals the need for more user awareness, November 2006.
75
[17] Eric Maiwald. Fundamentals of Network Security. McGraw-Hill TechnologyEducation, 2004.
[18] Ivn Arce. The weakest link revisited. IEEE Security and Privacy, 1:72–76,2003.
[19] Michele D. Crabb David L. Oppenheimer, David A. Wagner. System se-curity: A management perspective, September 1997.
[20] Robert E. Newman. Enterprise Security. Pearson Education, Inc., first edi-tion, 2003.
[21] Neil J. Salkind. Exploring Research. Pearson Education, Inc., fifth edition,2003.
[22] Alison Jane Pickard. Research Methods in Information. Facet Publishing,2007.
[23] John W. Creswell. Research Design: Qualitative, Quantitative, and MixedMethods Approaches. SAGE Publications, Inc, third edition, 2008.
[24] Mike Speciner Charlie Kaufman, Radia Perlman. Network Security: PrivateCommunication in a Public World. Prentice Hall, Inc., 1995.
[25] Axel Boldt. Bliss, a linux ”virus”, January 2000.
[26] Mikko Hypponen. F-secure computer virus information pages: Linux/s-taog, February 1997.
[27] Ero Carrera. F-secure computer virus information pages: Linux.devnull,September 2002.
[28] Joel R. Voss. Ssh bruteforce virus by altsci, December 2007.
[29] Ryan Naraine. Mac os x malware found in pirated apple iwork 09, Jan-uary 2009.
[30] Ryan Naraine. ibotnet: Researchers find signs of zombie macs, April 2009.
[31] Jane Wakefield. Office intruder ”steals” data, May 2009.
[32] Ariel Rabkin. Personal knowledge questions for fallback authentication:Security questions in the era of facebook. In Proceedings of the 4th sympo-sium on Usable privacy and security, pages 13–23, 2008.
[33] Inc. Cisco Systems. Actions speak louder than words: Despite claimingsecurity awareness, many remote workers engage in risky online behav-ior, October 2006.
[34] Jeremy L. Smith. I.t. security: Antivirus strategy - improving the securityof the dispatch center. Technical report, Plant Equipment, Inc., 2005.
[35] Al Gillen John F. Gantz, Christian A. Christiansen. The risks of obtainingand using pirated software, October 2006.