Embed Size (px)
Citation preview
Evaluating the Chile… / F. Hoces de la Guardia, A. Hojman, O. Larrañaga 129Estudios de Economía. Vol. 38 - Nº 1, Junio 2011. Págs. 129-168
* Valuable contributions to this work have been provided by José Miguel Benavente, David Bravo, Paula Castro, Dante Contreras, Paz Garcés, Rodrigo Herrera, Jorge Manzi, Tomás Rau, María de la Luz Ramírez, Jaime Ruiz-Tagle, Verónica Silva, Sergio Urzúa y Ana María Véliz. We thank the support from the Centro de Microdatos, Iniciativa Científica Milenio (Project P075-023-F). The results and opinions are exclusive responsibility of the authors.
** Centro de Microdatos, Universidad de Chile and University of Pennsylvania Student.*** Centro de Microdatos, Universidad de Chile and University of Chicago (PhD
Student).**** Universidad de Chile Professor and PNUD Program Officer.
Evaluating the Chile Solidario program: results using the Chile Solidario panel and the administrative databases*Evaluando el programa Chile Solidario: resultados usando el panelChile Solidario y datos administrativos
Fernando Hoces de la Guardia**Andrés Hojman***, Osvaldo Larrañaga****
Abstract
This paper presents the results of a three-year evaluation performed on the first cohorts of Chile Solidario, the most important anti-poverty program in Chile. The paper presents a description of the program, emphasizing the mechanism by which people were admitted into the program. We then propose evaluation strategies and discuss their validity. The final evaluation is conducted using a Matching estimator, and we discuss the principles surrounding the potential for this to be a valid evaluation method. The initial results using the Chile Solidario Panel suggest that the program had positive effects on psychosocial welfare and on take-up of subsidies and social programs. However, it is not possible to obtain reliable results due to data shortcomings, particularly the lack of baseline data. In order to solve the problem, we generated a database using six years of administrative data, including around 1,000,000 family records per year. A method for overcoming the treatment substitution problem is discussed and implemented. Results are much more robust than those of the Chile Solidario Panel and show small, but clearly positive effects for several variables, especially the number of workers in the family, the percentage of workers in the family and the employment of the head of the family.
Key words: Matching, Extreme poverty, Impact evaluation, Treatment substi-tution, Administrative data.

Estudios de Economía, Vol. 38 - Nº 1130
Resumen
Este artículo presenta los resultados de una evaluación de tres años realizada en las primeras cohortes del Programa Chile Solidario, el programa de reducción de la pobreza más importante de Chile. El artículo presenta una descripción del programa, haciendo hincapié en el mecanismo por el cual las personas fueron admitidas en el programa. A continuación, propone estrategias de evaluación y discute su validez. La evaluación final se realiza mediante un estimador de “Matching” (pareo), y se discuten los principios en base a los cuales se trataría de un método de evaluación válida. Los resultados iniciales usando el Panel de Chile Solidario sugieren que el programa ha tenido efectos positivos sobre el bienestar psicosocial y en la adopción de subsidios y programas sociales. Sin embargo, no es posible obtener resultados fiables debido a las deficiencias de datos, en particular la falta de una línea de base. Con el fin de resolver el problema, hemos generado una base de datos utilizando seis años de datos administrativos, incluyendo alrededor de 1.000.000 de registros de familias por año. Un método para superar el problema de sustitución de tratamiento es discutido y aplicado. Los resultados son mucho más robustos que los del Panel de Chile Solidario y muestran pequeños, pero evidentes efectos positivos de varias variables, especialmente relativos al número de trabajadores en el hogar, el porcentaje de trabajadores en el hogar y el empleo del jefe de hogar.
Key words: Pareo, Pobreza extrema, Evaluación de impacto, Sustitución de tratamiento, Datos administrativos.
JEL Classification: C14, I30, I38.
1. Introduction
Chile Solidario is the most important anti-poverty program in Chile. It is a joint coordination effort between all public sectors, so as to strongly focus social benefits on families living in extreme poverty conditions1. It consists of three main components: psychosocial support, in the form of a subprogram called Puente (Bridge); preferential access to the social services and programs offered by the State; and guaranteed access to the subsidies offered by the State, includ-ing a small amount of money provided exclusively to program beneficiaries. In the last year covered by this evaluation (2006) there were more than 250,000 participating families.
1 The executives of Chile Solidario refer to it as a Social Protection System, which coordi-nates different programs. Within the Impact Evaluation literature it can be considered a program, only that its benefits are selected from a menu instead of being identical to all of those in the treatment group.

Evaluating the Chile… / F. Hoces de la Guardia, A. Hojman, O. Larrañaga 131
The impact evaluation was designed over a period beginning one year after the program’s implementation. The instrument designed for this purpose was the Chile Solidario Panel Survey (PCHS). This survey presents some sampling difficulties. Since the evaluation was designed after the implementation began, there are no baseline data, thereby causing lower credibility in the estimations. In order to solve this problem, and with the goal of collecting the variables that determine the mechanism by which beneficiaries are admitted into the program (hereafter referred to as the admission mechanism), apart from PCHS the evalu-ation was complemented with administrative data from the Puente Program and from the CAS2 databases, an instrument used at the time to assign State benefits (administered yearly to more than 25% of the population). The evaluation con-ducted using the administrative data is the primary focus of the paper.
The evaluation design is non-experimental, based on the Matching technique. In order to estimate the impact via Matching in a valid form, it is necessary to identify all of the variables determining participation in a program. In this particular case, there are characteristics of the families and of the districts3 in which these families live that determine the probability these families have to be invited to participate in the program. After carrying out an extensive analysis on the admission mechanism it was determined that nearly all of the relevant variables had been captured.
Results from the Chile Solidario Panel are obtained using the Matching approach. In most cases it is possible to carry out differences-in-differences analyses with the Chile Solidario Panel. However, in some cases, especially in the take-up of social programs and psychosocial results, it is only possible to find results using cross-sectional estimations for 2006. These results are mostly positive. Also, some negative results for areas such as poverty and indigence in cross-sectional estimations have been found for 2006. However, the results show that when it is possible to contrast the similarities prior to the implementation of the program between the treatment group and the controls using administrative data, in a big proportion of the cases important differences can be found before the start of the program between both groups. This implies that estimations performed using only the Chile Solidario Panel will likely be seriously questionable.
In order to overcome the problems of the Chile Solidario Panel described above, a new evaluation was carried out which merged all of the available ad-ministrative databases. A panel with seven rounds was generated, with around 1,000,000 records for each round. However, there are also shortcomings to this approach, such as the non-random attrition and the measurement error, but the evaluation overall is much more reliable. There is a substantial rate of participa-tion in Chile Solidario in the control group, so different strategies to overcome this problem are discussed. A simple extension to the standard solution substitu-
2 CAS measures resource availability and it breaks down into Housing, Income, Employment and Education scores.
3 The program has a decentralized management model, so it is executed at the comuna (Translated here as district) level.

Estudios de Economía, Vol. 38 - Nº 1132
tion bias is adopted. The results show a mixture of small positive and negative effects on some variables, while other important variables, such as those related to employment, have small but clear positive effects.
The evaluation of Chile Solidario presented several challenges, but these challenges also provided valuable lessons to consider when implementing impact evaluations in developing countries. Those lessons include the need to create evaluations as soon as programs are designed, the need to extensively document all long-term decisions carried out, the importance of keeping the questions on the questionnaires over time, the usefulness of verifying ID’s in the location where the survey was administered, the need to deeply understand the program when designing the instruments to be used, the opportunities that are given by the use of administrative data, etc. All of the problems encountered may appear in future impact evaluations; therefore, systematizing these problems may prove a useful guide to organizations wanting to evaluate their programs. In addition to these lessons, the information available to program executives makes the Impact Evaluation a valuable exercise.
The rest of the paper is structured as follows: In section 2 the Chile Solidario Protection System is described. In section 3 the admission mechanism to the system is thoroughly explained, so as to justify the non-experimental techniques used in the evaluation. Section 4 assesses the validity of the identification strategy. Section 5 describes the data that are used. Section 6 provides a description of the methodology used in the evaluation. Section 7 presents the results using the Chile Solidario Panel database. Section 8 describes the Administrative Panel Database. Section 9 describes the criteria for choosing the control group from that database. Section 10 describes the results obtained from the Administrative Panel. Section 11 concludes and systematizes the lessons for future evaluations.
2. Chile Solidario Social Protection System
During the 1990s, Chile went through a fast decline in poverty levels. The total poverty index decreased 15.4 points in six years. Extreme poverty in the same period was reduced by more than half. However, from 1996 to 2000 and to 2003 there was relative stagnation in the poverty figures. Chile Solidario was created as a response to the determination that the pace and volume of the extreme poverty figures were stagnated since 1996. Fortunately, from 2003 to 2006 there was a new important reduction in non-extreme poverty levels, going from 18.7% to 13.7% and of extreme poverty, from 4.7% to 3.2%. It is of major public interest to quantify in what way Chile Solidario was responsible for this important progress.
The Social Protection System Chile Solidario (from now on CHS) was a pioneering initiative in Chile in two dimensions. It was the first governmental program to address poverty in a multidimensional way, and it was also the first large-scale public policy to undergo an impact evaluation. Besides, social pro-grams and benefits were not focused, and there was a lack of mechanisms and safety nets that would help to avoid loss of income and to mitigate the effects of unforeseen circumstances suffered by the poorest families. The program is run by MIDEPLAN, the anti-poverty department of the Government of Chile.
The families remain in the System for a 5-year period. During this time an intervention is carried out, which incorporates three components:
Evaluating the Chile… / F. Hoces de la Guardia, A. Hojman, O. Larrañaga 133
FIGURE 1EVOLUTION OF POVERTy AND ExTREME POVERTy 1990-2006
Source: MIDEPLAN.
i) Psychosocial Support and Protection Bonus Psychosocial Support consists of personalized mentoring, in 21 sessions over
a two year period, given to enrolled families by a specially trained professional (“Family Support”). During this mentoring, mutual commitments are established. Moreover, the professional helps with the procedures for the respective bonuses and subsidies to which the beneficiaries are entitled, and also helps them to access a varied group of locally implemented social programs that the State has put at their disposal. Additionally, the law contemplates that the families enrolled in Chile Solidario will receive a monetary bonus, whose amount de-creases from US$ 21 per month during the first year to approximately US$ 12 per month in the fifth year.
ii) Guaranteed Access to Monetary Subsidies Monetary subsidies are guaranteed, as long as they remain in the system, for
everyone fulfilling the requirements. There are 4 different money transfers people may apply to4, each with different requirements.
4 People may apply to SUF (around US$10 a month, given for each child, pregnant woman); SAP (Drinkable Water Subsidy); PASIS (around US$100 a month, given to elderly or sick people) and the Subsidy for School Retention.
45
40
35
30
25
20
15
10
5
0
1990 1990 1990 1990 1990 1990 1990 1990
Extreme Poverty Non Extreme Poverty Total Poverty
38.6
32.9
27.6
23.221.7
20.218.7
13.7
25.623.8
20.117.5
16.114.6 14
10.5
13
97.6
5.8 5.6 5.6 4.73.2

Estudios de Economía, Vol. 38 - Nº 1134
iii) Preferential Access to Assistance and Social Promotion Programs The beneficiaries of Chile Solidario have priority of access to these social
services. In order to ensure the preferential access, MIDEPLAN establishes assistance agreements with many public services for enrolled families. As an example, some benefits5 are specified: Health assistance free of charge in public health services; preferential access to Training Programs; prefe-rential access to the Support Program for Small Businesses.
Chile Solidario was created in order to reduce extreme poverty in Chile. The program has defined a set of intermediate objectives in seven different areas for each family. This evaluation focuses on two of the most difficult areas from which to obtain results: employment and income.
Costs Associated with the Chile Solidario System
In terms of budget, Chile Solidario has grown strongly, growing from around US$ 5 million in 2002 to more than US$ 140 million in 2007, using total resources equivalent to around 0.1% of that year’s GDP.
3. Admission Mechanism
A complete understanding of the mechanism by which families enter the program is fundamental to determine feasible identification strategies and the assumptions that must be used in the evaluation.
Chile Solidario was created as a Social Protection System targeting people living in conditions of extreme poverty. As a consequence, 225,0816 program slots were originally assigned for the period 2002-2005 (a number that was thought to be enough to cover the total number of indigent families). Later, more slots were opened in the system. As of November 2006, the last date this evaluation covers, the program included a total of 252,586 families7.
Since the plan was to cover the population living in extreme poverty, and due to the fact that there was no clear way to distinguish between indigent and non-indigent families using the CAS score, it was decided to use the district and regional indigence percentages obtained through the CASEN survey (a
5 The broken down detail for 2005 corresponds to the information contained in the Chile Solidario Information book Nº 2 (Cuaderno de Información Nº 2 Chile Solidario) (MIDEPLAN). Only a few examples are named, but there are a wide variety of agree-ments between MIDEPLAN and other public sector institutions regarding the preferential access of the program beneficiaries
6 “Cobertura de Chile Solidario por Región 2002-2005 Final”. Secretaría Ejecutiva de Chile Solidario, Excel File.
7 Base Puente Personas, May 2007. Includes Families and One-Person Households consti-tuted by Old Age People. It includes active families (families that completed the program) and interrupted families (those that did not complete the program.

Evaluating the Chile… / F. Hoces de la Guardia, A. Hojman, O. Larrañaga 135
national households survey) in order to determine a CAS cutoff such that a similar percentage of the district population was eligible for the program. This led to the adoption of different CAS cutoff scores by district. Families whose CAS score was less than the maximum of either their district’s or their region’s cutoff scores were eligible for the program.
Since different cutoff scores were established in districts all over the country8, it is possible to use non-experimental strategies for the evaluation, such as matching, in which it is mandatory that the treatment and the control group are comparable. Both this impact evaluation of Chile Solidario and the previous ones have exploited the fact that families having identical CAS scores are or are not eligible for the program, depending on the district in which they live.
Once the effective cutoff scores by district have been established, it is possible to know who is eligible for Chile Solidario. However, there were not necessarily program slots available for all eligible families. The number of slots available for each district was decided in the following manner: Based on the effective cutoff scores, the potential demand of Chile Solidario beneficiaries in CAS databases was estimated; this corresponded to 298,409 families9. Since the budget was only available for 225,081 slots, in most cases a lower amount to the potential demand was assigned to each district. The way the total number of places by district was assigned, and their distribution through time, were the result of a discretional analysis process, taken case by case in each district, based on the real possibilities they would have to give psychosocial support to a certain amount of families. Some of the factors considered were the number of public employees counted on by the district administration10, the geographical characteristics of the district, etc. Once the cutoff scores and the distribution of the yearly slots were determined, the families with the smallest CAS score had priority.
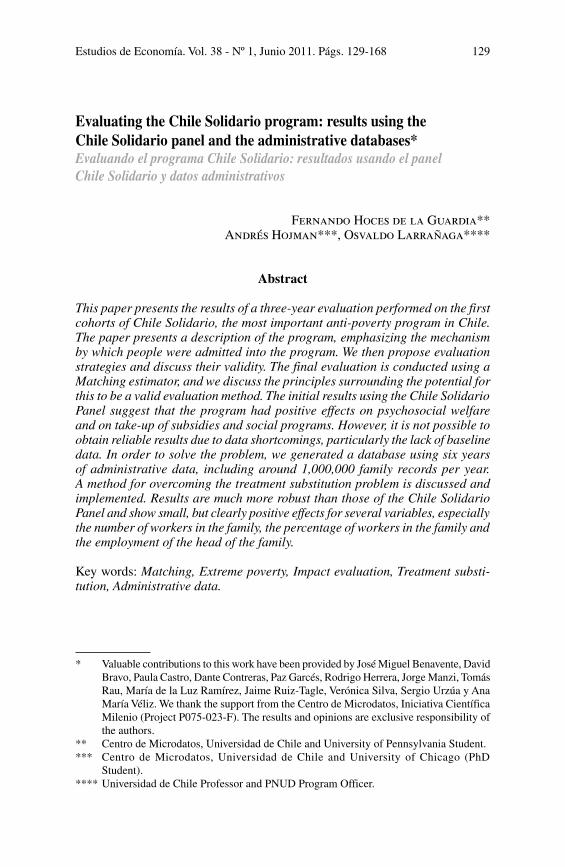
Given this information, we should see more people with higher CAS scores being admitted into the program over time. Figure 2 shows such a pattern. Each mark represents a family entering the program. The x-axis displays the entry date. The y-axis presents the CAS score for the family. There is a marked increase from the first to the later years. However, this does not happen in all cases, due to two reasons: 1) Each district’s CAS database is continuously updated. 2) The law establishes that in those cases where the families in the initial list are too dispersed in location inside the district, it will be possible to distribute families between the Familiar Supports at geographical conve-nience, even though they were not families with smaller scores. In practice, it can be observed that the scores of people admitted to the program can even
8 Chile has 346 districts.9 Amount obtained in 2001 CAS Conglomerate of the addition through the communes of
the families eligible for the program.10 The administration of the Comunas (districts) are called on this paper Municipalidades
(district administrations).

Estudios de Economía, Vol. 38 - Nº 1136
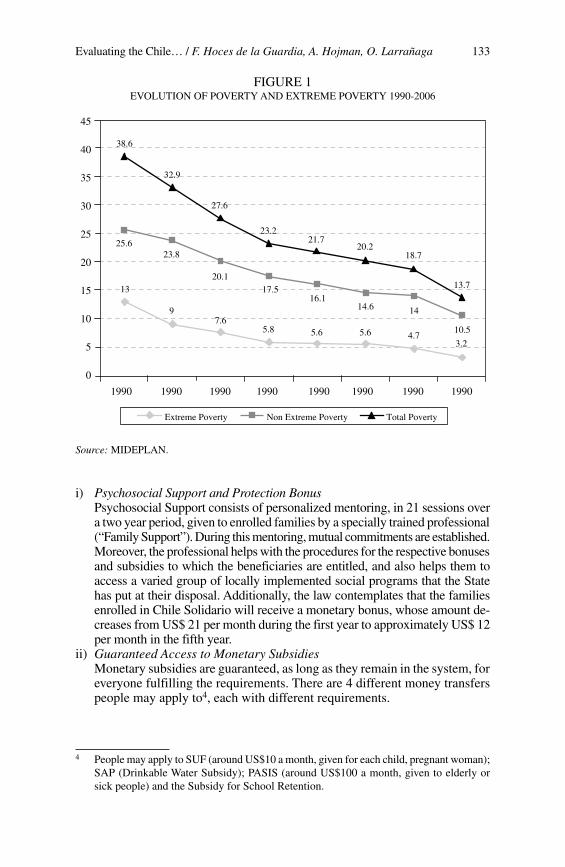
show a uniform pattern through time (Figure 3). This phenomenon is relevant for the evaluation, as it explains why after many years of the system being in practice there is still common support (that in fact makes matching possible). It is worth mentioning that the districts strictly respect the prohibition on including beneficiaries whose score is over the cutoff score, as is shown by the fact that no more that 2% of beneficiaries appear in the database with CAS scores exceeding the effective cutoff of their district.
It can be concluded that, for a family, the variables having influence on their program participation are their CAS score, the cutoff score obtained by their district, the amount of slots assigned for that district, and the rate of assigned slots/original slots, which is related to the management capacities of each district. Another variable that might be relevant is the geographic isolation of the family and the capacity of that family to have influence on the district administration’s employees to be included in the program. Chile Solidario executives believe this last variable may not be relevant since there has never been a massive demand for inclusion in the program.
FIGURE 2BENEFICIARy ADMISSION PATTERN, LOS ANGELES DISTRICT
Source: Own elaboration using Puente Base, May 2007.
Los AngelesDistrict Cutoff: 468.974 Regional Cutoff: 472.03
Date of Entry
CA
S Sc
ore
550
500
450
400
350
01 Jan 02 01 Jan 03 01 Jan 04 01 Jan 05 01 Jan 06 01 Jan 07

Evaluating the Chile… / F. Hoces de la Guardia, A. Hojman, O. Larrañaga 137
FIGURE 3ADMISSION PATTERN FOR BENEFICIARIES, TEMUCO DISTRICT
Source: Own elaboration using Puente Base, May 2007.
4. Validity of the Identification Strategy
The identification strategy used to measure CHS impact is based on the existence of different families that have the same probability, conditioned on a group of variables, of entering the program, some of them are admitted and some others are not, due to exogenous reasons. There are three situations where different families with a similar CAS are not all included in the program: 1) the treatment group has a marginally lower CAS score; 2) the treatment group and controls have the same score but they live in different districts with different cutoff scores; and 3) both families have the same CAS score and live in the same district, but due to unknown reasons, one of them receives treatment and the other does not. This third situation presents a new issue as to whether the reasons families are admitted into the program are indeed external.
This evaluation is going to be carried out by Matching (see section 6). The fundamental assumption of that methodology is unconfoundedness. Under this assumption, all factors relating treatment assignment with the potential outcome are observable11. As an example, let’s suppose those in the treatment group come mainly from districts where the public services provided are better-than-average
11 “Estimation of Average Treatment Effects Under Unconfoundedness”. Imbens, G. en Imbens & Wooldridge (What’s new in econometrics, Lecture Notes 1, Summer 2007).
TemucoDistrict Cutoff: 483.679 Regional Cutoff: 457.073
Date of Entry
CA
S Sc
ore
550
500
450
400
01 Jan 03 01 Jan 04 01 Jan 05 01 Jan 06 01 Jan 07

Estudios de Economía, Vol. 38 - Nº 1138
quality. On the other hand, let’s suppose those in the control group come from all kind of districts with equal opportunity. In case of not being able to measure the quality of the public services, the mentioned effect would contaminate the program’s estimated impact because what would be measured would be better quality of public services + program impact. Next, it is discussed whether that assumption is fulfilled for this evaluation.
The factors having an influence over the probability of treatment have been classified intofour groups. Individual and district variables are considered, since both can affect the probability of treatment. If on top of that they have an influence over the potential outcome, any of these variables can be a source of bias if the program impact is not controlled. In the following table there are examples of variables in each of the categories that could have an influence over the likelihood of admission to the program:
TABLE 1FACTORS THAT COULD DETERMINE THE PARTICIPATION ON THE PROGRAM
Observable Unobservable
Individuals CA score Motivation; Closeness to the district administration
Districts Cutoff score and slots available
District administration management capabilities
Observable individual variables: The only individual-level characteristic ex-plaining his/her participation in the program, according to the rules, is the CAS score. CAS score is related to the socioeconomic level, hence it is important to control for when evaluating the program.
Observable communal variables: The only district characteristics explaining the probability that an individual living in that district takes part in the program are the district cutoff score and the number of program slots available in the district. Both variables can be related to the potential outcome. The number of places has been decided considering the quality of the public service. Hence, besides controlling for the number of slots it is necessary to capture, in some way, the quality of public service in the district that is unobservable on the data.
Unobservable individual variables: When families are invited to participate in the program they can choose to accept or not. This can be a first cause of violation to the assumption of unconfoundedness (self-selection). However, the rate of rejection of enrolment in the program is around 1%, so even if that factor exists it is not very relevant. The invitations to the program within each district were based on the CAS score, with the exception of those cases where in geographical terms it was more efficient to group beneficiary families. For this reason, a family’s geographical accessibility is an unobservable variable in the data that determines the probability of being treated. This could be a second violation of the assumption of unconfoundedness. We do not have data
Evaluating the Chile… / F. Hoces de la Guardia, A. Hojman, O. Larrañaga 139
to control for this potential bias, so it will only be possible to isolate it assuming that it did not change in time and estimating through differences-in-differences, as explained in the methodology section. The third potential violation of the assumption of unconfoundedness occurs when the individual’s motivation can affect the probability of being invited to participate in the program. This could bias the evaluation outcomes. According to Chile Solidario workers, until the end of year 2003, there was scarce public awareness of the program’s existence, so people could hardly go to the Municipalities and ask to be included.
Unobservable communal variables: The only moment there was a subjective process affecting the chance to participate was when the number of slots per district was assigned (See section 3). As described in section 3 of this document, the potential demand had been set at 298,409 families, whereas for budgetary reasons 225,000 slots were given. The manner in which the total of these places per district was assigned and their distribution in time was the result of a case-by-case analysis of the districts and their real possibilities to provide psy-chosocial support to a high number of families. This could be a fourth violation of the unconfoundedness assumption. This last selection process is important in magnitude, given that 30% of the potential beneficiaries were not included. The problem that may arise from this procedure would be, for example, that the beneficiaries were grouped in districts with better public management capabilities. In this case, the beneficiaries would be in districts with characteristics that are different from the controls and this difference would not be noticeable. As has been noted, the only moment there were decisions based on unobservables that could have an influence at the same time in the assignment of places and in the quality of services rendered by the district was when the assignment of places per district was decided. One possibility of isolating that decision process is to control for the manner in which the decision-maker determines the capability of the district to provide quality support to families: taking the total of available slots for the program (from the CAS databases) and calculating the proportion of those slots effectively given to the district, we can quantify the subjective aspects the program workers considered. Given that this measure was the only way the program workers had an influence on the probability of participation, by controlling for this variable, the identification strategy becomes valid.
5. Data
Puente Databases: The Planning Ministry (MIDEPLAN) is in charge of mana-ging the Chile Solidario System. Puente databases are used as a tool to handle program management, which includes all the beneficiaries of the program, their identification numbers and their CAS scores, among other variables.
The Chile Solidario Panel Survey (CHSP) is the survey on which this evaluation is based, and was specifically designed for the impact evaluation. The panel is a longitudinal survey, composed of beneficiaries and non-beneficiaries of the system. The information gathered contains questions about demographic characteristics, education, health, employment, income, housing, family information and a ps-ychosocial module. In general, the questionnaire is very detailed, its only flaw being that it is not specific enough for Chile Solidario, as it does not have many

Estudios de Economía, Vol. 38 - Nº 1140
questions on the use of benefits specific to the program. The rounds used in this evaluation are for the years 2003, 2004 and 200612. Despite being a longitudinal survey, the follow-up unit and protocols to minimize attrition were only determined in 2006. The main characteristics of the sample are detailed below.
The Puente program started in mid-year 2002. Only a year after, planning for the program evaluation was initiated, and it was decided to use the CASEN 2003 survey as the first round of CHSP. In order to identify the treatment group for the Chile Solidario Panel the question from the CASEN survey “Does your family participate in the Chile Solidario program?” was used. After an extensive process intended to correct the Identification Numbers13, it became clear that that variable had an important level of measurement error when compared to the administrative data from Chile Solidario, with an inclusion error of about 6% and an exclusion error of about 15%. Another problem was that the ID numbers were not checked at the time the data were collected, which led to a high probability that those numbers were not correct.
Additionally, a complementary sample of homes that benefitted from Chile Solidario was added using data obtained from Puente Bases. For the years 2004 and 2006 beneficiaries belonging to the program’s most recent cohorts were added, who had been surveyed in CASEN 2003. The control group was selected by matching, but there were no appropriate administrative variables available at that time and some regional restrictions were imposed on the matching. Due to budgetary reasons all those observations having missings in the variables used in the propensity score estimation were excluded as well as those of beneficiaries having no control families with a similar probability of program participation (those being outside the common support). The sample was stratified in 2004, according to the demographic distribution of the beneficiaries included in Puente Base in July 2004. In the end, for the 2006 round, enrolled families that did not have a CAS record were excluded. Due to the successive stratifications and to the fact that the new cohorts were not added in a way that is proportional to their magnitude, it is not clear whether this panel is representative of the actual CHS population.
Of note, a series of changes in the questions included in the PCHS question-naire were made over the three rounds. It was necessary for evaluation purposes to carry out an extensive data standardization process in order to make the three rounds compatible. The scale of the changes was such that the questionnaire in the psychosocial section is not comparable between the years 2004 and 2006.
TABLE 2TOTAL NUMBER OF INDIVIDUALS, CHILE SOLIDARIO PANEL
2003 2004 2006
BeneficiariesNon Beneficiaries
13,70518,538
13,627 18,326
14,91318,225
Source: Chile Solidario Panel 2003-2006.
12 Currently the 2007 round of the panel is available.13 In Chile, the identification number is known as RUN or RUT.

Evaluating the Chile… / F. Hoces de la Guardia, A. Hojman, O. Larrañaga 141
CAS record: The CAS record was the instrument used up to 2006 to select the beneficiaries of the targeted social programs. It contains relevant information including ID number, zone, district, current month’s income, employment, housing, education, etc. The CAS records expired after two years. The CAS record with the information of the families is stored in the CAS database. These bases contain information from all records that were still valid up to December of the calendar year of the CAS database. As an example, the CAS database 2001 contains information for all families that applied for a CAS record bet-ween January 1999 and December 2001. Each CAS database covers about 6 million individuals, including approximately 75% of families living in extreme poverty conditions14.
The main problem of Chile Solidario Panel is the lack of baseline data. As a way of partially addressing this problem, in this evaluation the databases from the years 2000 to 2005 have been put together, in order to have pre-treatment data available on the program.
6. Methodology Used in the Evaluation
When Chile Solidario was designed, the creation of an experimental control group15 was not considered. The most proper way, statistically, to evaluate a program’s impact is to perform an evaluation with a control group of that kind. When not being able to use experimental methods, some kind of non-experimental method to estimate the impact is required. Considering that the characteristics determining eligibility in Chile Solidario are not random, the Propensity Score Matching is used to build up a counterfactual scenario.
Matching methodology has a long history in non-experimental studies of impact evaluation. (Rosenbaum & Rubin (1983); LaLonde (1986); Dehejia & Wahba (1998); Abadie and Imbens (2006)) and nowadays it is still considered a valid way of estimation that is being continuously improved Blundell & Costa Dias (2002); Imbens (2004); Heckman, Ichimura & Todd (1997)). Matching is applied to identify an adequate control group whenever this group cannot be built up from randomization of the intervention.
Conceptually, the propensity score matching method consists of looking for a control for each treatment group member that is identical in terms of his/her probability of participation in the program. Once the sample of non-beneficiaries has been chosen, and having fulfilled the fundamental assumptions of the method, the conditions for a natural experiment are re-established. The use of matching to determine a program effect requires two assumptions:
14 Estimation by Osvaldo Larrañaga based on CASEN 2003.15 A group of experimental controls is one that has been randomly selected between the
potential participants in a system, so that, statistically, it has the same characteristics as the group under treatment in the system.

Estudios de Economía, Vol. 38 - Nº 1142
Unconfoundedness assumption: The assignment to treatment (D) is orthogonal to the potential results conditioned on a group of noticeable x variables. The conditioning is performed only on observable variables, which have to be collec-ted before the program may alter them. In other words, if the unconfoundedness assumption is fulfilled, the results of the non-treated families behave similarly to those of treated families for the cases when they have not participated in the program. This assumption is not possible to prove, since the potential result (Yi) is not known before the intervention.
In the section 4 (Validity of the Identification Strategy) an extensive dis-cussion was presented about the scenarios where it is possible to consider this assumption as true. Given such discussion, the variables to which we had access and that would influence admission to the program would be: the family’s CAS score16, the cutoff score of the district, the number of places available in the district at the time of evaluation and the proxy measurement regarding man-agement capacity. This basic theoretical specification was empirically tested, as the difference in pre-treatment17 variables between the treatment group and the control group was measured. The unconfoundedness assumption cannot be easily assessed using the Chile Solidario Panel, so it was necessary to use the pre-treatment variables available on the CAS records to have a more solid comparison point between treated and control families. The matching specifica-tion using the theoretical model attained a medium level of similarity between the treatment group and the control group. A pre-treatment imbalance on the “Number of persons in the family” variable was confirmed after successive tests, among other variables18. Tests with more and with fewer variables were carried out, modifying the number of neighbours and using kernel and calliper matching. No specification had a better match than the basic model. Considering the importance of the number of people in a family, it was decided this would be included in the p-score identification. In total, 13 models were tested, but the original theoretical specification was kept, with the addition of the number of people in each family.
These first tests are just a beginning for checking pre-treatment consis-tency. Effort is put on the Results Section to make it possible to determine whether this assumption may be feasible, using more pre-treatment variables and more outcomes. If after matching there are still significant differences in important pre-treatment variables, the method may not be valid fordetermin-ing program impacts.
16 The CAS score used was the latest score before the entry to the program for the treatment group. For each control family we chose their CAS record that was closest to the average survey date of the treatment group.
17 This is equivalent to testing whether the control group and the treatment group are statisti-cally equal before the program.
18 Head of the family education level and the zone also appeared with pre-treatment differences.

Evaluating the Chile… / F. Hoces de la Guardia, A. Hojman, O. Larrañaga 143
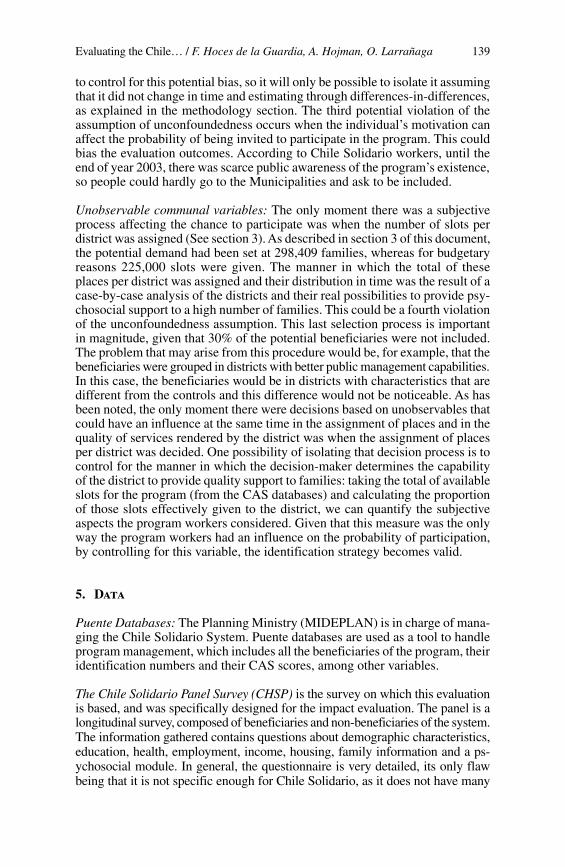
Common Support Assumption: Let S be the set defined for all beneficiary families that have a propensity score close enough19 to the score of at least one control family. There is common support if S is non-void. This second assumption guarantees that the required comparison group exists, i.e. at least a subset of the treated families has a match in the group of non-treated families, where each one of the control group members is a potential candidate for participating in the program. The range of the Propensity Score for which there are treatment and control families is called Common Support and the matching-estimated parameters will only be valid for the on-common support group, not for all the sample.
The principal reason why there is an overlap on the distributions of the propensity scores of both groups (treatment and control) is that the cutoff scores for Chile Solidario were set by district, using criteria that made it possible for two identical families to have different eligibility status.
Taking into account all of the previous precautions the propensity score for the treatment and control group was estimated. The result is presented here in Figure 4:
Methodological Decisions
The identification strategy used to measure the impact of CHS is based on the fact that there are many families that had the same probability (conditioned to a group of variables) of being enrolled in the program; some of them are enrolled and some are not due to external reasons.
Considering the method by which people were enrolled in the program, in order to build up the counterfactual group and to determine the impact on homes participating in the System, the Propensity Score Matching20 method-ology is used. The fundamental assumption of matching is that all the factors relating the treatment assignment to the potential result are observed as in Imbens and Wooldridge (2007). Nearest Neighbour Matching with 4 neigh-bours is being used, following the suggestions given by Imbens (2004). The regression discontinuity approach was also considered, but since the number of observations from Chile Solidario Panel is limited, the estimations were extremely unstable.
19 The definition of what is “close enough” often is a decision that comes up from the empirical work.
20 Despite the fact that the non-beneficiary sample had been originally obtained by matching, those data would not necessarily match with the new control group, due to many reasons, including: the original matching was regionally severely restricted; the variables used in the original p-score matching were CASEN only, in this case however RUTs (IDs) were available in order to use the CAS score; in the original matching no communal variables were used; and finally, in the original matching self report was used to define the condi-tion of the treatment group instead of the administrative records of the program.

Estudios de Economía, Vol. 38 - Nº 1144
a. Parameter to Be Estimated
Inside the Chile Solidario Panel it is possible to estimate program results using the differences-in-differences or cross-sectional approaches. Given the lack of a baseline, both approaches present problems. In order to select the appropriate analysis approach, we will assume that it is possible to divide the program impact into two parts, the impact before the baseline is taken (beginning with the family entering the program to November 2003, when the first survey was conducted) and the impact from November 2003 until November 2006 (date of the last panel round used). If only one cross-section is measured, this will show the final difference between the two groups, relying on matching to assume that both would be identical before the treatment. In the results section it will be shown that this is not necessarily true. If differences-in-differences is used we can only obtain the progress from one point to another in the treatment. This can be interesting, but it strongly depends on the sequence in which the program impacts the beneficiaries. For example, if people greatly improve for a given result at the beginning of the program, but this improvement is partly temporal, the result the differences-in-differences estimation may deliver can be negative, even though the program has a positive effect overall. Whenever possible, both approaches will be used on this paper.
FIGURE 4DISTRIBUTION OF PROPENSITy SCORE FOR TREATMENT AND CONTROL GROUP
Source: Own elaboration using Chile Solidario Panel.
3
2
1
0
0 .2 .4 .6 .8 1x
k density Treated k density Control

Evaluating the Chile… / F. Hoces de la Guardia, A. Hojman, O. Larrañaga 145
b. Grouping the participants and non-participants according to survey date and date of admission to the program
When estimating the program impact it is necessary to clearly determine the definition used for “participating in the program” that is being considered, so that the impacts found can be correctly interpreted, thus enabling policy decision-making. The whole Chile Solidario program contemplates a two-year Puente program, with active psychosocial support and then, a three-year follow up, where people still receives the benefits of preferential access to public programs and the monetary bonus, but the psychosocial support is taken away.
The treatment group that, at the moment of the poll during the year 2006, had been for about four years in the program (cohorts 1 to 10 of the program) will be the group considered in the analysis. Those people surveyed between March 2002 and March 2003 were included in the analysis, since the Chile Solidario Panel rounds are taken in November and a minimum amount of time must take place before the families start to receive the program benefits. Given this definition and the way the CAS databases are grouped, enrolled families included in this evaluation spent an average of 38 months in the program. In order to make the treatment and control groups possible to compare, some proximity was sought between the survey date on the CAS record for the treatment group, with which they entered to the program, and the CAS survey date of the controls. In short, for each control family, the CAS record that is nearest to the average date of the treatment group survey is taken.
c. Definition of Treated
The Puente databases were used for the administrative identification of the treatment group. All beneficiaries enrolled in Chile Solidario are identified by their RUT (ID). These people and their families were excluded as potential controls in this evaluation. However, in order to be included in the treatment group the administrative definition of the program was applied: Treated families were those in which the recipient of the Chile Solidario Bonus lives.
7. Results using the Chile Solidario Panel
In section 7.1 the results in the variables of Chile Solidario Panel are shown, which are also available in CAS records21. The variables on the CAS record are the best available proxy of a baseline. The variables being used here are the amount of people in each family, the labour income and employment. For each of them an average group of results is presented: years 2003 and 2006 of Chile Solidario Panel, which this evaluation is based on; the average in both groups in CAS records 2001 and 2002, in order to show if there are any pre-treatment differences between the groups that are not attributable to the program; the result of CAS groups 2005, because it is comparable to our pre-treatment variables. Then, the CAS 2003 result is presented in order to examine the comparability between PCHS and CAS record variables. In the end, the differences for CAS records are presented between the years 2005 and 2002 and for Chile Solidario
21 They are not totally comparable, because the questions are not identical.

Estudios de Economía, Vol. 38 - Nº 1146
Panel between the years 2006 and 2003. In some cases, when it is possible to sum up the results of a variable without showing the tables, these are omitted to make the presentation shorter. The review of this first group of variables will set the basis to evaluate the credibility of this evaluation: if important pre-treatment differences are found, the results in the variables that are not on CAS record will be, by extension, hardly credible.
In section 7.2 the results in the variables that are not available on CAS records are shown. Among these variables we can find the take-up of subsidies and social programs, and also variables including income by subsidies, such as Extreme poverty and poverty. In these cases only the results for the rounds 2006 and 2003 of Chile Solidario Panel and the differences between both of them are presented
In section 7.3 the results in perception variables are shown, which are only available for the year 2006 in Chile Solidario Panel.
7.1. Variables available on the CAS record
Number of people in the family: This is one of the most important variables for the evaluation, since a lot of the calculated outputs are formulated based on the per capita or family total. As can be seen in the selection of variables for the propensity score (section 6), “Number of People in the Family” is included in the propensity score. However, as is shown in Table 3, this is not enough to ensure there is no pre-treatment impact. Significant impacts can be observed both in the valid22 number of people in the family as in almost every year. However, the differences-in-differences results are not significant, suggesting that the differences were not the result of the program. Due to this persistent difference between the treatment group and the control group, both per capita variables and per family variables may be biased.
TABLE 3
# of people in the family Impact t Mean T Mean C N
CAS 2001 0.162 1.531 4.324 4.163 1368CAS 2002 0.297 2.735 4.303 4.007 1320CAS 2003 0.341 3.454 4.318 3.977 1505CAS 2005 0.480 5.068 4.665 4.185 1698PCHS 2003 0.590 6.106 4.600 4.009 1698PCHS 2006 0.119 1.169 3.511 3.392 1047Dif-Dif PCHS 2006-2003 0.085 0.900 –0.167 –0.252 1320Dif-DifCAS2005-2002 0.110 1.625 –0.065 –0.176 1698
Head of the family employment: Significant pre-treatment differences are ob-served favoring the treatment group. The differences-in-differences estimation
22 The “valid” survey refers to the number of people the family had in their latest CAS record before entering the program, for the case of beneficiaries, and to the people the family had in their CAS record, which is closest to the average date the survey was taken for the treated, in case of controls. This is the number of people used in the Matching.

Evaluating the Chile… / F. Hoces de la Guardia, A. Hojman, O. Larrañaga 147
in the CAS record is significant against the treatment group. While employment for the control group rose by 5% in the period, employment in the treatment group slightly decreased.
Income of the Head of the family: It is possible to estimate the impact on income with greater confidence, since there are no pre-treatment impacts in any of the years. Surprisingly, considering the previous result for employment, a positive and significant effect can be found in the head of the family’s income for the difference in incomes in Chile Solidario Panel.
TABLE 4
Job Income Head of HhId Impact t Mean T Mean C N
CAS 2001 –$ 574 –0.097 $ 68,786 $ 69,360 1239CAS 2002 –$ 2,313 –0.473 $ 66,156 $ 68,469 1132CAS 2003 $ 7,041 1.420 $ 69,787 $ 62,746 1365CAS 2005 –$ 133 –0.031 $ 69,205 $ 69,338 1132PCHS 2003 –$ 8,220 –1.932 $ 50,501 $ 58,721 1698PCHS 2006 $ 2,331 0.581 $ 58,789 $ 56,458 1698Dif-Dif CAS 2005-2002 $ 2,180 0.412 $ 3,049 $ 869 1132Dif-Dif PCHS 2006-2003 $ 10,551 2.390 $ 8,288 –$ 2,263 1698
Number of people employed in the family: There are no pre-treatment impacts, so the number of people employed by family can be estimated with relative con-fidence. Both panels coincide in 2003, which is the only year where significant differences can be found between both groups; however, these differences are not maintained in subsequent years.
Percentage of employed people: There are pre-treatment impacts in all measurements during the first years, so it is not possible to obtain accurate conclusions.
Family Income: While possible to estimate this impact, no significant impacts were found. The most notorious point is the difference between the impact in the years 2003 and 2006 favouring the treated group. However, this difference of $12,325 does not translate into a significant impact.
TABLE 5
Labor Income Impact t Mean T Mean C N
CAS 2001 –$ 3,773 –0.535 $ 94,242 $ 98,015 1285CAS 2002 –$ 12,786 –1.878 $ 90,850 $ 103,637 1143CAS 2003 $ 3,587 0.637 $ 92,685 $ 89,097 1413CAS 2005 –$ 10,768 –1.626 $ 98,194 $ 108,962 1143PCHS 2003 –$ 11,514 –1.860 $ 97,695 $ 109,209 1698PCHS 2006 $ 811 0.117 $ 122,378 $ 121,568 1698Dif-Dif CAS 2005-2002 $ 2,018 0.256 $ 7,344 $ 5,325 1143Dif-Dif PCHS 2006-2003 $ 12,325 1.745 $ 24,683 $ 12,359 1698

Estudios de Economía, Vol. 38 - Nº 1148
Number of working women: There are no pre-treatment impacts and there is a certain effect in year 2003 on the treatment group that disappears with time. This effect leads to a negative differences-in-differences estimate.
Percentage of working women: There are pre-treatment effects for this impact; however, the differences are considerable in year 2003 in the Chile Solidario Panel, while after this period the effects disappear.
CAS Score: There are significant pre-treatment differences. These differences appear to be widening with time, but conclusions at this point cannot be clearly drawn.
7.2. Variables only available in Chile Solidario Panel
Given the results presented in the previous part, the results presented here must be handled with a lot of caution, since it is likely that the initial levels between treatment group and the controls are not identical. This is problematic, because most important variables in the program, such as Extreme Poverty and Poverty are included in this category. In the case of variables related to the take-up of subsidies and social programs, the calculations are based on the percentage of eligible individuals receiving the benefit.
Indigence and Poverty: The same logic is given for both variables. For both va-riables, strong negative impacts can be found within the cross-section. However, it is highly probable that those impacts are due to pre-treatment differences between the treatment group and the controls.
TABLE 6
% in Extreme Poverty Impact t Mean T Mean C N
PCHS 2003 0.115 5.435 0.341 0.226 1698PCHS 2006 0.093 4.610 0.290 0.196 1698Dif-Dif PCHS 2006-2003 –0.022 –0.852 –0.051 –0.029 1698
% in Poverty
PCHS 2003 0.156 6.600 0.730 0.574 1698PCHS 2006 0.185 7.630 0.638 0.453 1698Dif-Dif PCHS 2006-2003 0.029 1.001 –0.092 –0.121 1698
Income through Subsidy: The differences-in-differences result is negative, but it is composed of two positive results for cross section of the treatment group. This is likely due to the fact that people in the treatment group received more subsidies than did the controls during the psychosocial support stage, but that difference disappears once they are out of that stage.
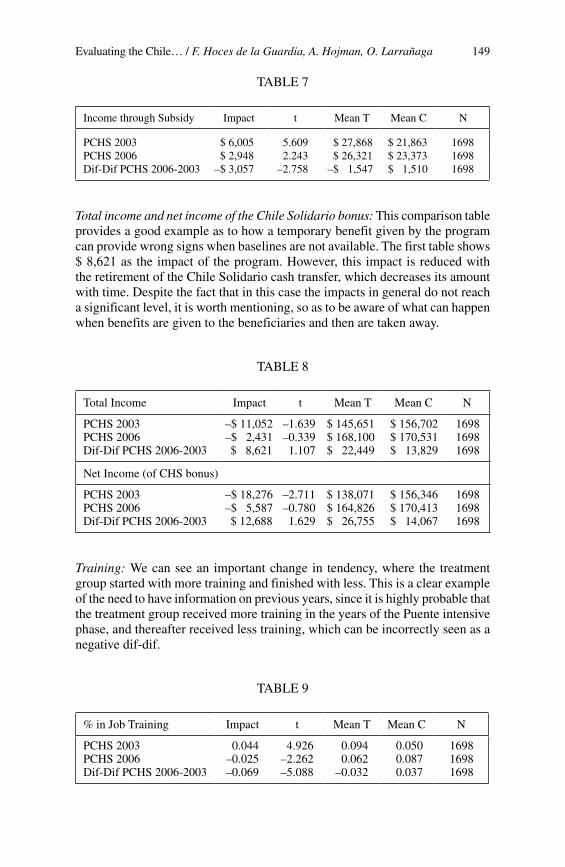
Evaluating the Chile… / F. Hoces de la Guardia, A. Hojman, O. Larrañaga 149
TABLE 7
Income through Subsidy Impact t Mean T Mean C N
PCHS 2003 $ 6,005 5.609 $ 27,868 $ 21,863 1698PCHS 2006 $ 2,948 2.243 $ 26,321 $ 23,373 1698Dif-Dif PCHS 2006-2003 –$ 3,057 –2.758 –$ 1,547 $ 1,510 1698
Total income and net income of the Chile Solidario bonus: This comparison table provides a good example as to how a temporary benefit given by the program can provide wrong signs when baselines are not available. The first table shows $ 8,621 as the impact of the program. However, this impact is reduced with the retirement of the Chile Solidario cash transfer, which decreases its amount with time. Despite the fact that in this case the impacts in general do not reach a significant level, it is worth mentioning, so as to be aware of what can happen when benefits are given to the beneficiaries and then are taken away.
TABLE 8
Total Income Impact t Mean T Mean C N
PCHS 2003 –$ 11,052 –1.639 $ 145,651 $ 156,702 1698PCHS 2006 –$ 2,431 –0.339 $ 168,100 $ 170,531 1698Dif-Dif PCHS 2006-2003 $ 8,621 1.107 $ 22,449 $ 13,829 1698
Net Income (of CHS bonus)
PCHS 2003 –$ 18,276 –2.711 $ 138,071 $ 156,346 1698PCHS 2006 –$ 5,587 –0.780 $ 164,826 $ 170,413 1698Dif-Dif PCHS 2006-2003 $ 12,688 1.629 $ 26,755 $ 14,067 1698
Training: We can see an important change in tendency, where the treatment group started with more training and finished with less. This is a clear example of the need to have information on previous years, since it is highly probable that the treatment group received more training in the years of the Puente intensive phase, and thereafter received less training, which can be incorrectly seen as a negative dif-dif.
TABLE 9
% in Job Training Impact t Mean T Mean C N
PCHS 2003 0.044 4.926 0.094 0.050 1698PCHS 2006 –0.025 –2.262 0.062 0.087 1698Dif-Dif PCHS 2006-2003 –0.069 –5.088 –0.032 0.037 1698
Estudios de Economía, Vol. 38 - Nº 1150
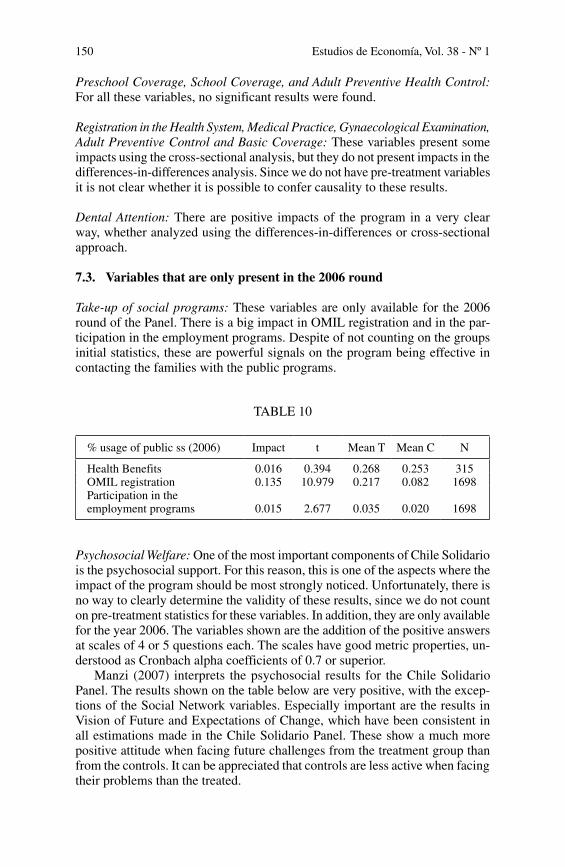
Preschool Coverage, School Coverage, and Adult Preventive Health Control: For all these variables, no significant results were found.
Registration in the Health System, Medical Practice, Gynaecological Examination, Adult Preventive Control and Basic Coverage: These variables present some impacts using the cross-sectional analysis, but they do not present impacts in the differences-in-differences analysis. Since we do not have pre-treatment variables it is not clear whether it is possible to confer causality to these results.
Dental Attention: There are positive impacts of the program in a very clear way, whether analyzed using the differences-in-differences or cross-sectional approach.
7.3. Variables that are only present in the 2006 round
Take-up of social programs: These variables are only available for the 2006 round of the Panel. There is a big impact in OMIL registration and in the par-ticipation in the employment programs. Despite of not counting on the groups initial statistics, these are powerful signals on the program being effective in contacting the families with the public programs.
TABLE 10
% usage of public ss (2006) Impact t Mean T Mean C N
Health Benefits 0.016 0.394 0.268 0.253 315OMIL registration 0.135 10.979 0.217 0.082 1698Participation in theemployment programs 0.015 2.677 0.035 0.020 1698
Psychosocial Welfare: One of the most important components of Chile Solidario is the psychosocial support. For this reason, this is one of the aspects where the impact of the program should be most strongly noticed. Unfortunately, there is no way to clearly determine the validity of these results, since we do not count on pre-treatment statistics for these variables. In addition, they are only available for the year 2006. The variables shown are the addition of the positive answers at scales of 4 or 5 questions each. The scales have good metric properties, un-derstood as Cronbach alpha coefficients of 0.7 or superior.
Manzi (2007) interprets the psychosocial results for the Chile Solidario Panel. The results shown on the table below are very positive, with the excep-tions of the Social Network variables. Especially important are the results in Vision of Future and Expectations of Change, which have been consistent in all estimations made in the Chile Solidario Panel. These show a much more positive attitude when facing future challenges from the treatment group than from the controls. It can be appreciated that controls are less active when facing their problems than the treated.

Evaluating the Chile… / F. Hoces de la Guardia, A. Hojman, O. Larrañaga 151
TABLE 11
Psychosocial Variables (2006) Impact t Mean T Mean C N
Vision of Future 0.116 4.333 2.361 2.245 1729Expectations of Change 0.138 5.540 1.992 1.854 1728Family Network –0.101 –2.851 2.226 2.327 1730Friends Network –0.111 –3.154 1.683 1.794 1729Self-Control (internal) 0.136 4.587 3.601 3.465 1723Self-Control (external) 0.057 1.265 2.920 2.863 1723Efficacy on the Job 0.083 3.258 2.563 2.480 1723Efficacy on the childs school 0.054 3.063 2.810 2.756 1700Mental Health 0.006 0.275 3.075 3.070 1730Self-image 0.121 3.540 4.265 4.144 1728
8. A Possible Solution to the Data Issues: The Administrative Panel Database
As a potential solution for all the issues of the evaluation based on the Chile Solidario Panel, an evaluation based con administrative record was implemented.
An effort was made to gather different sources of administrative informa-tion in order to generate a Panel database made of Administrative records to evaluate the impact of Chile Solidario. Through an individual’s Identification Number, available in each database, different records for the same individual were gathered. The CAS database, the Ficha de Protección Social (FPS) database and the Puente Database are the most important pieces of the Administrative Panel.
Each family’s CAS record information is yearly stored in databases. These databases count on the information of all the records completed by a family and that are still valid by December of the CAS database year in question. As an example, CAS database 2001 contains information of all families completing a CAS record between December 1999 and December 2001.
The Social Protection Record (FPS) replaced the CAS record in 2006. It is a different instrument, aiming to depict the potential families have to generate incomes. From November 2006 until April 2007 a massive poll was carried out at the national level that covered 1,375,041 homes (62.7% of the total polled homes) by May 1, 2007. (See Figure 5).
Thus, information from CAS records between the years 2000 and 2005 were put together and with them, the information from the Social Protection record and information from the Chile Solidario administrative records (Puente Bases). Some concerns about this database are assessed below.
Unit of Analysis: The CAS record considered the family as a reference unit, describing a family as the group of people living together and acknowledging themselves as a family group whether they have a kinship link between them or not, who have the intention of remaining together, and have some kind of monetary income. The definition of “family” for the FPS is similar to that of CAS, only that it specifically states that the group must share a common budget to be considered a family.

Estudios de Economía, Vol. 38 - Nº 1152
Questions Comparability: FPS data are not necessarily equivalent to those of the CAS Record. In particular, some of the questions are different. An example of this is that the CAS record inquired about incomes in only one question, whereas FPS did so in many, trying to identify all possible sources of income. The below table presents comparisons between the value of a group of varia-bles in CAS record 2005 and FPS 2006, so as to show the magnitude of the comparability problems.
Table 13 presents the number of observations (after having left only one observation per family) available on the panel used for the analysis. They are separated in Puente and No Puente depending on whether the family took part in Chile Solidario at some point or not.
Quality of the data and measurement error: As has been mentioned before, the data available is fundamentally used to target subsidies and access to public programs. Due to this reason, it could be expected that the data suffer from strong underreporting, for example, of incomes. On the other hand, the amount of handled data is so high that this type of systematic failure in the dependent variables should be less worrisome. The main variables used in the study (CAS and Program participation) are obtained from administrative sources, so they do not suffer from measurement errors. In general, the main estimations made for this paper are double differences, so any measurement error problem affecting the treatment group should affect the controls in a similar way, thus voiding each other. In the same way, if one of the groups has a different type of measu-
FIGURE 5DATE OF FPS RECORDS
Source: Own elaboration using FPS Conglomerate.
5
4
3
2
1
0
Perc
ent
01nov2006 01feb2007 01may2007 01aug2007 01nov2007 01feb2008
Date

Evaluating the Chile… / F. Hoces de la Guardia, A. Hojman, O. Larrañaga 153
rement error from the other, but the error is constant in time, that error will be eliminated in the differences analysis.
Attrition:On this panel, attrition can arise for reasons that are different from those arising in a normal panel poll (they did not want to participate in the CAS record completion process; they do not have a current valid ID, etc). If a family appears in a CAS database and that family is a Chile Solidario program beneficiary, it is highly probable that this fact has an influence on the likeli-hood that they will appear in the next CAS database, contact with the council administration, minimum condition of having an ID, etc). This phenomenon must be studied, since if this is the case, it could bias the impact estimations of the program. Tests for attrition randomness have been carried out and it seem like there is a correlation between attrition and some observable characteristics, including some related to the participation in Chile Solidario23. It is not possible
23 A first attrition randomness test is to measure whether some of the characteristics of the families (particularly participation in the program) determine the probability that the observation is being lost. In order to avoid the mechanical fulfilment of the relation between the program and the attrition (whoever entered the program in 2004 would have necessarily had to have a valid CAS record for that year), attrition is studied in years 2004 or 2005 explained by variables from the year 2002. The binomial variable indicating whether the family entered Chile Solidario during the first year of the program is significant and negative.
TABLE 12COMPARABILITy BETWEEN CAS 2005 AND FPS
Comparability of Income Between CAS and FPS (2006 pesos)
Family Total CAS 2005 $ 120,124Family Total FPS $ 157,239Family Head CAS 2005 $ 86,673Family Head FPS $ 108,219# workers in the Hhld CAS 2005 0.94#workers in the Hhld FPS 1.13% of Hhld Head with job CAS 2005 0.62% of Hhld Head with job FPS 0.60
TABLE 13OBSERVATIONS IN EACH yEAR FOR CAS AND FPS
year In Puente Not in Puente
2000 78,389 529,6432001 97,271 717,1592002 136,039 1,044,6942003 110,180 727,8602004 104,515 603,0512005 107,672 635,079FPS 102,722 628,600

Estudios de Economía, Vol. 38 - Nº 1154
to quantify the magnitude of this effect without specific work on the subject, which has not been mentioned in this study.
As a consequence of the previous situation, it is necessary to look for a way to control the attrition effects in this panel, which can become very important. Thus, it is necessary to choose a follow up unit that simplifies as much as possible the control of this phenomenon. The analysis units to be followed up in time are the families to which those head of the families reported in CAS 2002 (pre-treatment situation) belong. In this case, during the successive measurements, the anchor taken will be the head of the family and/or his or her spouse. The family or home can be the same over time, or it can be the case that its members have changed. Only the anchor cannot change. In particular, in bi-parental families the anchor will be the woman and in mono-parental families it will be the man or the woman that is the head of the family. This is because in most cases those appointed to receive the bonus are the people within the family, and given the case that the family composition changes, Chile Solidario payments remain with the owner of the bonus. As a consequence, choosing this unit would provide much more stability for the person to be followed in respect to his or her participation in the program. Additionally, this analysis unit is the one that most agrees with the administrative definitions of Chile Solidario.
9. Treated and Control Groups
This evaluation covers those families that entered the program during the first 18 months, separating them into corresponding cohorts of three months each. The following graphic presents the families’ admission pace into the program, as well as the groups that are going to be evaluated (delimited by vertical lines).
These groups were selected because they had spent enough time in the program by 2005. The division into six cohorts was the result of an interest in being able to isolate the effects of different levels of treatment. The controls are chosen, as in the Chile Solidario Panel, in such a way that their mean survey date is similar that of the treatment group. In the below table, we show the most important characteristics of selected groups. The second and the third columns are the months where the cohort entered the program. The fourth and fifth columns are the average date of the survey (CAS record) for the treatment and control groups. Because it was one of the selection criteria for the comparison group, the dates are very similar. The following two columns, which are closely related, are the total time of observation (the time between the first CAS record to the CAS record 2005, which is always the last observation used). The total time of observation is also very similar between the treatment and the control groups, something that wasn’t granted, given the nature of the database. The final column is the total time of treatment for the treatment cohort, which is between 2.4 and 1.4 years.
Another, more important decision that had to be made for the evaluation was whether the families that were not part of the cohort being evaluated, but
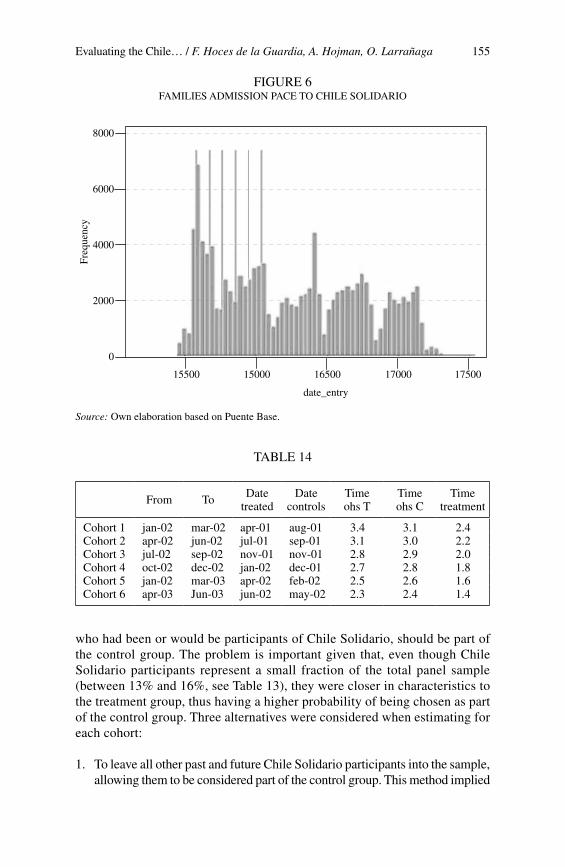
Evaluating the Chile… / F. Hoces de la Guardia, A. Hojman, O. Larrañaga 155
who had been or would be participants of Chile Solidario, should be part of the control group. The problem is important given that, even though Chile Solidario participants represent a small fraction of the total panel sample (between 13% and 16%, see Table 13), they were closer in characteristics to the treatment group, thus having a higher probability of being chosen as part of the control group. Three alternatives were considered when estimating for each cohort:
1. To leave all other past and future Chile Solidario participants into the sample, allowing them to be considered part of the control group. This method implied
FIGURE 6FAMILIES ADMISSION PACE TO CHILE SOLIDARIO
Source: Own elaboration based on Puente Base.
TABLE 14
From To Datetreated
Datecontrols
Timeohs T
Timeohs C
Timetreatment
Cohort 1 jan-02 mar-02 apr-01 aug-01 3.4 3.1 2.4Cohort 2 apr-02 jun-02 jul-01 sep-01 3.1 3.0 2.2Cohort 3 jul-02 sep-02 nov-01 nov-01 2.8 2.9 2.0Cohort 4 oct-02 dec-02 jan-02 dec-01 2.7 2.8 1.8Cohort 5 jan-02 mar-03 apr-02 feb-02 2.5 2.6 1.6Cohort 6 apr-03 Jun-03 jun-02 may-02 2.3 2.4 1.4
8000
6000
4000
2000
0
15500 15000 16500 17000 17500
date_entry
Freq
uenc
y

Estudios de Economía, Vol. 38 - Nº 1156
an important underestimation of the impacts of the program, as there were an important proportion of families on the control group (after matching) that participated in the program during the evaluation period. The table below shows, for each cohort, the percentage of the controls (after having been chosen by matching and weighted for their participation using the nearest neighbor estimation) that participated in Chile Solidario at any time during the period of this evaluation. It also shows the mean time of treatment for the treatment group on each cohort (naturally, decreasing with the cohort); the mean time of treatment for all controls; and the time of treatment for the controls that were part of Chile Solidario. It can be seen that, on average, a control group family had around a third of the mean time of intervention of a treated family. The Chile Solidario families on the control group, however, have almost the same time of intervention as the treated families.
TABLE 15
% CHScontrol
TimeTreat T
TimeTreat Cont
Time TreatCHS Cont
Cohort 1 39% 878 226 587Cohort 2 37% 816 207 559Cohort 3 38% 738 224 586Cohort 4 39% 653 226 586Cohort 5 37% 577 222 597Cohort 6 37% 494 220 592
2. To take all other past and future Chile Solidario participants out of the sample, thus denying the possibility for them to be included in the control group. This alternative seemed the most obvious. However, if this were done, we would have strongly biased the control group. The matching occurs before the treatment. However, for the next cohorts, their entrance into the program occurs after the matching, and is likely not to happen randomly. Chile Solidario is targeted to the poorest people. It is probable that the worst-performing controls after the matching will end up entering the program, so we would have underestimated the impact of the program by introducing ex-post selection bias on the control group. There is no way to correct this problem, after people have been taken out of the sample.
3. The standard correction for substitution and dropout bias when the treatment status is binary is widely known, as explained in Heckman, LaLonde and Smith (1999) or in Heckman et al. (2000). It suggests carrying out the usual estimation of the parameter, as the average of all the treatment group (in-cluding individuals dropping out) less the average of all the control group (including individuals taking substitute training), but then scaling up the result for the inverse of the difference in probability of participation. This is the same correction that is generally used in instrumental variables or in fuzzy regression discontinuity.

Evaluating the Chile… / F. Hoces de la Guardia, A. Hojman, O. Larrañaga 157
However, in Chile Solidario the treatment is not binary; in any given date there are very different periods of exposure to the program across the bene-ficiaries. The correction we propose (and the estimation method we finally chose) is a very simple extension to that technique:
φ =−−
Y Y
T T
T
T c
T c
T
Where ϕ is the impact of the program, YT – Yc is the usual estimator for mat-ching, once the control and treatment groups have been selected. TT is the average treatment time in the treated group and Tc is the average treatment time in the control group. In practice, the estimator rescales the estimated impact, accounting for the fact that the difference between the means of the groups is due to just a subgroup, that are the families whose matches are not participating on the program. This way, we don’t have to introduce selection bias and we are able to estimate even while having different individuals in the control group both participating and not participating on the program24. The necessary assumptions for this estimator, besides the standard assumptions for matching, are that the potential outcomes of the group taking substitute training are equal to the outcomes for the treatment group. The condition is trivially accomplished here, as the program they are taking is the same.
The decisions taken in this section are implemented in the results section, where the estimated impacts of the program are presented.
10. Results Using the Administrative Panel Database
In this section, the results are presented in two ways, graphically and grouped in tables. The same cohorts explained before are used as treatment groups.
On one hand, they are all represented in graphs by series, all referring to the variable that gives name to the graph. The x-axis has the different measure-ments across the time, from the CAS record of 2000 to the FPS 2006. All the graphs show on the y-axis the impacts for each year –that is, the differences between treatment and control families- from the pretreatment years, where it is interesting to check the quality of the matching, to the later years, where the impacts of the program should be found. The cohorts are named by the family’s month of entry into the program.
24 The analytic distribution in not known for this estimator, and it is not clear if bootstrap is a valid method when using matching, so we rely on the same standard errors as before, but amplifying the t-test and the impact for the factor mentioned.

Estudios de Economía, Vol. 38 - Nº 1158
On the other hand, the exact numeric results are shown in tables, in particu-lar, two results are shown: the pre-treatment differences-in-differences and the post-treatment differences-in-differences. The first is presented as a check that the matching is good enough on that variable, the latter, to estimate the effects of the program. To ensure objectivity, the following sequence is followed in the commentaries: If there are negative and significant effects pre-treatment, the result is only highlighted if it’s positive and significant. If there are positive and significant effects pre-treatment, the result is only highlighted if it’s negative and significant. Finally, if there aren’t pre-treatment effects, the result is highlighted whenever it’s significant.
A total of eight variables are analyzed: CAS score, three labor income variables (income of the head of family, income per capita and total family income), three employment variables (employment of the head of family, number of workers in the family and percent of workers in the family) and number of people in the family, which is analyzed because most other results depend on this variable.
The tables show the estimated impact and the t-test (both already multiplied by the scaling factor), the factor itself, the mean of the 2005-2002 difference for the treated group, and the same mean for the control group. The number of treated families and the (non-weighted) number of control families are also reported.
10.1. Labor income of the head of the family
TABLE 16
Family Head Labor Income Impact t Factor Mean T Mean C NC NT
Jan-Mar 2002 DD_PreTreatment $ 1,602 1.72 1.35 –$ 4,504 –$ 5,687 10573 3012
DD $ 2,385 1.92 1.35 $ 5,592 $ 3,831 10573 3012
Apr-Jul 2002 DD_PreTreatment –$ 1,551 –1.99 1.35 –$ 6,624 –$ 5,475 16070 4904DD –$ 384 –0.46 1.35 $ 3,421 $ 3,705 16070 4904
Jul-Sep 2002 DD_PreTreatment –$ 1,670 –1.33 1.44 –$ 7,498 –$ 6,338 9983 2756DD $ 3,385 2.95 1.44 $ 5,916 $ 3,565 9983 2756
Oct-Dec 2002 DD_PreTreatment –$ 4,671 –3.19 1.53 –$ 8,344 –$ 5,290 9486 2587DD $ 3,053 2.92 1.53 $ 4,746 $ 2,750 9486 2587
Jan-Mar 2003 DD_PreTreatment –$ 1,204 –1.10 1.64 –$ 6,249 –$ 5,515 11109 3058DD –$ 2,724 –2.60 1.64 $ 1,336 $ 2,998 11109 3058
Apr-Jun 2003 DD_PreTreatment $ 2,077 2.09 1.86 –$ 5,301 –$ 6,420 12331 3442DD –$ 3,962 –3.99 1.86 $ 691 $ 2,825 12331 3442
There is a pattern in the results; we obtain negative results for the two less-treated cohorts, while obtaining positive results for the previous two. The multiplying factor has a key role here, permitting two of the results to become significant.
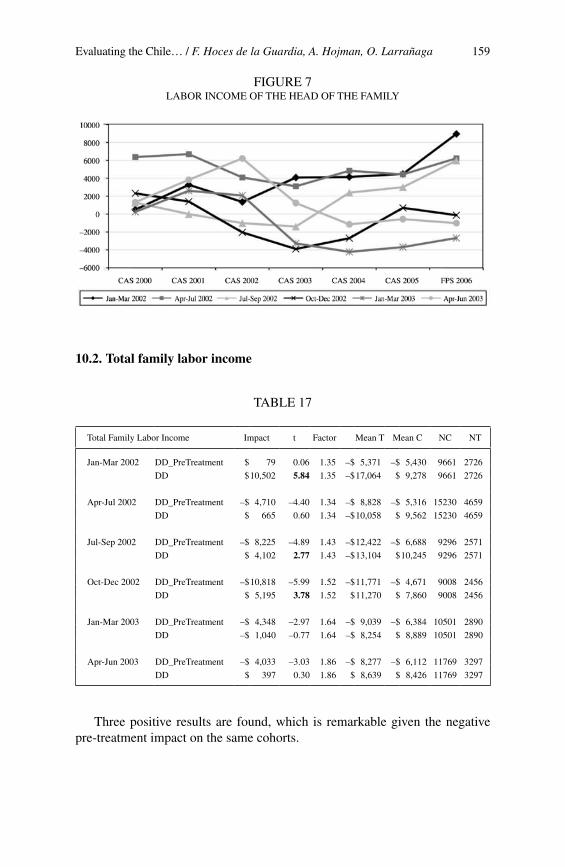
Evaluating the Chile… / F. Hoces de la Guardia, A. Hojman, O. Larrañaga 159
FIGURE 7LABOR INCOME OF THE HEAD OF THE FAMILy
10.2. Total family labor income
TABLE 17
Total Family Labor Income Impact t Factor Mean T Mean C NC NT
Jan-Mar 2002 DD_PreTreatment $ 79 0.06 1.35 –$ 5,371 –$ 5,430 9661 2726
DD $ 10,502 5.84 1.35 –$ 17,064 $ 9,278 9661 2726
Apr-Jul 2002 DD_PreTreatment –$ 4,710 –4.40 1.34 –$ 8,828 –$ 5,316 15230 4659
DD $ 665 0.60 1.34 –$ 10,058 $ 9,562 15230 4659
Jul-Sep 2002 DD_PreTreatment –$ 8,225 –4.89 1.43 –$ 12,422 –$ 6,688 9296 2571
DD $ 4,102 2.77 1.43 –$ 13,104 $ 10,245 9296 2571
Oct-Dec 2002 DD_PreTreatment –$ 10,818 –5.99 1.52 –$ 11,771 –$ 4,671 9008 2456
DD $ 5,195 3.78 1.52 $11,270 $ 7,860 9008 2456
Jan-Mar 2003 DD_PreTreatment –$ 4,348 –2.97 1.64 –$ 9,039 –$ 6,384 10501 2890
DD –$ 1,040 –0.77 1.64 –$ 8,254 $ 8,889 10501 2890
Apr-Jun 2003 DD_PreTreatment –$ 4,033 –3.03 1.86 –$ 8,277 –$ 6,112 11769 3297
DD $ 397 0.30 1.86 $ 8,639 $ 8,426 11769 3297
Three positive results are found, which is remarkable given the negative pre-treatment impact on the same cohorts.
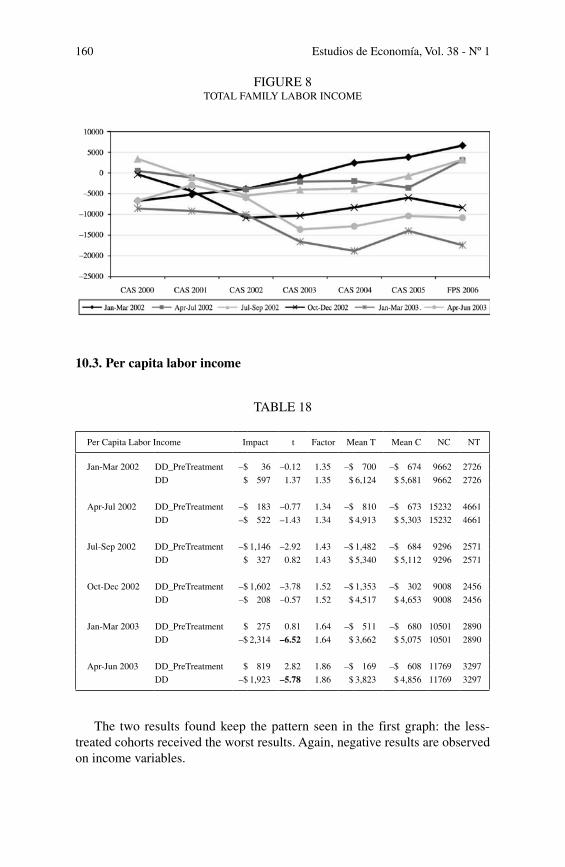
Estudios de Economía, Vol. 38 - Nº 1160
FIGURE 8TOTAL FAMILy LABOR INCOME
10.3. Per capita labor income
TABLE 18
Per Capita Labor Income Impact t Factor Mean T Mean C NC NT
Jan-Mar 2002 DD_PreTreatment –$ 36 –0.12 1.35 –$ 700 –$ 674 9662 2726
DD $ 597 1.37 1.35 $ 6,124 $ 5,681 9662 2726
Apr-Jul 2002 DD_PreTreatment –$ 183 –0.77 1.34 –$ 810 –$ 673 15232 4661
DD –$ 522 –1.43 1.34 $ 4,913 $ 5,303 15232 4661
Jul-Sep 2002 DD_PreTreatment –$ 1,146 –2.92 1.43 –$ 1,482 –$ 684 9296 2571
DD $ 327 0.82 1.43 $ 5,340 $ 5,112 9296 2571
Oct-Dec 2002 DD_PreTreatment –$ 1,602 –3.78 1.52 –$ 1,353 –$ 302 9008 2456
DD –$ 208 –0.57 1.52 $ 4,517 $ 4,653 9008 2456
Jan-Mar 2003 DD_PreTreatment $ 275 0.81 1.64 –$ 511 –$ 680 10501 2890
DD –$ 2,314 –6.52 1.64 $ 3,662 $ 5,075 10501 2890
Apr-Jun 2003 DD_PreTreatment $ 819 2.82 1.86 –$ 169 –$ 608 11769 3297
DD –$ 1,923 –5.78 1.86 $ 3,823 $ 4,856 11769 3297
The two results found keep the pattern seen in the first graph: the less-treated cohorts received the worst results. Again, negative results are observed on income variables.
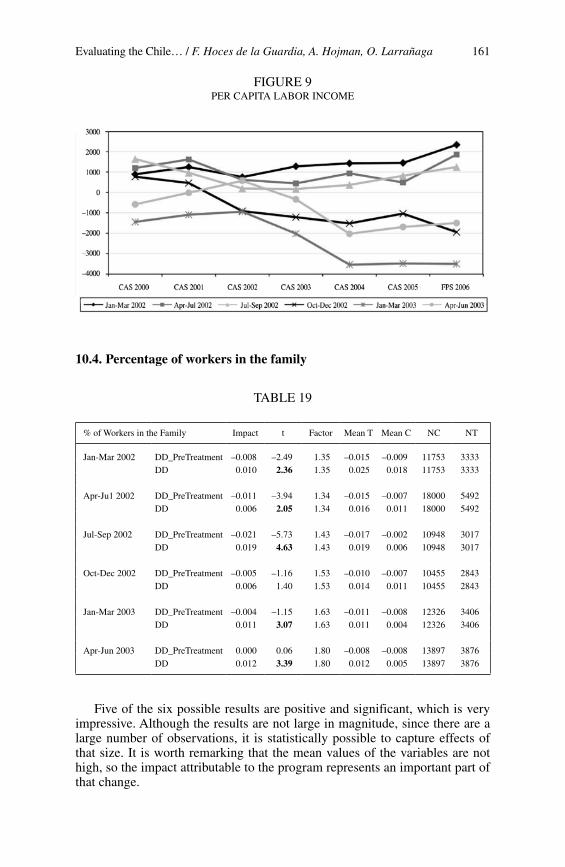
Evaluating the Chile… / F. Hoces de la Guardia, A. Hojman, O. Larrañaga 161
FIGURE 9PER CAPITA LABOR INCOME
10.4. Percentage of workers in the family
TABLE 19
% of Workers in the Family Impact t Factor Mean T Mean C NC NT
Jan-Mar 2002 DD_PreTreatment –0.008 –2.49 1.35 –0.015 –0.009 11753 3333DD 0.010 2.36 1.35 0.025 0.018 11753 3333
Apr-Ju1 2002 DD_PreTreatment –0.011 –3.94 1.34 –0.015 –0.007 18000 5492DD 0.006 2.05 1.34 0.016 0.011 18000 5492
Jul-Sep 2002 DD_PreTreatment –0.021 –5.73 1.43 –0.017 –0.002 10948 3017DD 0.019 4.63 1.43 0.019 0.006 10948 3017
Oct-Dec 2002 DD_PreTreatment –0.005 –1.16 1.53 –0.010 –0.007 10455 2843DD 0.006 1.40 1.53 0.014 0.011 10455 2843
Jan-Mar 2003 DD_PreTreatment –0.004 –1.15 1.63 –0.011 –0.008 12326 3406DD 0.011 3.07 1.63 0.011 0.004 12326 3406
Apr-Jun 2003 DD_PreTreatment 0.000 0.06 1.80 –0.008 –0.008 13897 3876DD 0.012 3.39 1.80 0.012 0.005 13897 3876
Five of the six possible results are positive and significant, which is very impressive. Although the results are not large in magnitude, since there are a large number of observations, it is statistically possible to capture effects of that size. It is worth remarking that the mean values of the variables are not high, so the impact attributable to the program represents an important part of that change.

Estudios de Economía, Vol. 38 - Nº 1162
FIGURE 10PERCENTAGE OF WORKERS IN THE FAMILy
10.5. Number of workers in the family
TABLE 20
Number of Workers in the Family Impact t Factor Mean T Mean C NC NT
Jan-Mar 2002 DD_PreTreatment –0.043 –3.63 1.35 – 0.047 – 0.016 11753 3333
DD 0.113 7.89 1.35 0.077 – 0.007 11753 3333
Apr-Jul 2002 DD_PreTreatment –0.063 –6.20 1.34 – 0.060 – 0.013 18000 5492
DD 0.087 7.79 1.34 0.040 – 0.025 18000 5492
Jul-Sep 2002 DD_PreTreatment –0.085 –6.09 1.43 – 0.074 – 0.014 10948 3017
DD 0.097 6.78 1.43 0.055 – 0.013 10948 3017
Oct-Dec 2002 DD_PreTreatment –0.060 –4.09 1.53 – 0.064 – 0.024 10455 2843
DD 0.094 6.41 1.53 0.053 – 0.008 10455 2843
Jan-Mar 2003 DD_PreTreatment –0.058 –4.25 1.63 – 0.057 – 0.021 12326 3406
DD 0.096 7.26 1.63 0.028 – 0.031 12326 3406
Apr-Jun 2003 DD_PreTreatment –0.064 –5.17 1.80 – 0.056 – 0.020 13897 3876
DD 0.095 7.79 1.80 0.030 – 0.023 13897 3876
This presents the most important evidence as to the effects of the program. Not only are all the results positive, but also all had pre-treatment negative effects. The evidence is very strong in this case, and consistent with the women-oriented Chile Solidario policies.

Evaluating the Chile… / F. Hoces de la Guardia, A. Hojman, O. Larrañaga 163
FIGURE 11NUMBER OF WORKERS IN THE FAMILy
10.6. CAS score
TABLE 21
CAS Score Impact t Factor Mean T Mean C NC NT
Jan-Mar2002 DD_PreTreatment 1.558 2.91 1.35 – 7.092 – 8.249 11753 3333
DD 7.795 11.37 1.35 28.542 22.753 11753 3333
Apr-Jul2002 DD_PreTreatment 0.159 0.35 1.34 – 8.365 – 8.484 18000 5492
DD 2.908 5.49 1.34 25.300 23.130 18000 5492
Jul-Sep2002 DD_PreTreatment –2.571 –4.26 1.43 – 9.428 – 7.636 10948 3017
DD 1.845 2.76 1.43 23.008 21.722 10948 3017
Oct-Dec2002 DD_PreTreatment 0.519 0.84 1.53 – 7.808 – 8.147 10455 2843
DD –0.599 –0.93 1.53 20.051 20.443 10455 2843
Jan-Mar2003 DD_PreTreatment –2.640 –4.47 1.63 – 8.962 – 7.338 12326 3406
DD –1.991 –3.26 1.63 18.817 20.042 12326 3406
Apr-Jun2003 DD_PreTreatment –0.880 –1.64 1.80 – 8.445 – 7.956 13897 3876
DD –2.992 –5.33 1.80 17.309 18.970 13897 3876
A reiterative pattern is present here, with the cohorts around the middle obtaining the most positive impacts and the less-treated cohorts the worst. Nevertheless, the magnitudes of the impacts are very small.
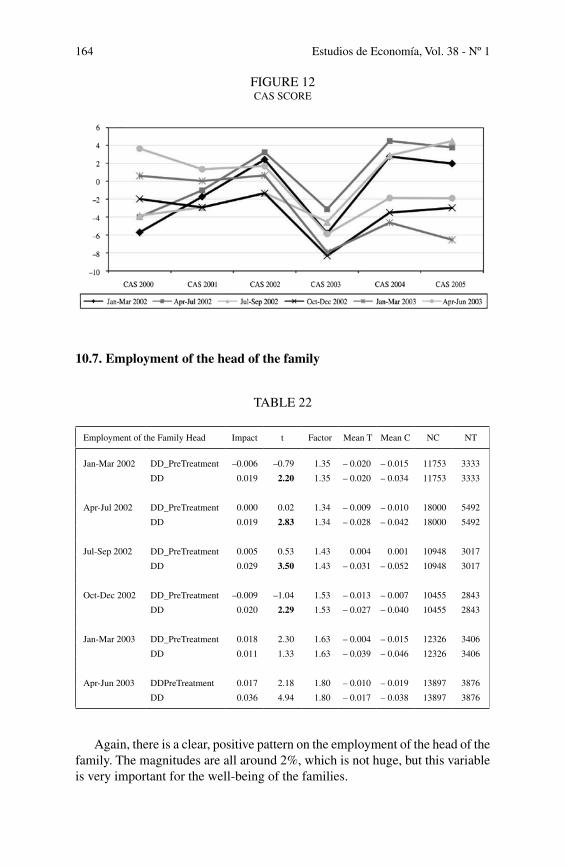
Estudios de Economía, Vol. 38 - Nº 1164
FIGURE 12CAS SCORE
10.7. Employment of the head of the family
TABLE 22
Employment of the Family Head Impact t Factor Mean T Mean C NC NT
Jan-Mar 2002 DD_PreTreatment –0.006 –0.79 1.35 – 0.020 – 0.015 11753 3333
DD 0.019 2.20 1.35 – 0.020 – 0.034 11753 3333
Apr-Jul 2002 DD_PreTreatment 0.000 0.02 1.34 – 0.009 – 0.010 18000 5492
DD 0.019 2.83 1.34 – 0.028 – 0.042 18000 5492
Jul-Sep 2002 DD_PreTreatment 0.005 0.53 1.43 0.004 0.001 10948 3017
DD 0.029 3.50 1.43 – 0.031 – 0.052 10948 3017
Oct-Dec 2002 DD_PreTreatment –0.009 –1.04 1.53 – 0.013 – 0.007 10455 2843
DD 0.020 2.29 1.53 – 0.027 – 0.040 10455 2843
Jan-Mar 2003 DD_PreTreatment 0.018 2.30 1.63 – 0.004 – 0.015 12326 3406
DD 0.011 1.33 1.63 – 0.039 – 0.046 12326 3406
Apr-Jun 2003 DDPreTreatment 0.017 2.18 1.80 – 0.010 – 0.019 13897 3876
DD 0.036 4.94 1.80 – 0.017 – 0.038 13897 3876
Again, there is a clear, positive pattern on the employment of the head of the family. The magnitudes are all around 2%, which is not huge, but this variable is very important for the well-being of the families.

Evaluating the Chile… / F. Hoces de la Guardia, A. Hojman, O. Larrañaga 165
FIGURE 13EMPLOyMENT OF THE HEAD OF THE FAMILy
10.8. Number of people in the family
TABLE 23
Number of People in the Family Impact t Factor mean T mean C NC NT
Jan-Mar 2002 DD_PreTreatment –0.022 –0.92 1.35 0.022 0.038 11753 3333DD 0.368 13.31 1.35 – 0.089 – 0.362 11753 3333
Apr-Jul 2002 DD_PreTreatment –0.106 –4.98 1.34 – 0.053 0.026 18000 5492DD 0.266 11.90 1.34 – 0.127 – 0.325 18000 5492
Jul-Sep 2002 DD_PreTreatment –0.087 –2.92 1.43 – 0.086 – 0.025 10948 3017DD 0.215 7.88 1.43 – 0.083 – 0.232 10948 3017
Oct-Dec 2002 DD_PreTreatment –0.170 –5.34 1.53 – 0.125 – 0.013 10455 2843DD 0.241 8.87 1.53 – 0.083 – 0.240 10455 2843
Jan-Mar 2003 DD_PreTreatment –0.153 –5.41 1.63 – 0.098 – 0.004 12326 3406DD 0.219 8.79 1.63 – 0.106 – 0.241 12326 3406
Apr-Jun 2003 DD_PreTreatment –0.207 –7.54 1.80 – 0.114 0.001 13897 3876DD 0.281 12.22 1.80 – 0.092 – 0.248 13897 3876
This is the clearest pattern of all, and the reason for this phenomenon is not clear. Possible hypotheses include people moving in with their close families or friends, to get the benefits of the program. Given these results, it is neces-sary to be very careful with the interpretation of the previous results, especially with the total labor income of the family or the number of workers, which will tend to be overestimated- and with the per capita variables, which will tend to be underestimated.

Estudios de Economía, Vol. 38 - Nº 1166
FIGURE 14NUMBER OF PEOPLE IN THE FAMILy
11. Conclusions
The Impact Evaluation of Chile Solidario is a pioneer initiative in Chile to perform a follow-up over time of the families that benefitted and families that did not benefit from the system. The lessons learned in this process of more than four years of investigation provide knowledge that is unique in Chile about the design and evaluation of future public policies. In spite of this, there are a number of serious problems coming from a careful analysis of the data that cause the results to be less reliable than might be deemed necessary for making future policy decisions. One problem was that the Chile Solidario Panel sample did not have an adequate sample selection, nor was it transparent enough, which is evident in the difficulty in creating an adequate control group. In addition, the unit to be followed through time was never formally established. The at-trition rate up to 2004 was not documented and no measures to reduce it had been taken. Through all the rounds there were serious problems in obtaining beneficiary IDs. With respect to the original sample design, serious mistakes were made when choosing the controls. Finally, and most importantly, it was not possible to count with a baseline.
In this work, an analysis of the feasibility of carrying out an impact evalua-tion for the Chile Solidario program was made. The process by which slots by district are assigned and the mechanism by which families are taking the slots in the program has been fully described. Both aspects are essential to achiev-ing a valid identification strategy. The group of variables that appear to have an influence in the participation in the system have been described, and the possibility of carrying out an impact evaluation by Matching was discussed. Using this group of variables in the propensity score, the quality of the match-ing was tested on pre-treatment variables. The Chile Solidario Panel was put to the test, estimating the impacts on a group of variables for which there is pre-treatment information. The results are not very encouraging, since there are many variables showing pre-treatment differences between the treatment and control groups. It is probable that previous Chile Solidario impact studies
Evaluating the Chile… / F. Hoces de la Guardia, A. Hojman, O. Larrañaga 167
that did not use administrative variables had strong pre-treatment differences between the treatment group and the control group before the first participants entered the program. As a result of these problems, the results obtained in this evaluation should be qualified as not conclusive.
From a total of 10 related variables related to employment and income –the only ones allowing a comparison with pre-treatment CAS variables– four are not possible to estimate, because of large pre-treatment differences. The results for the income variables are not very illustrative, since the variable for the number of people in the family is unbalanced. The variables for the number of employed people in the family, the number of working women, and the percentage of work-ing women have negative or zero impact using the differences-in-differences approach. Head of the family employment has, instead, positive differences-in-differences results.
Among variables without baseline, in terms of indigence and poverty we observed strongly negative impacts in the cross-sectional analysis. However, the impact when using differences-in-differences is zero; it is highly probable that this is due to differences in the pre-treatment situation of the groups. In the psychosocial area and recruitment to public offerings there is an important group of variables for which cross-sectional impacts are found, but these same impacts are not found in differences-in-differences. It is likely that these impacts are real, but in a strict sense there is no way to distinguish if the groups had these differences prior to the process or if they are the result of the program. Inside this group are the expectations of change, employment registration and vision of future variables, for example. Finally, take-up of post-natal care and dental examinations do have differences-in-differences impacts.
In order to solve the main problems of the Chile Solidario Panel, an Administrative Panel Database was generated, using over 800,000 registries per year, across seven years. This database had, however, some problems, such as selective attrition and measurement error. One of the most important problems was the big proportion of families on the control group enrolling in Chile Solidario. A simple extension of the standard correction for substitution programs was adopted, and the impacts were estimated.
There are a number of positive significant effects, which are especially robust on the employment variables. Even though the magnitudes are not huge, achieving impacts on important variables such as employment of the head of the family may make substantial changes in the quality of life for those fami-lies. These results are much more robust than those obtained from the Chile Solidario Panel.
The overall lesson of this evaluation for future social programs is clear: evaluation and management of the program should go hand in hand from the moment the program is being designed. In this sense, generalizing the usage of independent evaluations and professionally evaluated pilot programs is highly recommended. This may be the only way to rectify in forthcoming evaluations most of the difficulties faced by the evaluation of the Chile Solidario program. All large-scale public programs should follow this trend, improving every time the way in which the evaluations are planned and organized.

Estudios de Economía, Vol. 38 - Nº 1168
12. References
Abadie, A. and G. Imbens (2006). “Large Sample Properties of Matching Estimators for Average Treatment Effects”, Econometrica.
Blundell, R. and M. Costa Dias (2002). “Alternative Approaches to Evaluation In Empirical Microeconomics”. Working Paper, CENMAP.
Carneiro, P. and E. Galasso (2007). “Lessons from the evaluation of Chile Solidario”. World Bank.
Dehejia, R. and S. Wahba (1998). “Causal Effects in Non-Experimental Studies: Re-Evaluating the Evaluation of Training Programs”, The Review of Economics and Statistics.
Galasso, E. (2006). “With their effort and an opportunity”. World Bank.Heckman, J., N. Hohmann, J. Smith and M. Khoo (2000) “Substitution And
Dropout Bias in Social Experiments: A Study of an Influential Social Experiment”.
Heckman, J., H. Ichimura and P. Todd (1997). “Matching as an econometric evaluation estimator: Evidence from evaluating a job training program-me”, Review of Economic Studies, 64, 605-654.
Heckman, J., R. LaLonde and J. Smith (1999). “The economics and econometrics of active labor market programs”. In: Handbook of Labor Economics.
Hoces de la Guardia, F., A. Hojman (2007). “Revisión al Diseño de las Muestras en las rondas del Panel Chile Solidario”.
Imbens, G. (2007). “Estimation of Average Treatment Effects Under Unconfoundedness”, In: Imbens & Wooldridge, What’s new in econo-metrics, Lecture Notes 1, Summer 2007.
Imbens, G. (2004). “Nonparametric Estimation of Average Treatment Effects Under Exogeneity, a Review”, The Review of Economics and Statistics.
Imbens, G. (2004). Implementing Matching Estimators for Average Treatment Effects in STATA, STATA Journal.
LaLonde, R. (1986). “Evaluating The Econometric Evaluation of Training Programs with Experimental Data”, American Economic Review.
Manzi, J. y R. González (2007). “Evaluación de Impacto de Chile Solidario, Documento Nº 1: Apoyo Psicosocial”; División Social, MIDEPLAN.
Perticará, M. (2006). “Aplicación y toma de encuestas a hogares beneficiarios y controles del Sistema de Protección Social Chile Solidario: Análisis Cuantitativo de Impacto”.
Rosenbaum, P. R. and D.B. Rubin (1983). “The central role of the propensity score in observational studies for causal effects”, Biometrika, 70, 41-55.
Secretaría Ejecutiva Chile Solidario, Ministerio de Planificación (2003). “Selección de las familias beneficiarias final”.
Secretaría Ejecutiva de Chile Solidario, Ministerio de Planificación “Cobertura de Chile Solidario por Región 2002-2005 Final”. Archivo Excel.
Ministerio de Planificación (2006). “Cuaderno de Información Nº 1: La crea-ción del Sistema de Protección Social Chile Solidario: Debate Previo y Propuesta”.
Secretaría Ejecutiva de Chile Solidario, Ministerio de Planificación (2006). “Cuadernos de Información Nº 2”.
Secretaría Ejecutiva Chile Solidario, Ministerio de Planificación. “Selección de las familias beneficiarias final”.